Abstract
The transformation of the transportation sector is critical for achieving Sustainable Development Goal 7 (SDG 7). As the world’s largest auto market, China has implemented various policies to promote sustainable transportation, particularly through the adoption of new energy vehicles (NEVs), thereby increasing the share of renewables in energy consumption and improving energy efficiency. Among these policies, the NEV driving restrictions exemption (NEV-DRE) policy has emerged as a key non-financial incentive to stimulate NEV demand. This study focuses on how the NEV-DRE policy affects the demand side of NEVs in the transportation sector. Employing a difference-in-differences design on a comprehensive dataset of vehicle transactions across 82 prefecture-level pilot cities from 2011 to 2019, this study provides robust causal evidence that the NEV-DRE policy significantly increases NEV sales. Furthermore, this study finds that this growth in demand is primarily driven by an increased consumer preference for domestic pure electric sedans. The policy proves more effective in cities with general driving restrictions, purchasing restrictions, and greater environmental awareness. Our findings demonstrate how innovative traffic management measures can be transformed into effective industrial policy tools, accelerating the adoption of renewable energy in the transportation sector. This study offers valuable insights for policymakers in China and elsewhere on how to design non-financial incentives to promote sustainable transportation, thereby promoting sustainable energy transitions and contributing to the achievement of SDG 7.
1. Introduction
Achieving Sustainable Development Goal 7 (SDG 7), which aims to ensure access to affordable, reliable, and sustainable modern energy for all, requires improved energy efficiency and a transition to clean and renewable energy. The transportation sector, which is a major consumer of fossil fuels and a critical contributor to greenhouse gas emissions, plays an important role in this global effort, making its energy transformation essential. As the world’s largest producer and consumer of automobiles since 2009, China holds considerable influence over global energy sustainability and climate outcomes. The domination of ICEVs in China has led to growing demand for gasoline and diesel. This trend intensifies pressure on global energy supplies [1] and contributes significantly to air pollution and greenhouse gas emissions [2,3,4,5,6], posing severe challenges to China’s Carbon Peaking and Carbon Neutrality Goals and global sustainability goals. Therefore, an urgent transition toward fuel-efficient and new energy vehicles is required in the automotive industry to enhance energy security and ultimately fulfil the objectives of SDG 7. Crucially, this shift depends on consumer demand for sustainable vehicles, as market preferences play a vital role in shaping production trends and determining the pace of sustainable transport adoption.
To advance the energy transformation in the transportation sector and accelerate the transition to sustainable transport aligned with SDG 7, new energy vehicles (NEVs) have emerged as a critical pathway to enhance energy security and address environmental concerns [7,8,9]. China has established a comprehensive policy framework both from the supply and demand sides since 2001. Supply-side policies, such as research and development subsidies, tax incentives, and low-interest loans, have effectively lowered the costs and risks of NEV production, simultaneously encouraging firms to innovate and upgrade their products [10,11]. Meanwhile, demand-side policies, including purchase subsidies, purchase tax exemptions, and non-financial policies, have significantly enhanced the cost competitiveness of NEVs [12,13] and stimulated consumer demand [14,15,16,17,18,19]. This has created a favorable market environment for NEV manufacturers to pursue innovation and development. However, the persistent expansion of demand-side subsidy programs has imposed growing fiscal burdens on governments. To mitigate this quandary, China introduced a subsidy phase-out mechanism in 2013. Following the widespread exposure of subsidy fraud incidents in 2015, the government has accelerated the subsidy reduction since 2016, proposing to completely phaseout subsidies by 2022. Consequently, alternative non-financial policies are needed to continue supporting market growth. Unlike infrastructure investments that require substantial long-term capital commitment and take time to show results, the NEV-DRE policy is relatively straightforward to implement. More importantly, unlike other regulatory policies that only target a single segment, it creates a sustained incentive through regulatory asymmetry between ICEVs and NEVs, directly influencing consumer choices and accelerating green transformation on the demand side. Among these policies, the NEV driving restrictions exemption (NEV-DRE) policy has been considered an effective measures to replace subsidies [20,21,22,23] to stimulate NEV demand, thereby advancing renewable energy adoption and energy efficiency in the transport sector.
The driving restriction is an urban traffic management instrument, which restricts vehicles based on license plate numbers or in specified periods, aiming to achieve congestion alleviation, air quality enhancement, and reduction of motor vehicle pollutants. In China, Beijing was the first city to implement the driving restriction policy. In 2007, it introduced the “Odd–Even License Plate Rule” in preparation for the Olympic Games, with the purpose of realizing its bid commitment to reduce vehicular emissions by 60% during the event. Due to its initial success [24,25], the policy was maintained after 2008 and later adopted by other major cities in China. As a result, the driving restriction has not only significantly alleviated traffic congestion [26] but also contributed to measurable improvements in air quality [27,28].
The NEV-DRE policy is a strategic integration of China’s NEV promotion policies with existing traffic management tools. This policy evolution was initiated in 2011 through the Energy-Saving and New Energy Vehicle Demonstration and Promotion Notice, a document that established preferential treatment for NEVs, including exemption from both driving and purchasing restrictions. Building on this foundation, the principle of “no restrictions on driving or purchasing” has been stated in several official documents since 2014, while restrictions that were already implemented have been abolished, ensuring unobstructed right-of-way privileges for NEVs. By transforming driving restrictions from a congestion mitigation tool to an instrument of sustainable transportation transition, the NEV-DRE policy creates a regulatory asymmetry between ICEVs and NEVs. It grants NEVs priority access privileges such as exemptions from driving restrictions and vehicle purchase quotas, thereby effectively reduces the marginal benefits of ICEVs [29], enhancing the relative market competitiveness for NEVs and displacing the market share from ICEVs.
Following the implementation of the NEV-DRE policy, these cities experienced a substantial increase in NEV sales volume. Figure 1 presents the average sales trends of NEVs across 82 pilot cities that had adopted the NEV subsidy policy before 2016. Although substantial subsidy reductions began in 2016, the growth rate of NEV sales in cities that implemented NEV-DRE significantly outpaced that of cities without any driving restrictions. This acceleration coincides with the broader rollout of the NEV-DRE policy, raising the question of whether the observed divergence can be attributed to the policy itself. Investigating the underlying mechanisms is essential to assessing the effectiveness of the policy and to informing futural policy recommendations.
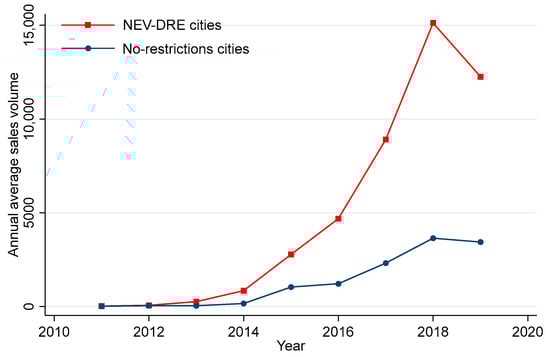
Figure 1.
The average sales of NEVs in NEV-DRE and no-restrictions cities. Notes: Constrained by data accessibility, the data were collected up to 2019.
This paper investigates how the NEV-DRE policy affects the demand for NEVs in China. Using prefecture-level panel data from 2011 to 2019, a staggered difference-in-differences (DID) model is employed to estimate the causal effect of this policy on NEV adoption and investigate heterogeneous impacts across NEV segments. This study also explores mechanisms by examining which specific types of driving restrictions are most effectively stimulating the demand for NEVs, as well as evaluating how purchasing restrictions and regional variations in environmental awareness affect the demand for NEVs.
This study provides several marginal contributions to the literature: (1) existing studies of the NEV-DRE policy either focus on single cities or lack causal identification. This study employs a causal analysis model, together with market sales data from all NEV pilot prefecture-level cities across China, to provide more generalizable evidence about how the NEV-DRE policy can effectively increase the penetration rate of NEVs. (2) Although existing literature has confirmed the impact of non-financial policies on the NEV adoption, the mechanisms still need to be explored. This study reveals the impact mechanism of the NEV-DRE policy from the perspective of the life-cycle cost framework and green product characteristics, providing new empirical evidence for how non-financial policies can promote the development of the NEV industry and facilitate sustainable transportation transformation to meet SDG 7. (3) Existing research mainly focuses on evaluating driving restrictions as a policy tool for urban governance, whereas this study expands the literature on driving restrictions by examining their economic effects beyond traffic management tools, particularly in terms of their function as an industrial policy instrument to promote energy transformation in the transportation sector and address environmental concerns.
In what follows, Section 2 presents the literature review and theoretical analysis. The model and data for this study are introduced in Section 3. Section 4 reports baseline results, the validity of the design, Goodman–Bacon decomposition, the placebo test, and heterogeneity analysis. Section 5 further explores the mechanisms. Finally, the conclusions and policy implications are presented in Section 6.
2. Literature Review and Theoretical Analysis
2.1. Literature Review
The adoption of NEVs is influenced by a variety of factors, such as technological advancements, infrastructure development, and policy incentives. First, technological advancements, particularly in energy storage systems, are crucial for alleviating range anxiety and enhancing vehicle performance, thereby significantly promoting consumer acceptance [30]. Second, the expansion of supporting infrastructure, such as the availability and density of charging stations, provides a practical foundation for NEV utilization and is essential for market development [31]. Beyond these factors, policy incentives have been widely studied as key instruments for governments to stimulate market demand and accelerate the transition from ICEVs.
Among these policy incentives, there are numerous studies that concentrate on the effectiveness of financial policies such as subsidies and tax breaks, especially in consumer purchasing subsidies [14,16,32,33,34,35,36,37,38]. However, growing evidence suggests limitations to these policies, with some studies finding only marginal effects of purchasing subsidies [39] or even questioning their necessity for NEV market growth [5,40]. As subsidies are gradually phased out, the focus of current studies has gradually shifted toward non-financial policies. Among these policies, NEV-DRE is a demand-side policy that has emerged as a key regulatory alternative.
The NEV-DRE policy is a specific application of the broader concept of driving restrictions. Driving restrictions have traditionally been implemented as urban governance tools aimed at alleviating congestion and improving air quality. Consequently, existing research has primarily focused on evaluating these key policy purposes. Most existing studies have empirically confirmed the positive impacts of driving restrictions on improving air quality [27,28,41,42,43]. The other studies focus on their effectiveness in alleviating traffic congestion through altering residents’ travel behavior and reducing vehicle ownership [24,25,26,42,44,45]. Nonetheless, some studies indicate that these policies may have limited or even negligible effects on curbing vehicle ownership [46]. In certain cases, it may lead to a rebound effect [47,48], for instance, by prompting households to purchase additional vehicles to avoid restrictions [45,49,50,51], thereby ultimately undermining the policy’s intended effectiveness.
In comparison, research focusing specifically on the impact of the NEV-DRE policy on NEV adoption remains relatively limited. Although recent studies have employed both theoretical frameworks [52,53] and empirical analysis [21,54,55,56,57] to demonstrate that the NEV-DRE policy can effectively replace subsidies and significantly boost consumer demand, the existing empirical literature suffers from certain limitations. Some studies concentrate only on a few major prefecture-level cities, constraining the generalizability of their findings [56,57], while others establish correlations without causal identification [54,55,58]. Moreover, few studies delve into the underlying mechanisms through which NEV-DRE influences consumer behavior and market outcomes.
This study addresses several critical gaps in the existing literature. First, in response to empirical studies that either lack generalizability or fail to establish causal identification, this research provides more generalizable causal evidence of the NEV-DRE policy’s effect by employing a DID design and comprehensive sales data from all NEVs pilot cities across China. Second, this study delves into the underlying mechanism from the perspective of the life-cycle cost framework and green product characteristics, offering new insights into how the NEV-DRE policy operate. Third, whereas prior research on driving restrictions has predominantly evaluated their efficacy as traffic management tools, this study expands the literature by examining their economic effects and reconceptualizing them as an industrial policy instrument for fostering energy transformation and environmental sustainability in the transportation sector.
2.2. Theoretical Analysis
Conventional demand theory suggests that rational consumers typically reduce purchases when faced with higher prices. However, as vehicles are durable consumer goods, vehicle purchase decisions depend not simply on purchase prices but on both short- and long-term ownership expenses [59,60]. Although NEVs maintain significant environmental advantages through lower emissions and reduce fuel expenditures compared to ICEVs, they continue to carry substantial price premiums. According to the MADE Industry Research Price Discount Index Trend Report [61], despite technological advancements gradually reducing NEV production costs in recent years, the average transaction price of NEVs (CNY 178,000/vehicle) remained higher than that of the overall passenger vehicle market (CNY 165,400/vehicle) as of late 2023. This persistent price differential would traditionally disadvantage NEVs in consumer markets if evaluated only on upfront costs. However, the durable nature of automobiles induces rational consumers to consider the complete life-cycle cost when making choices.
According to the life-cycle cost (LCC) framework of automobiles proposed by Diao et al. [29], the total cost of automobiles consists of tangible costs (TC) and intangible costs (IC). Tangible costs can be divided into purchase costs (PC), operating costs (OC), and resale value (RV), while intangible costs contain purchasing restriction costs (PRC) and driving restriction costs (DRC):
In China’s demand-side policy framework, financial incentives such as purchase subsidies and purchase tax exemptions for NEVs have effectively reduced their tangible purchase cost, enhanced their cost competitiveness, and laid a crucial foundation for market development. However, differential driving restrictions for ICEVs and NEVs, which are non-financial incentives, primarily create an asymmetric impact on the intangible cost. By imposing driving restriction costs on ICEVs while exempting NEVs, the NEV-DRE policy introduces a significant relative cost advantage for NEVs in addition to the existing financial incentives.
The mechanism of this asymmetric impact operates through increased intangible costs for ICEV owners. Under policies that restrict ICEVs while exempting NEVs, ICEV owners will not be able to drive on certain days. If they want to maintain the same level of mobility, they may pay some extra costs, such as purchasing a second vehicle or renting a vehicle, thereby increasing the intangible cost of driving restrictions. Existing studies on driving restriction policies in Beijing, Mexico, and Santiago have demonstrated that residents often circumvent these regulations by purchasing second vehicle with different license plates [46,48,51]. Therefore, in this framework, the driving restriction costs of an ICEV is defined as the initial purchase cost of acquiring another vehicle during the restriction period, which can be calculated as follows:
where D represents the driving restriction frequency, such that vehicles are prohibited from driving one day in every D days. For example, if , the restriction applies once per week.
In contrast, NEV owners bear zero driving restriction costs since they remain unaffected by such policies. As consumers incorporate these policy-induced differentials into their decision making, the relative total cost of ICEVs rises substantially compared to NEVs. When the total cost of ICEVs exceeds that of NEVs, rational consumers exhibit a growing preference for NEVs. Therefore, Hypothesis 1 is proposed as follows:
Hypothesis 1.
The NEV-DRE policy has a positive effect on the demand for NEVs.
Given that China’s driving restriction policies for ICEVs vary significantly across cities due to differing implementation objectives, these policies generally fall into two categories: general driving restrictions and special driving restrictions. General driving restrictions, implemented in high-traffic cities including Beijing, Tianjin, and Hangzhou, represent long-term measures designed to alleviate congestion and reduce emissions across broad urban areas. Based on the registration status of regulatory vehicles, general driving restrictions can be divided into local driving restrictions and outsider driving restrictions. Local driving restrictions are applied to all local vehicles based on license plate numbers, while outsider driving restrictions target non-local vehicles. In contrast, special driving restrictions are temporary measures enacted to address specific challenges such as pollution episodes, major public events, or urban infrastructure projects. Due to distinct policy triggers, special driving restrictions can be further divided into two forms: event-driven restrictions and seasonal restrictions. Event-driven restrictions implemented for major public events or urban infrastructure projects typically involve short-term road closures, which are relatively infrequent occurrences and have limited impact. However, seasonal restrictions that are enacted in China’s northern cities during the winter heating season demonstrate a recurring pattern and create more sustained impacts on urban mobility.
As shown in Equation (2), the DRC of an ICEV is positively related to their frequency. That is, a higher frequency of restrictions corresponds to a smaller value of D, which, in turn leads to a higher DRC. General driving restrictions tend to be implemented at a high frequency, resulting in relatively high restriction costs. Under such policies, the total relative cost of owning an ICEVs increases, promoting consumers to purchase NEVs. In contrast, special driving restrictions are enforced at a lower frequency, leading to relatively lower restriction costs. In cities implementing such policies, the total cost of ICEVs may not rise significantly. As a result, consumers are more likely to continue choosing ICEVs, and the impact on the demand for NEVs remains limited. Therefore, Hypothesis 2 is proposed as follows:
Hypothesis 2.
General driving restrictions have a stronger effect on stimulating the demand for NEVs.
In addition to driving restrictions, some high-traffic cities, such as Beijing and Shanghai, have implemented vehicle purchasing restrictions to curb congestion and limit the growth of vehicle ownership. These policies typically operate through lottery or auction systems, requiring prospective buyers to obtain purchase permits or license plate registrations before acquiring new ICEVs. Numerous studies show that purchasing restrictions have a positive impact on NEV adoption [54,56,57].
These purchase restrictions impose significant intangible costs on ICEVs consumers. If a consumer obtains a qualification through an auction, although it does not require time, the auction price is often expensive, and the cost paid for the auction is the cost of purchasing restrictions at this time. If consumers qualify through a lottery, it seems there is no monetary expenditure, but the time cost of waiting to win the lottery is enormous. During the process of waiting for the lottery, consumers may choose to rent a vehicle or other means to achieve the same travel experience, and the fees they pay are also intangible costs. These costs, referred to as the PRC, become a new component of the total cost of owning an ICEV. Therefore, if the city exempts NEVs from both driving and purchasing restrictions while ICEVs are subject to both, the intangible cost of driving restrictions will increase from the original initial purchase cost to the sum of the purchase cost and purchasing restriction cost. The DRC can be reformulated as follows:
Since NEVs are exempt from purchasing restrictions, their PRC remains zero. This asymmetric policy design further widens the cost gap between ICEVs and NEVs. Faced with higher intangible costs for ICEVs, rational consumers are more inclined to choose NEVs. Thus, Hypothesis 3 is proposed as follows:
Hypothesis 3.
Purchasing restrictions have significantly enhanced the positive effect of the NEV-DRE policy on NEVs adoption.
NEVs are green products that have dual benefits of improving air pollution and reducing energy consumption. Therefore, as “Green” becomes a new consumer trend, consumers’ environmental awareness also affects the demand for NEVs. Given the lower environmental costs of NEVs, consumers who are more concerned about environmental protection and have stronger environmental awareness are more willing to pay a premium for green products. This is because environmental awareness typically has a significant positive impact on consumers’ low-carbon consumption behavior [62]. Additionally, Wang et al. [63] suggest that the relationship between automotive industry policies and consumers’ preference for electric vehicles is moderated by their environmental concerns. Therefore, differences in environmental awareness may also have heterogeneous effects on market demand. Based on this, Hypothesis 4 is proposed as follows:
Hypothesis 4.
Consumer environmental awareness has a positive moderating effect on the NEV-DRE policy.
The framework of theoretical analysis is shown in Figure 2. In theory, the implementation of the NEV-DRE policy will affect consumers’ vehicle purchasing decisions, as factors such as types of driving restrictions, environmental awareness, and whether they are combined with purchasing restrictions will all have impacts on the effectiveness of the NEV-DRE policy. These all need to be further validated through empirical analysis.
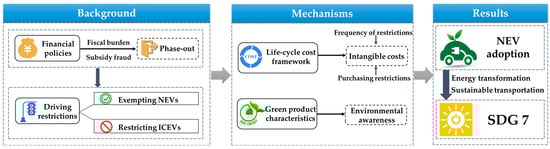
Figure 2.
The framework of theoretical analysis.
3. Research Design
3.1. Model
To identify the impact of the NEV-DRE policy on the demand for NEVs, this study specifies a staggered difference-in-difference (DID) model. The model is set as follows:
where the dependent variable represents the demand for NEVs in city i at year t. is a dummy variable for policy implementation, where if city i exempted NEVs from driving restrictions at year t; otherwise, . Since some cities may implement the NEV-DRE policy at the end of year t (e.g., November 1st), to account for staggered policy implementation and consumer adaptation lags, we follow the approach of Tang and Feng [64] and assign for the policy implemented after June of year t. In contrast, when policies were implemented in the first half of year t, we assign . Consistent with prior studies [12,58,65], we also control a set of time-varying control variables at the city level, including per capita GDP, per capita disposable income, population density, average land surface temperature, and buses per resident. and are fixed effects for the city and the year, respectively. is the error term. The parameter measures the average treatment effect of the NEV-DRE policy, quantifying outcome differentials between the cites affected by this policy and those that are not.
A potential concern is that the observed increase in NEV demand could be driven by industry-wide improvements in vehicle quality and driving experience (e.g., extended range, better performance) rather than the NEV-DRE policy itself. However, our staggered DID design addresses this issue. The key identification assumption of DID is that, in the absence of the policy, the trends in NEV demand between treatment and control cities would have evolved in parallel. The common technological advancements affect all cities simultaneously. Therefore, by comparing the differential change in NEV demand between treatment cities and control cities, our model effectively differentiates out these shared temporal trends. The estimated coefficient thus captures the net effect of the NEV-DRE policy, above and beyond the baseline growth driven by factors such as improved technology.
The main response variable for our baseline regression is the demand for NEVs. To control for the potential influence of population size on demand, we adopt per capita sales of NEVs as the primary response indicator, similar to the specification in Mersky et al. [65]. Given that the dataset contains numerous zero-sales observations, particularly in the early years of this sample, we preserve the original scale of our response variable rather than applying logarithmic transformations, thereby avoiding arbitrary bias from artificial constant adjustments [66].
3.2. Data
We construct our analysis sample using annual prefecture-level data from 2011 to 2019 that were obtained from multiple sources. The dependent variable in this study is the per capita sales of NEVs at the city level, calculated by dividing total NEV sales obtained from official compulsory traffic insurance registration records by resident population figures sourced from cities’ statistical yearbooks and annual statistical bulletins. For our control variables, we incorporate several key variables: per capita GDP and per capita disposable income drawn directly from cities’ statistical yearbooks; population density derived by dividing registered population by land area, both acquired from multiple years of the China City Statistical Yearbook; buses per resident computed the year-end bus fleet data divided by resident population, both obtained from multiple years of the China City Statistical Yearbook; and annual average land surface temperature calculated from daily meteorological observations collected at stations across China.
To control the effects of the subsidy policy for NEVs, we select China’s prefecture-level cities that had adopted the NEVs subsidy policy before 2016 as our analysis sample. Since the NEV subsidy policy is a very important demand-side policy to promote demand for NEVs, we need to partial out the effects of the NEV-DRE policy from the NEVs subsidy policy. If we considered China’s all prefecture-level cities as our research sample, the estimated effects would not distinguish the effects of the NEV-DRE policy from those of the NEV subsidy policy. When we focused only on the cities that have adopted the NEV subsidy policy, our DID specification would cancel out the effects of the NEV subsidy policy between the treatment group and the control group, and the estimated treatment effects would be only attributed to the NEV-DRE policy. China first launched the subsidy policy for the private purchase of NEVs in 5 pilot cities in 2010 and then extended this policy to another 83 pilot cities during 2013 and 2014 before achieving nationwide coverage in 2016. Therefore, there are 88 pilot cities in our initial sample in total.
We select our analysis sample from our initial sample in the following two steps. First, to ensure our study maintained administrative-level consistency and to minimize confounding policy effects, we exclude Pingtan and Dali from our study as they are county-level cities. Second, we exclude Jincheng due to its late policy implementation in November 2018, which falls outside our observation window, and we omit Shanghai, Guangzhou, and Shenzhen because their unique vehicle quota systems could fundamentally alter the automobile market structure in these cities, thereby introducing confounding effects that would violate the parallel trend assumption of our research design. Therefore, our study focuses on the remaining 82 prefecture-level pilot cities that adopted the subsidy policy before 2016.
This study processes the data through the following steps. First, we classify the 82 pilot cities into three categories based on their implementation of driving restrictions. Since range anxiety primarily affects long-distance travel [67], while the primary use for private vehicles is commuting [68], our study focuses on whether cities implement differential driving restrictions between locally-registered NEVs and ICEVs to control the impacts of driving range anxiety [69]. The specific classification of cities is shown in Table 1. The first category includes 9 cities (i.e., Nanchang, Changchun, Beijing, Lanzhou, Chengdu, Tianjin, Wuhan, Guiyang, and Hangzhou) that initially applied restrictions to both NEVs and ICEVs but subsequently exempted NEVs while maintaining restrictions on ICEVs. The second category includes 13 cities (i.e., Shijiazhuang, Langfang, Xi’an, Tangshan, Baoding, Handan, Taiyuan, Xingtai, Cangzhou, Xinxiang, Zhangjiakou, Zhengzhou, and Harbin) that transitioned from having no restrictions to implementing restrictions exclusively on ICEVs. The third category includes the remaining 60 cities that maintained unrestricted access for all vehicle types throughout the study period, serving as our control group. Second, we extract NEV registrations from official compulsory traffic insurance registration records, aggregating them by city and year. Finally, we merge these data with city-level variables including the resident population, per capita GDP, disposable income, and land surface temperature by city–year identifiers, yielding a sample with 738 observations of 82 prefecture–level cities from 2011 to 2019. Table 2 summarizes the main variables.

Table 1.
Classification of cities by driving restrictions.
Table 2.
Summary statistics.
4. Results
4.1. Baseline Results
Table 3 presents the baseline results of the NEV-DRE policy’s impact on the per capita sales of NEVs. Column 1 shows uncontrolled estimates, column 2 introduces two-way fixed effects, and column 3 presents our preferred specification with full controls and fixed effects. Column 3 reveals a statistically significant positive coefficient for the policy at the 1% level. Specifically, compared with cities without differential driving restrictions, the per capita sales of NEVs in cities that implemented the NEV-DRE policy increased by 4.706 units per 10 thousand persons, which is equivalent to 179.41% (4.706/2.623 × 100%) of the average per capita sales level across all sample cities.
Table 3.
Baseline results of the NEV-DRE policy.
To measure its actual economic impact, we translate this per capita effect into total sales. Given that the average population of treated cities is 9.0168 million, this coefficient means that, on average, each city sells approximately 4243 (4.706 × 9.0168) additional NEVs per year. Aggregating across all 22 treated cities, the policy is estimated to have stimulated an additional 93,346 (4243 × 22) NEV sales annually. The policy-induced sales accounted for approximately 12.20% (9.33/76.46 × 100%) of the average annual national NEV sales (764.61 thousand units) from 2016 to 2019. This market response indicates that the NEV-DRE policy generates statistically significant positive effects on NEV adoption rates.
4.2. Validity Test of the DID Model
The DID model requires satisfaction of the parallel trend assumption; that is, pre-treatment trends in the per capita sales of NEVs between the treatment and control group cities should be similar prior to the implementation of the NEV-DRE policy. To validate this identification assumption, we conduct an event study analysis following the specification in Equation (5):
where represents the relative policy-year dummy variables constructed using each city’s policy implementation year as the reference point. indicates the city is in m years after the policy’s implementation, and otherwise. To address data limitations in the pre-treatment phase, we group all pre-policy years beyond four years prior (m < −4) into a single pre-period bin (m = −4). The year preceding policy implementation (m = −1) serves as the baseline period in this event study analysis.
The event study results are presented in Figure 3. This figure plots the estimated coefficients and corresponding 95% confidence intervals on leads and lags. The coefficient for the year before the NEV-DRE policy is normalized to zero. The event study results show that all pre-treatment coefficients are statistically insignificant, supporting the parallel trend assumption. The treatment effects become statistically significant one year after policy implementation, exhibiting a clear upward trend. The staggered implementation of the policy across cities resulted in limited data availability for the fourth post-implementation year, with only Beijing, Nanchang, and Changchun having reached this period. While the estimated effect shows a modest decline for this particular period, the overall treatment effect remains positive and significant throughout the post-implementation period. These results provide robust evidence that the NEV-DRE policy effectively stimulates NEVs market demand, while validating our DID design.
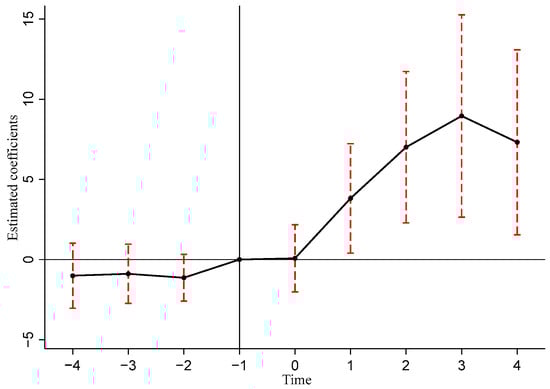
Figure 3.
Event study results.
The parallel trend assumption is plausible in our context for two primary reasons. First, the treatment and control groups are all selected from 88 NEV pilot cities. This means all cities had already adopted the national purchase subsidy before 2016, ensuring they shared a common foundational policy environment before the staggered implementation of the DRE policy. This sample restriction enhances the comparability between groups. Second, the event study results in Figure 3 empirically confirm the absence of statistically significant pre-trends, providing strong support for the assumption.
Recent studies have shown that the lack of a significant pre-trend does not necessarily imply the validity of the parallel trend assumption [70]. To address this concern, we employ the approach of Rambachan and Roth [71] to conduct a sensitivity analysis. This method constructs confidence intervals that are robust to deviations from parallel trends, quantified by a parameter M. We set the maximum allowable deviation (M) to one standard error of the estimated effect. As shown in Figure 4, our findings remain statistically significant even when allowing M to reach 30% of this maximum deviation degree, representing the robustness of our results under smoothness restrictions.
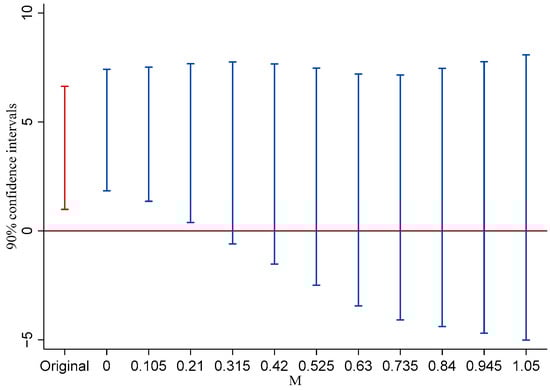
Figure 4.
Sensitivity analysis of the parallel trend assumption. Notes: This figure presents 90% confidence intervals under varying degrees of allowed deviation (M) from linear pre-trends, with M ranging from 0 to one standard error of the treatment effect.
4.3. Goodman–Bacon Decomposition
Recent studies in the staggered DID model [72,73] show that the two-way fixed effects DID estimators are weighted averages across all potential treatment–control comparisons. When treatment timing varies across units, the underlying treatment effects may differ substantially both between treatment groups and across implementation periods. Crucially, this treatment effect heterogeneity can generate negative weighting in the estimation. Excessive negative weights may distort the estimated average treatment effect, potentially compromising the robustness of regression results.
Following Goodman–Bacon [73], we conduct a Bacon decomposition to examine potential biases in our staggered DID design. The decomposition yields three distinct sets of 2 × 2 DID comparisons based on treatment timing variation, which are “Earlier treatment group vs. Later treatment group”, “Treatment group vs. Control group”, and “Later treatment group vs. Earlier treatment group”. In our study, “Treatment group” means that these cities implemented the NEV-DRE policy, while “Control group” means that these cities never implemented it. “Earlier treatment group” means these cities implemented it earlier, and “Later treatment group” means these cities implemented it later. As shown in Table 4, the “Later treatment group vs. Earlier treatment group” accounts for just 2.4% of the total weight in the decomposition. This minimal weighting of potentially problematic comparisons suggests that any bias in our two-way fixed-effects estimates remains economically insignificant.
Table 4.
Bacon decomposition results.
The Bacon decomposition plot presented in Figure 5 shows that the weights for “Later treatment group vs. Earlier treatment group” are clustered near zero and remain relatively small. These results strongly indicate that the estimated coefficients of our baseline two-way fixed-effects model are robust and unlikely to suffer from significant bias due to treatment effect heterogeneity.
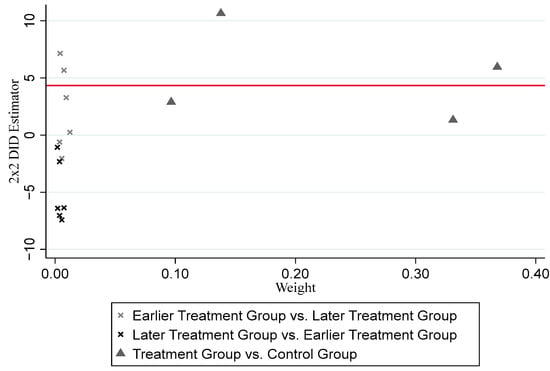
Figure 5.
Bacon decomposition plot.
4.4. Placebo Test
To address potential concerns about serial correlation biasing our standard errors and potentially leading to over-rejection of the null hypothesis, we implement a placebo test. We conduct 500 iterations of randomly assigning the NEV-DRE policy status across cities, preserving the actual distribution of treatment adoption years and the number of treated cities in each year. This procedure generates a counterfactual distribution of policy effects under the null hypothesis of no true treatment effect.
Figure 6 plots the distribution of these placebo estimates along with our baseline estimate of 4.706 from Column 3 of Table 3. It shows that the placebo estimates form a symmetric distribution tightly clustered around zero, and our actual estimate lies well outside this null distribution, which strongly suggests that our baseline result is unlikely to be driven by unobserved confounding factors or statistical artifacts but rather reflects a genuine policy effect.
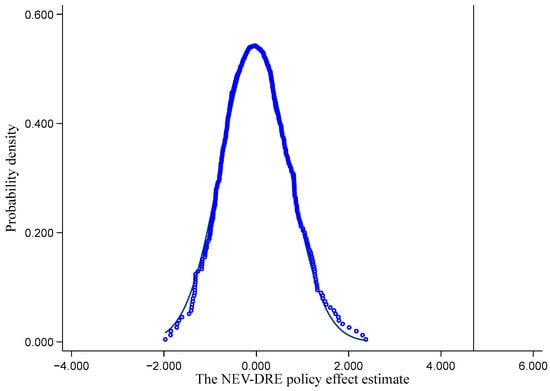
Figure 6.
Placebo test.
4.5. Robustness Check
To address concerns that our results may be driven by larger or more developed cities, we divide the sample into two groups: provincial capitals and municipalities representing larger and more developed cities and non-provincial capital cities representing smaller and ordinary prefecture-level cities. The results in columns 1 to 2 of Table 5 confirm that the positive effect of the NEV-DRE policy is robust and is not exclusive to provincial capitals or municipalities.
Table 5.
Robustness check.
Although the statistical significance of the estimators varies due to reduced sample sizes, the coefficient remains positive and statistically significant in both sub-samples. Most importantly, the finding of a significant positive effect in the non-capital sub-sample shows that our main results are not only driven by larger or more developed cities. This provides strong evidence for the broad applicability of the policy.
In addition, a potential concern is that our results might be sensitive to the exclusion of cities with unique quota systems. To test this, we relax our sample selection criteria by reconsidering Shanghai, Guangzhou, and Shenzhen in the analysis. As shown in column 3 of Table 5, the estimated coefficient on our policy variable of interest remains unchanged compared to our baseline estimate. This result confirms that the core finding of a positive policy effect is not driven by our decision to exclude these outlier cities. While we maintain our baseline specification on theoretical grounds to ensure comparability, this check provides strong empirical assurance that our conclusions are robust.
4.6. Heterogeneous Analysis of the NEV-DRE Policy Across NEV Market Segments
Although our baseline results suggest that the NEV-DRE policy has a positive effect on demand for NEVs, the relative impact across various types of demand for NEVs remains unexplored. Therefore, we classify NEVs according to their functions, power types, and production areas and then use per capita sales of different types of NEVs as the dependent variable to re-estimate Equation (4).
Table 6 reports different effects of the NEV-DRE policy across NEVs market segments. Specifically, columns 1 to 3 report the heterogeneous effects of the NEV-DRE policy on sedans (hereafter CARs), SUVs, and MPVs, respectively. The results show that there are positive effects on both CARs and SUVs, with CARs exhibiting the strongest response, followed by SUVs, while MPVs show no significant impact. As the dominant vehicle type for household transportation, CARs benefit from stable and substantial market demand, with new energy CARs being particularly attractive to consumers who value both daily commuting utility and unrestricted mobility privileges. Although SUVs always carry higher price tags than CARs, their growing popularity among consumers seeking larger and more powerful vehicles has made them a viable alternative for some consumers. In contrast, MPVs face multiple disadvantages; for example, higher prices reduce cost-competitiveness, their primary use in commercial and corporate fleets limits private demand, and their niche market positioning makes them less responsive to mobility-based policy incentives. These findings suggest that the NEV-DRE policy is most effective for CARs and SUVs.
Table 6.
Estimated results of the NEV-DRE policy across NEV market segments.
The heterogeneous impacts of the NEV-DRE policy across power types are presented in columns 4 to 5 of Table 6. Based on power types, NEVs can be divided into three categories: pure electric passenger vehicles (PEVs), plug-in hybrid passenger vehicles, and extended-range electric passenger vehicles, with the latter two categories collectively referred to as non-pure electric vehicles (NPEVs). The empirical results demonstrate significantly stronger policy impacts on PEV adoption, consistent with several cities’ policies of granting exclusive traffic privileges to PEVs while maintaining restrictions on other NEV types.
Columns 6 to 7 of Table 6 report the differential policy impacts on domestic and imported NEVs. Column 6 presents the statistically significant positive effects of the policy on domestic NEVs at the 1% level. However, although column 7 shows that the result of imported NEVs is positively significant at the 5% level, the estimated coefficient is small, indicating that the policy has a relatively small impact on it. There are two possible reasons why demand growth for NEVs primarily comes from domestic NEVs instead of imported NEVs. First, imported NEVs face cost disadvantages from higher tariffs and value-added taxes. Second, domestic NEVs benefit from purchasing subsidies and local tax breaks. Consequently, the NEV-DRE policy significantly boosts the market share of domestic NEVs.
5. Mechanism Analysis
5.1. Different Impacts of Various Driving Restrictions on Demand for NEVs
As classified in Section 2.2, general driving restrictions and special driving restrictions differ not only in terms of their policy purposes but also in their implementation frequency and duration. According to the life-cycle cost framework of automobiles proposed by Diao et al. [29], the driving restriction costs are inversely related to their frequency. The higher the restriction frequency is, the heavier the burden for drivers is. Given the differing frequencies between general driving restrictions and special driving restrictions, rational consumers may respond differently to various policy types due to relative cost constraints. To empirically examine these different effects, we stratify our treatment group using the policy classification in Table 1 and re-estimate Equation (4).
Table 7 shows heterogeneous effects across types of driving restrictions on demand for NEVs. When cities implement general driving restrictions, it shows a statistically significant positive coefficient at a significance level of 1%, substantially larger than the baseline estimate, while those with special driving restrictions exhibit an insignificant positive coefficient at a significance level of 10%. This heterogeneity results from different restriction frequencies and durations. General driving restrictions impose sustained compliance costs that strongly incentivize NEV purchase, whereas special traffic restrictions create insufficient cost pressure to alter consumer decisions. These findings indicate that only stable, long-term restrictions effectively promote NEV market growth by significantly raising total costs for ICEVs.
Table 7.
Estimated results of various traffic restriction policies on demand for NEVs.
5.2. The Impact of the Purchasing Restriction Policies on Demand for NEVs
According to the theoretical analysis in the Section 2, in cities where traffic restrictions are already in place, the additional implementation of purchasing restrictions would further increase intangible costs of ICEVs for consumers. This, in turn, would stimulate them to purchase NEVs.
To test Hypothesis 3, we first identify cities implementing purchasing restrictions and set a dummy variable License, which equals 1 for cities with purchasing restrictions and 0 otherwise. Then, we construct an interaction term between License and Policy, and substitute it into Equation (4) for regression analysis. We find a significant positive coefficient for this interaction term, as shown in Table 8. This result suggests that purchasing restrictions significantly enhance the positive effect of the NEV-DRE policy on NEV adoption, indicating that the combined implementation of both policies more effectively increases the demand for NEVs compared to the NEV-DRE policy alone.
Table 8.
Estimated results of the purchasing restriction policies on demand for NEVs.
5.3. The Impact of Consumer Environmental Awareness on Demand for NEVs
In addition, the green and low-carbon attributes of NEVs cannot be ignored. As green and low-carbon products, their market demand will also be influenced by consumers’ environmental awareness. Generally, consumers with stronger environmental awareness are more likely to purchase new energy vehicles.
With the development of the Internet, the volume of online keyword searches shows how concerned the public is about the environment when they use search engines to look up environmental information. Therefore, the volume of online keyword searches can be used to measure the public’s attention to the environment, reflecting the public’s environmental awareness to a certain extent. Following the approach of Wang and Zhao [74] and Wu et al. [75], we select two keywords, “haze” and “environmental pollution”, and use the annual average search volume of Baidu keywords to represent the consumer environmental awareness (EA). We use the variable EA to represent consumer environmental awareness and then construct an interaction term between EA and Policy and incorporate it into Equation (4) for regression analysis. The impact of consumer environmental awareness on the NEV market is shown in Table 9.
Table 9.
Estimated results of consumer environmental awareness on demand for NEVs.
The results of using “haze” as a keyword to measure environmental awareness are shown in columns 1 to 3 of Table 9, corresponding to PC search volume, mobile search volume, and total search volume, respectively. Columns 4 to 6 show the results of using “environmental pollution” as a keyword to measure environmental awareness, corresponding to PC search volume, mobile search volume, and total search volume, respectively. Table 9 shows that the coefficients of the interaction terms in all regression results are significantly positive at a significance level of 1%, indicating that enhancement of consumer environmental awareness strengthens the NEV-DRE policy’s effectiveness in stimulating NEV adoption.
6. Conclusions and Policy Implications
6.1. Conclusions
To explore how the NEV-DRE policy affects the demand for NEVs, this study employs a staggered DID model to examine the causal effects of China’s NEV-DRE policy on the demand for NEVs by using prefecture-level data from 2011 to 2019. The findings indicate that the demand for NEVs has significantly increased due to the NEV-DRE policy. The heterogeneity analysis indicates that the NEV-DRE policy primarily boosts demand for domestic pure electric sedans. The implementation of general driving restrictions on ICEVs has a greater impact on NEV adoption, while special driving restrictions have little influence on the demand for NEVs. In addition, the simultaneous implementation of purchasing restrictions and the improvement of consumer environmental awareness will enhance the positive effect of the NEV-DRE policy on NEV adoption.
The findings of this study demonstrate that, as subsidies are gradually phased out, the NEV-DRE policy is a powerful non-financial instrument for driving the renewable transformation in the transportation sector and promoting sustainable urban mobility. By stimulating the shift to NEVs, this policy directly contributes to increasing the share of renewables in energy consumption, improving energy efficiency and fostering the development of a sustainable transportation system. Its successful implementation provides a viable pathway for China and other countries to enhance energy security, address environmental issues, and achieve SDG 7.
6.2. Policy Implications
First, policymakers must optimize the NEV-DRE policy design to directly contribute to the targets of SDG 7 on affordable and clean energy and the development of a sustainable transportation system. Local conditions should be taken into consideration while designing policies to maximize the effectiveness in promoting renewable energy adoption and improving energy efficiency in the transportation sector. Although our findings show that the NEV-DRE policy can effectively stimulate consumer demand for NEVs, the impacts of this policy vary depending on the type of driving restrictions and their implementation. Cities already implementing driving restrictions should reinforce long-term restrictions on ICEVs coupled with exempting NEVs, which will boost consumer confidence and investment in the NEV sector. Megacities with purchasing restrictions can further amplify the effect by increasing NEVs market quotas, creating a powerful combination of policies. For cities without driving restrictions, a rigorous assessment of local traffic conditions is necessary before implementing new non-financial incentives. Initial steps could include low-impact measures such as preferential parking. For more significant interventions, such as granting NEVs priority access to bus lanes, policymakers should conduct a thorough cost-benefit analysis to prevent unintended congestion and ensure net positive outcomes, thereby effectively promoting a sustainable transition in transportation sector.
Second, policymakers should implement supporting policies to reinforce the renewable energy signal and lay the foundation for sustainable transportation. The government should accelerate the development of public charging infrastructure for affordable and reliable energy access, which is essential for sustainable electric mobility. Expanding fast-charging networks is essential to reducing range anxiety, ensuring the reliable operation of NEVs, and providing a tangible foundation for the energy transition, directly enhancing the effectiveness of traffic policies. In additional, our results show that consumer environmental awareness plays a significant moderating role in boosting demand for NEVs. Policymakers should launch public awareness campaigns and environmental education programs [76] in cities with lower environmental awareness to highlight the benefits of NEVs. Consumer preference is a key driver of NEV demand. Enhancing public environmental awareness can amplify the effectiveness of non-financial incentives such as the NEV-DRE policy, fostering broader public support for renewable energy transitions and the adoption of sustainable transport solutions to achieve SDG 7 in China.
Third, a comprehensive policy framework is needed to guarantee that NEV promotion contributes effectively to broader urban sustainability and clean energy transitions. Although replacing ICEVs with NEVs could reduce air pollution and reliance on fossil fuels, the rapid growth in new energy vehicles may lead to an energy rebound effect and yield uncertain carbon reduction results, which may undermine decarbonization outcomes and the SDG 7 target of enhancing energy efficiency. Therefore, a lifecycle assessment framework should be established to fully assess the energy and environmental impacts of NEVs, ensuring the outcomes of carbon reduction and fossil energy consumption saving are certain. Additionally, the construction of infrastructure and intelligent traffic management systems should be accelerated to improve road traffic efficiency and reduce potential traffic congestion caused by the large number of NEVs. These measures will ensure that the growth of NEVs contributes to a more sustainable and efficient mobility system consistent with the spirit of SDGs.
This study still has some limitations. First, constrained by data accessibility, this study only covers the period from 2011 to 2019. Since the most rapid expansion of the NEV market share occurred after this period, this study primarily reflects the policy’s effectiveness during its initial and mid-term phases of implementation and may not fully capture its impacts in the latest phase of market evolution. As a result, this may affect the generalizability of our findings. Future research with access to more recent data will be valuable to assessing the long-term and evolving dynamics of this policy. Second, this study does not account for the differences in supporting infrastructure development among cities. Since the availability of charging stations and other auxiliary facilities has a significant impact on the adoption of NEVs [77], subsequent studies should examine their moderating role in this relationship, thereby assisting policymakers in making more targeted optimization suggestions.
Author Contributions
Conceptualization, J.X. and Q.P.; methodology, J.X.; data curation, J.X. and F.R.; software, J.X. and F.R.; validation, J.X., F.R. and Q.P.; writing—original draft preparation, J.X. and F.R.; writing—review and editing, J.X., F.R. and Q.P.; supervision, J.X., F.R. and Q.P.; project administration, Q.P. All authors have read and agreed to the published version of the manuscript.
Funding
This research was supported by the Humanities and Social Science Research General Project of the Ministry of Education of China (No. 22YJAZH086).
Institutional Review Board Statement
Not applicable.
Informed Consent Statement
Not applicable.
Data Availability Statement
The data in this study are available upon request from authors.
Acknowledgments
All authors would like to thank all of the reviewers for their expertise and valuable input.
Conflicts of Interest
All authors declare no conflicts of interest.
References
- Yan, X.; Crookes, R.J. Study on energy use in China. J. Energy Inst. 2007, 80, 110–115. [Google Scholar] [CrossRef]
- Yang, S.; He, L.Y. Fuel demand, road transport pollution emissions and residents’ health losses in the transitional China. Transp. Res. Part D Transp. Environ. 2016, 42, 45–59. [Google Scholar] [CrossRef]
- Yang, S.; He, L.Y. Transport pollution in China-evidence from Beijing. Energy Environ. 2016, 27, 377–388. [Google Scholar] [CrossRef]
- He, L.Y.; Chen, Y. Thou shalt drive electric and hybrid vehicles: Scenario analysis on energy saving and emission mitigation for road transportation sector in China. Transp. Policy 2013, 25, 30–40. [Google Scholar] [CrossRef]
- Zhang, X.; Wang, K.; Hao, Y.; Fan, J.L.; Wei, Y.M. The impact of government policy on preference for NEVs: The evidence from China. Energy Policy 2013, 61, 382–393. [Google Scholar] [CrossRef]
- He, L.Y.; Qiu, L.Y. Transport demand, harmful emissions, environment and health co-benefits in China. Energy Policy 2016, 97, 267–275. [Google Scholar] [CrossRef]
- Wang, Z.; Dong, X. Determinants and policy implications of residents’ new energy vehicle purchases: The evidence from China. Nat. Hazards 2016, 82, 155–173. [Google Scholar] [CrossRef]
- Zhang, X.; Bai, X. Incentive policies from 2006 to 2016 and new energy vehicle adoption in 2010–2020 in China. Renew. Sustain. Energy Rev. 2017, 70, 24–43. [Google Scholar] [CrossRef]
- Li, L.; Liu, H.; Liu, B. Forecast of CO2 and Pollutant Emission Reductions from Electric Vehicles in Beijing–Tianjin–Hebei. Sustainability 2025, 17, 6386. [Google Scholar] [CrossRef]
- Shao, W.; Yang, K.; Bai, X. Impact of financial subsidies on the R&D intensity of new energy vehicles: A case study of 88 listed enterprises in China. Energy Strategy Rev. 2021, 33, 100580. [Google Scholar]
- Jiang, Z.; Xu, C. Policy incentives, government subsidies, and technological innovation in new energy vehicle enterprises: Evidence from China. Energy Policy 2023, 177, 113527. [Google Scholar] [CrossRef]
- Xiong, Y.Q.; Huang, T.T.; Li, X.L. Reginal differences in the implementation effect of New Energy Vehicle consumption promotion policy: Comparative perspectives on “purchase” and “use” links. China Popul. Resour. Environ. 2019, 29, 71–78. (In Chinese) [Google Scholar]
- Ma, S.; Fan, Y. An evaluation of China’s new energy vehicle policy: Based on co-integration of time series. China Popul. Resour. Environ. 2018, 28, 117–124. (In Chinese) [Google Scholar]
- Liu, Z. Impact of vehicle purchase tax exemption on electric vehicle sales: Evidence from China’s automotive industry. Energy Strategy Rev. 2023, 49, 101148. [Google Scholar] [CrossRef]
- Liu, Y.; Zhao, X.; Lu, D.; Li, X. Impact of policy incentives on the adoption of electric vehicle in China. Transp. Res. Part A Policy Pract. 2023, 176, 103801. [Google Scholar] [CrossRef]
- Li, X.; Wang, Z.; Jiang, S.; Li, C.; Guo, H. Financial subsidy, government audit and new transportation technology: Evidence from the new energy vehicle pilot city program in China. Res. Transp. Econ. 2024, 106, 101447. [Google Scholar] [CrossRef]
- Shang, W.; Zhang, J.; Wang, K.; Yang, H.; Ochieng, W. Can financial subsidy increase electric vehicle (EV) penetration-evidence from a quasi-natural experiment. Renew. Sustain. Energy Rev. 2024, 190, 114021. [Google Scholar] [CrossRef]
- Zhang, T.; Burke, P.J.; Wang, Q. Effectiveness of electric vehicle subsidies in China: A three-dimensional panel study. Resour. Energy Econ. 2024, 76, 101424. [Google Scholar] [CrossRef]
- Cao, X.; Xing, Z.Y.; Zhang, L.P. An Evolutionary Game Analysis of New Energy Vehicle Industry Development under Government Regulations. Manag. Rev. 2018, 30, 82–96. (In Chinese) [Google Scholar]
- Sheldon, T.L.; DeShazo, J.R. How does the presence of HOV lanes affect plug-in electric vehicle adoption in California? A generalized propensity score approach. J. Environ. Econ. Manag. 2017, 85, 146–170. [Google Scholar] [CrossRef]
- Wang, N.; Tang, L.; Pan, H. Effectiveness of policy incentives on electric vehicle acceptance in China: A discrete choice analysis. Transp. Res. Part A Policy Pract. 2017, 105, 210–218. [Google Scholar] [CrossRef]
- Wang, N.; Tang, L.; Zhang, W.; Guo, J. How to face the challenges caused by the abolishment of subsidies for electric vehicles in China? Energy 2019, 166, 359–372. [Google Scholar] [CrossRef]
- Lu, T.; Yao, E.; Jin, F.; Yang, Y. Analysis of incentive policies for electric vehicle adoptions after the abolishment of purchase subsidy policy. Energy 2022, 239, 122136. [Google Scholar] [CrossRef]
- Lu, X.Y. Effectiveness of government enforcement in driving restrictions: A case in Beijing, China. Environ. Econ. Policy Stud. 2016, 18, 63–92. [Google Scholar] [CrossRef]
- Gu, Y.; Deakin, E.; Long, Y. The effects of driving restrictions on travel behavior evidence from Beijing. J. Urban Econ. 2017, 102, 106–122. [Google Scholar] [CrossRef]
- Du, J.; Ouyang, D. Progress of Chinese electric vehicles industrialization in 2015: A review. Applies Energy 2017, 188, 529–546. [Google Scholar] [CrossRef]
- Viard, V.B.; Fu, S. The effect of Beijing’s driving restrictions on pollution and economic activity. J. Public Econ. 2015, 125, 98–115. [Google Scholar] [CrossRef]
- Zhang, M.; Shan, C.; Wang, W.; Pang, J.; Guo, S. Do driving restrictions improve air quality: Take Beijing-Tianjin for example? Sci. Total Environ. 2020, 712, 136408. [Google Scholar] [CrossRef]
- Diao, Q.H.; Sun, W.; Yuan, X.M.; Li, L.; Zheng, Z. Life-cycle private-cost-based competitiveness analysis of electric vehicles in China considering the intangible cost of traffic policies. Appl. Energy 2016, 178, 567–578. [Google Scholar] [CrossRef]
- Mehranfar, S.; Banagar, I.; Moradi, J.; Andwari, A.M.; Könnö, J.; Gharehghani, A.; Rabiei, M.; Kurvinen, E. The perspective of energy storage systems advancements and challenges for electric vehicle applications; metric, mechanism, mode, and mitigation framework. Future Sustain. 2024, 2, 22–32. [Google Scholar] [CrossRef]
- Khalid, R.; Conjobeeharry, V.; Sanai, A.S.; Brown, C.T.; Afrouzi, H.N.; Hassan, A. The feasibility and analysis of electric taxi vehicles in Singapore: A review. Future Energy 2023, 2, 38–48. [Google Scholar] [CrossRef]
- Chandra, A.; Gulati, S.; Kandlikar, M. Green drivers or free riders? An analysis of tax rebates for hybrid vehicles. J. Environ. Econ. Manag. 2010, 60, 78–93. [Google Scholar] [CrossRef]
- Jenn, A.; Springel, K.; Gopal, A.R. Effectiveness of electric vehicle incentives in the United States. Energy Policy 2018, 119, 349–356. [Google Scholar] [CrossRef]
- Wee, S.; Coffman, M.; La Croix, S. Do electric vehicle incentives matter Evidence from the 50 U.S. states. Res. Policy 2018, 47, 1601–1610. [Google Scholar] [CrossRef]
- Azarafshar, R.; Vermeulen, W.N. Electric vehicle incentive policies in Canadian provinces. Energy Econ. 2020, 91, 104902. [Google Scholar] [CrossRef]
- Urrutia-Mosquera, J.; Fábrega, J. Impact of fiscal incentives in the consumption of low emission vehicles. Case Stud. Transp. Policy 2021, 9, 1151–1159. [Google Scholar] [CrossRef]
- Holtsmark, B.; Skonhoft, A. The Norwegian support and subsidy policy of electric cars. Should it be adopted by other countries? Environ. Sci. Policy 2014, 42, 160–168. [Google Scholar] [CrossRef]
- Bjerkan, K.Y.; Nørbech, T.E.; Nordtømme, M.E. Incentives for promoting Battery Electric Vehicle (BEV) adoption in Norway. Transp. Res. Part D Transp. Environ. 2016, 43, 169–180. [Google Scholar] [CrossRef]
- Hoen, A.; Koetse, M.J. A choice experiment on alternative fuel vehicle preferences of private car owners in the Netherlands. Transp. Res. Part A Policy Pract. 2014, 61, 199–215. [Google Scholar] [CrossRef]
- Diamond, D. The impact of government incentives for hybrid-electric vehicles: Evidence from US states. Energy Policy 2009, 37, 972–983. [Google Scholar] [CrossRef]
- Carrillo, P.E.; Malik, A.S.; Yoo, Y. Driving restrictions that work? Quito’s Pico y Placa Program. Can. J. Econ. Rev. Can. D’économique 2016, 49, 1536–1568. [Google Scholar] [CrossRef]
- Mishra, R.K.; Pandey, A.; Pandey, G.; Kumar, A. The effect of odd-even driving scheme on PM2.5 and PM1.0 emission. Transp. Res. Part D Transp. Environ. 2019, 67, 541–552. [Google Scholar] [CrossRef]
- Barahona, N.; Gallego, F.A.; Montero, J.P. Vintage-specific driving restrictions. Rev. Econ. Stud. 2020, 87, 1646–1682. [Google Scholar] [CrossRef]
- Zhao, P.; Zhao, X.; Qian, Y.; Yan, Y. Change in Commuters’ Trip Characteristics under Driving Restriction Policies. In Smart Transportation Systems; Springer: Singapore, 2019. [Google Scholar]
- Grange, L.D.; Troncoso, R. Impacts of vehicle restrictions on urban transport flows: The case of Santiago, Chile. Transp. Policy 2011, 18, 862–869. [Google Scholar] [CrossRef]
- Wang, L.L.; Xu, J.T.; Qin, P. Will a driving restriction policy reduce car trips? The case study of Beijing, China. Transp. Res. Part A Policy Pract. 2014, 67, 279–290. [Google Scholar] [CrossRef]
- Eskeland, G.S.; Feyzioglu, T. Rationing can backfire: The “day without a car” in Mexico City. World Bank Econ. Rev. 1997, 11, 383–408. [Google Scholar] [CrossRef]
- Davis, L.W. The effect of driving restrictions on air quality in Mexico City. J. Political Econ. 2008, 116, 38–81. [Google Scholar] [CrossRef]
- Goddard, H.C. Promoting urban sustainability: The case for a tradable supplementary licence system for vehicle use. Urban Stud. 1999, 36, 2317–2331. [Google Scholar] [CrossRef]
- Goddard, H.C. Using tradeable permits to achieve sustainability in the world’s large cities: Policy design issues and efficiency conditions for controlling vehicle emissions, congestion and urban decentralization with an application to Mexico City. Environ. Resour. Econ. 1997, 10, 63–99. [Google Scholar] [CrossRef]
- Gallego, F.; Montero, J.P.; Salas, C. The effect of transport policies on car use: Theory and evidence from Latin American cities. J. Public Econ. 2013, 107, 47–62. [Google Scholar] [CrossRef]
- Langbroek, J.H.M.; Franklin, J.P.; Susilo, Y.O. The effect of policy incentives on electric vehicle adoption. Energy Policy 2016, 94, 94–103. [Google Scholar] [CrossRef]
- Ma, L.; Zhong, W.J.; Mei, S. Research on “Fall off” Problem of Subsidy Policies for New-Energy Vehicles. Soft Sci. 2018, 32, 26–30. (In Chinese) [Google Scholar]
- Ma, S.C.; Fan, Y.; Feng, L.Y. An evaluation of government incentives for new energy vehicles in China focusing on vehicle purchasing restrictions. Energy Policy 2017, 110, 609–618. [Google Scholar] [CrossRef]
- Wang, N.; Pan, H.; Zheng, W. Assessment of the incentives on electric vehicle promotion in China. Transp. Res. Part A Policy Pract. 2017, 101, 177–189. [Google Scholar] [CrossRef]
- Li, G.D.; Luo, R.Q.; Gu, Y.F. Government’s Promotion Policies and the Demand of New-Energy Vehicles: Evidence from Shanghai. China Ind. Econ. 2019, 4, 42–61. (In Chinese) [Google Scholar]
- Lu, T.; Yao, E.; Jin, F.; Pan, L. Alternative incentive policies against purchase subsidy decrease for battery electric vehicle (BEV) adoption. Energies 2020, 13, 1645. [Google Scholar] [CrossRef]
- Li, X.M.; Liu, Y.R.; Yang, J.J. On the regional differences of new energy vehicle promotion policy in China. China Popul. Resour. Environ. 2020, 30, 51–61. (In Chinese) [Google Scholar]
- Liu, Z.; Song, J.; Kubal, J.; Susarla, N.; Knehr, K.W.; Islam, E.; Nelson, P.; Ahmed, S. Comparing total cost of ownership of battery electric vehicles and internal combustion engine vehicles. Energy Policy 2021, 158, 112564. [Google Scholar] [CrossRef]
- Malima, G.C.; Moyo, F. Are electric vehicles economically viable in sub-Saharan Africa? The total cost of ownership of internal combustion engine and electric vehicles in Tanzania. Transp. Policy 2023, 141, 14–26. [Google Scholar] [CrossRef]
- MADE Industry Research Price Discount Index Trend Report. Available online: http://www.isengine.com.cn/202403/ise00020240308113633943.pdf (accessed on 5 September 2025).
- Hines, J.M.; Hungerford, H.R.; Tomncra, A.N. Analysis and synthesis of research on responsible environmental behavior: A meta-analysis. J. Environ. Educ. 1987, 18, 1–8. [Google Scholar] [CrossRef]
- Wang, S.; Li, J.; Zhao, D. The impact of policy measures on consumer intention to adopt electric vehicles: Evidence from China. Transp. Res. Part A Policy Pract. 2017, 105, 14–26. [Google Scholar] [CrossRef]
- Tang, Y.; Feng, J. Do Social Security Contributions Affect the Capital-labor Ratio: Evidence from China. Econ. Res. J. 2019, 11, 87–101. (In Chinese) [Google Scholar]
- Mersky, A.C.; Sprei, F.; Samaras, C.; Qian, Z.S. Effectiveness of incentives on electric vehicle adoption in Norway. Transp. Res. Part D Transp. Environ. 2016, 46, 56–68. [Google Scholar] [CrossRef]
- Chen, J.; Roth, J. Logs with zeros? Some problems and solutions. Q. J. Econ. 2024, 139, 891–936. [Google Scholar] [CrossRef]
- Tamor, M.A.; Moraal, P.E.; Reprogle, B.; Milačić, M. Rapid estimation of electric vehicle acceptance using a general description of driving patterns. Transp. Res. Part C Emerg. Technol. 2015, 51, 136–148. [Google Scholar] [CrossRef]
- Blockbuster Release: 2023 China Auto Insights of Consumption. Available online: https://www.autohome.com.cn/article?id=MCDRJYyBFMQ= (accessed on 25 December 2023).
- Hackbarth, A.; Madlener, R. Willingness-to-pay for alternative fuel vehicle characteristics: A stated choice study for Germany. Transp. Res. Part A Policy Pract. 2016, 85, 89–111. [Google Scholar] [CrossRef]
- Roth, J.; Sant’Anna, P.H.; Bilinski, A.; Poe, J. What’s trending in difference-in-differences? A synthesis of the recent econometrics literature. J. Econom. 2023, 235, 2218–2244. [Google Scholar] [CrossRef]
- Rambachan, A.; Roth, J. A more credible approach to parallel trends. Rev. Econ. Stud. 2023, 90, 2555–2591. [Google Scholar] [CrossRef]
- De Chaisemartin, C.; D’ Haultfœuille, X. Two-way fixed effects estimators with heterogeneous treatment effects. Am. Econ. Rev. 2020, 110, 2964–2996. [Google Scholar] [CrossRef]
- Goodman-Bacon, A. The long-run effects of childhood insurance coverage: Medicaid implementation, adult health, and labor market outcomes. Am. Econ. Rev. 2021, 111, 2550–2593. [Google Scholar] [CrossRef]
- Wang, Y.Z.; Zhao, J. “Voting with Money”: The impact of public environmental concern on asset prices across industries. J. Manag. World 2018, 34, 46–57. (In Chinese) [Google Scholar]
- Wu, L.B.; Yang, M.M.; Sun, K.G. Impact of public environmental attention on environmental governance of enterprises and local governments. China Popul. Resour. Environ. 2022, 32, 1–14. (In Chinese) [Google Scholar]
- Yang, M.; Chen, H.; Long, R.; Sun, Q.; Yang, J. How does government regulation promote green product diffusion in complex network? An evolutionary analysis considering supply side and demand side. J. Environ. Manag. 2022, 318, 115642. [Google Scholar] [CrossRef]
- Cai, Q.; Ji, Z.; Ma, F.; Liang, H. The Green Effects of Industrial Policy—Evidence from China’s New Energy Vehicle Subsidies. Energies 2023, 16, 6811. [Google Scholar] [CrossRef]
Disclaimer/Publisher’s Note: The statements, opinions and data contained in all publications are solely those of the individual author(s) and contributor(s) and not of MDPI and/or the editor(s). MDPI and/or the editor(s) disclaim responsibility for any injury to people or property resulting from any ideas, methods, instructions or products referred to in the content. |
© 2025 by the authors. Licensee MDPI, Basel, Switzerland. This article is an open access article distributed under the terms and conditions of the Creative Commons Attribution (CC BY) license (https://creativecommons.org/licenses/by/4.0/).