Abstract
Buildings account for a major share of global energy demand and emissions, prioritizing lighting for efficiency improvements. This study evaluates a daylight-assisted lighting system’s energy and environmental performance through a fully measurement-based approach. Monitored illuminance data were processed within a transparent workflow linking lighting demand to power use, electricity consumption, and life-c ycle greenhouse gas emissions. Energy demand was derived from luminaire efficacy and an illuminated area, while environmental impacts were quantified using an attributional life cycle assessment (LCA) framework consistent with ISO 14040/14044 standards. Use-phase carbon footprints were calculated with regional grid emission factors, and manufacturing, transport, and end-of-life stages were included as background conditions. The results demonstrate that the daylight-aware control strategy achieved an average electricity reduction of 17% (95% CI: 15.7–18.3%) compared to the constant baseline, with the greatest savings occurring in daylight-rich months. When translated into environmental terms, these operational reductions yielded a corresponding ~17% decrease in use-phase CO2 emissions under a regional grid factor of 0.40 kg CO2/kWh. Importantly, the system’s embodied impacts were outweighed within an operational payback period of approximately 18–20 months, underscoring both environmental and economic viability. Sensitivity analyses across illuminance thresholds, luminaire efficacy, and grid emission factors confirmed the robustness of these outcomes. Overall, the study provides a reproducible methodology that directly integrates empirical daylight measurements with life-cycle assessment, clarifying the contribution of smart lighting control to sustainable building design.
1. Introduction
The built environment accounts for nearly 40% of global energy consumption and carbon emissions, making it central to strategies for addressing climate change and resource depletion. Within this sector, lighting has a major end-use, especially in commercial, educational, and healthcare facilities where extended hours and deep-plan layouts demand significant artificial illumination. Historically, lighting systems have been designed around fixed illuminance levels and static schedules, regardless of natural daylight availability. This approach inflates energy demand and imposes avoidable environmental burdens associated with electricity production [1].
Daylighting, the controlled use of natural light for interior illumination, has emerged as a foundational strategy in sustainable building design. By reducing reliance on electric lighting and enhancing indoor environmental quality, daylighting strategies contribute to energy efficiency and occupant well-being. Among the available technologies, tubular daylighting devices (TDDs), also known as light pipes or sun pipes, offer a practical means to deliver daylight into interior or windowless spaces. These passive optical systems capture zenithal daylight through rooftop collectors, guide it via reflective ducts, and diffuse it at the ceiling level. Their appeal is simple: no moving parts, low maintenance, and compatibility with standard building layouts [2].
Empirical studies and simulations confirm that sun-pipes can substantially reduce daytime lighting energy demand, though performance varies with tube diameter, duct length, surface reflectance, and diffuser design. Transmission losses accumulate along the duct, producing nonlinear relationships between outdoor and indoor illuminance. As a result, high exterior levels do not always translate into adequate indoor task-plane lighting, underscoring the importance of local monitoring and calibration [3]. More recent investigations extend this understanding by examining the influence of the climatic context, seasonal variability, and room surface reflectance on system effectiveness [4]. These studies converge on two insights: daylight availability is inherently dynamic, requiring adaptive controls, and sun-pipes can be effective enablers of such controls in spaces with limited façade daylight.
Beyond energy efficiency, daylighting contributes to visual comfort and occupant health. Several recent studies highlight that increased exposure to natural light spectra supports circadian regulation and may improve productivity and well-being in offices, schools, and healthcare settings [5]. Such non-energy benefits reinforce daylighting’s role as a core component of high-performance building design. However, realizing these advantages requires careful system integration, since performance outcomes depend on context-specific interactions between daylight variability, user behavior, and control logic [6].
In parallel, the intersection between daylighting and environmental assessment has gained increasing scholarly attention. While adaptive lighting systems’ operational energy savings are well documented, their broader life-cycle performance remains underexplored [7]. LCA, standardized under ISO 14040/14044 [8,9], provides a comprehensive framework with which to evaluate environmental impacts from resource extraction and manufacturing to use and end-of-life. Applied to lighting, LCA captures trade-offs that operational studies overlook. For instance, while LEDs and smart control devices reduce electricity demand, their production and electronic components are embodied burdens. Environmental balance thus depends on operational reductions and system lifetime, grid carbon intensity, and replacement cycles [10].
The case of light pipes illustrates this duality. Although their embodied impacts are relatively low compared to active daylighting technologies, installation materials, and manufacturing still contribute to life-cycle burdens. Nonetheless, recent studies indicate that operational carbon savings typically outweigh these embodied costs within a short payback period, provided systems are designed and installed effectively [11]. This suggests that informed life-cycle assessments are crucial to verifying the long-term value of daylighting technologies.
A key methodological challenge lies in representing the dynamic operation of adaptive daylighting systems. Unlike conventional lighting, which can be modeled based on fixed schedules or power ratings, smart systems interact with variable daylight levels, occupancy, and control strategies. Consequently, the quality and granularity of input data are decisive for reliable assessments. Many LCA lighting studies rely on simulations or average duty cycles, which fail to capture spatiotemporal variability. In contrast, measured illuminance datasets, capturing real-time indoor and outdoor levels, provide an empirical foundation for defining operational scenarios and quantifying actual energy use [11,12,13]. This measurement-based approach enhances the credibility of environmental evaluations by grounding them in observed conditions rather than theoretical assumptions.
The present study builds on these developments by combining real-world illuminance monitoring with life-cycle modeling. A windowless laboratory room with a sun-pipe and dimmable luminaires serves as the experimental context. Two scenarios are compared: (i) a constant baseline supplying a fixed illuminance target, and (ii) a daylight-aware strategy supplementing only the measured deficit. Indoor illuminance is captured through calibrated sensors, with occupancy data contextualizing operational relevance. Time-stamped data streams are processed into energy profiles, which are then converted to environmental indicators using grid-specific emission factors.
This study offers two key contributions. First, it establishes a reproducible pipeline that can be adapted to similar building technologies, from physical daylight availability through illuminance monitoring to energy and LCA outcomes. Second, it demonstrates how empirical data sharpen life-cycle assessments by capturing variability in daylight contribution and system behavior. Beyond energy savings, this study considers broader categories such as global warming potential, resource depletion, and human health, positioning smart daylighting as a critical element in comprehensive sustainability strategies. In summary, daylighting through devices such as sun-pipes represents a promising pathway for reducing the energy demand of buildings and enhancing occupant well-being. Yet its environmental value can only be understood through comprehensive life-cycle analysis informed by empirical data. By integrating measured illuminance with LCA, the present study provides an evidence-based framework for evaluating the actual sustainability outcomes of adaptive daylighting strategies in deep-plan or windowless spaces.
1.1. Daylighting and Energy Efficiency in Buildings
Conventional lighting systems are often based on fixed illuminance set points and rigid operating schedules, which limit their ability to respond to daylight variability. Contemporary studies emphasize that such approaches lead to inefficiencies, particularly in spaces with good solar access [14]. Properly integrated daylighting strategies can substantially reduce reliance on electric lighting while enhancing occupant comfort and visual quality.
Recent evaluations have demonstrated that daylight-responsive controls can significantly reduce electricity demand, although the extent of savings varies by climate, façade design, and user interaction [15]. The U.S. Department of Energy and international frameworks highlight daylighting as a cornerstone of high-performance building design, where energy efficiency and user well-being are central.
In this context, tubular daylight guidance systems (TDGS), known as light pipes or sun-pipes, have gained attention as passive devices that capture zenithal light and deliver it to interior zones. Systematic reviews and simulation studies confirm their potential for improving indoor illuminance distribution and lowering lighting energy demand, with performance sensitive to geometry, reflectance, and sky conditions. Case studies further indicate that when TDGS are paired with dimming or occupancy-based controls, predicted daylight gains translate into measurable reductions in electric lighting demand [16,17,18].
Two insights emerge consistently from the literature: (i) daylight availability is dynamic, fluctuating hourly and seasonally, which calls for adaptive control strategies rather than static set-points; and (ii) technologies such as light pipes are effective enablers of daylight integration in deep-plan or perimeter-poor spaces [7,19]. Building on these principles, the present study employs measured indoor–outdoor illuminance data to evaluate how an adaptive, daylight-aware control strategy shifts operational lighting energy demand, providing a foundation for linking these shifts to life-cycle environmental outcomes.
1.2. Life Cycle Assessment in Lighting Research
Life cycle assessment, as defined by ISO 14040/14044, provides a structured approach to evaluate environmental burdens across a product system’s full life span, from raw material extraction through use and end-of-life. In the context of lighting, LCA extends beyond operational energy demand to include the embodied impacts of luminaires, drivers, control equipment, and maintenance practices, thus offering a broader system perspective compared to energy-only analyses [20].
Empirical studies over the past decade show that while light-emitting diodes (LEDs) may exhibit higher impacts in the manufacturing stage relative to incandescent or compact fluorescent lamps (CFLs), their long service life and efficacy generally reduce overall life-cycle burdens [21]. More recent work has expanded the boundary to lighting systems, including luminaires and smart controls, demonstrating that outcomes depend highly on electricity grid intensity, replacement cycles, and real-world operating conditions [22]. These findings highlight the limitations of relying solely on nominal specifications and reinforce the need for empirical operating data.
Evidence on adaptive or “smart” lighting remains relatively limited. Initial assessments suggest that while dimming and daylight-aware strategies can reduce electricity use, the additional materials and electronics may offset some benefits if not carefully managed [17]. A consistent recommendation across studies is the integration of measured illuminance, occupancy, and dimming profiles rather than idealized schedules to enhance the accuracy of use-phase assessments [23].
The present study follows this trajectory by linking measured hourly illuminance from a sun-pipe laboratory to an LCA focused on the use phase. Two control strategies are compared: a constant set-point baseline and a daylight-aware approach compensating only for the measured deficit from target illuminance. Energy demand derived from these profiles is translated to climate impact through a grid-specific emission factor, offering a transparent method for quantifying the life-cycle implications of daylight-responsive lighting.
1.3. Integrating Measured Illuminance Data in LCA
Most LCA lighting systems still rely on assumed usage schedules or simulation-derived estimates. While tools such as Radiance or DIALux provide detailed daylighting simulations, they often smooth out real variability linked to weather, user presence, or building geometry. Incorporating measured illuminance data addresses this limitation by grounding models in observed conditions. Empirical monitoring captures temporal fluctuations and space-specific transfer characteristics that simulations may miss, reducing uncertainty in energy-to-impact translation [20,24].
In recent years, studies have demonstrated that sensor-based monitoring can enhance the accuracy of building performance evaluations. For example [25], applied monitored lighting data in hybrid simulation–measurement frameworks, showing that empirical inputs improved predictions of actual electricity demand. Similar approaches in daylighting research underline that measured profiles better capture occupancy patterns and dimming behavior compared to static assumptions. This is particularly important for smart lighting since control responses depend on dynamic thresholds and daylight availability.
In this study, high-frequency illuminance monitoring provides the foundation for scenario definition: a baseline constant-target case versus a DAAC case. Using measured indoor illuminance, supplemented by occupancy detection, ensures that modeled energy demand reflects actual operating conditions. This empirical anchoring strengthens the internal consistency of LCA models and their external validity across weather and seasonal contexts. Integrating measured illuminance data into LCA moves lighting sustainability research toward more evidence-based, reproducible, and context-sensitive evaluation frameworks.
1.4. Smart Systems, Control Algorithms, and Environmental Implications
Increasingly sophisticated control strategies have marked the evolution of smart lighting systems. Early implementations were based on simple threshold logic, whereas recent developments integrate predictive algorithms, fuzzy logic, and machine learning to balance comfort and efficiency dynamically [22]. Reinforcement learning and AI-based controls can now anticipate occupancy and daylight availability, yielding substantial energy savings in testbeds and real-world deployments [26,27].
However, the environmental implications of these advanced systems extend beyond operational energy savings. The inclusion of sensors, controllers, and communication modules introduces embodied impacts that must be considered in full system assessments. Studies have emphasized that digital infrastructure carries material burdens, rare-earth dependencies, and end-of-life challenges that may offset some use-phase benefits [28]. For example, while sensor-driven dimming may cut lighting energy by 20–40%, the embodied footprint of electronics can influence payback periods and life-cycle trade-offs.
Therefore, smart systems require a dual perspective: while control intelligence enhances efficiency, sustainability assessments must balance operational reductions against added hardware impacts. LCAs that explicitly account for control electronics and communication modules reveal that net environmental benefits depend on system longevity and genuine electricity reduction [29]. This study acknowledges those trade-offs by focusing on measured operational savings while situating them within a life-cycle framework that includes the environmental costs of additional control infrastructure.
1.5. Research Gaps and Contribution of the Present Study
Despite rapid advances in smart daylighting research, a critical gap persists between performance-based evaluations and environmental impact modeling. Most LCA studies rely on assumed schedules, while performance monitoring studies rarely translate measured outcomes into ecological metrics. This disconnect limits the capacity of stakeholders to evaluate smart lighting solutions from both energy and sustainability perspectives [7,30].
Recent scholarship emphasizes integrating high-resolution, site-specific monitoring into broader sustainability frameworks. Empirical data allows for scenario-based comparisons reflecting local daylight variability, occupancy patterns, and user interactions—factors strongly influencing lighting demand [31]. Yet relatively few studies have systematically coupled such data with LCAs of lighting systems.
The present study responds to this gap by embedding measured illuminance and occupancy data into a life-cycle framework for evaluating constant-target and daylight-aware scenarios. This methodology quantifies operational energy differences with high fidelity and translates them into environmental metrics such as global warming potential and resource depletion. The work advances methodological rigor and supports more reliable decision-making by explicitly connecting empirical monitoring to life-cycle outcomes.
The contribution of this study lies in developing a replicable, measurement-driven pipeline that bridges energy performance and environmental assessment. It demonstrates how empirical datasets can reduce uncertainties in LCA and clarifies the trade-offs of daylight-aware strategies under realistic conditions. This approach aligns with current calls in sustainable architecture and environmental engineering for data-rich, context-sensitive evaluation frameworks, offering actionable insights for designers, facility managers, and policymakers pursuing low-impact lighting strategies.
2. Materials and Methods
The methodological framework of this study was designed to establish a transparent and reproducible link between real-world daylight measurements, lighting energy use, and life-cycle environmental impacts. An experimental setup combining a tubular daylighting device, photometric sensors, and a data acquisition system was implemented in a controlled laboratory environment to achieve this. The collected illuminance data were processed to develop baseline and smart control scenarios, which were then translated into energy demand and evaluated within an LCA framework. By grounding the analysis in empirical observations, the methodology offers a structured framework to quantify the environmental implications of daylight-assisted lighting systems.
2.1. Measurement Data and Experimental Setup
This study establishes an end-to-end pipeline from daylight measurement to environmental impact analysis. The experimental setup was located in a windowless laboratory room (4.19 × 3.75 × 2.90 m) with light-colored surfaces to minimize absorption. Daylight was introduced through a vertical tubular daylighting device (light pipe) with a length of 105 cm and a diameter of 33 cm, featuring a highly reflective lining (≥98%) and standard dome/diffuser components. This configuration was selected to ensure robust daylight transmission into the room while minimizing optical losses. For periods of insufficient daylight, dimmable 2 × 36 W fluorescent luminaires were installed to maintain target illuminance levels.
Indoor illuminance was measured using an industrial Deltaohm HD2021T (Pentaotomasyon, Deltaohm, Padova (PD), Italy) sensor (0–20 klx range, 4–20 mA analog output), positioned near the task plane to capture representative lighting conditions. An overhead occupancy sensor recorded presence events to contextualize when illuminance levels were operationally relevant. Signals were digitized using an Advantech PCI-1711S data acquisition (DAQ) card connected via an ADAM-3968 terminal, providing synchronized analog/digital channels for measurement and control. Data streams were logged on a PC at fixed intervals with time stamps. The same DAQ also provided 1–10 V analog outputs wired to dimmable electronic ballasts, enabling integration of measured illuminance into active control scenarios. The 300 lx target was adopted as a representative task-plane threshold for laboratories/classrooms, consistent with common practice, and is explicitly parameterized in our pipeline to support alternative targets [32,33].
Raw data files, originally stored in multiple Excel sheets (January–May), were combined during preprocessing. The “clean & merge” procedure resolved decimal/label inconsistencies, removed outliers, and interpolated missing values. All records were resampled to hourly resolution and standardized into the following fields: Time, Indoor_Lux (Eₘ), Outdoor_Lux, Weather (categorical), Month, Source_File. Outdoor illuminance and meteorological data were aligned on the same hourly time base, enabling direct analysis of indoor–outdoor relationships under varying sky conditions.
Figure 1 schematically illustrates the experimental system: daylight captured by the roof-level collector and transmitted via the light pipe is monitored at the task plane using sensors. Signals are processed through a DAQ, logged onto a PC, cleaned, and merged into standardized time series. The illuminance deficit ΔE+ is derived, energy use is calculated for baseline and smart scenarios, and the resulting values are mapped to life cycle impacts in the use phase. Other life-cycle stages (manufacture, transport, end-of-life) are shown as fixed boundary conditions.
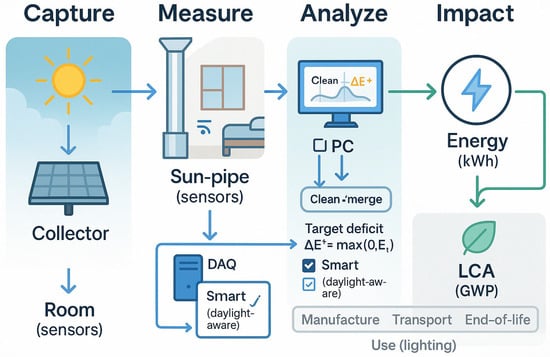
Figure 1.
Measurement-to-LCA diagram for daylight-assisted lighting.
Figure 2 presents the step-by-step logic of the intelligent control strategy applied in this study. The process begins with continuously measuring indoor illuminance (Eₘ), followed by a decision check against the defined threshold of 300 lx. When daylight levels meet or exceed this threshold, the luminaire remains switched off, preventing unnecessary electricity use. If the measured illuminance is lower than the target, the deficit (ΔE = Eₜ − Eₘ) is calculated, and the luminaire output is linearly dimmed according to the efficiency factor (η). The final lighting power demand is then directed into the LCA stage, providing a clear and reproducible connection between real-time control actions and environmental impact evaluation.
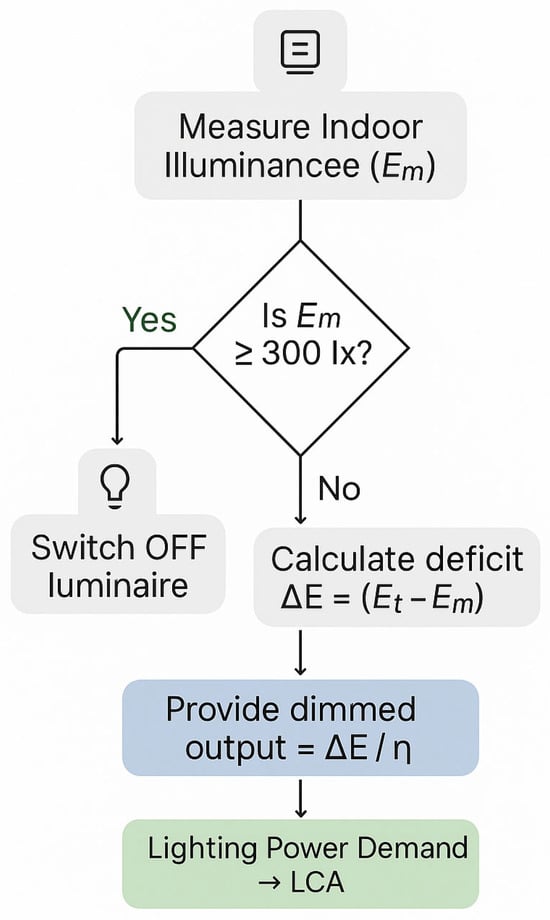
Figure 2.
Flowchart of the intelligent DAAC algorithm.
This measurement architecture establishes a reproducible and transparent chain from physical daylight availability to energy demand and environmental impact, providing a robust basis for scenario analysis.
2.2. Life Cycle Assessment Framework and Mathematical Background
An attributional LCA framework was adopted in line with ISO 14040/14044 standards to evaluate the environmental implications of the proposed daylight-aware lighting strategy. The functional unit was a one-room-day lighting service at the specified target illuminance. The analysis primarily focused on the use phase, representing the dominant contributor to environmental impacts. At the same time, upstream (manufacturing and transport) and downstream (end-of-life) processes were included as fixed background conditions. Auxiliary components such as sensors and controllers were included within the background processes of the LCA using Ecoinvent datasets. Their embodied impacts are relatively minor compared to operational electricity demand but were accounted for to ensure completeness of the system boundaries. Environmental modeling was performed using openLCA in combination with the Ecoinvent database, ensuring consistency with widely accepted LCA practices. The IPCC 2013 GWP (Global Warming Potential) 100a method was applied for impact assessment, translating electricity demand into life-cycle greenhouse gas emissions (kg CO2-eq) based on regional grid emission factors. This setup directly links measured illuminance-driven energy demand and life-cycle environmental outcomes. A mathematical formulation linking illuminance deficit, lighting energy demand, and life-cycle impacts is presented below.
The starting point is the illuminance deficit, representing the difference between the desired target illuminance Et and the measured indoor illuminance Em(t). This is expressed in Equation (1) as:
Equation (1) ensures that artificial lighting only supplements the illuminance not provided by daylight, avoiding over-illumination.
The required luminous flux Φ(t) is then calculated by multiplying the illuminance demand X(t) by the illuminated area A, as shown in Equation (2):
where A is the illuminated area. The corresponding electrical power is then obtained using luminaire efficacy η, as given in Equation (3):
Equation (3) provides the basis for computing lighting power under different operating scenarios. Power demand for the two scenarios can be directly obtained from this formulation. In the Base scenario, the system continuously maintains the fixed illuminance target, whereas only the deficit is met in the Smart scenario. This distinction is represented in Equation (4) [34,35,36].
Using these expressions, the hourly energy consumption is calculated by integrating power over time and normalizing to kWh, as shown in Equation (5):
This formulation captures temporal variations in demand and allows aggregation at daily, monthly, or weather-specific scales.
Relative energy savings are then quantified as the percentage reduction in the Smart scenario compared to the Base case, given in Equation (6):
Equation (6) enables a normalized comparison across temporal and meteorological conditions, independent of absolute energy demand levels [7,36].
For the environmental assessment, energy consumption is linked to carbon intensity through the grid emission factor fgrid. The resulting life cycle impacts of each scenario are expressed in Equations (7) and (8). The workflow is fully parameterized to different contexts: the grid factor (fgrid) captures region-specific carbon intensity; target illuminance, illuminated area, luminaire efficacy, and occupancy patterns reflect building typology and use. The savings curves presented later (Section 3) exemplify how the framework generalizes beyond the present case.
Finally, the environmental benefit of DAAC is given by the difference between the two scenarios, as shown in Equation (9):
Equation (9) highlights the absolute reduction in greenhouse gas emissions achieved by adopting adaptive control, providing a direct environmental performance metric. Together, Equations (1)–(9) form a consistent framework that links measured illuminance to energy demand, and subsequently to life-cycle impacts [7,35].
3. Results
The results presented in this section provide a comprehensive evaluation of how the proposed daylight-aware lighting control influences both energy performance and environmental outcomes. The analysis captures the tangible benefits of adaptive control by systematically comparing the base scenario, which relies on constant artificial lighting, with the smart scenario, which dynamically integrates daylight contribution. The findings quantify electricity savings across different temporal and meteorological conditions and extend the assessment to life cycle impacts, thereby linking operational improvements with long-term environmental significance. This evidence-based approach highlights the practical and policy relevance of daylight-integrated strategies, demonstrating their potential to reduce energy demand, mitigate carbon emissions, and enhance the sustainability of lighting design in real-world applications.
Figure 3 condenses the measured illuminance statistics into two complementary dual-axis views to aid like-for-like interpretation across different magnitudes. Left panel: indoor illuminance (lx) is shown as bars with a thin line overlay to emphasize the month-to-month trend; the right y-axis (orange) plots the corresponding outdoor daylight as a line (shown in ×104 lx/klx), highlighting the large dynamic range between indoor and outdoor levels.
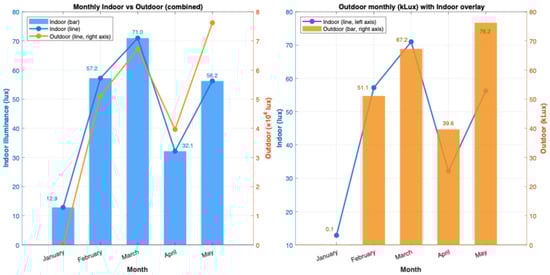
Figure 3.
Monthly indoor illuminance vs. outdoor daylight (dual-axis composite, Jan–May).
Right panel: The mapping is inverted, and indoor becomes the line on the left y-axis (lx). At the same time, the outdoor envelope appears as klx bars on the right y-axis, making it easier to read the outdoor seasonal envelope without obscuring indoor variability. Across both panels, the patterns are consistent: indoor levels broadly track the seasonal daylight signal (low in January, higher in February–March, a dip in April, and recovery in May), but at a strongly attenuated scale governed by the room geometry and light-pipe transmission. This composite view is used in the paper to justify the two operating scenarios (constant-set-point vs. daylight-aware control) and to support subsequent energy and LCA calculations by linking monthly indoor demand to the available outdoor resource while being explicit about the differing axes and units.
Figure 4 presents a scatter plot of measured indoor illuminance against concurrent outdoor illuminance, with a fitted regression line highlighting the overall trend. The figure illustrates the transfer efficiency of the light pipe system, showing how increases in exterior daylight levels are partially transmitted to the interior workspace. While the relationship is generally positive, the dispersion of data points around the regression line reflects the influence of optical and geometric factors, such as duct reflectance, diffuser scattering, and seasonal sky conditions, which introduce variability into the indoor response. This analysis is important for quantifying the daylight contribution available at the task plane and informing the subsequent estimation of artificial lighting demand in baseline and smart control scenarios.
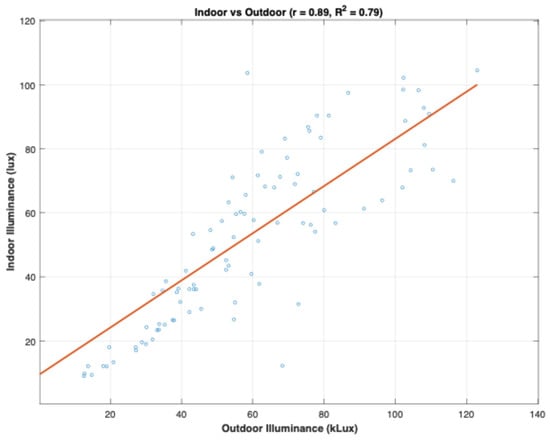
Figure 4.
Relationship between outdoor and indoor illuminance in the test room with sun-pipe integration.
Figure 5 presents the monthly variation in indoor illuminance levels measured in the test room, clearly demonstrating how daylight captured via the sun-pipe fluctuates throughout the January–May monitoring period. The boxplots display the median, interquartile range, and variability of the data, underscoring the sensitivity of indoor lighting conditions to seasonal and weather-related changes in outdoor daylight. Notably, March and May show higher median and upper illuminance values, corresponding to longer daylight durations and clearer skies. In contrast, January and April exhibit lower lighting levels, likely due to reduced solar radiation and more frequent cloud cover. Isolated outliers reflect brief anomalies in atmospheric conditions. This figure is instrumental in identifying periods when natural daylight is sufficient to meet the task-plane illuminance target and when supplemental electric lighting is necessary, forming the empirical foundation for energy demand estimation within the LCA framework.
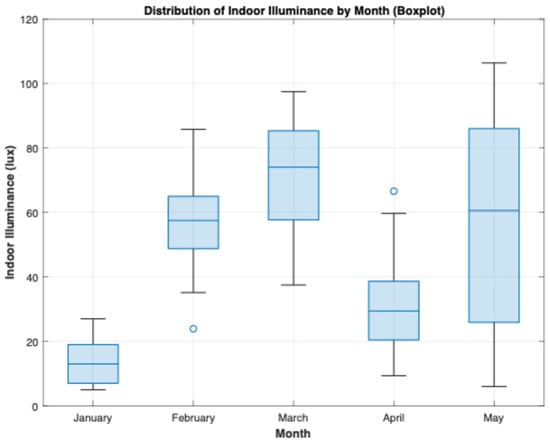
Figure 5.
Monthly variation in indoor illuminance levels measured under sun-pipe operation.
Table 1 presents the cumulative probability distribution of indoor illuminance levels across different months (January–May). Each column shows the probability that indoor illuminance is less than or equal to a given threshold (lx). For example, in January, the illuminance is around 85% of the time below 30 lx, while in May this probability is much lower, reflecting the higher daylight availability. This tabular format provides a clear numerical summary of the distribution shown in the cumulative distribution graph, enabling more precise comparisons between months and supporting further quantitative analysis.

Table 1.
Cumulative probability of indoor illuminance levels by month.
Figure 6 shows the variation in energy savings achieved by the Smart (daylight-aware) control strategy compared with the constant set-point baseline, expressed as a function of the target illuminance level. Across all months, savings decrease as the target illuminance increases, since higher set-points require greater reliance on electric lighting even when daylight is available. The monthly curves highlight seasonal differences: savings are largest in February and March, when daylight penetration from the sun-pipe is relatively strong, while January and April show lower gains due to weaker or less consistent daylight availability. The bold line indicates the mean savings across the five monitored months, demonstrating a clear inverse relationship between target illuminance and achievable savings. This figure is particularly useful for understanding the trade-off between visual comfort requirements and energy performance, and for identifying realistic target levels where DAAC provides measurable environmental benefits.
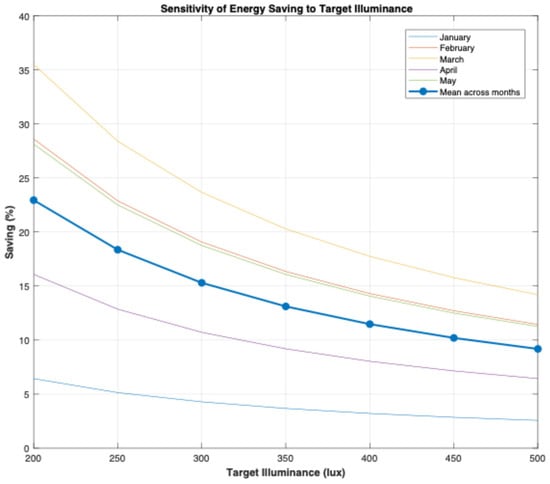
Figure 6.
Percentage savings from daylight-aware control as a function of target illuminance for different months.
Table 2 summarizes the use-phase CO2 emissions for the base and smart scenarios across a range of emission factors, together with the corresponding absolute savings and their uncertainty bounds. The base case reflects constant electric lighting operation, whereas the Smart case represents daylight-responsive control that supplements only the measured shortfall relative to the illuminance set-point. As expected, absolute savings increase approximately linearly with higher emission factors, highlighting the stronger environmental benefits of daylight integration in carbon-intensive grids. At the same time, even under low-carbon electricity mixes, measurable reductions are evident. Including Monte Carlo–derived 95% confidence intervals provides additional insight by capturing uncertainty in the predicted savings, moving beyond single-point estimates. Presenting the results in this format offers a transparent and comprehensive view of how both operational strategies perform under varying grid contexts, while demonstrating the Smart approach’s robustness across different boundary conditions. In addition to environmental results, approximate cost savings were estimated using regional tariffs, indicating a payback within less than two years (see Section 4).
Table 2.
Use-phase CO2 emissions and savings under different emission factors. (Relative reduction ~17% across grid factors due to proportional scaling.)
3.1. Energy and Savings
This section presents the comparative analysis of the two operational scenarios’ lighting energy demands. Monthly and weather-specific variations are highlighted to show how DAAC leverages natural light availability to reduce electricity use. The results quantify absolute energy consumption and relative savings, providing empirical evidence for the efficiency gains achieved through adaptive control. These findings form the foundation for linking operational improvements to broader environmental implications.
Figure 7 presents the monthly lighting energy demand and associated savings achieved through the smart (daylight-aware) strategy compared to the base (constant target) scenario. The upper panel shows the absolute energy consumption for each month, where the smart strategy consistently results in lower electricity use relative to the Base case. The lower panel illustrates the corresponding percentage savings, which vary according to seasonal daylight availability. The highest reductions are observed in March, followed by February and May, while January and April show comparatively lower gains. Together, these results highlight the sensitivity of daylight-assisted controls to seasonal variation, demonstrating both their technical feasibility and their potential for meaningful energy reductions in real-world operating conditions.
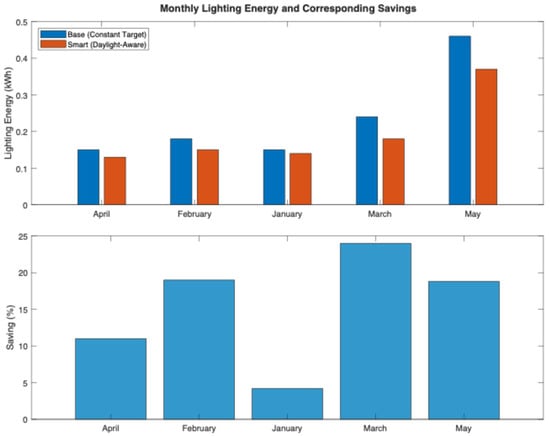
Figure 7.
Monthly lighting energy consumption and corresponding savings under base and smart scenarios.
Figure 8 illustrates how the performance of the Smart daylight-aware control strategy varies under different sky conditions. The highest savings are observed during clear or high daylight periods, where abundant natural light substantially reduces the need for electric lighting. Under partly cloudy or medium daylight, savings remain significant but lower due to intermittent reliance on artificial lighting.
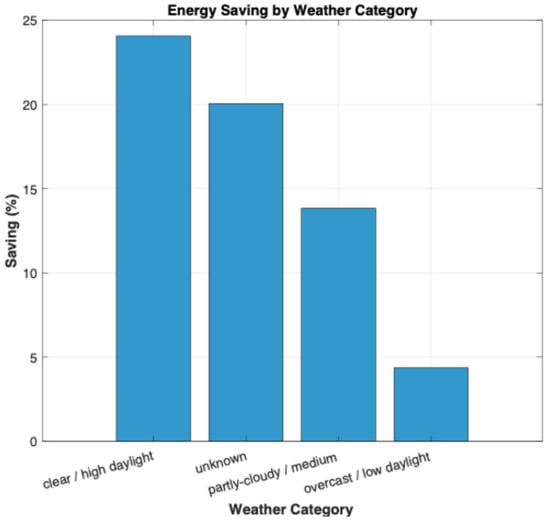
Figure 8.
Percentage energy savings of the smart scenario across different weather categories.
Overcast or low daylight conditions result in minimal benefits, as daylight contribution is insufficient to offset electric demand. The “unknown” category aggregates periods without explicit weather labeling and shows savings comparable to medium daylight conditions. Overall, the figure emphasizes that the effectiveness of daylight-responsive controls is strongly linked to external sky conditions, underscoring the need for location- and climate-specific evaluation when projecting real-world energy and environmental impacts. The measured savings align with ranges reported for daylight-integrated or adaptive systems. Simulation studies on light pipes have reported central illuminance up to ~179 lx without LCA coupling, while Fresnel-lens or fiber-based collectors demonstrate enhanced daylight capture and annual electricity reductions under adaptive control. By establishing a measurement-to-LCA pipeline, our observed mid-teens savings fall within (and help explain) literature-reported ranges while directly connecting performance to environmental outcomes.
3.2. Environmental Impacts (LCA)
The environmental consequences of energy savings are evaluated through a life cycle assessment framework. The analysis establishes how operational strategies influence climate-related burdens by translating measured electricity demand into greenhouse gas emissions using standardized grid emission factors. This section not only compares absolute and relative emission outcomes but also situates them within varying carbon-intensity contexts, offering insights into the robustness of DAAC under different regional energy mixes.
Figure 9 presents the monthly carbon dioxide emissions associated with lighting energy use under the base and smart control strategies, calculated using a fixed grid emission factor of 0.40 kg CO2/kWh. The results show a consistent reduction in emissions for the smart scenario compared to the base case, with the magnitude of savings varying across months. This variation reflects seasonal differences in daylight availability, which directly influences the extent to which the daylight-aware strategy offsets artificial lighting. The figure illustrates the direct link between operational energy reductions and environmental outcomes, emphasizing that smart control provides tangible emission savings that align with the temporal dynamics of daylight performance. This evidence supports the integration of real measured illuminance into LCA, enabling a more accurate assessment of environmental benefits relative to conventional constant-output lighting. As summarized in Table 2, absolute CO2 savings scale approximately linearly with the grid factor, whereas the relative reduction remains ~17% (95% CI: 15.7–18.3%), underscoring robustness across carbon-intensity contexts.
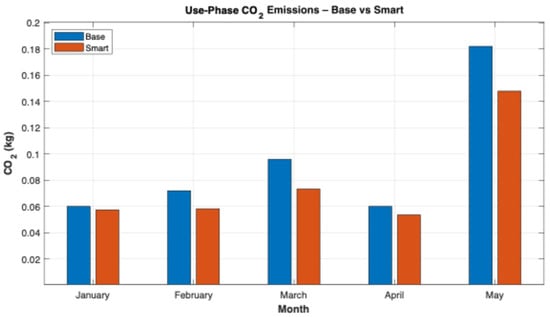
Figure 9.
Monthly use-phase CO2 emissions for base and smart scenarios.
Figure 10 shows the variation in indoor illuminance over a representative day, recorded through the light pipe system. The solid blue line represents measured task-plane illuminance (lx), while the dashed red lines indicate key reference hours that align with typical working periods. The plot illustrates the dynamic and highly variable nature of daylight delivery indoors, with illuminance levels fluctuating due to changing outdoor sky conditions and sun position. Periods of high daylight penetration alternate with intervals where supplementary electric lighting would be required to maintain target thresholds. This figure demonstrates the temporal variability that underpins the smart control approach, highlighting why measurement-driven strategies provide a more realistic basis for energy and emissions assessment compared to static assumptions.
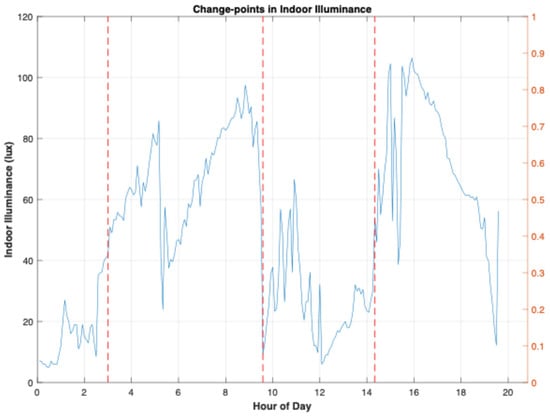
Figure 10.
Hourly indoor illuminance profile with daylight availability.
Figure 11 presents the probability distribution of overall energy savings (%) obtained from the smart lighting scenario, with the observed value highlighted by the red vertical line. The histogram illustrates the spread of possible outcomes derived through resampling, while the dashed black lines mark the 2.5th and 97.5th percentiles, providing a 95% confidence interval. This visualization conveys the central tendency and uncertainty around energy savings, showing that the observed reduction lies within the expected statistical range. By incorporating uncertainty analysis, the figure strengthens the reported savings’ reliability and highlights the measurement-based robustness of the ch’s robustness. Observed mean savings: 17%; 95% CI: 15.7–18.3% (vertical lines).
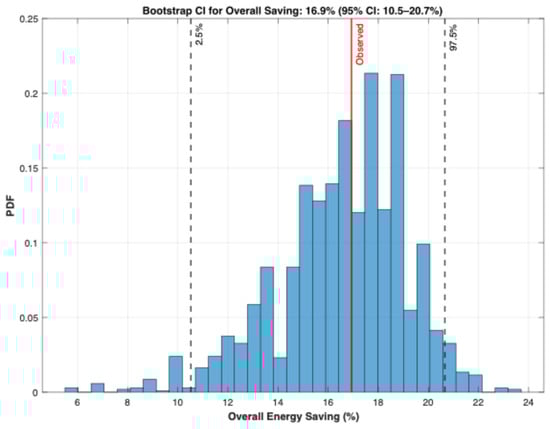
Figure 11.
Distribution of overall energy savings with confidence intervals.
Table 3 summarizes the extended life-cycle assessment results, including manufacturing, transportation, and end-of-life stages as fixed background processes based on Ecoinvent data. In addition to Global Warming Potential, the table reports Cumulative Energy Demand (CED) and Resource Depletion indicators for both Base and Smart scenarios. The results show that while embodied impacts from upstream and downstream stages contribute to the overall footprint, operational savings achieved through DAAC remain the dominant factor, leading to consistent reductions across all categories.
Table 3.
Life-cycle environmental impacts under Base and Smart scenarios (functional unit: one room-day of lighting service).
3.3. Sensitivity & Uncertainty
Given the inherent variability in building energy performance, sensitivity and uncertainty analyses were conducted to evaluate the robustness of the results. Key input parameters, such as target illuminance, luminaire efficacy, and grid emission factor, were systematically adjusted to explore their influence on energy consumption and environmental outcomes. To complement deterministic simulations, probabilistic methods were applied, offering a more nuanced view of expected performance under real-world variability and identifying the conditions under which benefits are maximized or diminished.
Figure 12 visualizes how indoor illuminance levels from the sun-pipe system fluctuate across different times of day and throughout the monitoring period from January to May. Each row in the heatmap corresponds to a specific month, while the color gradient indicates the average illuminance level at each hour. Seasonal patterns are clearly observable: in winter, daylight hours are shorter and illumination is concentrated in the early part of the day, whereas spring months benefit from extended daylight, yielding higher and more evenly distributed illuminance.
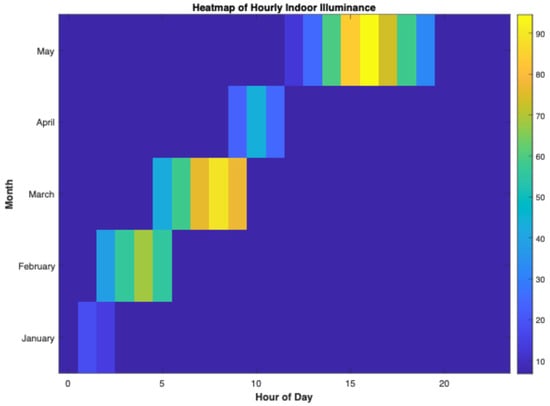
Figure 12.
Seasonal and diurnal patterns of indoor illuminance.
This representation provides insight into the temporal alignment between daylight availability and indoor lighting needs. It reveals specific windows, especially midday hours in late spring, when natural light alone can meet lighting requirements. Conversely, it also identifies periods such as early mornings in winter when artificial lighting becomes indispensable due to insufficient daylight. These insights are particularly valuable for designing adaptive lighting control systems that reduce electricity use by adjusting operation in response to daylight availability.
Beyond optimizing energy efficiency, the figure contributes to a broader understanding of occupant comfort and system responsiveness. By grounding design decisions in actual measured illuminance patterns, rather than assumptions or static values, the analysis supports more informed and context-sensitive lighting strategies. In doing so, it reinforces the role of daylight-aware design not just as a sustainability measure but also as an integral component of intelligent building performance.
Figure 13 shows the modeled relationship between outdoor horizontal illuminance and the predicted indoor illuminance provided by the light pipe system. The curve demonstrates a nonlinear response: at low outdoor levels, indoor illuminance increases gradually, then rises more steeply as outdoor values reach moderate ranges, before tapering off at higher levels due to system saturation. This behavior reflects the optical transmission characteristics of the device, including reflective losses and diffuser performance. The figure provides a predictive basis for estimating indoor lighting availability under varying sky conditions, which is essential for quantifying the potential contribution of daylight to reducing artificial lighting demand in real applications.
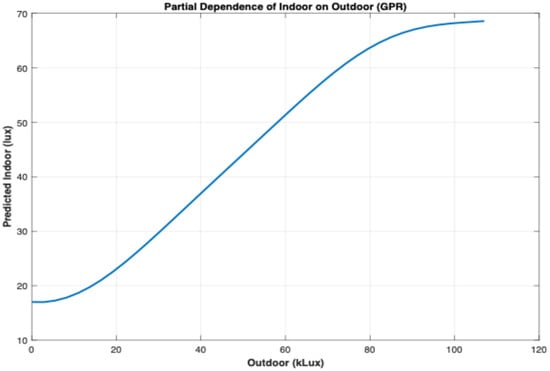
Figure 13.
Predicted indoor illuminance as a function of outdoor illuminance.
Figure 14 presents the normalized energy savings of daylight-aware lighting control across different months. The results show higher savings in winter (January–March), when artificial lighting demand is typically greater due to shorter daylight hours, and lower savings in spring (April–May), when daylight contribution is naturally higher. By normalizing the results, seasonal variability in usage is reduced, allowing a clearer comparison of the relative performance of the smart system. This figure highlights how the benefit of daylight-aware control is context-dependent, emphasizing its value during periods of limited daylight availability.
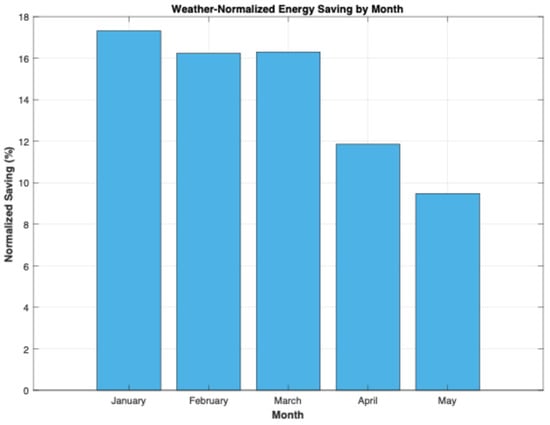
Figure 14.
Normalized monthly energy savings from daylight-aware control.
3.4. Implications for Design and Policy
Beyond the numerical outcomes, the findings carry practical implications for both building design and policy frameworks. From a design perspective, the results underscore the value of integrating daylight-aware controls into lighting systems to balance user comfort with energy efficiency. At the policy level, the demonstrated reductions in environmental impacts suggest that adaptive lighting can contribute meaningfully to broader decarbonization targets. This section synthesizes technical insights into actionable recommendations for stakeholders aiming to align building operations with sustainability goals.
Figure 15 illustrates the average hourly indoor illuminance levels provided by the sun-pipe system across different months, focusing on the daily variation in natural light availability. The profiles indicate that illuminance values generally rise during midday, peaking around 15:00 with a maximum recorded contribution of 94 lx. The dashed line marks the estimated target deficit relative to a 300 lx reference, highlighting the gap that artificial lighting must compensate for. By showing both temporal and seasonal variation, the figure emphasizes how daylight availability fluctuates throughout the year and throughout the day, providing insight into when DAAC strategies can most effectively reduce reliance on electric lighting.
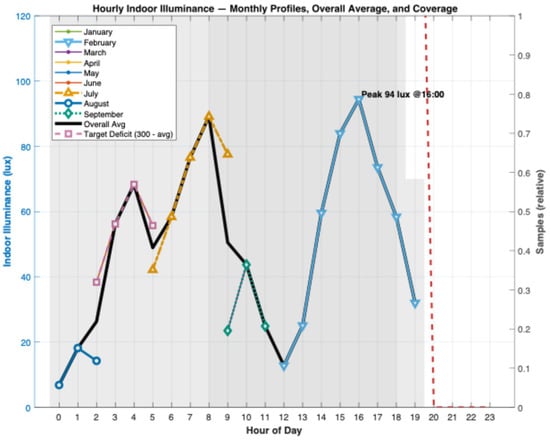
Figure 15.
Hourly indoor illuminance profiles and peak contribution from the light pipe system.
These observed temporal and seasonal patterns are consistent with broader findings in the literature, and complementary studies further reinforce these insights. Arun and Gopan emphasized that the systematic integration of daylight can provide additional benefits in terms of reduced energy consumption and CO2 emissions [37]. Likewise, Wagiri et al. demonstrated that multi-objective optimization of kinetic façade aperture ratios enables simultaneous control of daylight and solar radiation, thereby improving the balance between illuminance and heat gains [38]. Vaisi et al. highlighted that simulation-based metrics can effectively guide design improvements by offering quantitative support for daylighting decisions [39]. Similarly, Ma et al. showed that the combined use of shading devices, such as photovoltaic louvers and lighting control strategies, can deliver further savings and enhance daylighting performance [40]. Finally, Grazieschi et al. underscored that the embodied energy and carbon associated with building materials remain significant, reminding us that life-cycle impacts extend beyond the operational phase alone [41]. Taken together, these studies not only complement our empirical findings but also underline the broader significance of daylight-aware strategies for both operational efficiency and life-cycle sustainability. Building on this foundation, the following discussion situates our results within the wider body of research and highlights their implications for future design and policy frameworks.
4. Discussion
This study evaluated a smart daylighting system using a fully measurement-based approach and extended the analysis through a life cycle perspective. The results demonstrated that the daylight-aware control strategy consistently reduced lighting energy demand compared to a constant baseline, with savings varying according to seasonal daylight availability. These operational reductions translated into tangible life-cycle benefits, outweighing the embodied burdens of system components within a relatively short payback period of approximately 18–20 months. Such findings highlight the potential of integrating advanced daylighting technologies with environmental performance assessment for sustainable building applications. From a climate-adaptation perspective, benefits intensify in carbon-intensive grids or where daylight availability is seasonally constrained, while remaining tangible even under low-carbon mixes. In smart systems, embodied impacts from sensors/controllers must be balanced against use-phase reductions; our results indicate that the latter dominate within ~18–20 months, after which net environmental gains accrue. These findings support dynamic LCA approaches [11] and circularity-minded component choices [30] as policy-relevant levers for building decarbonization [42].
Previous research provides important context for interpreting these results. Simulation-based analyses by Paul et al. [14] showed that pipe diameter strongly influences illuminance distribution in office spaces, achieving central values of up to 179 lx without linking outcomes to environmental or life-cycle impacts. Similarly, Kaur et al. [16] and Shao et al. [43] advanced optical design strategies using Fresnel lenses and fiber systems, reporting enhanced daylight capture and adaptive control benefits. However, these studies remained limited to performance metrics. Bhattacharya et al. [44] contributed insights into classroom lighting by comparing conventional and modern solutions, confirming that LED and fluorescent systems achieved adequate illuminance levels (157–305 lx) at low cost, but again, without reference to daylight harvesting or environmental integration.
Empirical validations add further evidence. Machaca Gutierrez et al. [45] demonstrated that solar tube prototypes substantially increased classroom illuminance in high-altitude Andean contexts, meeting national standards under challenging conditions. Similarly, Al-Ashwal et al. [46] confirmed that architectural interventions such as light wells and balconies improved daylighting by 27–46% in tropical high-rise apartments. Beyond daylighting systems, Guo et al. [47] and Khadom et al. [48] explored thermal storage and solar heating strategies, respectively, reporting reductions in cooling demand and CO2 emissions. These contributions broaden the sustainability discourse but remain outside the direct scope of integrated daylighting–LCA frameworks. Complementary to these efforts, Ayoosu et al. [49] systematically reviewed daylighting assessment methodologies, underscoring the strengths and weaknesses of simulation, field measurements, physical modelling, and mathematical calculations, while calling for hybrid approaches that combine predictive accuracy with empirical grounding.
Compared with these studies, the present work aligns with reported energy savings (15–30%) but distinguishes itself directly establishing a measurement-to-LCA pipeline. By integrating empirical illuminance data with life-cycle and probabilistic analyses, this study addresses two gaps: first, the reliance on assumptions that often constrain simulation-driven approaches, and second, the lack of uncertainty characterization in performance evaluation. Providing confidence intervals rather than single-point estimates enhances the robustness of findings, offering a more realistic foundation for design and policy decisions.
Table 4 synthesizes these comparisons, highlighting how the present work contributes beyond prior research. Whereas earlier studies emphasized geometric optimization, optical innovations, or isolated empirical validations, the present study systematically bridges measured performance, environmental life-cycle outcomes, and uncertainty analysis. This integration advances methodological rigor and supports balanced decision-making by connecting technical performance with long-term sustainability impacts.
Table 4.
Comparative summary of daylighting and adaptive lighting studies.
5. Conclusions
This study assessed the performance of a smart daylighting control system implemented on a tubular daylighting device, emphasizing its energy-saving and environmental outcomes under real-world operating conditions. The findings revealed that indoor illuminance is closely tied to outdoor daylight levels, albeit with some non-linear transmission losses, which align with prior simulation-based studies. Seasonal dynamics significantly influenced performance, with higher daylight availability months yielding greater savings. Importantly, probabilistic analysis showed that meaningful reductions in electric lighting demands were still attainable even under suboptimal sky conditions.
When expressed in carbon terms, these reductions demonstrated that the system’s operational savings offset its embodied emissions within a relatively short timeframe. This reinforces the environmental value of daylight-aware controls from a full life-cycle perspective, moving the discussion beyond energy-only metrics. Additionally, by incorporating uncertainty and variability into the analysis through probabilistic methods, this study enhances the realism and applicability of its findings. Rather than relying on single-value performance estimates, it reflects the complexity that designers and building occupants face in real-world contexts.
Crucially, the results also highlight the dual contribution of the system: achieving statistically robust energy and CO2 reductions while delivering an operational payback of approximately 18–20 months under regional tariffs. This dual outcome underscores both the environmental and economic sustainability of daylight-aware lighting controls. Together, these results affirm the potential of smart daylighting systems as effective and reliable components of intelligent building design, offering actionable insights for both practitioners and policymakers pursuing low-impact, cost-effective building strategies.
Funding
This research received no external funding.
Institutional Review Board Statement
Not applicable.
Informed Consent Statement
Not applicable.
Data Availability Statement
The datasets generated during and/or analyzed during the current study are available from the corresponding author on reasonable request.
Conflicts of Interest
The author declares no conflicts of interest.
Abbreviations
The following abbreviations are used in this manuscript:
| CFL | Compact fluorescent lamp |
| DAQ | Data acquisition |
| ISO | International Organization for Standardization |
| LED | Light-emitting diode |
| LCA | Life cycle assessment |
| PCI | Peripheral component interconnect |
| TDD | Tubular daylighting devices |
| TDGS | Tubular daylighting guidance systems |
References
- Cui, D.; Zhao, H.Y.; Zhang, R. Approaching Zero-Carbon Development through Modular Construction: A Case Study of Healthcare Buildings in London. Indoor Built Environ. 2025, 34, 1404–1421. [Google Scholar] [CrossRef]
- Malet-Damour, B.; Bigot, D.; Boyer, H. Technological Review of Tubular Daylight Guide Systems from 1982 to 2020. Eur. J. Eng. Technol. Res. 2020, 5, 375–386. [Google Scholar] [CrossRef]
- Li, H.; Wu, D.; Zhou, J. Effects of Tubular Daylight Guidance Systems on the Daylighting Performance and Energy Savings in Office Buildings under Different Climate Zones. J. Renew. Sustain. Energy 2021, 13, 065102. [Google Scholar] [CrossRef]
- Li, H.; Wu, D.; Yuan, Y.; Zuo, L. Evaluation Methods of the Daylight Performance and Potential Energy Saving of Tubular Daylight Guide Systems: A Review. Indoor Built Environ. 2022, 31, 299–315. [Google Scholar] [CrossRef]
- He, S.; Zhang, W.; Guan, Y. The Impact of Building Windows on Occupant Well-Being: A Review Integrating Visual and Non-Visual Pathways with Multi-Objective Optimization. Buildings 2025, 15, 2577. [Google Scholar] [CrossRef]
- Anser, M.K.; Nassani, A.A.; Al-Aiban, K.M.; Zaman, K.; Haffar, M. Sustainable Urbanization Strategies: Mitigating Urban Heat Islands through Synergy Between Economic Choices, Renewable Energy Consumption, and Environmental Interventions. Probl. Ekorozwoju 2025, 20, 86–100. [Google Scholar] [CrossRef]
- Jahangir, M.H.; Aboutorabi, R.S.S. Life Cycle Evaluation of Smart Solar Windows Used in Buildings. In Life Cycle Costing. Environmental Footprints and Eco-Design of Products and Processes; Muthu, S.S., Ed.; Springer: Cham, Switzerland, 2025; pp. 103–138. [Google Scholar] [CrossRef]
- ISO 14040:2006; Environmental Management—Life Cycle Assessment—Principles and Framework. ISO/CIE: Geneva, Switzerland, 2006. Available online: https://www.iso.org/obp/ui/es/#iso:std:iso:14040:ed-2:v1:en (accessed on 13 September 2025).
- ISO 14044: 2006; Environmental Management—Life Cycle Assessment—Requirements and Guidelines. ISO/CIE: Geneva, Switzerland, 2006. Available online: https://www.iso.org/obp/ui/es/#iso:std:iso:14044:ed-1:v1:en (accessed on 13 September 2025).
- Pscherer, T.; Krommes, S. LCA Standards for Environmental Product Assessments in the Bioeconomy with a Focus on Biogenic Carbon: A Systematic Review. Int. J. Life Cycle Assess 2025, 30, 371–393. [Google Scholar] [CrossRef]
- Angelakoglou, K.; Lampropoulos, I.; Chatzigeorgiou, E.; Giourka, P.; Martinopoulos, G.; Skembris, A.S.; Nikolopoulos, N. Advancing Energy-Efficient Renovation through Dynamic Life Cycle Assessment and Costing: Insights and Experiences from VERIFY Tool Deployment. Energies 2025, 18, 3736. [Google Scholar] [CrossRef]
- Wu, R.; Wang, R.; Nian, Z.; Gu, J. Spatio-Temporal Variation and Decoupling Effects of Energy Carbon Footprint Based on Nighttime Light Data: Evidence from Counties in Northeast China. Atmos. Pollut. Res. 2025, 16, 102366. [Google Scholar] [CrossRef]
- Xiong, Y.; Sun, Y.; Yang, Y. Impact of Urban Green Space Patterns on Carbon Emissions: A Gray BP Neural Network and Geo-Detector Analysis. Sustainability 2025, 17, 7245. [Google Scholar] [CrossRef]
- Kharrat, R.R.; Perfetto, G.; Ingaramo, R.; Mutani, G. Optimizing- Building Performance with Dynamic Photovoltaic Shading Systems: A Comparative Analysis of Six Adaptive Designs. Smart Cities 2025, 8, 127. [Google Scholar] [CrossRef]
- Lin, Y.; Xu, L.; Yang, W.; Tian, L.; Chan, M. A Systematic Review on the Research and Development of Adaptive Buildings. Buildings 2025, 15, 1593. [Google Scholar] [CrossRef]
- Paul, S.; Chowdhury, S.; Joarder, M.A.R. Simulation of Daylight Using Different Diameter Light Pipes for Optimizing Daylighting in Office Buildings. Asian J. Curr. Res. 2025, 10, 28–44. [Google Scholar] [CrossRef]
- Akram, N.; Nadeem, G.; Malik, A.M.; Sher, F.; Zulfiqar, Z.; Tahir, S. Optimizing Daylight Using Passive Strategies: Light Shelves and Solar Tubes. Spectr. Eng. Sci. 2025, 3, 474–489. [Google Scholar]
- Kaur, K.; Rajagopalan, P.; Woo, J.; Garg, H. Harnessing Sunlight for Indoor Room Illuminance Using a Fresnel Lens-Based Daylighting System. Energy Build. 2025, 342, 115877. [Google Scholar] [CrossRef]
- Wu, X.; Wang, Y.; Deng, S.; Su, P. Climate-Responsive Design of Photovoltaic Façades in Hot Climates: Materials, Technologies, and Implementation Strategies. Buildings 2025, 15, 1648. [Google Scholar] [CrossRef]
- Conradi-Galnares, E.; Blandón-González, B.; Marrero-Meléndez, M. Life Cycle Assessment (LCA) Fundamental Principles. In Life Cycle Analysis Based on Nanoparticles Applied to the Construction Industry: A Comprehensive Curriculum; Springer Nature: Cham, Switzerland, 2025; pp. 27–41. [Google Scholar] [CrossRef]
- Naqvi, S.M.M.A.; Naeem, M.K.; Farooqi, Z.U. Technological Revolution and Retrofitting for Energy Efficiency. Contemp. J. Soc. Sci. Rev. 2025, 3, 1491–1495. [Google Scholar]
- Muslimin, N.A.; Mansor, N.N.; Mokhlis, H.; Abdullah, M.N.; Ramli, S.P. Lighting System Optimization, Components and Simulation Tools for Building Installations: A Review. IEEE Access 2025, 13, 160508–160535. [Google Scholar] [CrossRef]
- Jettanasen, C.; Thongsuk, S.; Sottiyaphai, C.; Songsukthawan, P.; Chiradeja, P.; Lertwanitrot, P.; Ngaopitakkul, A. An Approach to Energy Conservation in Lighting Systems Using Luminaire-Based Sensor for Automatic Dimming. Sci. Rep. 2025, 15, 3302. [Google Scholar] [CrossRef]
- Pandey, S.K.; Goyal, P.; Pandey, R.K.; Panigrahi, B.K. Energy Optimization in Consumer Lightings: An IoT-Based Adaptive Control Mode. IEEE Trans. Consum. Electron. 2025, 71, 2285–2296. [Google Scholar] [CrossRef]
- Lee, J.; Park, E.; Lee, S. Development of a Hybrid Modeling Framework for the Optimal Operation of Microgrids. Energies 2025, 18, 2102. [Google Scholar] [CrossRef]
- Lachgar, N.; Moutik, O.; Saikouk, H.; Tigani, S. Intelligent Automatic Lighting System Based on Deep Learning and Computer Vision. Euro-Mediterr. J. Environ. Integr. 2025, 10, 3119–3124. [Google Scholar] [CrossRef]
- Paolone, G.; Paesani, R.; Pilotti, F.; Camplone, J.; Piazza, A.; Di Felice, P. Smart Lighting Systems: State-of-the-Art in the Adoption of the EdgeML Computing Paradigm. Energies 2025, 17, 90. [Google Scholar] [CrossRef]
- Shankar, A.; Krishnasamy, V.; Chitti Babu, B. Smart LED Lighting System with Occupants’ Preference and Daylight Harvesting in Office Buildings. Energy Sources Part A Recover. Util. Environ. Eff. 2025, 47, 3966–3986. [Google Scholar] [CrossRef]
- Tajadod, O.E.; Ravanshadnia, M.; Ghanbari, M. Integrating Circular Economy and Life Cycle Assessment Strategies in Climate-Resilient Buildings: An Artificial Intelligence Approach to Enhance Thermal Comfort and Minimize CO2 Emissions in Iran. Energy 2025, 320, 135064. [Google Scholar] [CrossRef]
- Cerchione, R.; Morelli, M.; Passaro, R.; Quinto, I. A Critical Analysis of the Integration of Life Cycle Methods and Quantitative Methods for Sustainability Assessment. Corp. Soc. Responsib. Environ. Manag. 2025, 32, 1508–1544. [Google Scholar] [CrossRef]
- Jouane, Y.; Abouelaziz, I.; Saddik, I.; Oussous, O. Lightweight Deep Learning for Photovoltaic Energy Prediction: Optimizing Decarbonization in Winter Houses. Sol. Energy 2025, 297, 113567. [Google Scholar] [CrossRef]
- ISO 8995-1:2002(E); Lighting of Work Places—Part 1: Indoor. ISO/CIE: Geneva, Switzerland, 2002. Available online: https://www.iso.org/obp/ui/es/#iso:std:iso-cie:8995:-1:ed-1:v1:en (accessed on 14 September 2025).
- Nicolini, E. Built Environment and Wellbeing—Standards, Multi-Criteria Evaluation Methods, Certifications. Sustainability 2022, 14, 4754. [Google Scholar] [CrossRef]
- Cumo, F.; Pennacchia, E.; Sferra, A.S. Sustainability in Public Lighting: The Methodology for Identifying Environmentally Optimal Solutions in Replacement Planning—A Case Study. Energies 2025, 18, 535. [Google Scholar] [CrossRef]
- Shokouhi, S.; Weidlich, I. An LCA Study of Various Office Building Shapes Focusing on Operational Energy—A Case of Hamburg. Sustainability 2025, 17, 1659. [Google Scholar] [CrossRef]
- Kassar, R.E.; Takash, A.A.; Rassy, E.E.; Hammoud, M.; Py, X. Comparative Life Cycle Assessment of Inorganic and Organic PCM-Based Thermal Management in Photovoltaic Systems: A Case Study in Lebanon. In Proceedings of the 2025 IEEE 19th International Conference on Compatibility, Power Electronics and Power Engineering (CPE-POWERENG), Antalya, Türkiye, 20–22 May 2025; IEEE: Antalya, Türkiye, 2025; pp. 1–6. [Google Scholar] [CrossRef]
- Arun, M.; Gopan, G. Effects of Natural Light on Improving the Lighting and Energy Efficiency of Buildings: Toward Low Energy Consumption and CO2 Emission. Int. J. Low-Carbon Technol. 2025, 20, 1047–1056. [Google Scholar] [CrossRef]
- Wagiri, F.; Shih, S.G.; Harsono, K.; Wijaya, D.C. Multi-Objective Optimization of Kinetic Façade Aperture Ratios for Daylight and Solar Radiation Control. J. Build. Phys. 2024, 47, 355–385. [Google Scholar] [CrossRef]
- Vaisi, S.; Modares Gorji, H.; Shafei, N. Application of Simulation-Based Metrics to Improve the Daylight Performance of a Secondary School: An Approach for Green Building Designers and Architects. Adv. Environ. Eng. Res. 2024, 5, 12. [Google Scholar] [CrossRef]
- Ma, Q.; Ran, S.; Chen, X.; Li, L.; Gao, W.; Wei, X. Study on the effect of photovoltaic louver shading and lighting control system on building energy consumption and daylighting. Energy Sources A Recovery Util. Environ. Eff. 2023, 45, 10873–10889. [Google Scholar] [CrossRef]
- Grazieschi, G.; Asdrubali, F.; Thomas, G. Embodied Energy and Carbon of Building Insulating Materials: A Critical Review. Clean. Environ. Syst. 2021, 2, 100032. [Google Scholar] [CrossRef]
- Liang, Y.; Li, C.; Liu, Z.; Wang, X.; Zeng, F.; Yuan, X.; Pan, Y. Decarbonization Potentials of the Embodied Energy Use and Operational Process in Buildings: A Review from the Life-Cycle Perspective. Heliyon 2023, 9, e20190. [Google Scholar] [CrossRef]
- Shao, Z.; Liu, Z.; Ma, X.; Chen, X.; Chen, Z.; Sun, L. Advancing on a Dynamic Solar-Concentrated Fiber Daylighting System to Achieve Stable Light Environment for Underground Spaces. Build. Environ. 2025, 285, 113617. [Google Scholar] [CrossRef]
- Bhattacharya, S.; Bhattacharya, S.; Das, A.; Mahata, S.; Biswas, S. Evaluation of Candidate Lighting Solutions for a Model Medical College Classroom and Insights for Lighting System Design in Educational Institutions. Facilities 2025, 43, 397–415. [Google Scholar] [CrossRef]
- Machaca Gutierrez, K.D.; Apaza Salgado, D.P.; Marín Mamani, G. Evaluation of Lighting Factors That Influence Energy Efficiency for the Design of Educational Spaces on the University Campus of the UNA, Puno. Multidiscip. Sci. J. 2024, 7, 2025284. [Google Scholar] [CrossRef]
- Al-Ashwal, N.T.; Lim, Y.-W.; Dalumo, D.B.; Leng, P.C. Enhancing Daylighting Performance in Tropical High-Rise Apartments: Evaluating the Impact of Light Wells, Balconies, and Glazing Strategies. Archit. Eng. Des. Manag. 2025, 1–22. [Google Scholar] [CrossRef]
- Guo, J.; Tan, C.; Zhang, Z.; Zhao, W.; Li, M.; Zhang, K.; Wang, Z. Experimental and Numerical Study on Thermal Performance of Energy Storage Interior Wall with Phase Change Materials. Energy Build. 2025, 326, 115074. [Google Scholar] [CrossRef]
- Khadom, A.A.; Mahood, H.B.; Mahmmod, A.A.; Hassan, Q.; Kazem, H.A. Improving Solar Water Heating Performance and Reducing Emissions by Evacuated Tube Collectors with Preheating Units: Iraq as a Case Study. Appl. Therm. Eng. 2025, 265, 125596. [Google Scholar] [CrossRef]
- Ayoosu, M.I.; Utsaha, A.L.; Gabriel, K.E.; Vishigh, A.M.M.; Tuleun, M.E.; Sen, I.G. Daylighting Performance Assessment: A Review of Methodologies. Path Sci. Int. Electron. Sci. J. 2025, 11, 113–116. [Google Scholar] [CrossRef]
- Jeon, H.S.; Yeon, S.H.; Park, J.K.; Kim, M.H.; Yoon, Y.; Kim, C.H.; Lee, K.H. ANN-Based Solar Thermal Energy Forecasting Model and Its Heating Energy Saving Effect through Thermal Storage. Appl. Therm. Eng. 2025, 267, 125740. [Google Scholar] [CrossRef]
- Kaur, K.; Rajagopalan, P.; Woo, J.; Garg, H. Utilizing Natural Illuminance through Indoor Daylighting Systems for Green Buildings. In Proceedings of the 23rd CIB World Building Congress, West Lafayette, IN, USA, 19–23 May 2025; Available online: https://docs.lib.purdue.edu/cib-conferences (accessed on 8 September 2025).
Disclaimer/Publisher’s Note: The statements, opinions and data contained in all publications are solely those of the individual author(s) and contributor(s) and not of MDPI and/or the editor(s). MDPI and/or the editor(s) disclaim responsibility for any injury to people or property resulting from any ideas, methods, instructions or products referred to in the content. |
© 2025 by the author. Licensee MDPI, Basel, Switzerland. This article is an open access article distributed under the terms and conditions of the Creative Commons Attribution (CC BY) license (https://creativecommons.org/licenses/by/4.0/).