Abstract
Rapid urbanization and industrialization have intensified the contradiction between water scarcity and economic growth. Achieving synergy between economic development and water conservation through taxation and subsidy policies has emerged as a critical research focus. This study develops an extended Computable General Equilibrium (CGE) model incorporating a water resource module to evaluate the impacts of production tax and subsidy policies in Wenling City, Zhejiang Province, China, a typical water-scarce city. By integrating a nested Constant Elasticity of Substitution (CES) production function for various water sources, the model captures the interactions between water supply and industrial output. Six policy scenarios of taxations and subsidies are designed. The impacts on macroeconomic aggregates, industrial output, and water usage are simulated. Results indicate that standalone taxation policies (Water Conservation Taxation Policy A1/Industrial Transformation Taxation Policy B1) reduce water usage by 3.35–3.80% but suppress Gross Domestic Product (GDP) growth by 0.37–0.76%. Among combined policies, the Water Conservation Combined Policy A3 achieves the optimal synergy between water conservation and economic growth, increasing real GDP by 1.00% while reducing water usage by 4.97%. This study reveals that taxation curbs the expansion of water-intensive industries, whereas subsidies redirect production factors toward water-efficient industries. Combining these policies effectively balances water conservation and economic development objectives. This study demonstrates how differentiated tax instruments drive water conservation through industrial transformation, providing a quantitative framework for production tax policy formulation in water-scarce regions.
1. Introduction
Rapid urbanization and industrialization have intensified water scarcity as a critical constraint on economic development. China—among the world’s most water-stressed nations—possesses per capita water resources amounting to merely one-third of the global average, with significant efficiency gaps persisting relative to high-income economies [1]. Conventional industrialization frequently triggers water resource overexploitation [2], while regulatory water conservation measures may simultaneously impede economic growth. The trilemma of economic expansion, industrial transformation, and water conservation has become increasingly acute [3]. Designing policy instruments that concurrently promote water conservation and economic growth thus constitutes an imperative for regional sustainability [4].
Extensive studies have examined the relationship between economic growth and water conservation, progressively expanding from agriculture and water-intensive industries to encompass specialized water use sectors across economic systems. Predominant methodologies include econometric models [5,6], system dynamics [7,8], and input–output models [9,10], addressing core themes such as water–economy nexus [11,12], water policies impacts [13,14], and synergies between water conservation and economic growth objectives [15].
Scholars widely acknowledge that measures such as water price adjustments [16], technological advancement [17], and industrial transformation [18] can effectively reduce water consumption and improve water use efficiency. Among these, industrial transformation is considered a fundamental strategy for achieving water conservation [19]. Existing studies demonstrate that sector-specific tax policies can guide the reallocation of production factors through price signals, thereby facilitating industrial transformation [20]. However, significant gaps remain in analyzing the impacts of specific water conservation policies targeting industrial transformation. In terms of research focus, existing studies often rely on water use coefficients and industrial structure analysis, failing to fully account for complex inter-industry linkages and varying water use characteristics [21]. In terms of research approach, most studies focus solely on assessing single-policy effectiveness, failing to adopt a holistic perspective to comprehensively evaluate the long-term impacts of policy portfolios [22]. Methodologically, while some scholars have employed Computable General Equilibrium (CGE) models to examine how water policies affect macroeconomic and industrial outputs, such models typically simplify water resources as exogenous variables within their frameworks [23]. This simplification overlooks sectoral differences in water use efficiency and their dynamic responses to policy interventions. As a consequence, conventional simulation approaches struggle to accurately quantify the integrated impacts of combined production tax and subsidy policies on regional water economy systems. Specifically, systematic modeling of taxing water-intensive industries or subsidizing emerging water-efficient sectors remains to be explored [24].
This study focuses on Wenling City, Zhejiang Province, China, a water-scarce region undergoing industrial transformation, as its study area. An analytical framework by constructing a CGE model with an extended water-resource module to assess the impacts of sectoral production tax policies is developed. Taxation and subsidy policies targeting distinct industrial sectors are simulated, delineating impact pathways on macroeconomic aggregates, sectoral outputs, and water usage.
2. Materials and Methods
2.1. Study Area
Wenling City is situated along the southeastern coast of Zhejiang Province, China (121°09′50″ E–121°44′0″ E, 28°12′45″ N–28°32′02″ N), covering a land area of 1073.6 km2. Figure 1 shows the location of Wenling City. With a population of approximately 1.44 million, the city achieved a regional GDP of 141.7 billion CNY in 2024. Its economic structure is characterized by a tertiary sector ratio of 7.1:43.6:49.3 (primary:secondary:tertiary), with pillar industries, including the pump and motor sector, automotive/motorcycle sector, footwear/apparel sector, and machine tool sector.
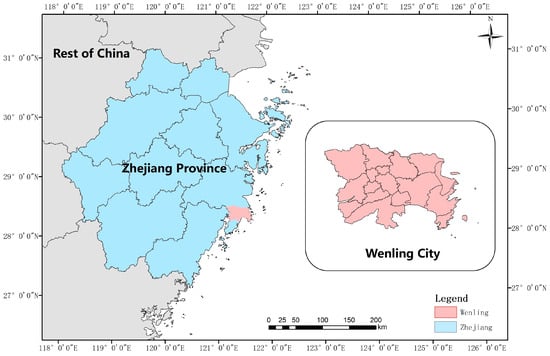
Figure 1.
Location of Wenling City.
Wenling City exemplifies resource-driven water scarcity, with its annual water resources averaging 962 million m3 and per capita availability less than one-third of China’s national average. The water supply relies predominantly on local water sources (Human Reservoirs, Taihu Reservoir, and river networks) and diverted water (the Changtan Water Diversion Project), while unconventional water utilization remains minimal. Governed by a subtropical monsoon climate, extreme precipitation seasonality frequently triggers spring/autumn droughts, intensifying water stress. Limited local water development potential forces heavy dependence on costly diverted supplies, creating acute water supply–demand imbalances.
Wenling currently navigates a critical transition phase in its industrial restructuring, where the dual imperatives of industrial transformation and water conservation reveal significant tensions. Water-intensive traditional industries such as papermaking and apparel continue to dominate industrial water consumption, while diversifying water demands from emerging sectors—including machinery manufacturing and electrical equipment production—exacerbate structural water stress. Despite progress, the region’s water use efficiency lags behind advanced water conservation cities, necessitating strategic policy interventions to optimize factor allocation and achieve sustainable equilibrium between economic growth and water resource sustainability.
As a representative coastal city grappling with resource-driven water scarcity, Wenling’s analysis of production tax policies holds substantial practical significance. Implementing differentiated measures—penalizing water-intensive industries while subsidizing water-efficient sectors—generates economic incentives that simultaneously curb inefficient water consumption, accelerate industrial upgrading, optimize water allocation efficiency, and alleviate regional supply–demand imbalances. The findings provide valuable insights for similar regions aiming to reconcile economic development with sustainable water resource utilization.
2.2. Model Structure
The Computable General Equilibrium (CGE) model is a policy analysis tool that describes interactions between supply, demand, and markets in an economic system [25]. By solving optimization equations—including producer profit maximization, consumer utility maximization, government budget equilibrium, and international market clearance [26]—the model generates equilibrium prices and quantities. The CGE model inherently captures how price fluctuations propagate across markets through cost transmission, substitution effects, and income effects. Compared with the input–output model (a commonly used economic analysis technique that employs an inter-sectoral flow matrix to depict interdependencies among sectors of an economy), CGE offers superior capability in simulating economy-wide responses to diverse policies [27], particularly through refined tax mechanisms that quantify differential impacts across sectors and commodities. Consequently, it provides a well-suited analytical framework for evaluating production tax policies.
This study employs a recursive dynamic CGE model with annual time stepping that explicitly captures intertemporal linkages. Capital is sector-specific and immobile within each period (vintage capital), following a putty–clay specification where existing capital stocks exhibit limited substitutability with other factors. The accumulation process is governed by:
where denotes capital stock in sector i at period end, is the opening stock, is the depreciation rate, and is new investment.
While capital is fixed by sector in the short run, multi-year trajectories emerge through endogenous investment reallocation. Annual capital growth rates respond to sectoral rate-of-return differentials via capital supply curves, enabling gradual inter-sectoral capital mobility across periods. This specification reconciles short-term sectoral fixity with long-term structural change.
The model maintains a savings-driven closure, with the rate of return on capital treated exogenously while investment adjusts endogenously to available savings. Labor markets feature fixed real wages with endogenous employment and exogenous labor supply, capturing how policy shocks like tax changes propagate through sectoral restructuring and factor reallocation with full labor mobility. The household demand system adopts a Linear Expenditure System (LES) functional form, the Frisch parameter governs the elasticity of marginal utility of income, scaling subsistence consumption rigidities, while the consumer price elasticity quantifies demand responsiveness to price changes after accounting for these subsistence constraints. Government spending follows a fixed rule, and the exchange rate serves as the numeraire. Baseline trajectories are calibrated using historical trends for capital growth, labor supply, and productivity parameters.
To comprehensively model the intricate relationships between water use behaviors and economic activities, this study extends the CGE model with a water resource module, with the enhanced framework illustrated in Figure 2. Traditional CGE models treat water merely as a single sector and commodity, failing to reflect differentiated water-source-specific supply and demand responses to economic policies [23]. Addressing this gap, this study employs a nested Constant Elasticity of Substitution (CES) production function structure to systematically reflect substitution relationships among distinct water sources.
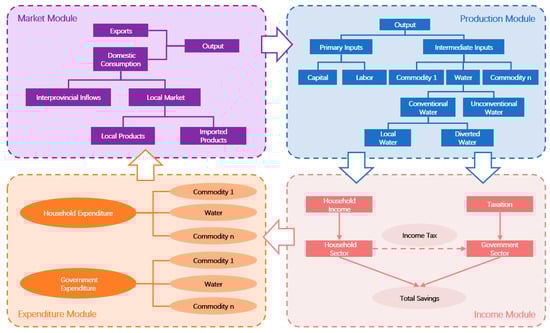
Figure 2.
Schematic of the model structure.
In the CGE model with the water resource module, the framework systematically examines substitution between local water and diverted water, capturing their measurable elasticity. These conventional sources are consequently integrated using a CES function as presented below:
Equation (2) shows that the intermediate input of conventional water used in sector i () is the CES composite of local water and diverted water. The variable represents the different sources of conventional water used in sector i. The variable s represents the source (s = 1 is local water; s = 2 is diverted water). The variable represents the technological parameters; represents the shares of different conventional water sources in sector i; and represents the constant elasticity of substitution between local water and diverted water, quantifying the ease with which producers can switch between these water sources in response to price changes, where higher absolute values indicate greater substitution flexibility.
The demand for “composite water” is represented as a CES equation as follows:
Similar to Equation (2), Equation (3) shows that composite water used in sector i () is the CES composite of conventional water and unconventional water. The variable represents the different sources of water used in sector i; and s represents the source (s = 1 is conventional water; s = 2 is unconventional water). The variable represents the technological parameters; represents the shares of different water sources in sector i; and is the constant elasticity of substitution between conventional water and unconventional water.
The extended water resource module facilitates its applicability to diverse geographical contexts, as the model can be readily adapted through the recalibration of economic structure, water source types, and substitution elasticity parameters to reflect regional characteristics.
2.3. Model Database
The basic data of the developed model primarily encompass economic and water use statistics. Economic data are compiled from the 42-sector input–output tables of Zhejiang Province for 2017 [28] and the “Wenling Statistical Yearbook 2023” published by the local statistics bureau [29], providing information on inter-sectoral input structures, value added compositions, final consumption patterns, and trade flows. Water use data are compiled from the “2023 Water Resources Bulletin” published by the local water resources bureau [30], providing information on water usage by sectors and supply by water sources.
Based on the economic and water use data, a model database for the study area was developed. The input–output table was updated using the bi-proportional scaling method according to sectoral value added, household consumption, and import-export statistics from the 2023 Statistical Yearbook of Wenling. Industries with similar water use characteristics were consolidated, ensuring internal consistency in water intensity and policy responsiveness within aggregated sectors, while retaining water-intensive sectors (e.g., papermaking, chemicals), yielding 18 commodity and sector classifications, as shown in Table 1. Notably, the “production and distribution of water” sector was decomposed into three distinct water supply sectors (conventional water, diverted water, and recycled water) according to water usage by water sources, accurately reflecting the multi-source water supply structure in Wenling City.

Table 1.
Model sectors and water use intensity (cubic meters per CNY 1000 of value added).
Cross-validation was implemented through sector-specific approaches to ensure data accuracy: industrial water use was calibrated by matching above-scale enterprise water consumption records with sectoral totals; agricultural water use was verified against irrigated areas, crop patterns, and measured abstraction from irrigation districts, collectively establishing an integrated database for water economic analysis.
2.4. Model Parameters
Model parameters governing economic behaviors—including production technologies and consumption preferences [31]—encompass substitution elasticities (e.g., capital–labor substitution in CES functions) and technological scale parameters characterizing input substitutability and production efficiency; utility function parameters (e.g., Cobb–Douglas expenditure shares) reflecting consumer preference intensities; trade elasticities (Armington elasticities for import domestic substitution, export demand elasticities for price quantity responses); fiscal policy instruments (tax/subsidy rates) affecting government budgets and market equilibrium; initial factor endowments (labor supply, capital stock) determining economic scale under resource constraints; and macroeconomic parameters (savings/investment rates) essential for capital market and fiscal balance [32].
Parameters were assigned due to empirical evidence and analytical findings. The labor elasticity of the demand coefficient was set to 0.243 according to the estimation from the Chinese Academy of Social Sciences [33]. The consumer price elasticity were set to 4.0, referring to the People’s Republic of China’s General Equilibrium Model (PRCGEM) model [34]. The Armington elasticity, factor substitution elasticity, and household consumption elasticity were set according to the CHINAGEM model database [35], with values ranging from 1.9 to 5.2. The water substitution elasticity was set according to the SICGE model database [33], with values ranging from 0.2 to 1.0. The Frisch parameters were assigned to −2.0 according to the per capita income level of Wenling based on the literature [36]. The remaining parameters were also adopted from the ORANI-G model database.
Model validation includes data balance test, closure test, homogeneity test, and robustness test.
- (1)
- The data balance test ensures precise replication of benchmark year economic accounts. Results indicate that the model accurately replicates the economic accounts, confirming the precise alignment between the model database and the actual economic structure of Wenling City.
- (2)
- The closure test guarantees model solvability by aligning the quantitative relationship between exogenous and endogenous variables. Results indicate that under the baseline closure condition, the model has a total of 4346 exogenous variables and 6275 endogenous variables, with a corresponding number of 6275 equations. The dimensions of all endogenous variables are consistent with the equations, and the model passes the closure rule test.
- (3)
- The homogeneity test validates conformance with general equilibrium theory principles. Nominal homogeneity examines “money neutrality” by exogenously scaling all benchmark prices (e.g., +1%) and verifying proportional price changes alongside invariant quantities; real homogeneity confirms constant returns to scale by exogenously scaling quantity variables (e.g., capital, labor) and verifying proportional quantity changes with stable prices. The homogeneity test results are shown in Table 2. Results indicate that in the nominal homogeneity test, the model’s price variables changed by approximately 1%, while the quantity variables remained unchanged. In the real homogeneity test, the model’s quantity variables changed by approximately 1%, while the price variables remained stable, and the model passes the homogeneity test.
Table 2. Homogeneity test results.
- (4)
- The robustness test evaluates the impact of parameter uncertainty on model outcomes. Following Mahmood [37]’s methodology, we generated a uniform distribution series of elasticity parameters for the production function (including Armington elasticity, factor substitution elasticity, household consumption elasticity, water substitution elasticity ρ(1)comwt,i and ρ(1)water,i), ranging from low elasticity (reduced by 10%) to high elasticity (increased by 10%). These alternative parameter sets were systematically substituted into the model to examine variations in key output variables. As presented in Table 3, the standard deviations of value added across all parameter variations remained below CNY 0.02 billion, the standard deviations of water usage across all parameter variations remained below 0.3 million m3, indicating that the main policy conclusions are robust to reasonable parameter fluctuations.
Table 3. Robustness test results.
The developed CGE model passed the balance test, closure test, homogeneity test, and robustness test, confirming its stability and reliability. This rigorous validation process established that the model is fully capable of simulating the impacts of production tax policies.
2.5. Policy Scenarios
Based on the developed CGE model, two sets of policy scenarios were designed along distinct dimensions: water conservation policies (water-intensive vs. water-efficient industries) and industrial transformation policies (traditional vs. emerging industries). Group A focused on water use efficiency, implementing a 5% production tax on water-intensive industries (A1), a 5% production subsidy for water-efficient industries (A2), and a combined policy integrating both measures (A3). Meanwhile, Group B emphasized industrial transformation, featuring a 5% production tax on traditional industries (B1), a 5% production subsidy for emerging industries (B2), and a combined policy merging both approaches (B3). Policy scenario details are shown in Table 4.
Table 4.
Policy scenarios.
3. Results and Discussion
Based on the CGE model featuring an extended water resource module, the impacts of six tax and subsidy policies targeting industries were simulated for macroeconomic outcomes, sectoral output, and water usage, providing a quantitative basis for synergizing water conservation with economic growth.
3.1. Model Results
3.1.1. Macroeconomic Impact
- Real GDP Impact
Based on simulation results, the six policy scenarios exhibit significantly divergent impacts on Wenling City’s real GDP. Figure 3 shows the cumulative impact of real GDP under the different policy scenarios, which is calculated by summing the annual percentage deviations relative to the baseline scenario from the start year to the end year.
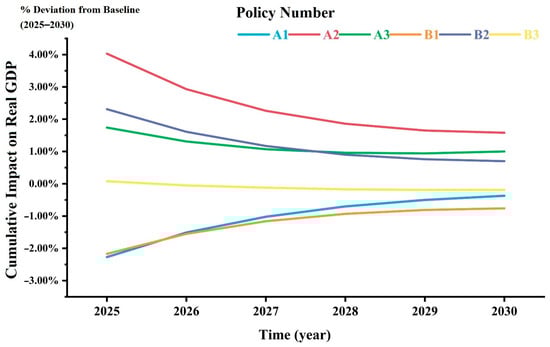
Figure 3.
Cumulative impact on real Gross Domestic Product (GDP) from 2025 to 2030.
For taxation policies, the water conservation taxation policy (A1) initially imposes a strong negative shock to GDP (−2.27% in 2025), but this adverse effect progressively weakens to −0.37% by 2030 as industrial transformation takes hold. Conversely, the industrial transformation taxation policy (B1) demonstrates more persistent suppression, with its negative impact declining slowly from −2.17% in 2025 to −0.76% in 2030.
Subsidy policies significantly stimulate economic growth: the water conservation subsidy policy (A2) initially generates an immediate positive growth of 4.03%, though this increment diminishes over time; similarly, industrial transformation subsidy policy (B2) initially boosts GDP by 2.31%, stabilizing around 0.7% later in the policy cycle.
Among combined policies, the water conservation combined policy (A3) achieves sustained moderate growth (annual average 1.16%), rebounding to 1.0% in 2030 through counteracting effects. In contrast, the industrial transformation combined policy (B3) shows neutralizing effects, with the marginal initial growth (0.08%) turning negative and stabilizing at −0.19% by 2030.
Overall, the water conservation subsidy policy delivers the strongest economic stimulus, while the water conservation taxation policy exhibits the most pronounced negative drag effect.
- 2.
- Employment Impact
Figure 4 shows the cumulative impact of employment under the different policy scenarios.
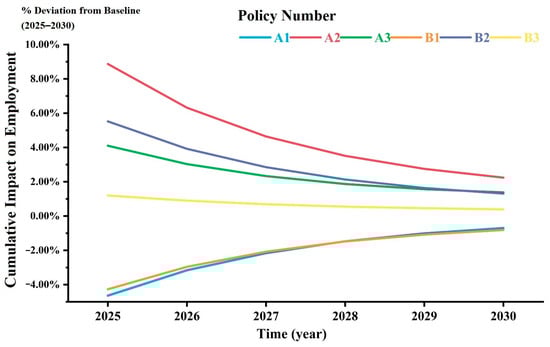
Figure 4.
Cumulative impact on employment from 2025 to 2030.
For taxation policies, policy A1 exerts sustained negative pressure on employment, with a cumulative decline of −4.64% by 2025. However, as industrial transformation progresses, this cumulative adverse effect gradually weakens, narrowing to −0.7% by 2030. Similarly, policy B1 results in a relatively moderate cumulative employment suppression effect of −4.27% by 2025, though the downward trend persists until the end of the policy cycle with a cumulative decline of −0.81% by 2030.
Subsidy policies significantly boost cumulative employment: policy A2 generates a cumulative growth of 8.87% by 2025, though this cumulative growth diminishes over time to 2.24% by 2030; policy B2 also shows a declining cumulative effect, with cumulative growth falling from 5.52% by 2025 to 1.31% by 2030, indicating diminishing policy effectiveness over time for both subsidy types.
Among combined policies, policy A3 achieves sustained cumulative employment growth through policy synergy, reaching a cumulative growth of 4.1% by 2025 and maintaining a positive cumulative increase of 1.38% by 2030. Conversely, policy B3 exhibits mild cumulative growth characteristics, starting with a cumulative growth of 1.2% by 2025 but gradually slowing to a cumulative growth of 0.39% by 2030, reflecting how the offsetting effects of taxation and subsidies weaken overall policy impact.
Overall, the water conservation subsidy policy provides the strongest cumulative employment stimulus by the early policy period, while the water conservation taxation policy has the most pronounced cumulative suppression effect by the early policy period. Combined policies, through structural adjustment, effectively mitigate the cumulative employment shock of single taxation measures while enhancing policy sustainability.
- 3.
- Factor Income Impact
Figure 5 shows the cumulative impact of factor income under the different policy scenarios.
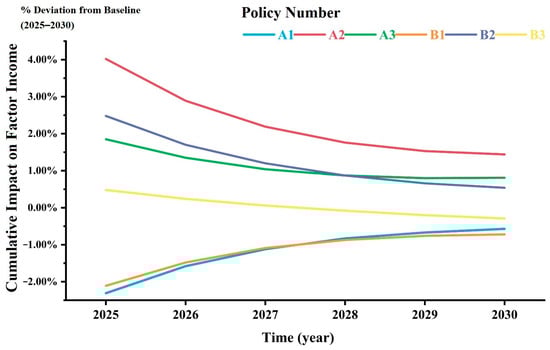
Figure 5.
Cumulative impact on factor income from 2025 to 2030.
For taxation policies, policy A1 initially exerts significant negative pressure, reducing factor income by 2.31% in 2025. However, this adverse effect gradually diminishes—reaching −0.57% by 2030—as industrial transformation and technological substitution take effect. In contrast, policy B1 shows more persistent suppression, with factor income declining from −2.11% in 2025 to −0.72% in 2030, reflecting long-term drag effects from sectoral contraction.
Subsidy policies substantially boost factor income: policy A2 delivers a strong initial growth of 4.02%, maintaining a positive 1.44% by 2030 despite diminishing returns. Similarly, policy B2 sees gains decline from 2.48% to 0.54%, indicating marginal decreases in resource demand.
Among the combined policies, policy A3 achieves sustained growth through structural optimization, with factor income rising steadily from 1.85% to 0.81% (2030), demonstrating synergy between water savings and income gains. Conversely, policy B3 displays policy offset effects—initial marginal growth (0.48%) turned negative (−0.29% by 2030)—highlighting risks of resource misallocation during sectoral shifts.
Overall, the subsidy for water-efficient industries provides the strongest factor income uplift, while the taxation of traditional industries inflicts the most pronounced adverse impact.
3.1.2. Sectoral Value Added Impact
Based on simulation results, the six policy scenarios exhibit significant heterogeneity in their impacts on sectoral value added, with particularly pronounced variations among water-intensive industries, traditional sectors, and emerging industries. Figure 6 shows the impact of sectoral value added under different policy scenarios, representing the absolute differences between these scenarios and the baseline scenario for 2030. These impacts are calculated by applying annual percentage changes derived from the CGE model simulations to the baseline value added levels.
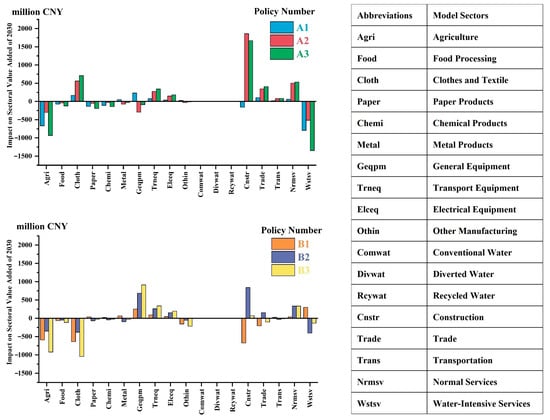
Figure 6.
Impact on sectoral value added of 2030.
For taxation policies, policy A1 results in substantial reductions in value added for targeted sectors such as agriculture (CNY −6.68 billion) and food processing (CNY −0.76 billion), while non-water-intensive sectors like apparel/footwear (CNY +1.64 billion) and construction (CNY −1.59 billion) show divergent responses, reflecting direct regulatory effects on water efficiency. Within policy B1, apparel/footwear (CNY −6.39 billion) and construction (CNY −6.76 billion) experience significant declines, though paper/printing (CNY +0.38 billion) grows despite not being directly restricted.
For subsidy policies, policy A2 stimulates substantial growth in construction (CNY +18.60 billion), with general services (CNY +4.99 billion) and electrical machinery manufacturing (CNY +1.48 billion) also expanding, while water-intensive sectors like agriculture (CNY −3.01 billion) and paper/printing (CNY −0.56 billion) passively contract, highlighting the subsidy’s role in redirecting production factors. Policy B2 drives growth in general equipment manufacturing (CNY +6.86 billion) and transportation equipment manufacturing (CNY +2.62 billion), with construction (CNY +8.41 billion) benefiting indirectly.
Combined policies demonstrate amplified effects: policy A3 boosts apparel/footwear (CNY +7.08 billion) and construction (CNY +16.66 billion), while agriculture (CNY −9.36 billion) and water-intensive services (CNY −5.18 billion) see expanded declines, indicating reinforced structural adjustments. Policy B3 delivers the largest growth in general equipment manufacturing (CNY +9.11 billion), with construction (CNY +0.71 billion) stabilizing, illustrating how policy counterbalancing moderates industrial substitution. Notably, construction—a pivotal intermediate input sector—exhibits robust growth resilience under both A2 and B2 policies, underscoring its central role in policy transmission. Agriculture persistently contracts across multiple scenarios (A1: CNY −9.36 billion; A2: CNY −3.01 billion; B3: CNY −9.23 billion), confirming stable policy suppression of water-intensive sectors.
Overall, water conservation policies drive structural adjustments through curbing water-intensive sectors and incentivizing water-efficient ones, while industrial transformation policies emphasize industrial substitution via traditional sector contraction and emerging industry expansion.
3.1.3. Sectoral Water Usage Impact
Figure 7 shows the impact of sectoral water usage under the different policy scenarios.
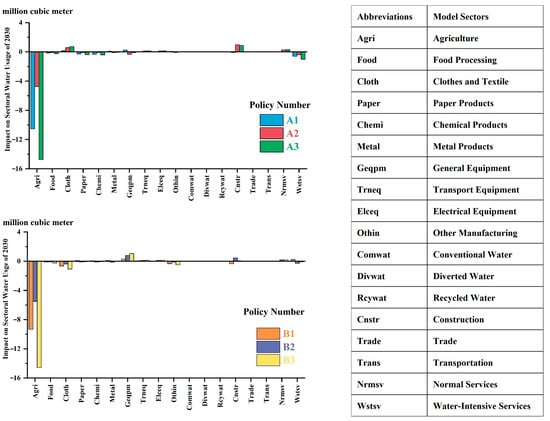
Figure 7.
Impact on sectoral water usage of 2030.
For taxation policies, regarding policies A1, agricultural water consumption decreases by 10.54 million m3, while water-intensive industries like food processing and paper/printing reduce usage by 0.16 million m3 and 0.29 million m3, respectively, indicating targeted suppression effects. However, apparel/footwear water usage increases by 0.17 million m3 and construction decreases by 0.08 million m3, revealing divergent indirect effects on non-water-intensive sectors. Policy B1 reduces water usage in apparel/footwear by 0.66 million m3 and construction by 0.36 million m3, but increases paper/printing usage by 0.08 million m3, reflecting varied responses within traditional industries.
For subsidy policies, Policy A2 increases construction water usage by 0.99 million m3, water-intensive services by 0.27 million m3, and electrical machinery by 0.11 million m3, while agriculture decreases by 4.74 million m3, demonstrating how subsidies stimulate water-efficient sectors while accelerating contraction in water-intensive industries. Policy B2 boosts water usage in general equipment manufacturing by 0.79 million m3, transportation equipment and electrical machinery by 0.11 million m3 and 0.11 million m3, respectively, with construction increasing by 0.45 million m3 due to intermediate demand, highlighting spillover effects from emerging industry development. Nevertheless, as the water intensity of the construction sector is relatively low, this increase does not offset the overall water conservation effects.
The combined policies intensify outcomes: policy A3 expands agricultural water reduction to 14.76 million m3 while increasing apparel/footwear and construction usage by 0.73 million m3 and 0.89 million m3, showcasing coordinated mechanisms for dual water economic regulation. Policy B3 raises general equipment manufacturing usage by 1.04 million m3 but reduces apparel/footwear by 1.08 million m3, with construction only minimally increasing (0.04 million m3). Overall, water conservation policies achieve more immediate water savings by suppressing water-intensive sectors, while industrial transformation policies reconfigure water use through emerging industry development, requiring trade-offs between short-term conservation and long-term structural adaptation.
3.2. Policy Scenario Comparison
Table 5 shows the policy scenario comparison. For macroeconomic impact, Policy A2 delivers the most substantial GDP boost (1.58%) among single policies, while Policy B1 exhibits the strongest inhibitory effect (−0.76%). Among the combined policies, A3 achieves moderate growth (1.00%) through tax/subsidy counterbalancing, outperforming B3. Employment impacts aligned with economic trends: Policy A2 increases employment by 2.24%, whereas A1 and B1 cause declines of 0.7% and 0.81%, respectively. Combined Policy A3 (1.38%) similarly surpasses B3 (0.39%) in employment gains. Regarding factor income, Policy A2 increases returns by 1.44%, while B1 (−0.72%) and B3 (−0.29%) reflect negative impacts from traditional sector contraction. Water usage analysis reveals significant conservation effects under standalone taxation Policies A1 (−3.8%) and B1 (−3.35%). Among the combined approaches, Policy B3 achieves the maximal water reduction (−5.07%) through industrial substitution, with Water Conservation Policy A3 (−5.91%) and Industrial Transformation Policy B3 (−4.89%) showing optimal efficiency improvements.
Table 5.
Policy scenario comparison.
Overall, water conservation policies simultaneously enable water savings and economic growth via targeted interventions, whereas industrial transformation policies enhance long-term water conservation effectiveness, though requiring careful equilibrium between traditional sector contraction and emerging industry cultivation.
3.3. Comparison with Previous Studies
Building upon prior research, this study develops an extended CGE model incorporating a water resource module to validate the water economic impacts of production tax policies, exploring sectoral differential responses and synergistic effects of policy combinations. This approach offers a comprehensive analytical framework for water economy policy assessment.
In terms of research methods, conventional CGE models often oversimplify water resources as exogenous variables or homogeneous commodities, failing to capture substitution elasticities between diverse water sources (local, diverted, and unconventional water) and their impacts on sectoral cost structures [23]. Our enhanced model precisely characterizes substitution relationships between local and diverted water, as well as between conventional and unconventional sources, enabling accurate simulation of how tax/subsidy policies redirect production factors across sectors through price signals. This advancement overcomes limitations of traditional approaches reliant on simplified water use coefficients and industrial structure analyses [38].
In terms of research approach, this study employs multi-scenario simulation to systematically quantify the synergistic effects of diverse policy combinations. Comparing with single-policy studies [39], this study reveals the economic water conservation synergy potential of combined tax/subsidy approaches—a finding consistent with Wu et al.’s [24] conclusions from open-water CGE modeling. Notably, our analysis demonstrates that the combined tax/subsidy approach achieves superior outcomes in balancing water conservation with economic growth, effectively addressing the implementation gap identified in recent policy evaluations [40].
In terms of the research findings, beyond macro-level tax–GDP relationships explored in the existing literature, our work further quantifies sectoral water output characteristics, providing actionable insights for designing industrial production tax policies. Our findings corroborate pervious research that water resource tax policies present complex trade-offs between economic development and ecological protection, though our granular sectoral analysis offers more precise implementation pathways [41].
3.4. Limatations
While the present study offers valuable insights into the impacts of production tax policies on water resource and economic growth, several limitations warrant acknowledgment to guide future research and practical applications.
A limitation of this study is its omission of the dynamic impacts of water-saving technological progress. Future research should integrate technological dynamics into CGE models to assess synergies between policy instruments and innovation for sustainable water management.
Another significant limitation concerns the uniform tax/subsidy rate applied across policy scenarios. This rate was selected based on preliminary assessments of regional fiscal feasibility, providing a standardized basis for comparative analysis. However, this represents a simplification that merits further investigation. Future studies should conduct comprehensive sensitivity analyses across a wider range of policy intensities (e.g., 1−10%) to determine optimal intervention levels.
Furthermore, this study’s exclusive focus on production tax and subsidy mechanisms presents a constrained policy landscape that may not fully capture real-world implementation complexities. Future research should develop multi-instrument frameworks that simultaneously model tax policies alongside water pricing structures and tradable permit systems to better reflect the policy portfolios typically employed by water-stressed regions.
Additionally, the net fiscal burden of the combined policy for government budgets has not been assessed. Future research should incorporate fiscal accounting mechanisms to evaluate budgetary implications of policy combinations, providing practical guidance for policymakers with constrained fiscal capacity.
4. Conclusions
This study employs an extended CGE model incorporating a water resource module to systematically evaluate the impacts of production tax and subsidy policies on economic and water resource in Wenling City. It further reveals synergistic mechanisms under differentiated policy approaches. Key findings include the following:
- (1)
- Taxation policies effectively curtail water demand (A1: −3.80%; B1: −3.35%) but cause short-term economic contraction (A1 GDP: −0.37%; B1 GDP: −0.76%) while reducing employment and factor income.
- (2)
- Subsidy policies also suppress water usage (A2: −1.30%; B2: −1.74%) while stimulating the economy (A2 GDP: +1.58%; B2 GDP: +0.70%), though potentially triggering an increase in water consumption in intermediate sectors like construction. This may partially offset water-saving benefits in the short term but still achieves net water savings overall.
- (3)
- The combined Water Conservation Policy A3 demonstrates water economy synergy (GDP: +1.00%; water: −4.97%)—taxation constrains water-intensive expansion through production costs, while subsidies redirect factors to water-efficient industries, yielding dual benefits of industrial optimization and efficiency gains. The model indicates that the combination of taxation on water-intensive industries and subsidies for water-efficient sectors creates synergistic effects—taxation constrains water-intensive expansion through production costs, while subsidies redirect factors to water-efficient industries, yielding dual benefits of industrial optimization and efficiency gains.
This study quantifies economic water impacts of taxation and subsidy policies and identifies water conservation pathways through industrial transformation, offering evidence-based decision support for water-scarce regions.
Author Contributions
Conceptualization, Y.W.; Methodology, X.L.; Validation, Y.W.; Formal analysis, X.L.; Resources, Y.W.; Writing—original draft, X.L.; Writing—review & editing, Y.W.; Supervision, H.N.; Project administration, H.N. All authors have read and agreed to the published version of the manuscript.
Funding
This research received no external funding.
Institutional Review Board Statement
Not applicable.
Informed Consent Statement
Not applicable.
Data Availability Statement
Data are contained within the article.
Acknowledgments
We declare that Qwen2.5-Max (Alibaba Cloud) was used for data analysis support and translation to enhance clarity. All AI-generated outputs were critically reviewed, edited, and validated by the authors to ensure scientific accuracy, originality, and compliance with ethical standards. The authors retain full responsibility for the manuscript’s content.
Conflicts of Interest
The authors declare no conflict of interest.
References
- Gen, S.; Liu, D.; Xia, P. Research on China’s water use efficiency of China based on a comparative analysis. Water Resour. Dev. Res. 2022, 22, 77–82. [Google Scholar]
- Wang, S.; Sun, Z.; Liu, J.; Zhou, A. Water Resource Utilization Assessment in China Based on the Dynamic Relationship between Economic Growth and Water Use. Water 2024, 16, 1325. [Google Scholar] [CrossRef]
- Wang, X.; Zhang, W.; Li, Y.; Tong, J.; Yu, F.; Ye, Q. Impacts of water constraints on economic outputs and trade: A multi-regional input-output analysis in China. J. Clean. Prod. 2024, 434, 140345. [Google Scholar] [CrossRef]
- Liu, W.; Fang, Z.; Vliet, M.T.H.v.; Davis, K.F.; Ciais, P.; Bao, Y.; Bian, Y.; Du, T.; Kang, S.; Yin, Z.; et al. Global overlooked multidimensional water scarcity. Proc. Natl. Acad. Sci. USA 2025, 122, e2413541122. [Google Scholar] [CrossRef] [PubMed]
- Jia, S.; Zhang, S.; Yang, H.; Xia, J. Relation of industrial water use and economic development:water use Kuznets Curve. J. Nat. Resour. 2004, 19, 279–284. [Google Scholar]
- Guo, X.; Wang, A.; Liu, G.; Du, B. Expanded S-Curve Model of Relationship between Domestic Water Usage and Economic Development: A Case Study of Typical Countries. Appl. Sci. 2022, 12, 6090. [Google Scholar] [CrossRef]
- Zhang, C.; Zhang, H.; Chen, Q.; Yayun, G. Empirical research on the relationship between water use and economic growth. Resour. Sci. 2015, 37, 2228–2239. [Google Scholar]
- Winz, I.; Brierley, G.; Trowsdale, S. The Use of System Dynamics Simulation in Water Resources Management. Water Resour. Manag. 2008, 23, 1301–1323. [Google Scholar] [CrossRef]
- Sun, C.; Zheng, J. Structural path analysis of water resources consumption in China based on input-output table. Prog. Geogr. 2021, 40, 370–381. [Google Scholar]
- Duarte, R.; Sánchez-Chóliz, J.; Bielsa, J. Water use in the Spanish economy: An input–output approach. Ecol. Econ. 2002, 43, 71–85. [Google Scholar] [CrossRef]
- Wang, F.; Zhang, M.; Lv, S.; Zhao, H.; Ying, Z. Simulation of coordinated development of water-economy-ecology system coupling in Beijing-Tianjin-Hebei region. South-North Water Transf. Water Sci. Technol. 2023, 21, 218–232. [Google Scholar]
- Luo, Z.; Luo, S.; Zhang, F.; Yang, X. Spatial and Temporal Matching Measurement of Ecosystem Service Supply, Demand and Human Well-Being and Its Coordination in the Great Rivers Economic Belt—Evidence from China’s Yangtze River Economic Belt. Sustainability 2024, 16, 7487. [Google Scholar]
- Scheierling, S.M.; Young, R.A.; Cardon, G.E. Public subsidies for water-conserving irrigation investments: Hydrologic, agronomic, and economic assessment. Water Resour. Res. 2006, 42, 446–455. [Google Scholar]
- Zhao, J.; Ni, H.; Peng, X.; Li, J.; Chen, G.; Liu, J. Impact of water price reform on water conservation and economic growth in China. Econ. Anal. Policy 2016, 51, 90–103. [Google Scholar] [CrossRef]
- Garrone, P.; Grilli, L.; Marzano, R. Incentives to water conservation under scarcity: Comparing price and reward effects through stated preferences. J. Clean. Prod. 2020, 244, 118632. [Google Scholar] [CrossRef]
- Zhou, Y.; Ni, H.; Lin, X.; Chen, G.; Ma, C. Study on water price elasticity of agricultural irrigation water combined with key influencing factors of precipitation. Water Resour. Hydropower Eng. 2022, 53, 108–115. [Google Scholar]
- Tan, J.; Zou, X.-Y. Water-Related Technological Innovations and Water Use Efficiency: International Evidence. Emerg. Mark. Financ. Trade 2023, 59, 4138–4157. [Google Scholar] [CrossRef]
- Yu, Q.; Zhong, D.; Guo, J. In Proposing a Clean and Water-Saving Industrial Structure in China. In Proceedings of the 2011 International Conference on Multimedia Technology, Hangzhou, China, 26–28 July 2011; pp. 4032–4037. [Google Scholar]
- Shi, Q.; Chen, S.; Shi, C.; Wang, Z.; Deng, X. The Impact of Industrial Transformation on Water Use Efficiency in Northwest Region of China. Sustainability 2015, 7, 56–74. [Google Scholar] [CrossRef]
- Ma, J.; Zhang, X.; Tao, F.; Luo, F. Tax Arrangement and Regional Industrial Restructuring: Evidence from Panel Data in China. Math. Probl. Eng. 2016, 2016, 6917947. [Google Scholar] [CrossRef]
- Zhang, W.; Yu, Y.; Zhou, X.; Yang, S.; Li, C. Evaluating Water Consumption Based on Water Hierarchy Structure for Sustainable Development Using Grey Relational Analysis: Case Study in Chongqing, China. Sustainability 2018, 10, 1538. [Google Scholar] [CrossRef]
- Wang, X.; Wang, T.; Liu, S. Effect evaluation of agricultural water conservation policies in China. Resour. Sci. 2024, 46, 27–37. [Google Scholar]
- Yu, H.; Shen, D. Application and Outlook of CGE Model in Water Resources. J. Nat. Resour. 2014, 29, 1626–1636. [Google Scholar]
- Wu, Z.; Tian, G.; Hu, Y. Economic impact and water saving effect of tax reform policy based on open water resources embedded CGE model. Resour. Sci. 2021, 43, 2264–2276. [Google Scholar]
- Abayasiri-Silva, K.; Horridge, M. Economies of Scale and Imperfect Competition in an Applied General Equilibrium Model of the Australian Economy. In Increasing Returns and Economic Analysis; Palgrave Macmillan UK: London, UK, 1998; pp. 307–334. [Google Scholar]
- Ortiz, F.; Obed, C. Computational Aspects of General Equilibrium Theory; Springer: Berlin/Heidelberg, Germany; University of York: York, UK, 2014. [Google Scholar]
- Koks, E.E.; Carrera, L.; Jonkeren, O.; Aerts, J.C.J.H.; Husby, T.G.; Thissen, M.; Standardi, G.; Mysiak, J. Regional disaster impact analysis: Comparing input–output and computable general equilibrium models. Nat. Hazards Earth Syst. Sci. 2016, 16, 1911–1924. [Google Scholar] [CrossRef]
- Zhejiang Provincial Bureau of Statistics. Zhejiang Province 2017 42-Sector Input-Output Table. Available online: https://tjj.zj.gov.cn/art/2020/10/23/art_1229418434_58891192.html (accessed on 1 July 2024).
- Wenling Statistics Bureau. Wenling Statistical Yearbook 2023; Wenling Statistics Bureau: Wenling, China, 2025. [Google Scholar]
- Taizhou Water Resources Bureau. Taizhou Water Resources Bulletin 2023; Taizhou Water Resources Bureau: Taizhou, China, 2024. [Google Scholar]
- Yin, J.; Yan, Q.; Lei, K.; Baležentis, T.; Streimikiene, D. Economic and Efficiency Analysis of China Electricity Market Reform Using Computable General Equilibrium Model. Sustainability 2019, 11, 350. [Google Scholar] [CrossRef]
- Gao, X.; Zhang, Y. Feasibility Study of China’s Carbon Tax System under the Carbon Neutrality Target—Based on the CGE Model. Sustainability 2023, 15, 1026. [Google Scholar] [CrossRef]
- Zheng, Y.; Fan, M. CGE Model and Policy Analysis in China. Social Sciences Academic Press: Beijing, China, 1999. [Google Scholar]
- Ni, H.; Li, J.; Zhang, C.; Zhao, J. Studies on pricing system of water supply in China. China Water Resour. 2014, 6, 27–30. [Google Scholar]
- Peng, X. CHINAGEM—A Dynamic General Equilibrium Model of China: Theory, Data and Applications; Springer Nature Singapore Pte Ltd.: Singapore, 2023. [Google Scholar] [CrossRef]
- Liu, J.; Ni, H.; Wang, D.; Huang, X. Analysis of economic effects of Tianjin water resources based on CGE model. J. China Inst. Water Resour. Hydropower Res. 2012, 10, 192–198. [Google Scholar]
- Mahmood, A.; Marpaung, C.O.P. Carbon pricing and energy efficiency improvement—Why to miss the interaction for developing economies? An illustrative CGE based application to the Pakistan case. Energy Policy 2014, 67, 87–103. [Google Scholar] [CrossRef]
- Shan, S.; Ni, H.; Lin, X.; Chen, G. Evaluation of Water Saving and Economy Impact for Tax Reform Policy Using CGE Model with Integrated Multiple Types of Water. Water 2023, 15, 2118. [Google Scholar] [CrossRef]
- Qu, Y.; Kang, J.; Lin, X.; Ni, H.; Jiang, Y.; Genfa, C. Study on agricultural water pricing policy in Northwest China based on CGE Model. Water Resour. Hydropower Eng. 2022, 53, 160–171. [Google Scholar]
- Zhong, S.; Shen, L.; Sha, J.; Okiyama, M.; Tokunaga, S.; Liu, L.; Yan, J. Assessing the Water Parallel Pricing System against Drought in China: A Study Based on a CGE Model with Multi-Provincial Irrigation Water. Water 2015, 7, 3431–3465. [Google Scholar] [CrossRef]
- Xin, C.; Guo, F.; Wang, A. Exploring the impacts of China’s water resource tax policies: A trade-off between economic development and ecological protection. Front. Environ. Sci. 2022, 10, 982085. [Google Scholar] [CrossRef]
Disclaimer/Publisher’s Note: The statements, opinions and data contained in all publications are solely those of the individual author(s) and contributor(s) and not of MDPI and/or the editor(s). MDPI and/or the editor(s) disclaim responsibility for any injury to people or property resulting from any ideas, methods, instructions or products referred to in the content. |
© 2025 by the authors. Licensee MDPI, Basel, Switzerland. This article is an open access article distributed under the terms and conditions of the Creative Commons Attribution (CC BY) license (https://creativecommons.org/licenses/by/4.0/).