


Sustainable Mobility in Barcelona: Trends, Challenges and Policies for Urban Decarbonization


Abstract
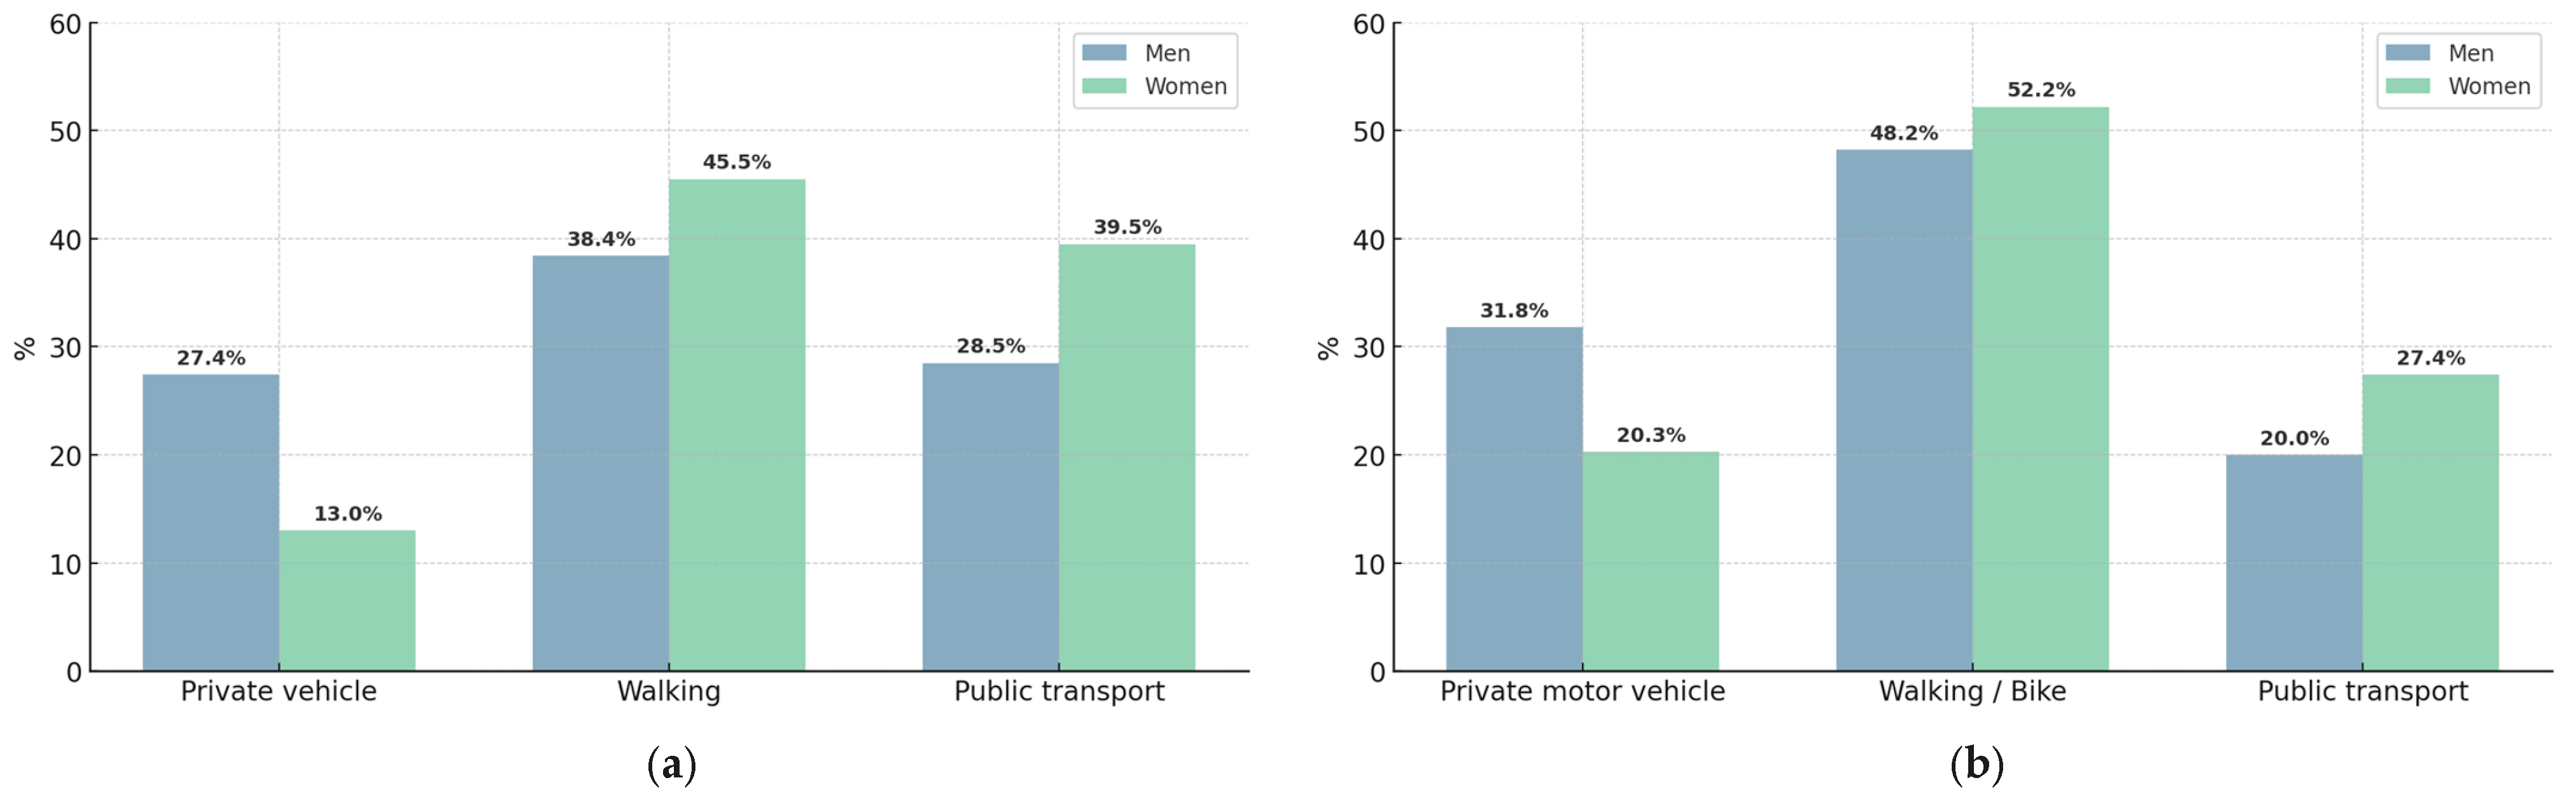
1. Introduction
2. Materials and Methods
2.1. The Field of Study
2.2. Methodology
2.2.1. Data Collection and Preprocessing
- Enquesta de Mobilitat en Dia Feiner (Weekday Mobility Survey, EMEF), 2011–2024: annual data of modal displacements (in thousands of daily workday trips), across all major transport modes, were extracted from EMEF. While official data is available for all of 2023, the value for 2024 was constructed using a projection based on the 2024 forecasts included in the PDUM to ensure the continuity and extension of the time series for modeling purposes [36]. To strengthen the methodological rigor of the trend analysis, the years 2020, 2021, and 2022 were excluded from the modeling process, due to the significant, well-documented distortions in mobility patterns caused by the COVID-19 pandemic. This exclusion criterion was consistently applied across all modeling techniques based on time series data. However, data from the pandemic period were retained in the general database for descriptive, contextual, and interpretative purposes.
- Institut d’Estadística de Catalunya (Catalan Institute of Statistics, IDESCAT), ATM and TMB: The data were incorporated from sources [37,38,39], including fare prices, demand volumes by operator, number of lines, and network length for all public transport subsystems. These variables were essential to understand the operational, economic, and structural dimensions of the mobility system.
- Observatori de la Mobilitat de Catalunya (Catalonia Mobility Observatory, OMC) and Bicing System Reports: infrastructure and performance indicators (e.g., bike-sharing use, bicycle infrastructure, pedestrian priority zones, and bus punctuality) were also included to represent policy and accessibility dimensions, particularly for active modes. The data source used was extracted from [40].
2.2.2. Exploratory Factor Analysis (EFA)
- Assessment of model adequacyPrior to factor extraction, the suitability of the data for EFA was evaluated using the Kaiser–Meyer–Olkin (KMO) measure of sampling adequacy and Bartlett’s test of sphericity. The KMO index assessed the proportion of variance that might be common among variables, while Bartlett’s test verified that the correlation matrix significantly departed from an identity structure. These procedures ensured the statistical feasibility of extracting meaningful latent dimensions.
- Factor extraction and rotationThe extraction of components was performed using the principal components method. To enhance interpretability and facilitate the identification of distinct structural dimensions, an orthogonal Varimax rotation was applied.
- Interpretation of structural dimensionsThe resulting factor structure was interpreted by examining component loadings, to identify key thematic axes relevant to the urban mobility system. These dimensions reflected different operational, infrastructural, and behavioral aspects of mobility and are expected to serve as analytical inputs for future research focused on scenario construction and long-term mobility transitions.
2.2.3. Trend Analysis
2.2.4. Comparative Analysis of Urban Mobility Models
3. Results
3.1. Explanatory Factor Analysis (EFA)
- Conventional transport infrastructure and pedestrian priority (54.0% of explained variance).This factor groups structural variables such as the length of metro lines, the Ferrocarrils de la Generalitat de Catalunya (Catalan Government Railways, FGC) network, interurban buses (AMB), and pedestrian streets. All these variables exhibit prominent negative loadings. Notably, this negativity does not imply an adverse effect but rather indicates that these variables hold less relative weight in defining this specific dimension. In other words, this system configuration is characterized by a low prominence of traditional mass transport infrastructure and consolidated pedestrian spaces, which could suggest the predominance of other mobility models or a different stage of development. Its interpretation is crucial to identify areas within the system in which conventional forms of public transport and pedestrian infrastructure are not yet predominant or have been superseded by new functional schemes.
- Integrated and active urban mobility (27.1% of explained variance).This component is characterized by positive loadings on variables such as urban bus line coverage, the total length of the bus network, and public bicycle demand. This pattern reflects a synergistic functional relationship between collective transport and active bicycle use, emphasizing their functional complementarity rather than merely installed infrastructure. This dimension suggests mobility patterns where both systems operate in a coordinated manner, facilitating short-distance trips and configuring a flexible intermodal model. These results are consistent with previously observed correlations between active mobility, electric buses, and bicycles, and align with strategic urban policies such as superblocks, green axes, or the Bicivia network, which promote accessible and sustainable mobility environments.
- Low penetration of public micromobility (6.8% of explained variance).This component exhibits negative loadings on variables such as electric bicycle stations and the demand for these services. The loadings reflect the fact that, within this dimension, public micromobility has limited or no representation. This factor can be interpreted as a modal configuration where shared bicycles do not constitute a relevant component of the overall transport system, either due to the dominant presence of other modes or the still-limited integration of these solutions. These results also relate to observed correlations concerning car use, which suggests an opportunity to expand or strengthen micromobility infrastructure and coverage in certain areas.
- Operational efficiency of bus transport (4.4% of explained variance).This factor is almost exclusively defined by a high positive loading on the bus punctuality variable, which allows its interpretation as a dimension focused on operational performance and service quality. Unlike factors reflecting structural infrastructure or demand patterns, this dimension captures a fundamental qualitative attribute: the reliability of the public transport service. Its emergence as an independent factor underscores the critical importance of efficiency in transport management, particularly in the context of urban policies aimed at optimizing traffic flow, such as the implementation of bus lanes, traffic signal prioritization, or regulation through the LEZ.The factors extracted through EFA not only synthesize the variables with the highest loadings and their conceptual interpretation, but also facilitate the understanding of how these dimensions articulate with the projected trends of the mobility system. It is crucial to highlight that negative loadings, in this context, indicate inverse relationships and must be interpreted carefully within the specific framework of the AMB metropolitan system, without being assumed as negative effects per se. This qualitative reading establishes a robust bridge between statistical analysis and the complexity of urban reality, which is fundamental for the formulation of effective strategies and interventions in mobility. To gain further insight into the patterns revealed by both the factor analysis and the correlation matrix, a complementary analysis of direct correlations was conducted between key mobility system variables and the main transport modes. This exercise provides a more granular perspective on the functional relationships that structure the distinct modal patterns observed in the AMB.
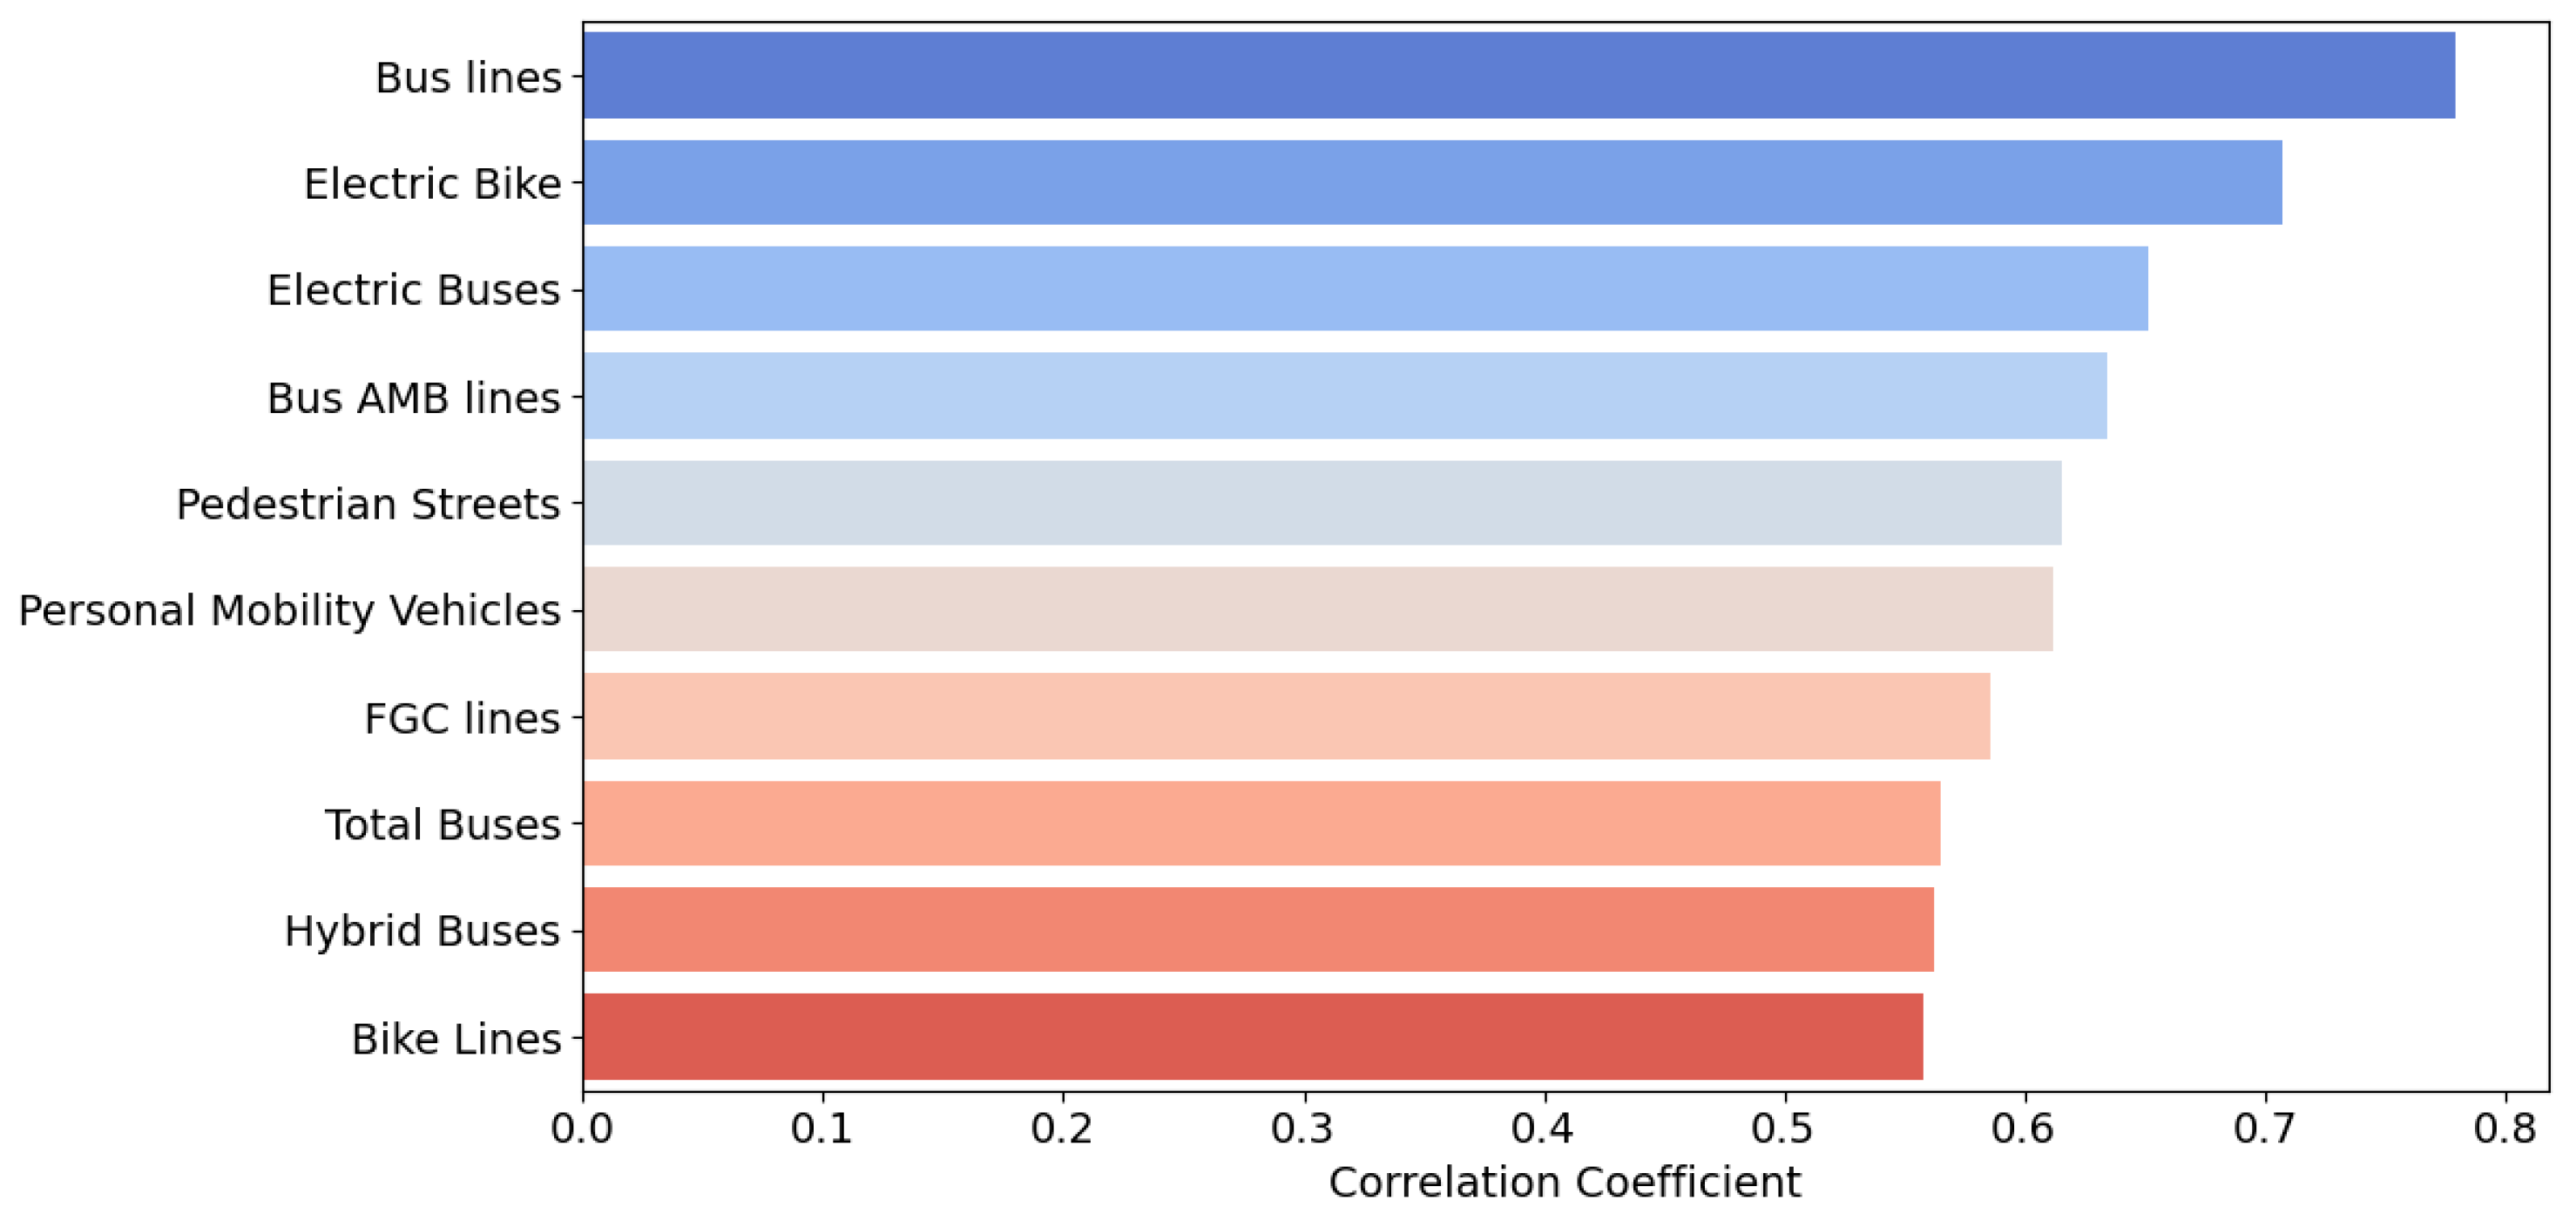
- Active mobility (Figure 8): The highest correlations with the active mobility variable were recorded for bus line length, electric bicycle use, and electric bus availability. This finding suggests that robust public transport infrastructure, combined with sustainable mobility technology options, acts as a catalyst for non-motorized travel. Furthermore, pedestrian streets and personal mobility vehicles are highlighted, reinforcing the creation of urban environments oriented towards active accessibility. These relationships are closely aligned with the urban strategies promoted by Barcelona City Council, such as the expansion of the Bicivia network, the implementation of segregated bike lanes, smart parking programs like Bicibox, and the consolidation of green axes in densely urbanized areas, which prioritize pedestrians and cyclists.
- Public transport (Figure 9): the strongest correlations with the public transport variable were observed in bicycle use, electric bicycle stations, diesel/biodiesel buses, and the length of the Rodalies network. This pattern indicates consolidated intermodality, where sustainable modes like cycling effectively interact with collective transport modes. Additionally, the structural role of both railway networks and conventional bus fleets in providing a public service is reinforced. These synergies are consistent with the objectives of the metropolitan area’s LEZ, which seeks to discourage the use of polluting private vehicles in favor of public transport and shared mobility.
- Car use (Figure 10): significant positive associations were identified with motorcycle or moped use and, notably, with mechanical bicycles. This could indicate patterns of shared mobility or modal alternation in certain urban environments. Furthermore, correlations were observed with the young driver rate and monthly subscription, which might be linked to seasonal variations or specific sociodemographic profiles in private vehicle use. These patterns can be interpreted within the framework of measures such as the reorganization of urban space through superblocks, which aim to restrict motorized traffic in residential areas, and youth mobility policies that include differentiated fares and shared micromobility services.
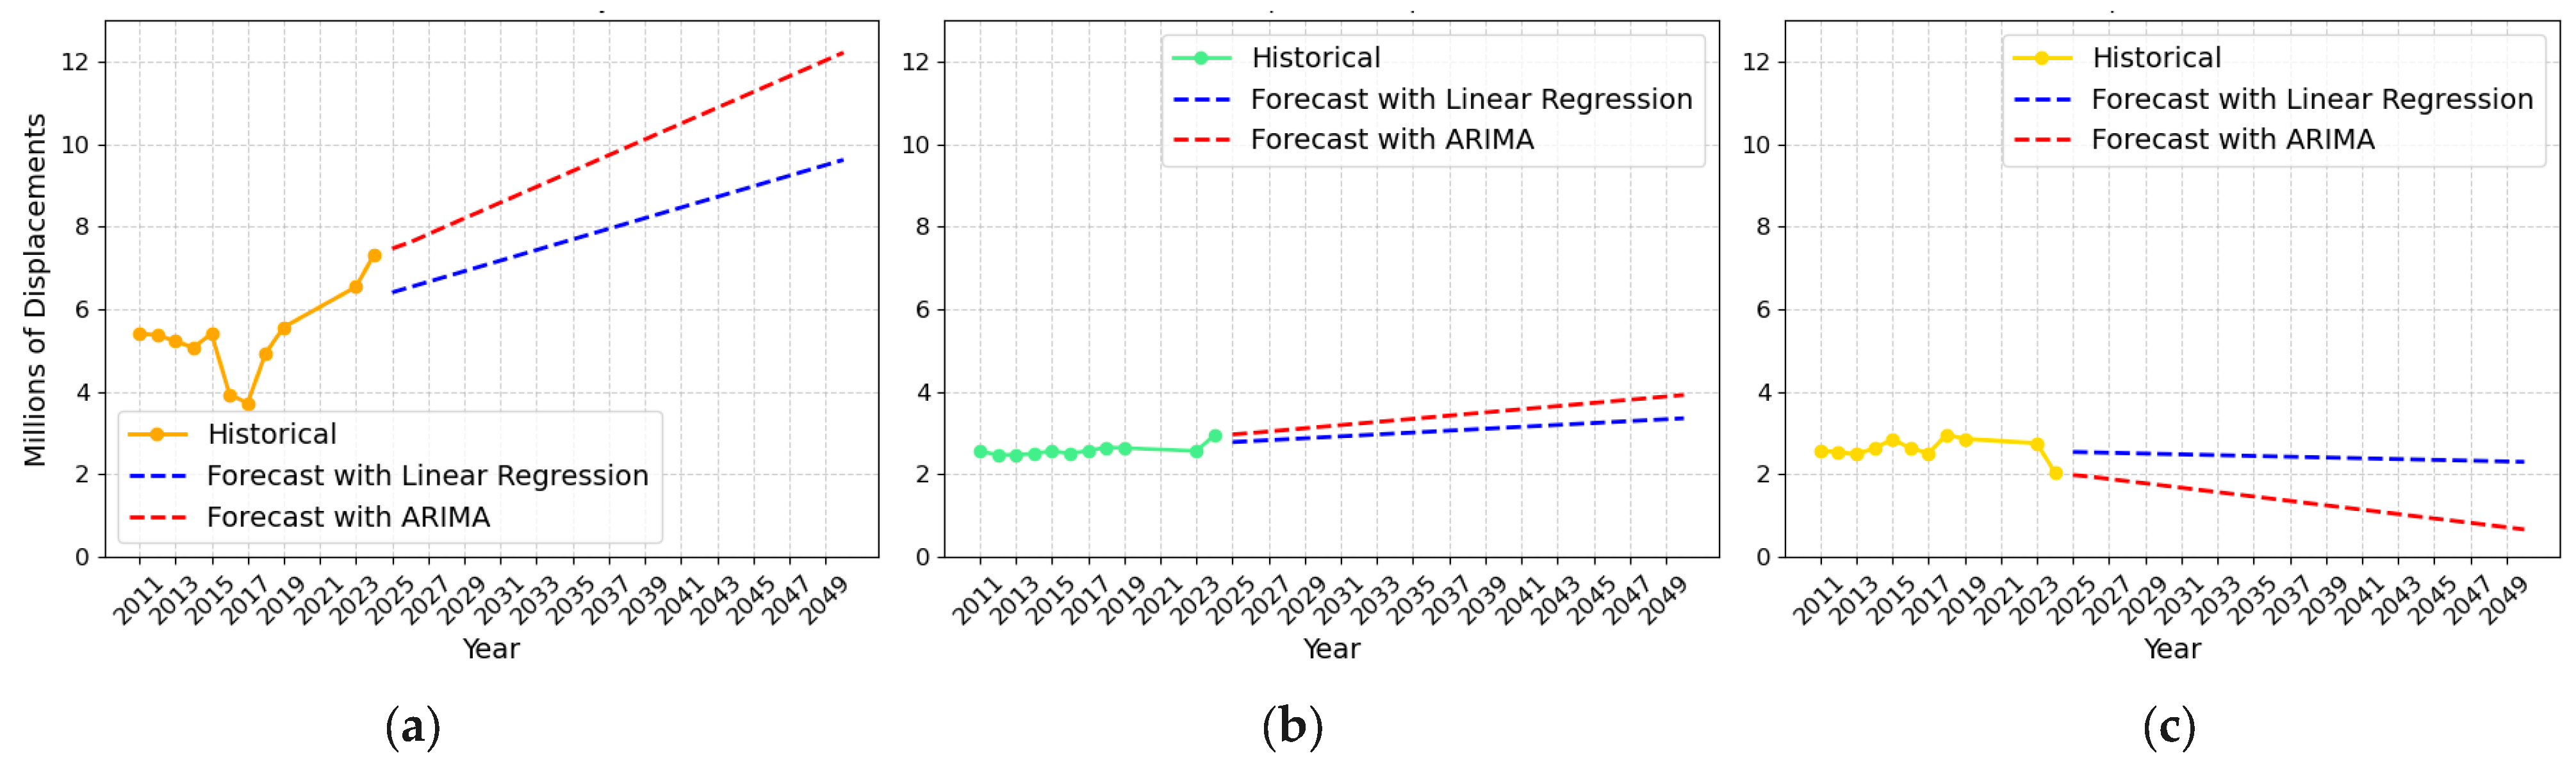
3.2. Trend Analysis and Projections of Mobility in the AMB
3.2.1. Statistical Evaluation of Projection Models
3.2.2. Global Comparison Between Methodologies and General Projections
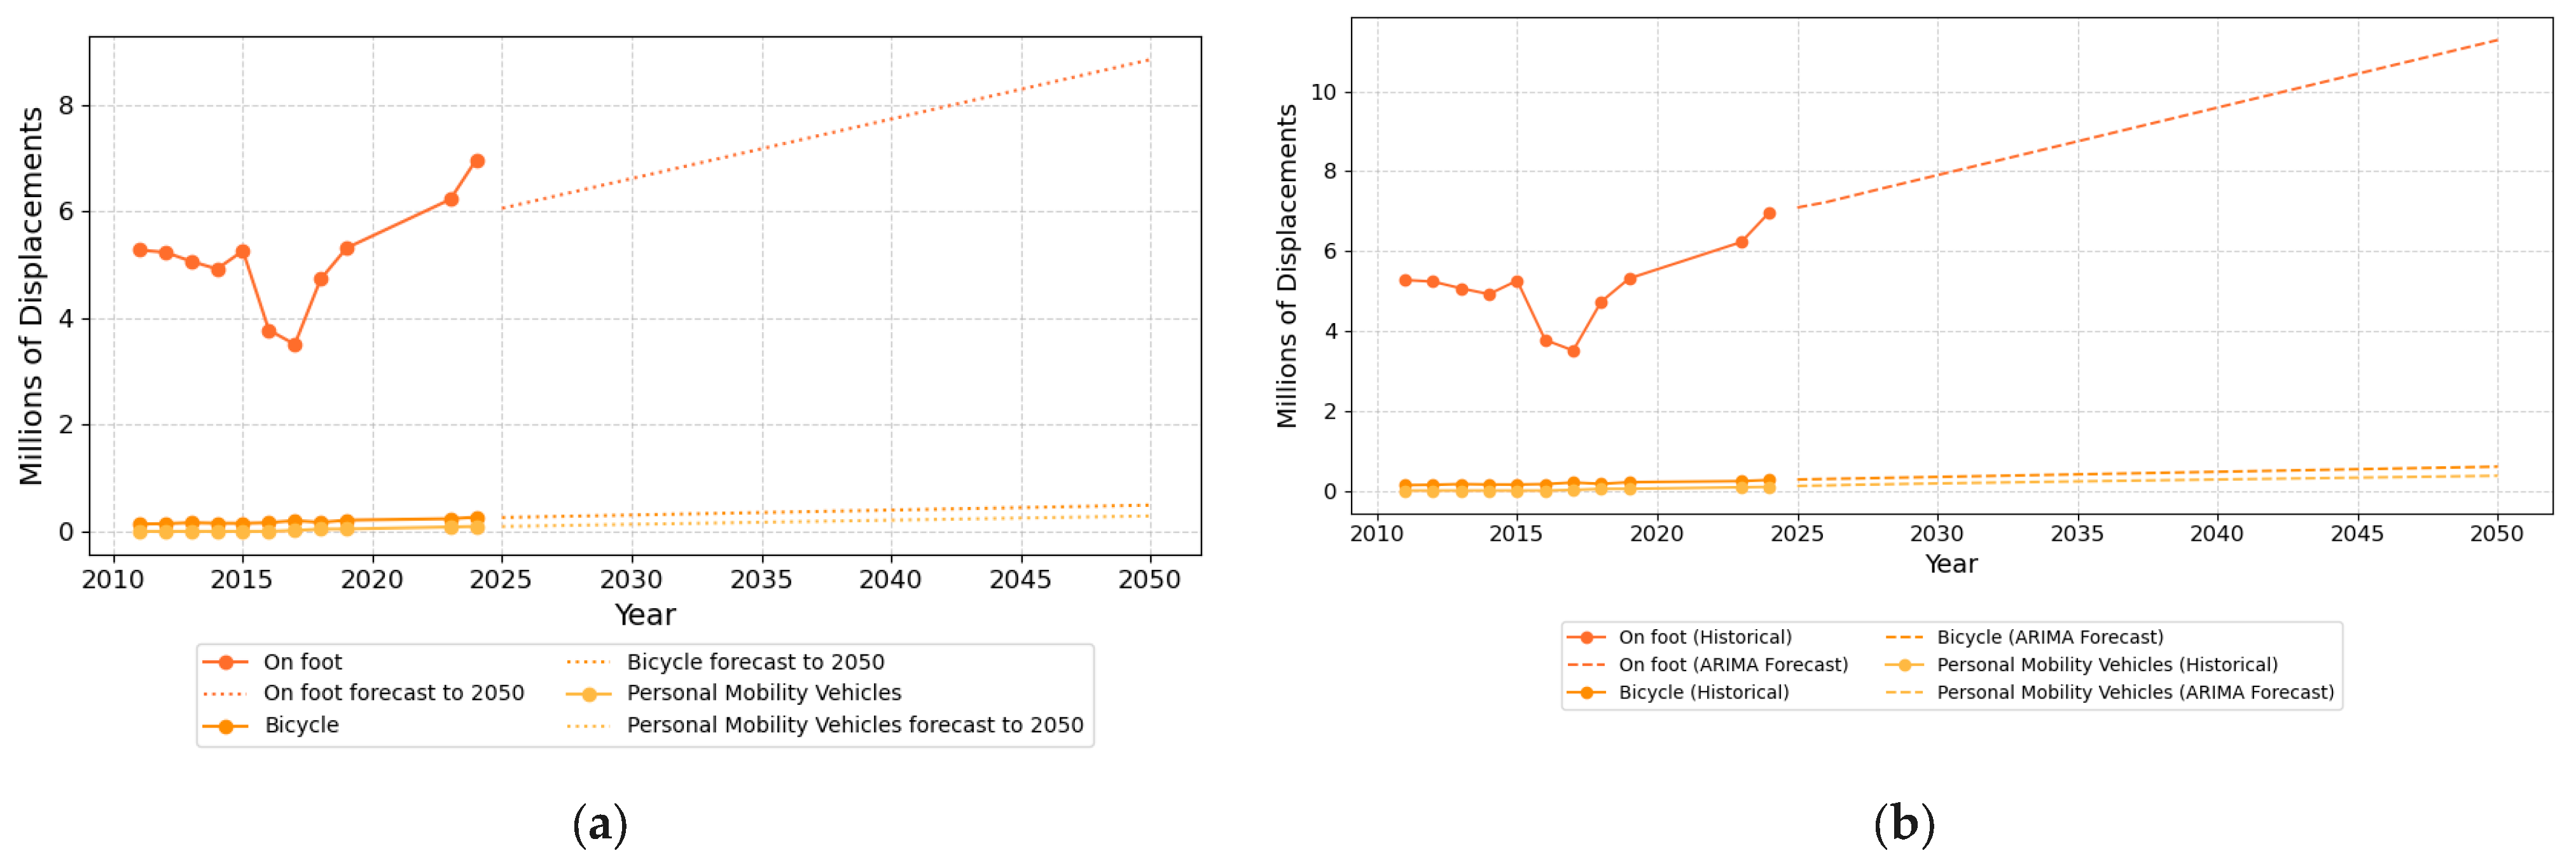
3.2.3. Active Mobility (Walking, Cycling, and PMVs)
- Walking consolidates its position as the predominant active mobility mode. Both the linear regression and ARIMA models project a significant increase. However, the ARIMA model anticipates more pronounced acceleration, driven by recent trends and possibly influenced by urban policies such as superblocks and green axes, which have reallocated public space in favor of pedestrians. This result confirms that walking will remain central to the proximity city model promoted by the AMB.
- In the case of cycling, both methodologies project a notable positive evolution. The linear model indicates a doubling of trips by 2050, while ARIMA suggests an even steeper slope. This points to the greater sensitivity of cycling to short- and medium-term policies, such as the expansion of the Bicivia network, improvements in cycling connectivity, and the growing culture of shared use. The anticipated trend validates current investments and highlights the potential of cycling as a key component of the modal shift.
- Finally, personal mobility vehicles (PMVs) exhibit more moderate growth. The linear regression shows a constant progression, while ARIMA captures some variability that could be related to regulatory uncertainties, conflicts with other modes, or still nascent infrastructure. Nevertheless, both models agree that PMVs will increase their participation in the system, though the total volumes are still lower than walking or cycling.
3.2.4. Public Transport (Metro, Bus, Train, and Other Modes)
- In the case of the metro, there is a constant increase in the projected number of trips, with particularly accelerated progression under the ARIMA model. This trend can be linked to the consolidation of strategic investments in line extensions, automation, and improved service frequency. Furthermore, it reflects a growing modal preference, driven by public transport prioritization policies, the optimization of punctuality, and intermodal integration strategies. The divergence observed between both models suggests that the metro, as the backbone of the transport network, could respond with greater dynamism and strength to active policies reinforcing the structural network.
- The bus network maintains more moderate, but sustained, growth according to both models. This behavior could reflect the positive effects of measures such as the implementation of the LEZ, superblocks, green axes, and the redesign of public space through parking regulation, which collectively favors the accessibility and use of collective transport over private cars.
- In the case of railway transport (FGC and Rodalies), growth is more gradual. This can be attributed to its high dependence on long-term structural investment plans, which typically have longer implementation cycles.
- The rest of the public transport group (including trams, funiculars, or special services) also shows slow but continuous expansion. Given their smaller relative weight in the overall system, their projected evolution is stable, although their role could be enhanced if they are more firmly integrated into intermodality strategies.
3.2.5. Private Vehicle Use
- In the case of automobiles, both models agree on projecting a sustained decrease. However, the ARIMA model anticipates a faster and more pronounced reduction, which suggests a greater sensitivity to recent transformations of the urban system. This behavior is consistent with the cumulative effects of restrictive policies such as the LEZ, the expansion of the superblock model, the creation of green axes and pacified zones, the limitation of parking through differentiated fees, and the promotion of more sustainable alternatives.
- For motorcycles and mopeds, the linear regression suggests a slightly upward evolution, while the ARIMA model projects stabilization or even a slight decrease in the long term. This difference may be associated with the recent growth of these vehicles as car substitutes in urban environments, although their future could be affected by their inclusion in future environmental regulations or by the rise in personal mobility vehicles (PMVs).
- Regarding vans, light trucks, and other private vehicles, both models project a gradual increase, though more moderate in the case of the ARIMA model. This pattern suggests that these modes, associated with urban logistics and distribution, might be less sensitive to general individual mobility restrictions, as they involve economic and work-related uses that are more difficult to replace.
3.3. Comparative Analysis of Urban Mobility Strategies
- Amsterdam must manage the continuous improvement and maintenance of its vast cycling infrastructure in a densely populated environment, while integrating new technologies without compromising its established cycling culture.
- Copenhagen faces the need to expand and optimize cycling infrastructure in its peripheral areas, further strengthening integration with public transport. Additionally, it must manage traffic growth and proactively adapt to new mobility technologies.
- Barcelona, in turn, faces the challenge of consolidating and expanding its superblock and green corridor projects. Achieving the effective integration of these new infrastructures with the existing public transport network is essential, as is managing the necessary cultural shift toward truly sustainable mobility, particularly in the context of its complex metropolitan area.
- Administrative fragmentation: metropolitan governance largely depends on voluntary cooperation among municipalities and complex political alignment across the levels of government (local, autonomous, and state). This structure can slow down decision-making and coordinated implementation.
- Limited competencies: the AMB does not manage all infrastructure or transport modes. For example, the Rodalies network falls under state jurisdiction, numerous urban infrastructures depend on the Generalitat de Catalunya, and municipalities retain significant control over their local street networks.
- Territorial inequalities: substantial differences persist between central and peripheral municipalities regarding access to quality public transport, cycling infrastructure, and the application of restrictions on private car use, leading to heterogeneous mobility across the metropolitan area.
- Uneven policy implementation: key measures such as the ZBE, the superblock model, or green axes have not been adopted with the same degree of commitment or intensity in all metropolitan municipalities, which reduces their regional impact and effectiveness.
4. Discussion
5. Conclusions
- Local governments and AMB: support for decision-making through evidence on which strategies are working and where adjustments are needed.
- Transport operators: need to invest in service quality, intermodality, and clean technologies.
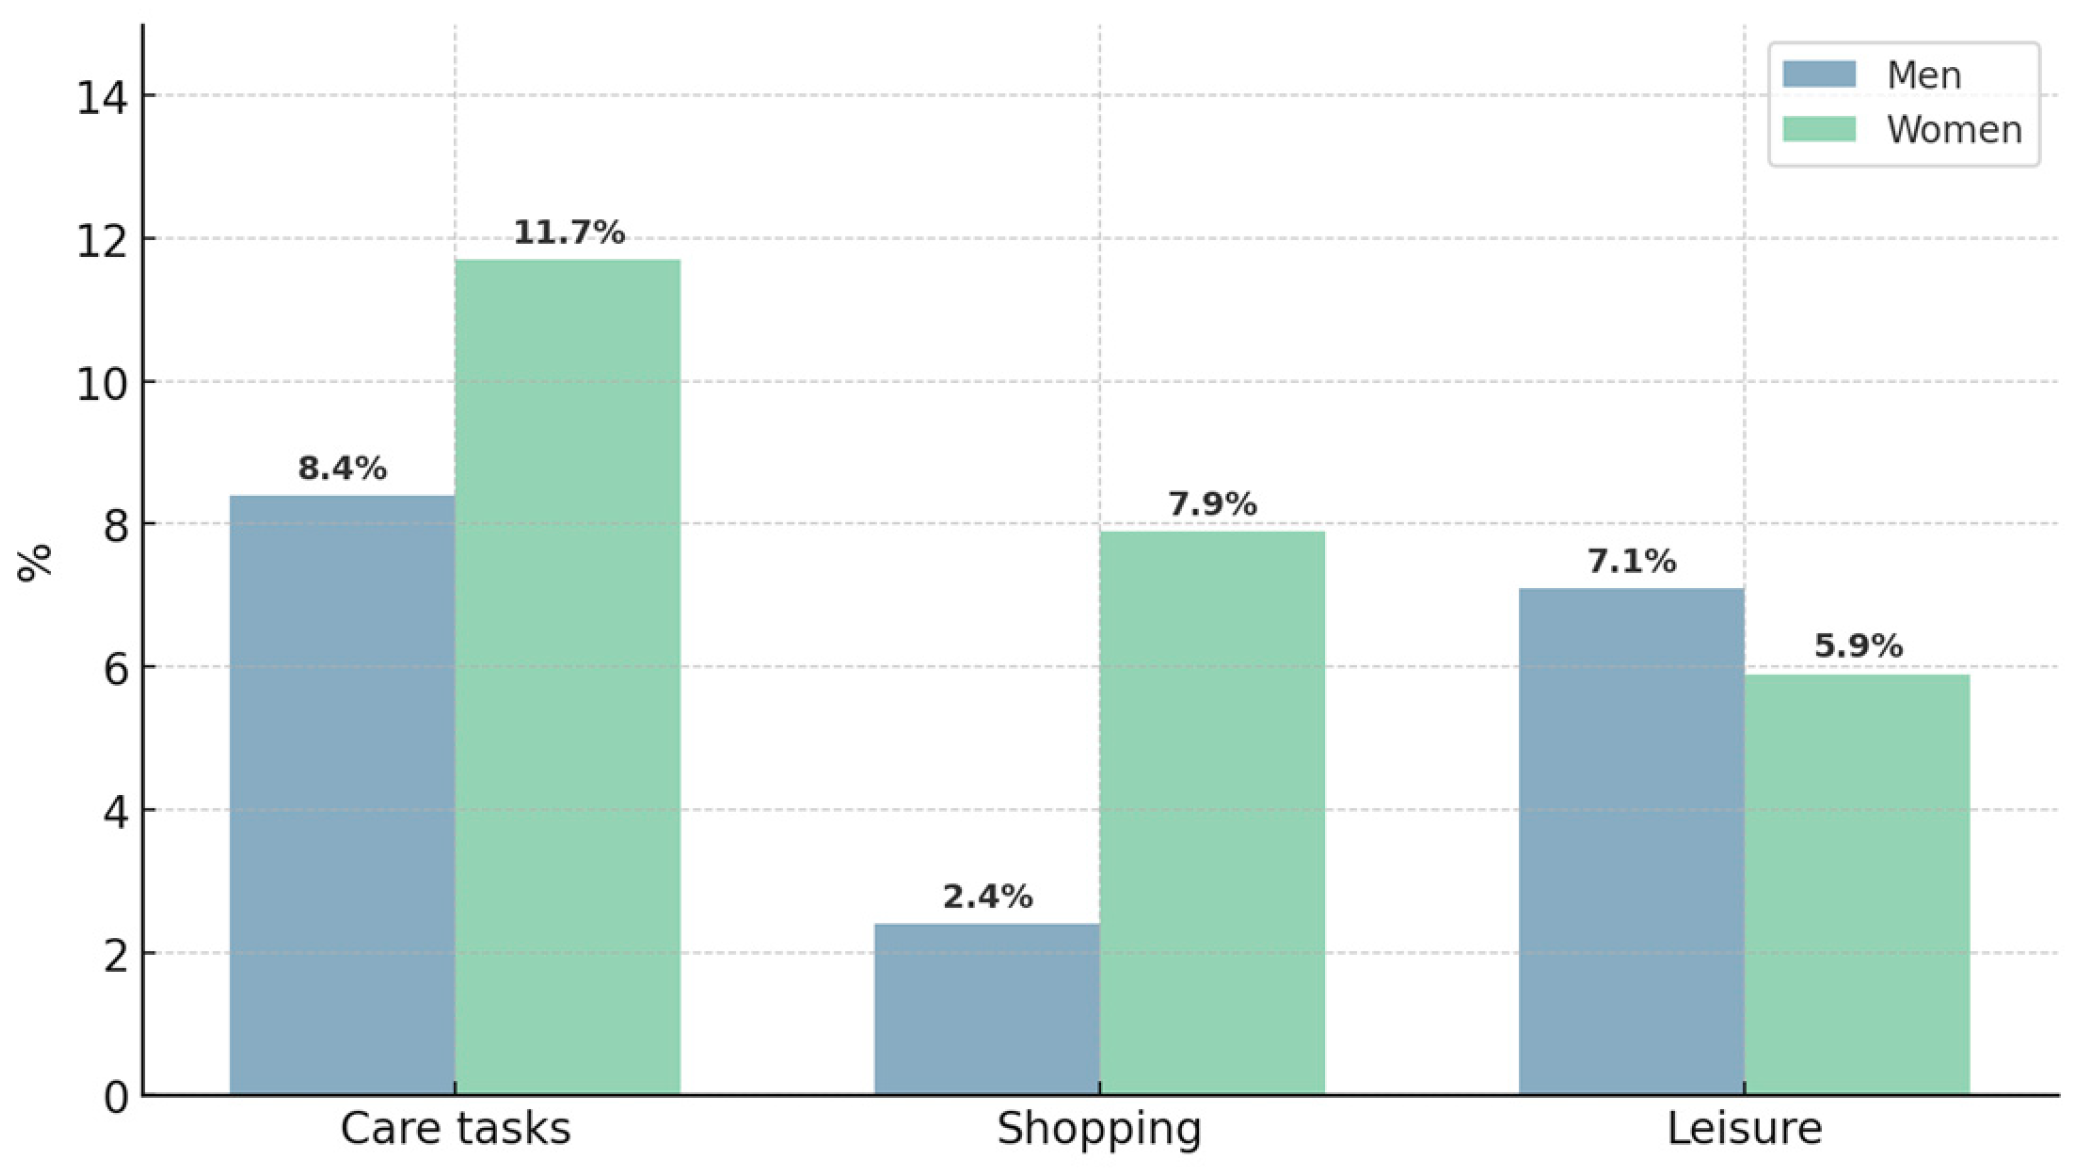
- Citizens: access to healthier, more affordable, and equitable mobility, although this also entails cultural changes that require institutional support.
- The spatial modeling of the identified factors;
- The simulation of prospective scenarios with governance and behavioral variables;
- The study of the impact of new technologies on modal distribution and equity;
- The evaluation of the distributive effects of current policies on vulnerable groups.
Author Contributions
Funding
Institutional Review Board Statement
Informed Consent Statement
Data Availability Statement
Conflicts of Interest
References
- UN-Habitat. World Cities Report 2022: Envisaging the Future of Cities. Available online: https://unhabitat.org/wcr/2022/ (accessed on 20 June 2024).
- Kuss, P.; Nicholas, K.A. A dozen effective interventions to reduce car use in European cities: Lessons learned from a meta-analysis and transition management. Case Stud. Transp. Policy 2022, 10, 1494–1513. [Google Scholar] [CrossRef]
- IPCC. Sixth Assessment Report. Available online: https://www.ipcc.ch/report/ar6/ (accessed on 20 June 2024).
- Gallo, M.; Marinelli, M. Sustainable mobility: A Review of Possible Actions and Policies. Sustainability 2020, 12, 7499. [Google Scholar] [CrossRef]
- Barbarossa, L. The post pandemic city: Challenges and Opportunities for a Non-Motorized Urban Environment. Sustainability 2020, 12, 7172. [Google Scholar] [CrossRef]
- Richter, M.A.; Hagenmaier, M.; Bandte, O.; Parida, V. Smart cities, urban mobility and autonomous vehicles: How Different cities need Different Sustainable Investment Strategies. Technol. Forecast. Soc. Change 2022, 180, 121561. [Google Scholar] [CrossRef]
- Jacobs, J. The Death and Life of Great American Cities; Random House: New York, NY, USA, 1961. [Google Scholar]
- Gehl, J. Cities for People; Island Press: Washington, DC, USA, 2010. [Google Scholar]
- Municipality of Amsterdam. Long-Term Bicycle Plan 2017–2022. Department of Traffic and Public Space. City of Amsterdam 2017. Available online: https://www.dutchamsterdam.nl/i/aa/2024/04/Amsterdam-Long-term_Bicycle_Plan_2017-2022_web.pdf (accessed on 12 April 2024).
- Municipality of Copenhagen. Bicycle Account, Copenhagen; Technical and Environmental Administration: Copenhagen, Denmark, 2022; Available online: https://kk.sites.itera.dk/apps/kk_pub2/index.asp?mode=detalje&id=2420 (accessed on 12 April 2024).
- Aloi, A.; Alonso, B.; Benavente, J.; Cordera, R.; Echániz, E.; González, F. Effects of the COVID-19 lockdown on urban mobility: Empirical evidence from the city of Santander (Spain). Sustainability 2020, 12, 3870. [Google Scholar] [CrossRef]
- Delclòs-Alió, X.; Miralles-Guasch, C. Suburban travelers pressed for time: Exploring the temporal implications of metropolitan commuting in Barcelona. J. Transp. Geogr. 2018, 66, 84–93. [Google Scholar] [CrossRef]
- Miskolczi, M.; Földes, D.; Munkácsy, A. Urban mobility scenarios until the 2030s. Sustain. Cities Soc. 2021, 72, 103056. [Google Scholar] [CrossRef]
- Magrinya, F.; Josep, M.-A.; Borja, R.-A. Merging green and active transportation infrastructure towards an equitable accessibility to green areas: Barcelona green axes. Land 2023, 12, 919. [Google Scholar] [CrossRef]
- Ajuntament de Barcelona. Anuari Estadístic de la Ciutat de Barcelona 2023; Departament d’Estadística i Difusió de Dades: Barcelona, Spain, 2023; Available online: https://ajuntament.barcelona.cat/premsa/wp-content/uploads/2024/12/Anuari2023.pdf (accessed on 26 June 2025).
- Área Metropolitana de Barcelona (AMB). Pla Director Urbanístic Metropolità (PDUM): Barcelona, Spain. 2023. Available online: https://urbanisme.amb.cat/informar-se/document-aprovacio-inicial (accessed on 30 October 2024).
- Área Verda. Història del Sistema AREA (Zones Verdes i Blaves). Available online: https://areaverda.cat/es/informacion/historia (accessed on 26 June 2025).
- Rueda, S. La supermanzana, nueva célula urbana para la construcción de un nuevo modelo funcional y urbanístico de Barcelona. In Aproximaciones Contemporáneas al Paisaje Urbano; University de la Rioja: Logroño, Spain, 2021. [Google Scholar]
- Ajuntament de Barcelona. Superilles Barcelona. Available online: https://ajuntament.barcelona.cat/superilles/es# (accessed on 30 October 2024).
- Ajuntament de Barcelona. Datos Básicos de la Movilidad en la Ciudad. Available online: https://www.barcelona.cat/mobilitat/es/actualidad-y-recursos/datos-basicos-de-la-movilidad-en-la-ciudad (accessed on 27 October 2024).
- Ajuntament de Barcelona. Pla de Mobilitat Urbana 2013–2018. Available online: https://bcnroc.ajuntament.barcelona.cat/jspui/handle/11703/85163 (accessed on 28 October 2024).
- Ajuntament de Barcelona. Dades Bàsiques de Mobilitat. Available online: https://dades.ajuntament.barcelona.cat/dades-basiques-de-mobilitat/ (accessed on 26 June 2025).
- Royo-Zabala, P.; Martí-Casanovas, M.; Gómez-Escoda, E. Hacia la vélometrópolis: La Infraestructura. Ciclable En Barcelona 2024, 56, 220. Available online: https://recyt.fecyt.es/index.php/CyTET/article/view/104350 (accessed on 20 May 2025).
- Área Metropolitana de Barcelona. Xarxa Bicivia Metropolitana. Available online: https://www.amb.cat/web/mobilitat/projectes-oberts/detall/-/projecteobert/bicivia/6439486/11704 (accessed on 30 October 2024).
- Área Metropolitana de Barcelona. 4t Informe de Seguiment del PMMU 2019–2024; Área Metropolitana de Barcelona: Barcelona, Spain, 2023; Available online: https://mobilitat.amb.cat. (accessed on 20 May 2025).
- Ajuntament de Barcelona. Zona de Baixes Emissions Rondes de Barcelona (ZBE). Available online: https://ajuntament.barcelona.cat/mediambient/ca/contaminacio-i-salut/zones-de-baixes-emissions (accessed on 30 October 2024).
- Institut Metròpoli. Pla Metropolità de Mobilitat Urbana (PMMU) 2019–2024. Available online: https://www.institutmetropoli.cat/es/estudi/plan-metropolitano-de-movilidad-urbana-pmmu-2019–2024/ (accessed on 27 October 2024).
- European Commission. European Green Deal. 2019. Available online: https://commission.europa.eu/strategy-and-policy/priorities-2019-2024/european-green-deal_en (accessed on 24 April 2025).
- United Nations. Transforming Our World: The 2030 Agenda for Sustainable Development. Available online: https://sdgs.un.org/2030agenda (accessed on 24 April 2025).
- Furno, A.; Zanella, A.F.; Stanica, R.; Fiore, M. Spatial and Temporal Exploratory Factor Analysis of Urban Mobile Data Traffic. Data Sci. Transp. 2024, 6, 1–18. [Google Scholar] [CrossRef]
- Daroncho, C.; Parez Martinez, P.J. Impact of the pandemic on urban mobility: Exploratory Factor Analysis of Evidence from Students at MRSP Fatecs. Contrib. Cienc. Soc. 2023, 16, 12. [Google Scholar] [CrossRef]
- Crespo, J.E.; Sandoval-Vázquez, F.R. Análisis factorial exploratorio de la movilidad en el transporte público derivado del desarrollo sustentable. Revista Internacional de Ciencias Sociales 2024, 11. [Google Scholar] [CrossRef]
- Cheng, H.; Li, M.; Zhang, H. Research on the Urban Bike-sharing Usage based on ARIMA Model. Trans. Comput. Sci. Intell. Syst. Res. 2024, 2, 166–172. [Google Scholar] [CrossRef]
- Zhang, M. Enhancing periodic mobility planning: ARIMA-driven prognostications for subway passenger volume dynamics. Appl. Comput. Eng. 2024, 101, 224–232. [Google Scholar] [CrossRef]
- Garcia, E.; Calvet, L.; Carracedo, P.; Serrat, C.; Miró, P.; Torbati Peyman, M. Predictive Analyses of Traffic Level in the City of Barcelona: From ARIMA to eXtreme Gradient Boosting. Appl. Sci. 2024, 14, 4432. [Google Scholar] [CrossRef]
- Enquesta de Mobilitat en Dia Feiner (EMEF). Available online: https://emef.cat/ (accessed on 18 February 2025).
- Institut d’Estadística de Catalunya (IDESCAT). Available online: https://www.idescat.cat/ (accessed on 27 January 2025).
- Autoritat del Transport Metropolità (ATM). Available online: https://www.atm.cat/ (accessed on 18 February 2025).
- Transports Metropolitans de Barcelona (TMB). Available online: https://www.tmb.cat/ca (accessed on 18 February 2025).
- Observatori de la Mobilitat de Catalunya (OMC). Available online: https://omc.cat/es/ (accessed on 18 February 2025).
- Costello, A.B.; Osborne, J.W. Best practices in exploratory factor analysis: Four Recommendations for Getting the most from your Analysis. Pract. Assess. Res. Evaluation. 2005, 10, 7. [Google Scholar] [CrossRef]
- European Environment Agency. Corine Land Cover (CLC) 2018, Version 2020_20u1; Copernicus Land Monitoring Service: Copenhagen, Denmark, 2018; Available online: https://land.copernicus.eu/pan-european/corine-land-cover (accessed on 25 June 2025).
- European Environment Agency. Urban Atlas 2018; Copernicus Land Monitoring Service: Copenhagen, Denmark, 2018; Available online: https://land.copernicus.eu/local/urban-atlas (accessed on 25 June 2025).
- Pucher, J.; Buehler, R. Cycling for Sustainable Cities; MIT Press: Cambridge, MA, USA, 2021. [Google Scholar]
- Martens, K. Transport Justice: Designing Fair Transportation Systems; Routledge: London, UK, 2017. [Google Scholar]


| Code | Variable | Description | Unit | Source |
|---|---|---|---|---|
| AP | On foot | Annual estimate of trips made by active mobility on an average working day, extrapolated to the year in the AMB | Thousands of trips/year | EMEF |
| BC | Bicycle | |||
| VMP | Personal mobility vehicles | |||
| TMA | Total active mobility | |||
| AB | Bus | Annual estimate of trips made by public transport on an average working day, extrapolated to the year in the AMB | Thousands of trips/year | EMEF |
| MT | Metro | |||
| TR | Train | |||
| RTP | Other public transportation | |||
| TTP | Total public transportation | |||
| AM | Automobile | Annual estimate of trips made by private vehicle on an average working day, extrapolated to the year in the AMB | Thousands of trips/year | EMEF |
| MC | Motorcycle/moped | |||
| OVP | Van, truck and other private vehicles | |||
| TVP | Total private vehicle | |||
| TTJ | Youth Transportation Fare | Quarterly transportation fare for young people | EUR/quarter | IDESCAT/ATM |
| TM | Monthly rate | Monthly transportation fee | EUR/month | IDESCAT/ATM |
| TI | Individual rate | Single trip rate | EUR/trip | IDESCAT/ATM |
| DM | Metro Demand | Total volume of public transport trips, registered in the transport system, reported by operators | Millions of trips/year | IDESCAT/ATM |
| DFGC | FGC Demand | |||
| DRD | Demand Rodalies | |||
| DTR | Tram Demand | |||
| DAB | Demand Bus TB | |||
| DBAMB | Demand AMB Bus | |||
| DTTP | Total Public Transportation Demand | |||
| LM | Metro Lines | Total number of metro lines in operation in the Barcelona metropolitan transport system | Lines | IDESCAT/ATM |
| LFGC | FGC lines | Number of FGC operating lines within the AMB | Lines | IDESCAT/ATM |
| LAB | TB Bus Lines | Number of urban bus lines operated by TMB in the city | Lines | IDESCAT/ATM |
| LBAMB | AMB Bus Lines | Number of intercity bus lines and metropolitan bus lines managed by the AMB | Lines | IDESCAT/ATM |
| TLTP | Total public transportation lines | Number of lines of total public transportation | Lines | IDESCAT/ATM |
| LRM | Length of Metro network | Total km of network in operation | Km | IDESCAT/ATM |
| LFGC | Length of FGC network | |||
| LRR | Length of Rodalies network | |||
| LATB | Network length Bus TB | |||
| LTAMB | Length of AMB bus network | |||
| LTRTP | Total length of public transportation network | |||
| EM | Metro Stations | Number of operational subway stations | Stations | IDESCAT/TMB |
| AEM | Accessibility of Metro stations | Accessible subway stations | Stations | IDESCAT/TMB |
| PAEM | Percentage of accessibility of Metro stations | Percentage of accessible subway stations | % | IDESCAT/TMB |
| ADB | Diesel/Biodiesel Buses | Number of buses with diesel/biodiesel propulsion in operation within the AMB | Buses | IDESCAT/TMB/AMB |
| AH | Hybrid Buses | Number of buses with hybrid propulsion in operation within AMB | Buses | IDESCAT/TMB/AMB |
| AE | Electric Buses | Number of buses with electric propulsion in operation within AMB | Buses | IDESCAT/TMB/AMB |
| AGN | Natural gas buses | Number of buses with natural gas propulsion in operation within the AMB | Buses | IDESCAT/TMB/AMB |
| TA | Total Buses | Total number of buses operating in the AMB, considering all propulsions. | Buses | IDESCAT/TMB/AMB |
| DB | Demand for bicycle service | Total annual bicycle trips recorded | Trips/year | Bicing |
| EBM | Mechanical bicycle stations | Number of mechanical stations available in the shared system | Stations | Bicing |
| BM | Mechanical bicycles | Number of mechanical bicycles available in the shared system | Bicycles | Bicing |
| BE | Electric bicycles | Number of electric bicycles available in the shared system | Bicycles | Bicing |
| EBE | Electric bicycle stations | Number of power stations available in the shared system | Stations | Bicing |
| PRP | Pedestrian priority | Pedestrian priority streets and zones | Ha | IERMB |
| VC | Cycle paths | Km of bicycle lanes | Km | OMC |
| C30 | Streets 30 Km | Streets with speed 30 Km | Km | OMC |
| CP | Pedestrian streets | Single-platform streets with pedestrian priority | Km | OMC |
| PAB | Punctuality Bus | AMB bus service punctuality rate | Score | OMC |
| Factor | Highest Loading Variables | Qualitative Interpretation | Explained Variance % | Cumulative Variance% |
|---|---|---|---|---|
| 1. Conventional transport infrastructure and pedestrian priority | Metro lines (−0.34), Bus AMB lines (−0.28), FGC Length (−0.35), Pedestrian Streets (−0.34) | Relatively low presence of traditional mass transport and pedestrian infrastructure. Reflects system configurations where these elements are not predominant. | 54% | 54.0% |
| 2. Integrated and active urban mobility | Bus lines (0.47), Bike Service Demand (0.42), Bus Length (0.15) | Pattern where collective transport supply aligns functionally with active mode demand. Reflects proximity-based, intermodal mobility. | 27.1% | 81.1% |
| 3. Low penetration of public micromobility | Bike Station for Electrics (−0.38), Bike Service Demand (−0.54) | Dimension where public micromobility services are underrepresented. May indicate dependence on other modes or limited system integration. | 6.8% | 87.9% |
| 4. Operational effi-ciency of bus transport | Bus Punctuality (0.62)) | Axis focused on the reliability of public transport, where punctuality stands out as a key attribute of operational effi-ciency. | 4.4% | 92.3% |
| Mode of Transport | R2 (Linear Regression) | p-Value (Linear Regression) | Ljung–Box p-Value (ARIMA) | Jarque–Bera p-Value (ARIMA) |
|---|---|---|---|---|
| Active Mobility | 0.288 | 0.089 | 0.39 | 0.46 |
| Public Transport | 0.53 | 0.011 | 0.34 | 0.02 |
| Private Vehicles | 0.027 | 0.632 | 1.0 | 0.64 |
Disclaimer/Publisher’s Note: The statements, opinions and data contained in all publications are solely those of the individual author(s) and contributor(s) and not of MDPI and/or the editor(s). MDPI and/or the editor(s) disclaim responsibility for any injury to people or property resulting from any ideas, methods, instructions or products referred to in the content. |
© 2025 by the authors. Licensee MDPI, Basel, Switzerland. This article is an open access article distributed under the terms and conditions of the Creative Commons Attribution (CC BY) license (https://creativecommons.org/licenses/by/4.0/).
Share and Cite
Sifuentes-Muñoz, C.; Arellano, B.; Roca, J. Sustainable Mobility in Barcelona: Trends, Challenges and Policies for Urban Decarbonization. Sustainability 2025, 17, 6964. https://doi.org/10.3390/su17156964
Sifuentes-Muñoz C, Arellano B, Roca J. Sustainable Mobility in Barcelona: Trends, Challenges and Policies for Urban Decarbonization. Sustainability. 2025; 17(15):6964. https://doi.org/10.3390/su17156964
Chicago/Turabian StyleSifuentes-Muñoz, Carolina, Blanca Arellano, and Josep Roca. 2025. "Sustainable Mobility in Barcelona: Trends, Challenges and Policies for Urban Decarbonization" Sustainability 17, no. 15: 6964. https://doi.org/10.3390/su17156964
APA StyleSifuentes-Muñoz, C., Arellano, B., & Roca, J. (2025). Sustainable Mobility in Barcelona: Trends, Challenges and Policies for Urban Decarbonization. Sustainability, 17(15), 6964. https://doi.org/10.3390/su17156964