Article

Regional Youth Population Prediction Using LSTM

Department of Urban Engineering, Chungbuk National University, Cheongju 28644, Republic of Korea
*
Author to whom correspondence should be addressed.
Sustainability 2025, 17(15), 6905; https://doi.org/10.3390/su17156905
Submission received: 2 June 2025 / Revised: 15 July 2025 / Accepted: 27 July 2025 / Published: 29 July 2025
(This article belongs to the Section Sustainable Urban and Rural Development)

Abstract

Regional shrinkage, driven by declining birth rates, an aging population, and population concentration in the capital region, has become an increasingly serious issue in South Korea, threatening the long-term sustainability of local communities. Among various factors, youth out-migration is a key driver, undermining the economic resilience and vitality of local areas. This study aims to predict youth population trends across 229 municipalities by incorporating diverse regional socioeconomic factors and providing a foundation for policy implementation to mitigate demographic disparities. To this end, a long short-term memory (LSTM) model, based on a direct approach that independently forecasts each future time point, was employed. The model was trained using the youth population data from 2003 to 2022 and socioeconomic variables, including employment, education, housing, and infrastructure. The results reveal a persistent nationwide decline in the youth population, with significantly sharper decreases in local areas than in the capital region. These findings underscore the deepening spatial imbalance and highlight the urgent need for region-specific demographic policies to address the accelerating risk of regional population decline.

1. Introduction

Population decline is increasingly observed worldwide, with particularly pronounced effects in rural regions and small towns. This trend has led to various challenges, including community disintegration, inadequate infrastructure, and rapid aging of the population. Such phenomena have been observed in both developed and developing nations [1,2]. This demographic decline stems from a range of structural factors, including low fertility rates, an aging population, and a lack of economic opportunities. Among these, persistent youth out-migration has been identified as a major accelerating force behind population decline, posing serious threats to the long-term sustainability of local communities [3].
This global trend is particularly pronounced in South Korea. In South Korea, these challenges have accelerated the phenomenon of regional shrinkage, whereby out-migration from local areas to the capital region undermines the sustainability of regional communities [4,5]. Regional shrinkage refers not only to a numerical decline in population but also to a comprehensive deterioration across economic, social, cultural, and administrative dimensions within affected areas. This phenomenon poses a serious threat not only to balanced national development but also to South Korea’s long-term development prospects. In response, the South Korean government has designated certain regions as population-declining areas and introduced policy measures to manage and mitigate these effects. However, while such short-term interventions are necessary, they are insufficient to address the underlying structural and multidimensional nature of regional population decline.
The youth population plays a vital role in local communities, serving as the driving force behind regional economic growth and as a foundation for sustainable development. A decline in the youth population within a region leads to a loss of economic vitality, weakens social and cultural foundations, and ultimately undermines local community resilience [6]. However, due to factors such as limited job opportunities, inadequate educational and cultural infrastructure, and poor living conditions, many young people are leaving local areas and relocating to the capital region [7,8,9]. As Korean society transitions into an aging society, the proportion of young people in local areas continues to decline [10].
Given that youth population decline has emerged as a key driver of regional shrinkage, previous studies have focused on identifying local risk areas and analyzing its impact on regional sustainability to develop effective response strategies [11,12,13]. In line with these efforts, various methodological approaches, ranging from traditional demographic models to machine learning techniques, have been employed to estimate youth population change, reflecting increased efforts to understand and anticipate demographic dynamics at both national and regional scales.
The cohort-component method (CCM), currently the most widely used approach to population prediction, is a standard technique employed by demographers for decades [14]. This method predicts future populations by applying fertility, mortality, and migration rates to age- and sex-specific population groups. It has been adopted as the basis for population projections by many national statistical offices and international organizations, such as the United Nations [15,16]. However, the CCM fundamentally relies on demographic data, and it is particularly challenging to produce stable estimates of age-specific migration or fertility rates in small areas or less-populated cities [17]. When the sample size is small, statistical variability increases, potentially leading to greater prediction errors.
Recognizing these limitations, recent studies have increasingly turned to machine learning techniques to predict fertility, mortality, migration, and population changes [18]. Studies using machine learning to predict populations aim to improve long-term prediction accuracy by capturing nonlinear and long-term trends that are difficult to model using CCM [19]. They have shown particularly strong performance in small-area population projections, where the CCM often falls short, by uncovering latent patterns in complex datasets.
At the same time, although the youth population is influenced by a wide range of factors, including employment opportunities, housing, and social infrastructure [20,21,22,23], there remains a notable lack of population prediction studies that comprehensively incorporate these variables. Most studies have focused on aggregate analyses at the national level or case studies limited to specific regions, while studies that cover the entire country and provide precise predictions that reflect the unique characteristics of individual small areas are exceedingly rare [24]. Therefore, there is a growing need for more sophisticated population prediction studies that comprehensively incorporate a range of social and economic factors influencing actual demographic changes and account for regional heterogeneity.
To this end, this study aims to empirically analyze the spatial dynamics of youth population change by predicting the youth population across 229 municipalities in South Korea by employing a deep-learning-based long short-term memory (LSTM) model. The LSTM model has been widely adopted in previous studies [25,26] owing to its ability to capture long-term dependencies, uncover nonlinear temporal patterns, and achieve high predictive accuracy, especially in the context of population predicting. Unlike previous studies that relied on linear trend extrapolation or focused solely on demographic indicators such as birth, death, and migration rates, this study integrates long-term time-series data with local socioeconomic variables to better reflect the structural and contextual factors influencing youth population change. Therefore, it can contribute to a detailed understanding of youth population trends and offer foundational data to support policy development in response to regional decline, thereby enhancing the effectiveness of policy measures.
The remainder of this paper is organized as follows. Section 2 describes the data sources and outlines the prediction methodology based on the LSTM model. Section 3 presents the predicted youth population outcomes and the results of the variable importance analysis. Section 4 presents a comprehensive discussion of the findings and their policy implications. Finally, Section 5 summarizes the key conclusions and outlines the limitations of the study for future research.

2. Data and Methodology
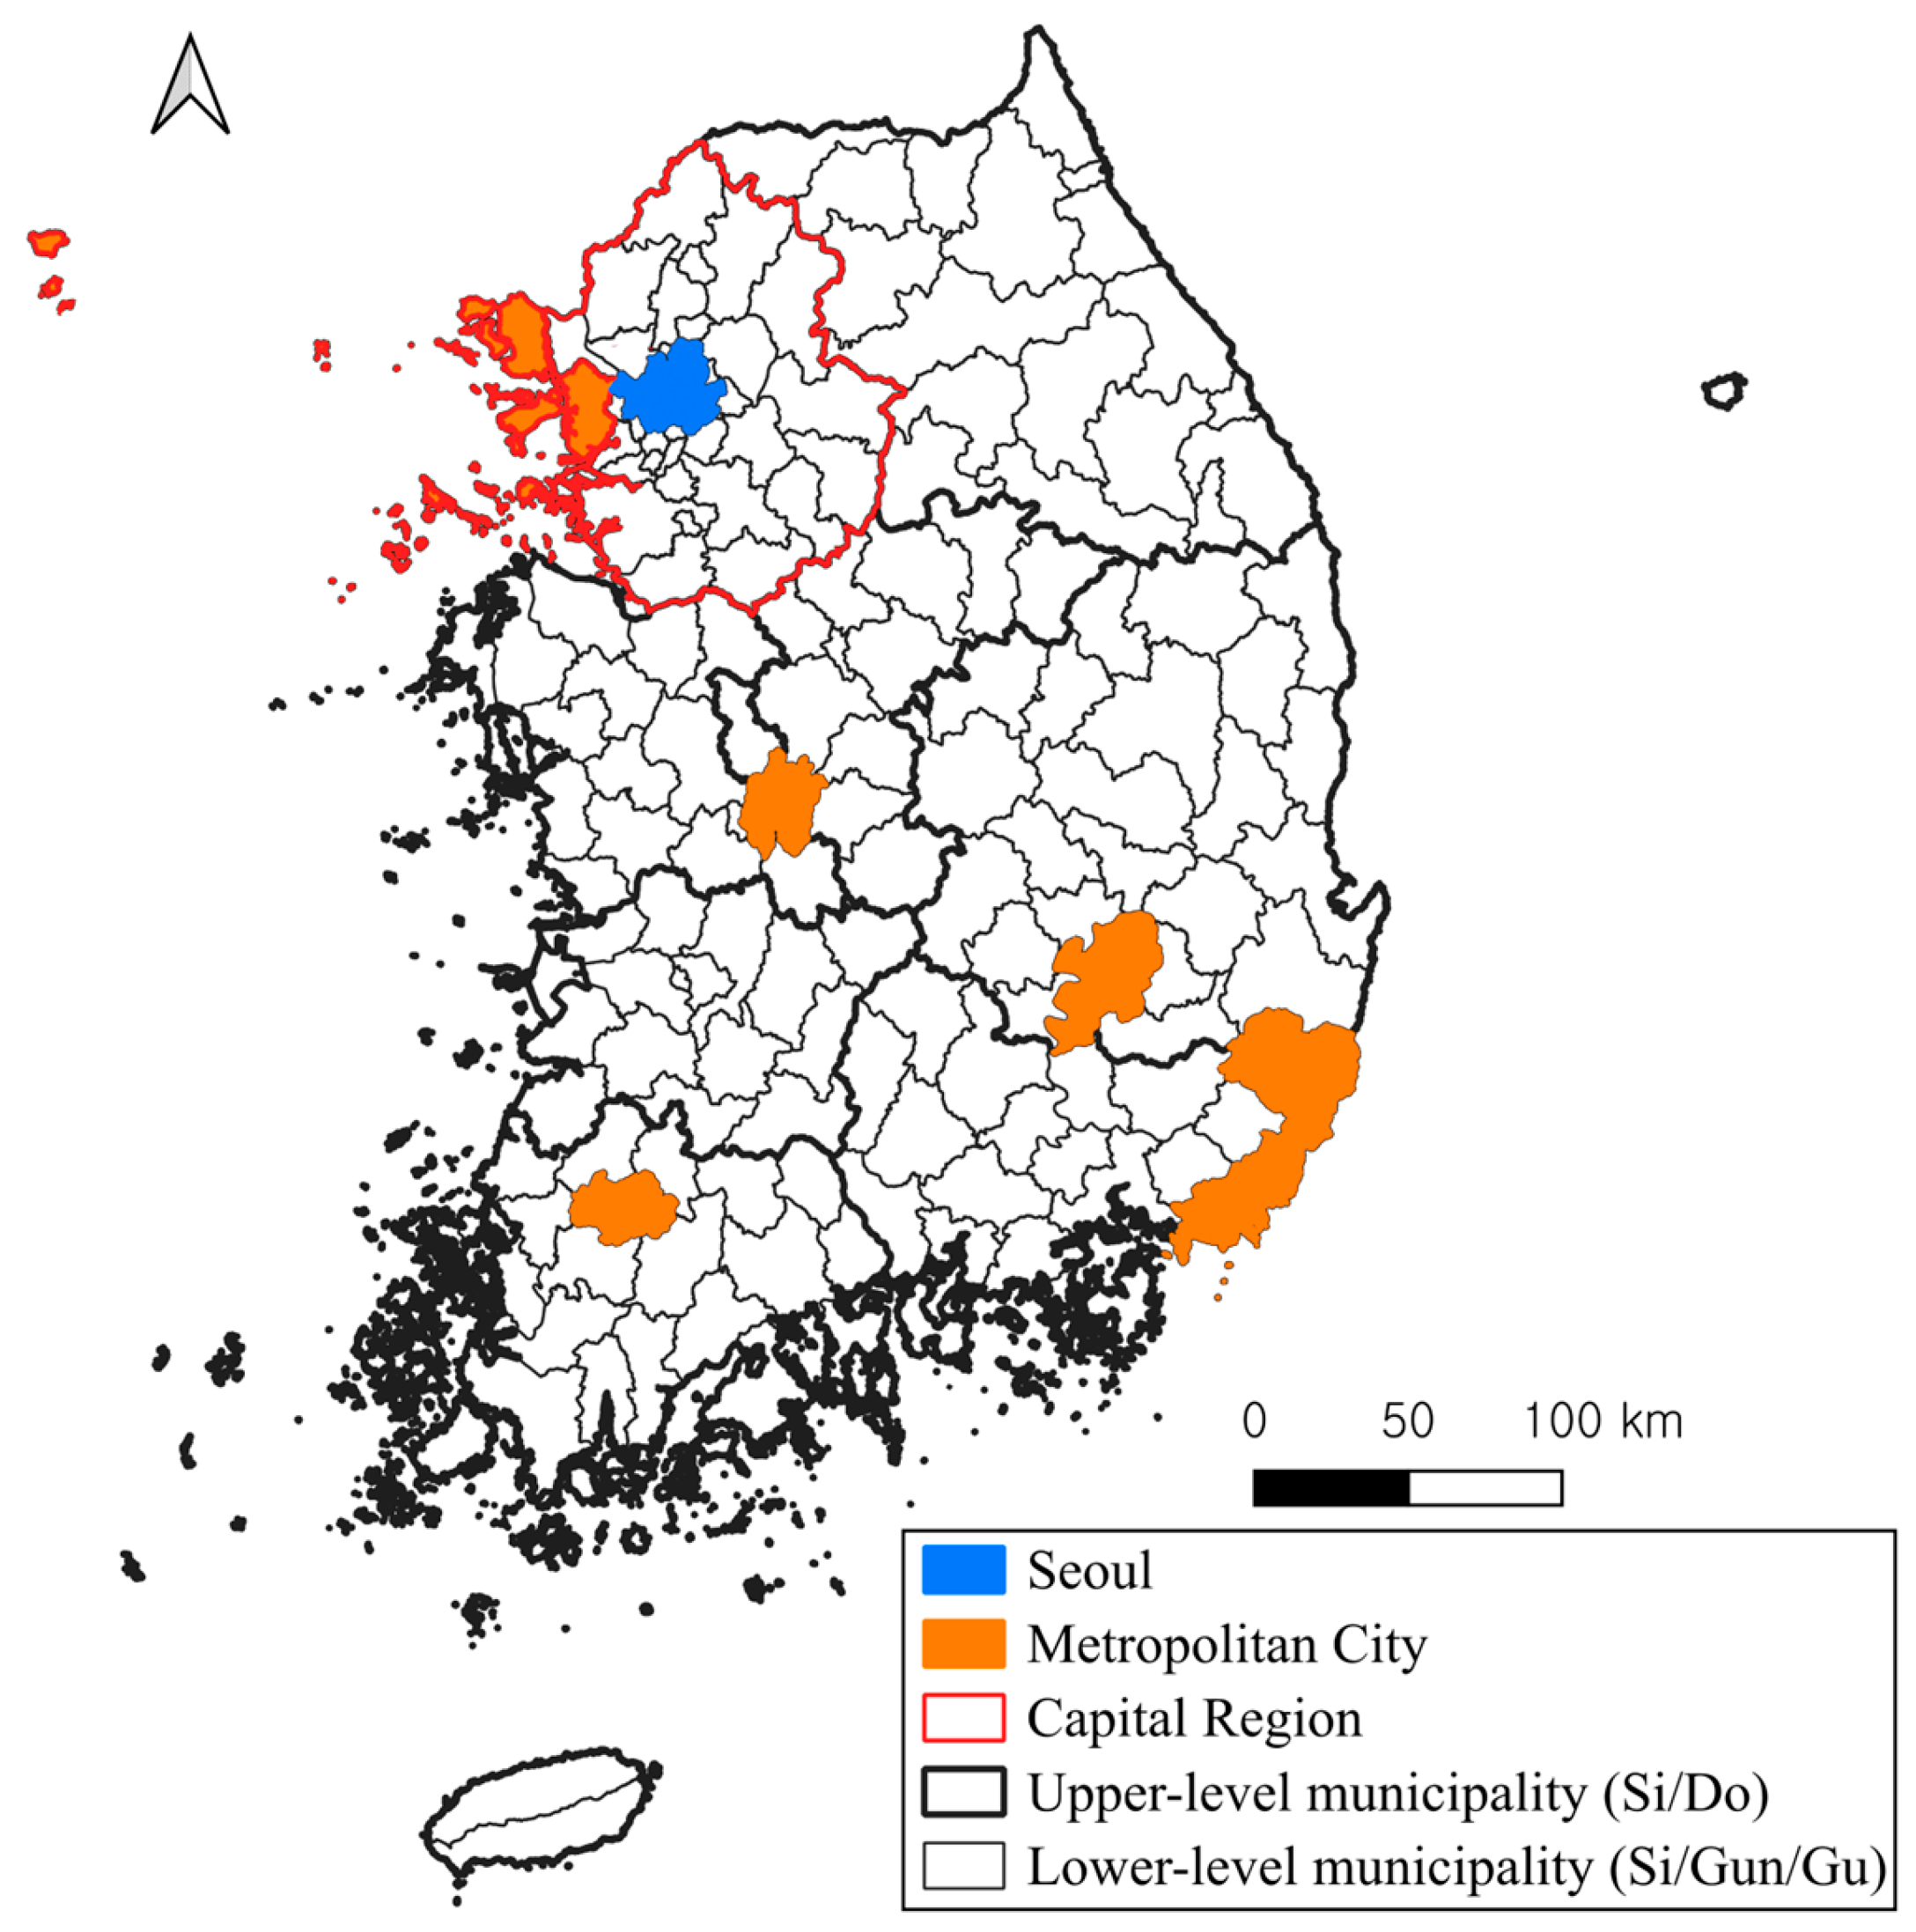
2.1. Study Area

This study focuses on the youth population, defined under Article 3 of the Framework Act on Youth as individuals aged 19–34 years. Figure 1 shows a steady decline in the youth population of South Korea. The intensifying trends of declining birth rates and population aging have led to a rapid decline in the youth population, disrupting the overall population structure and exacerbating regional disparities. Consequently, concerns regarding regional shrinkage are increasing.
Figure 2 shows the structure of Korea’s administrative divisions and the spatial distribution of these municipalities. Administratively, South Korea comprises 17 upper-level municipalities: one Special City (Seoul), six Metropolitan Cities (Gwangyeoksi), one Special Self-governing City (Sejong), and nine Provinces (Do), including one Self-governing Province (Jeju). At the lower level, there are 229 municipalities classified as cities (Si), counties (Gun), and districts (Gu). These lower-level units function as primary administrative entities responsible for delivering public services and implementing local policies. Accordingly, these lower-level municipalities were chosen as the units of analysis in this study.

2.2. Variable Selection
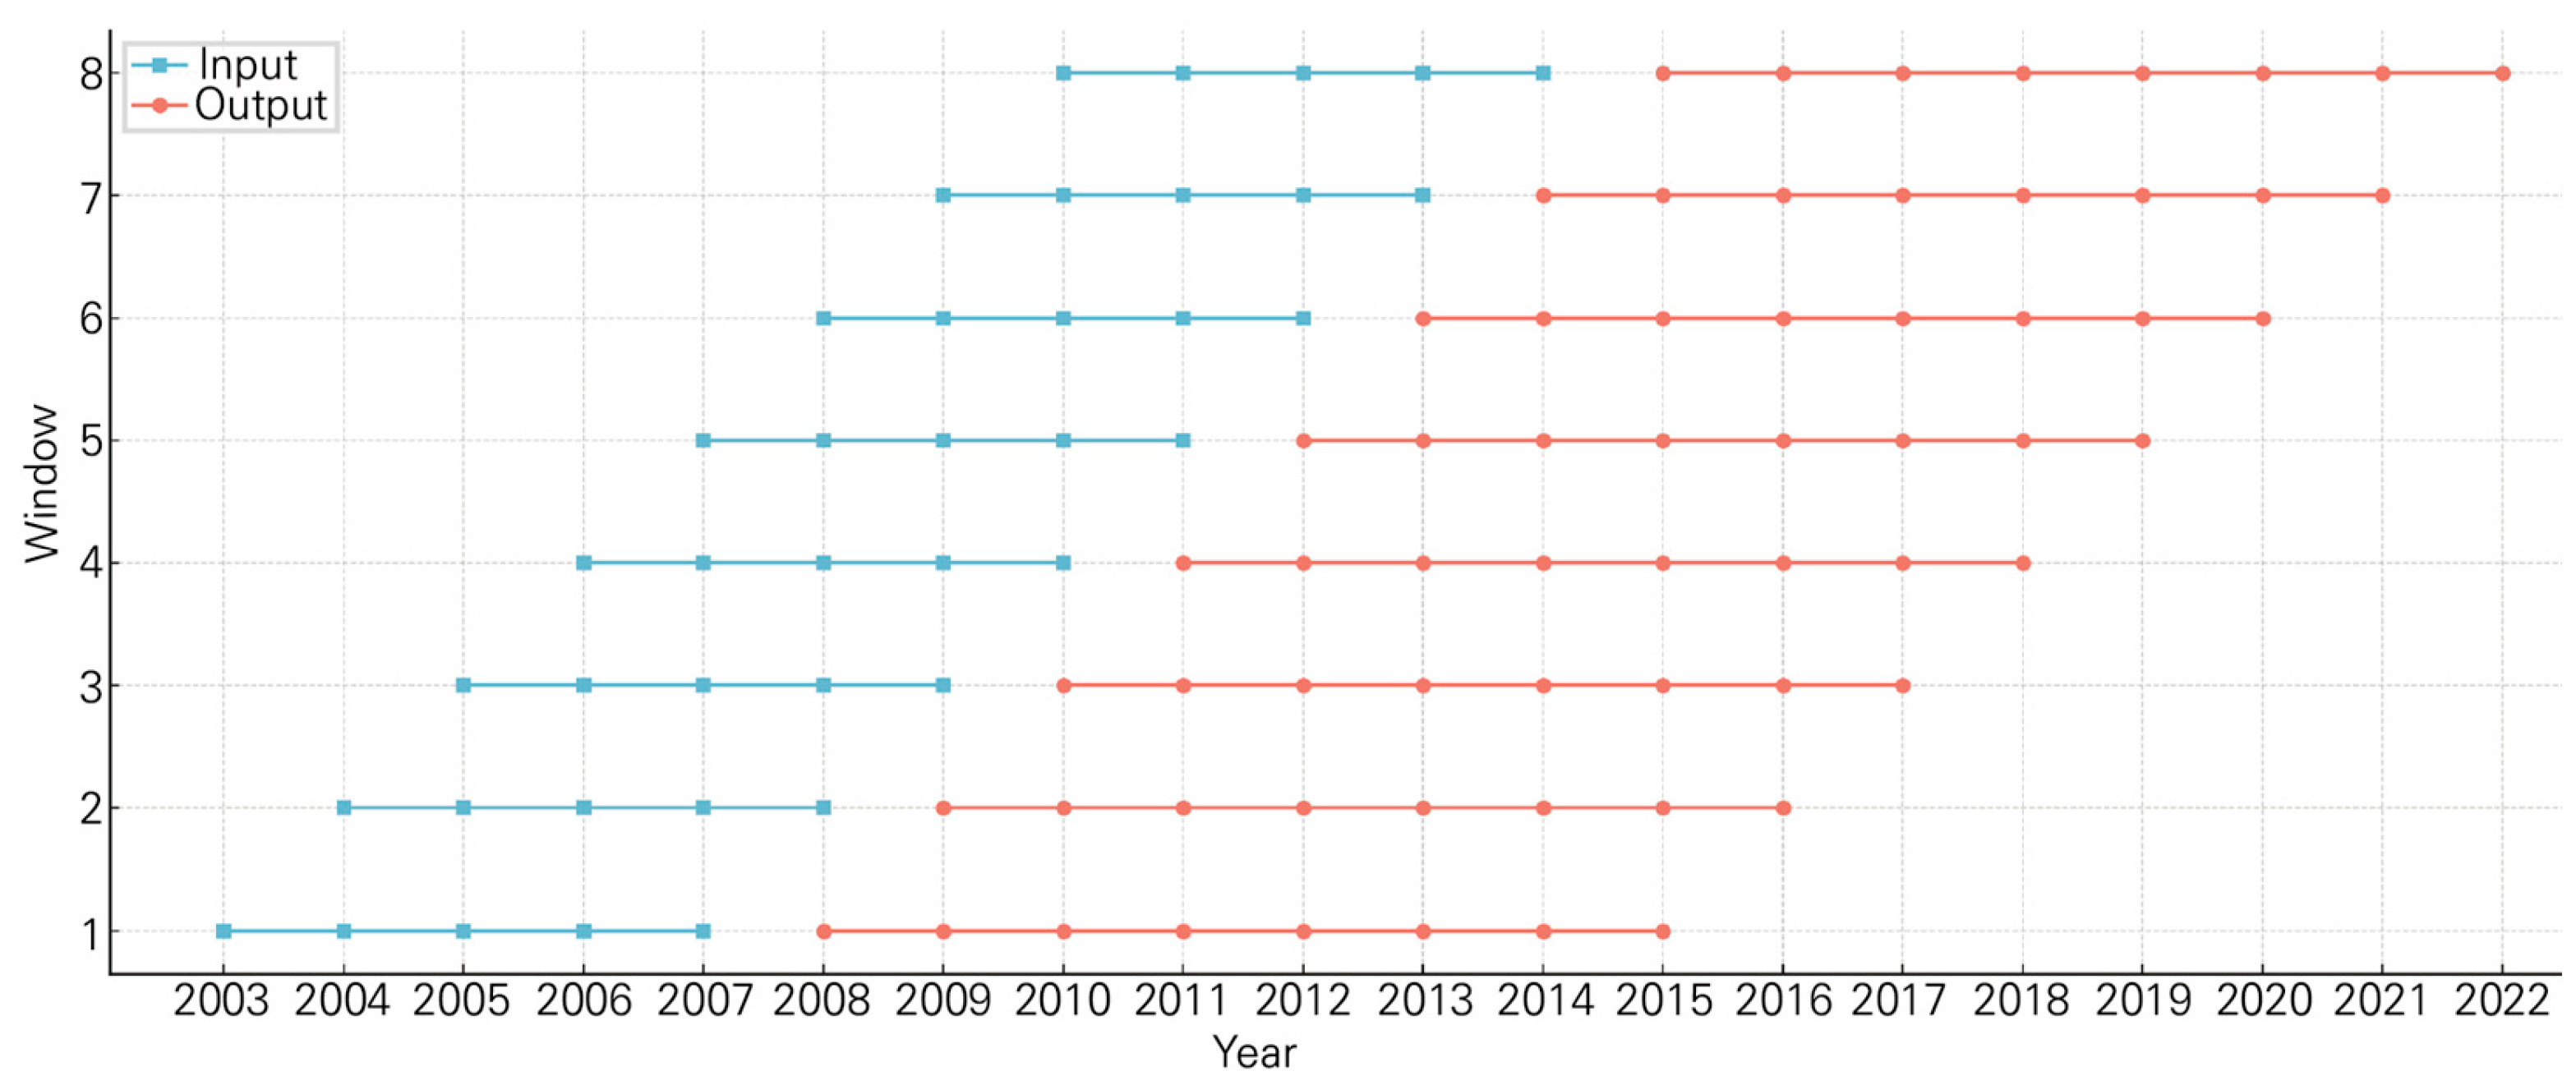
The variables included in the model are presented in Table 1. The factors influencing the youth population are categorized into four groups: population, industry, infrastructure, and urban characteristics. Population-related variables include the total population and aging index, which are widely recognized as key indicators of regional shrinkage [27]. Industry-related variables consist of the total number of workers, the proportion of manufacturing workers, and the proportion of service workers in the region. These components of the industrial structure are critical for attracting and retaining the youth population by enhancing the economic appeal of a region [8].
Infrastructure-related variables include the number of universities and hospitals and the presence of Korea Train Express (KTX) stations, South Korea’s high-speed rail system. These variables reflect the convenience of local living and access to educational opportunities. Accordingly, they were analyzed as key factors influencing the settlement decisions of young people [28,29]. Urban characteristics factors included the proportion of old houses. The model also incorporates the distance to Seoul, given that the capital attracts a disproportionately high number of young migrants due to employment and educational opportunities. In fact, youth migration to Seoul is reported to be two to five times higher than to other metropolitan cities such as Busan, Daegu, and Gwangju [30].

2.3. Methodology

This study predicted population trends using an LSTM model, which is a type of machine learning algorithm. LSTM is a variant of recurrent neural network that selectively retains important historical data while discarding less relevant information, making it well suited to learning sequential dependencies in time-series data [31,32,33]. Its ability to model relationships in which past information influences future values makes it particularly effective for population predictions involving temporal dynamics. Previous studies have demonstrated that LSTM outperforms traditional methods in various time-series prediction tasks and performs effectively in population forecasting [34]. Based on these findings, this study used the LSTM model to predict the youth population by reflecting various social and economic factors that influence it.
To address the challenges of limited time-series data, a multi-output prediction model was employed based on five input and eight output steps (Figure 3). Multi-output prediction refers to the simultaneous prediction of multiple future values based on a single input sequence. In this study, five input steps were used to predict eight consecutive future time points. A five-step input sequence was chosen to maximize the number of training windows available, thereby improving the model’s generalization and stability. The resulting sequence was divided into eight windows: Windows 1–5 for model training and Windows 6–8 for testing. This configuration captures temporal variation in the data, enables a more reliable model evaluation and grid search, and enhances the robustness of long-term population forecasts [35].
In addition, this study applied time-series cross-validation, which preserves temporal dependencies by maintaining the chronological order of the data using a block-based validation structure [36,37,38,39]. Although K-fold cross-validation is commonly used for training machine learning models [40], it assumes that observations are independent of each other, which is not true for time-series data. This study adopted the rolling window approach among various time-series cross-validation methods and performed a grid search for hyperparameter tuning only within the training set. The rolling window method preserves the chronological order of the data and iteratively trains and validates the model by shifting the window in blocks using a fixed input sequence of five years and an output sequence of eight years. The optimal hyperparameter combinations derived from the grid search using the rolling window method are presented in Table 2. Using this model, data from 2018 to 2022 were used as inputs to predict the youth population from 2023 to 2030.
The Shapley Additive Explanations (SHAP) method was applied to improve the interpretability of the model’s prediction outcomes. SHAP is based on the concept of Shapley values from cooperative game theory and is notable for its ability to explain individual prediction outcomes quantitatively [41,42,43]. Originally developed to fairly distribute contributions among participants in a cooperative setting, Shapley values have been adopted in machine learning to explain the extent to which each input variable affects the model output [44]. Black-box models, such as those based on machine learning, can be better understood through interpretability techniques such as SHAP, which quantify the contribution of each feature to the prediction result [45,46]. In addition, SHAP values make it possible to intuitively determine whether each feature has a positive or negative influence on a prediction, thereby deepening the interpretability [47]. This allows for the identification of key variables driving specific predictions, contributing to greater model transparency and a more trustworthy interpretation [48]. The SHAP method is widely recognized as a valuable tool for enhancing model interpretability, and its effectiveness has been validated in various recent machine learning studies [49].

3. Results

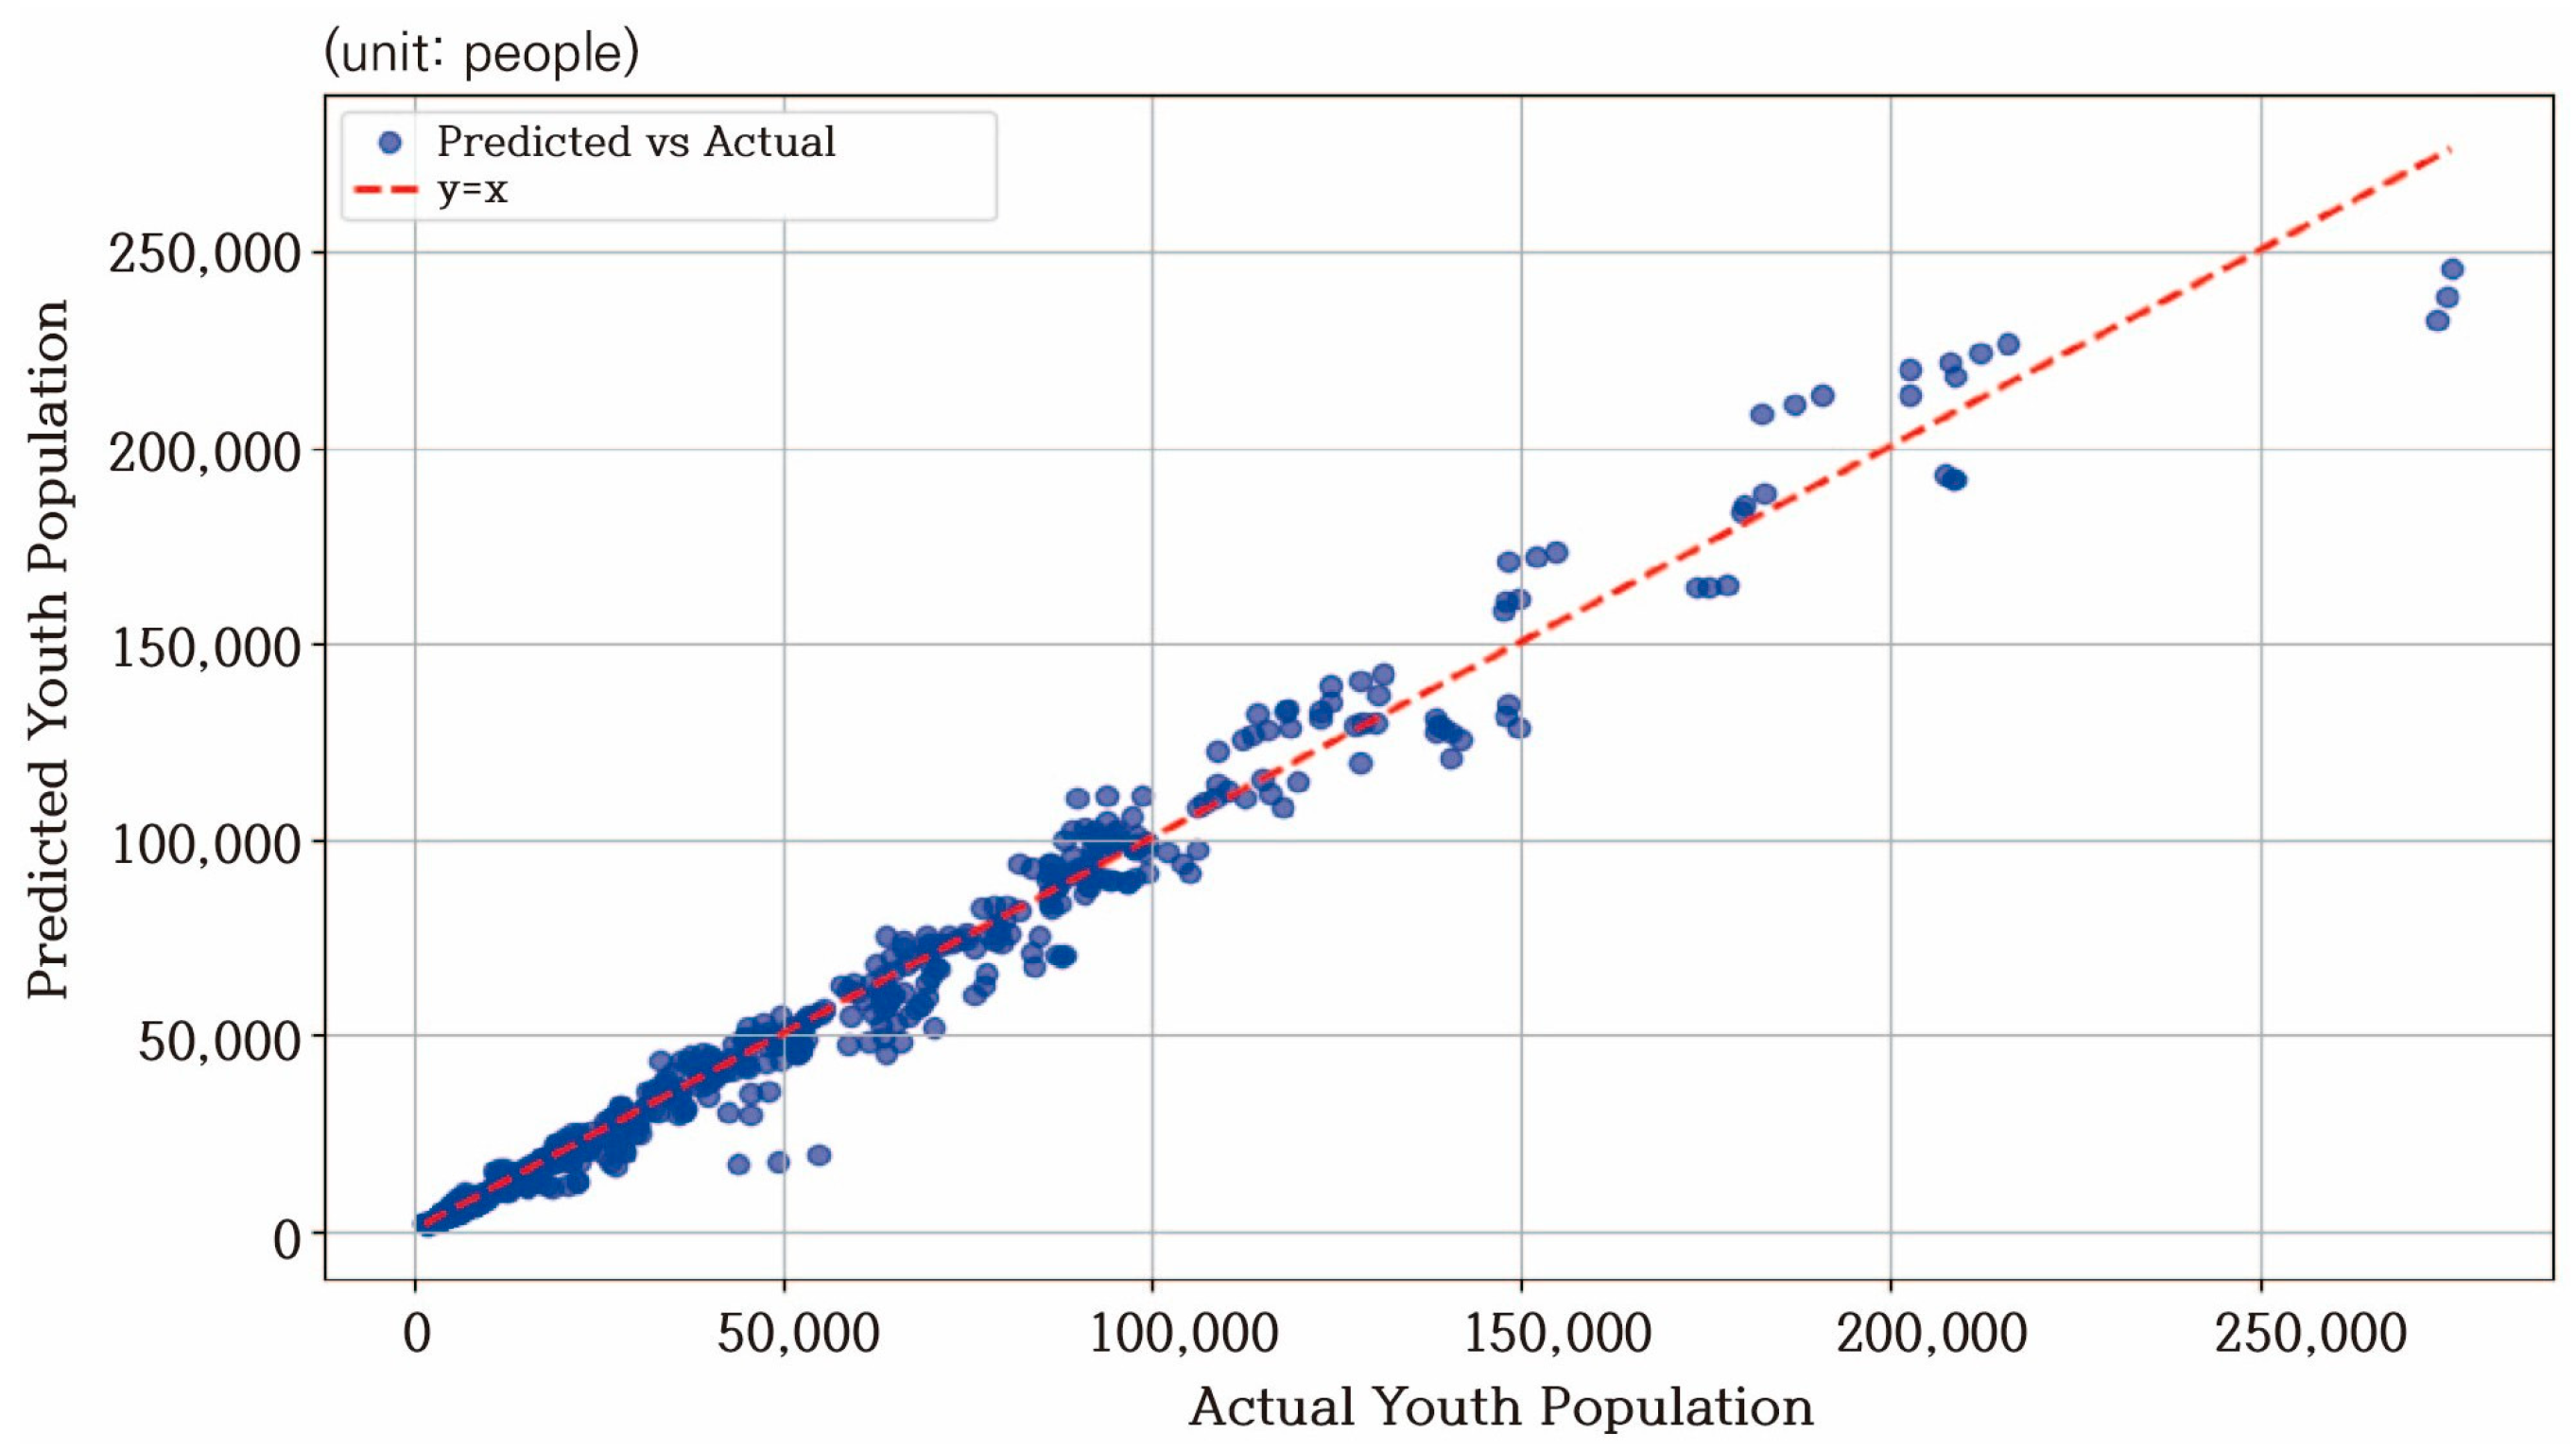
3.1. Validation of Predictive Performance of the LSTM Model

In this study, the LSTM model was implemented using Python 3.11.1 with the Scikit-learn and Keras packages. A comparison of performance between the training and test sets is shown in Table 3. Overall, the model demonstrated robust performance across all evaluation metrics. The differences in root mean squared error (RMSE), mean absolute error (MAE), mean absolute percentage error (MAPE), and R2 values between the training and test sets were minimal, indicating that the model was not overfitted. These results suggest that the LSTM model developed in this study has a stable predictive capability and can be generalized to unseen data.
To validate the predictive performance of the LSTM model, a scatter plot was generated comparing the predicted and actual youth populations across the 229 municipalities (Figure 4). Each point on the scatter plot represents the predicted value (Y-axis) and the actual value (X-axis) for the first year of the output window derived from three test windows. The red dashed line in the plot denotes the y = x line, which indicates a perfect prediction. The clustering of most points around this line confirms that the LSTM model effectively learned and predicted the youth population at the municipal level based on time-series data.
Statistics Korea regularly publishes predicted population figures at the provincial level to respond to rapid demographic changes and to support timely policy formulation. These predicted values are derived from the official population estimation model of Statistics Korea and are regarded as highly reliable statistics used as the basis for national policy development and administrative planning in South Korea. Accordingly, to assess the model’s predictive performance and its applicability for policy use, this study compared the LSTM-based youth population predictions with the predicted figures from Statistics Korea and the actual population. The population data provided by Statistics Korea include three scenarios—high, medium, and low—based on varying assumptions about fertility rates, life expectancy, and net international migration to reflect prediction uncertainty. However, because the data are available only at the provincial level, the LSTM predictions generated for the 229 municipalities were aggregated for comparative analysis.
Table 4 presents a comparison of the MSE, RMSE, and MAE between the LSTM model and scenario-based projections by Statistics Korea, using the actual youth population at the provincial level as a reference from 2023 to 2025. The analysis revealed that the LSTM model generally exhibited lower errors than the Statistics Korea scenarios, demonstrating its superior predictive performance.

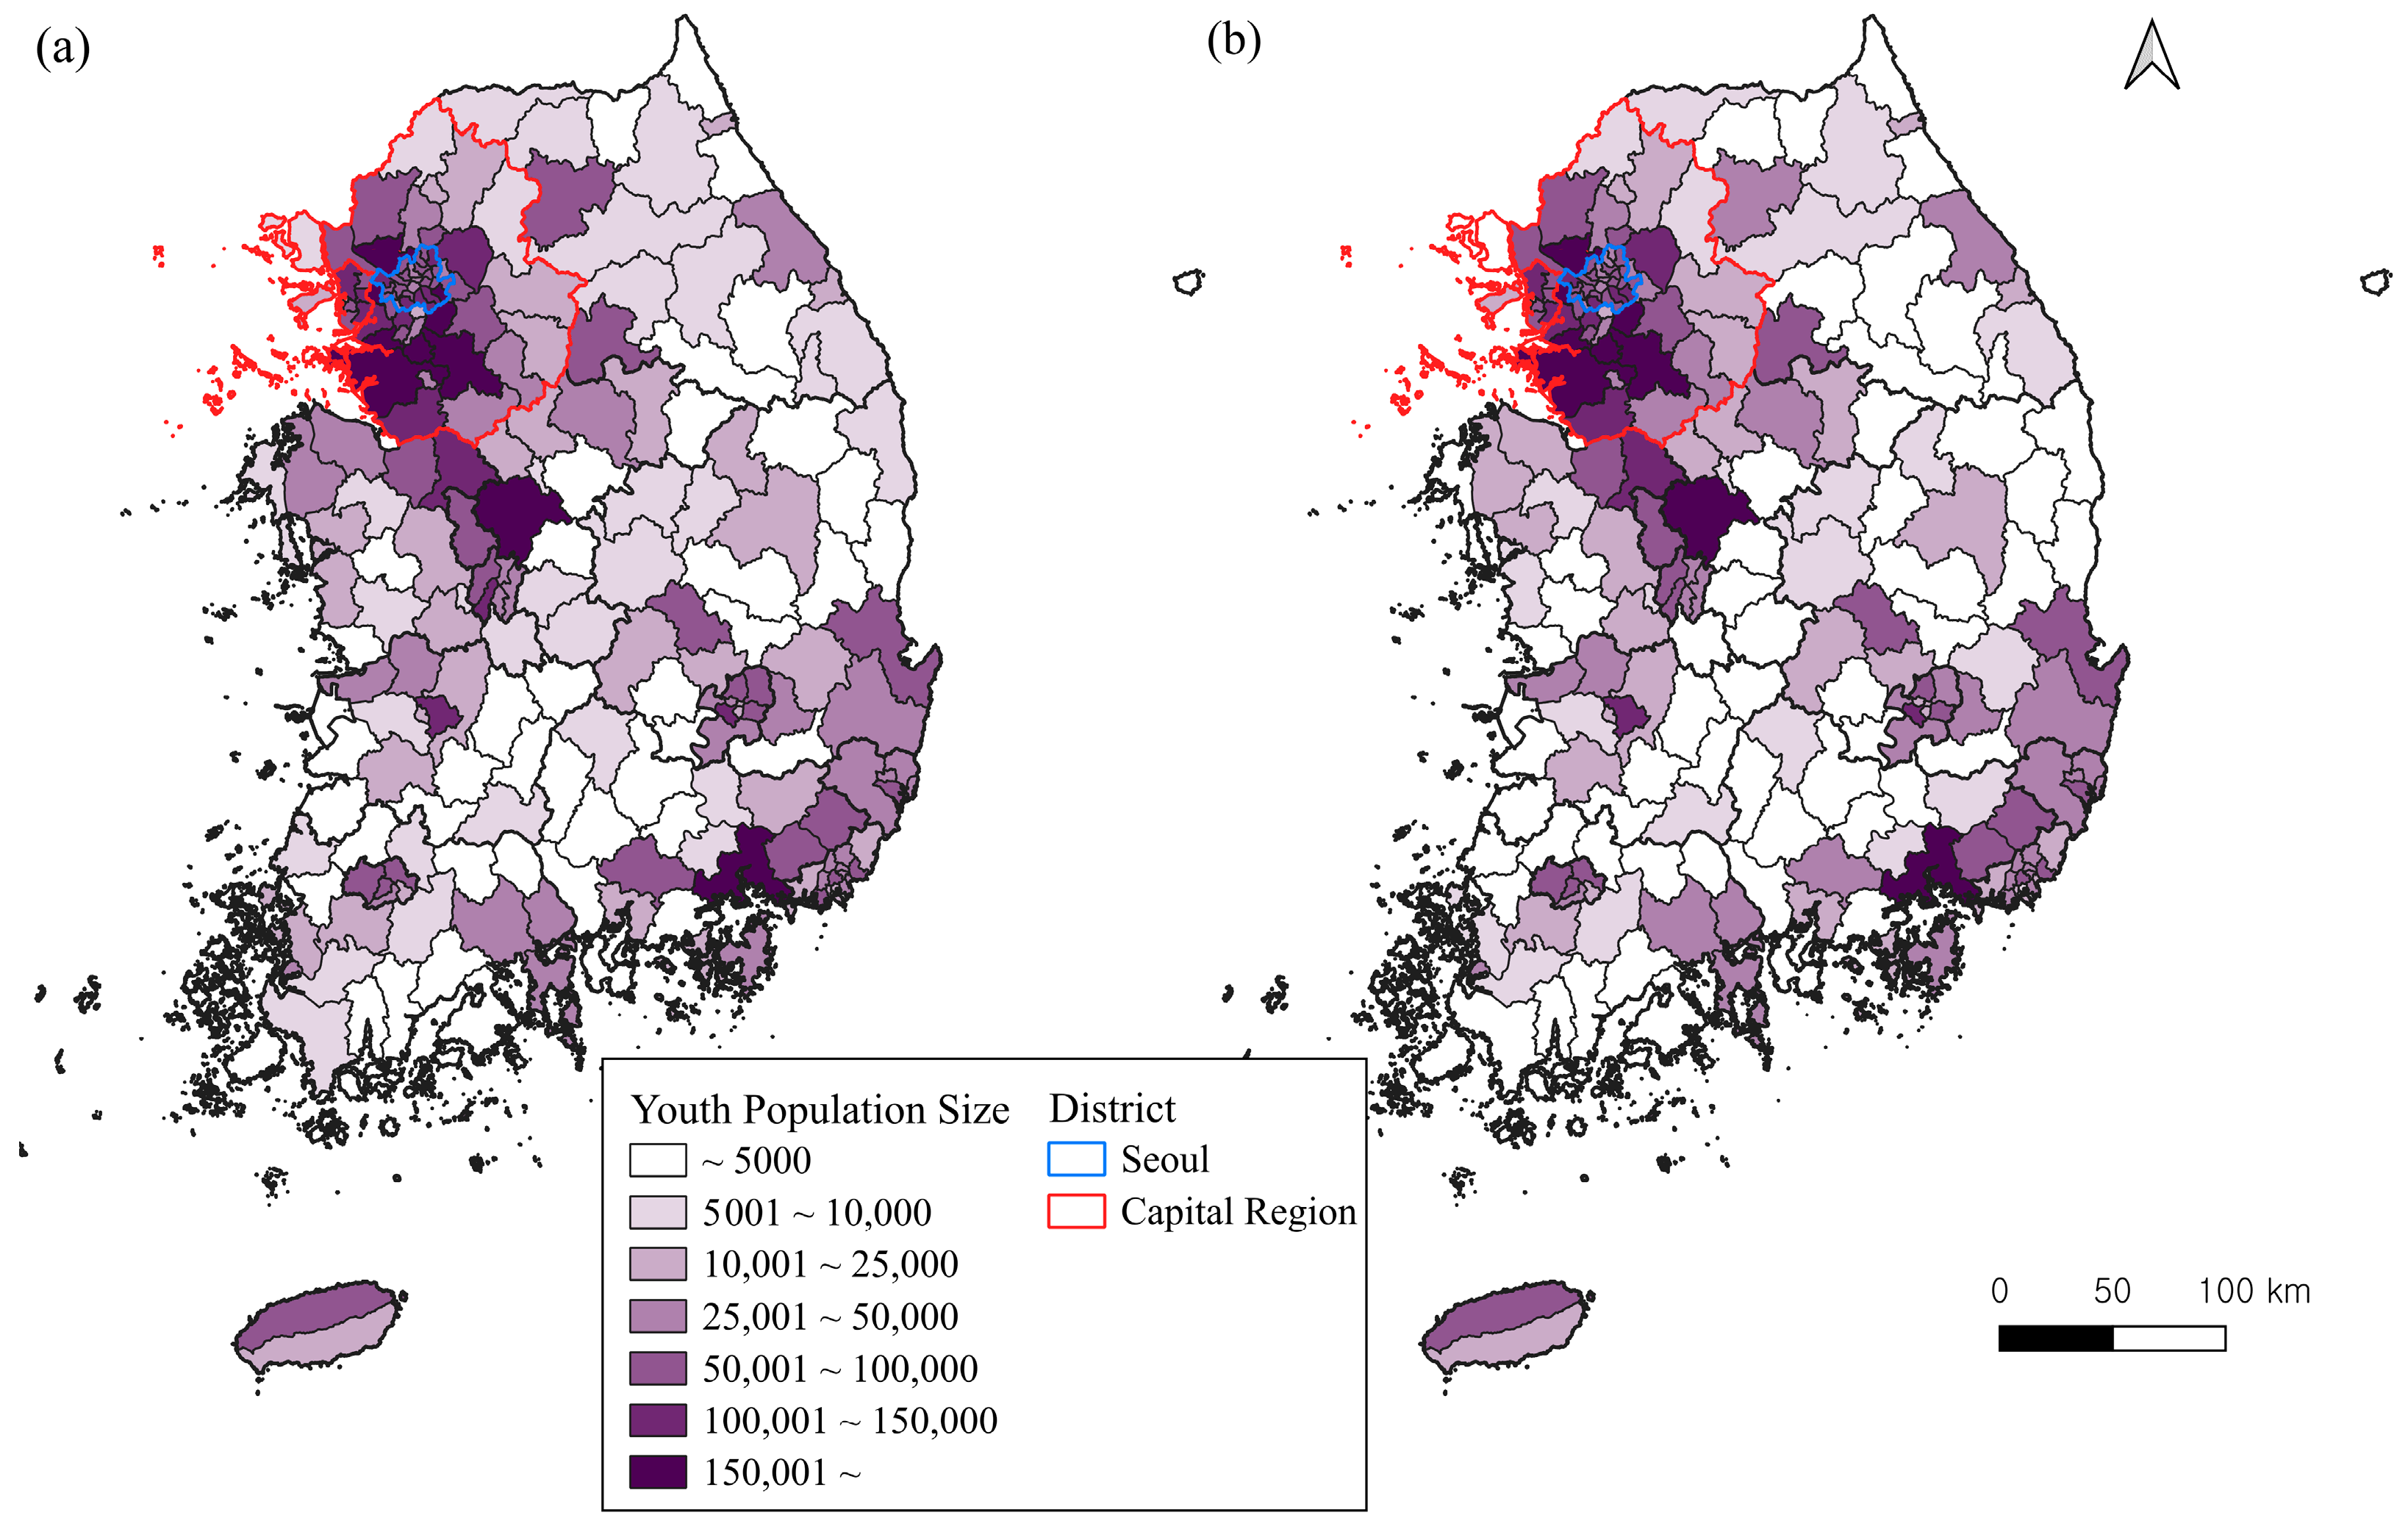
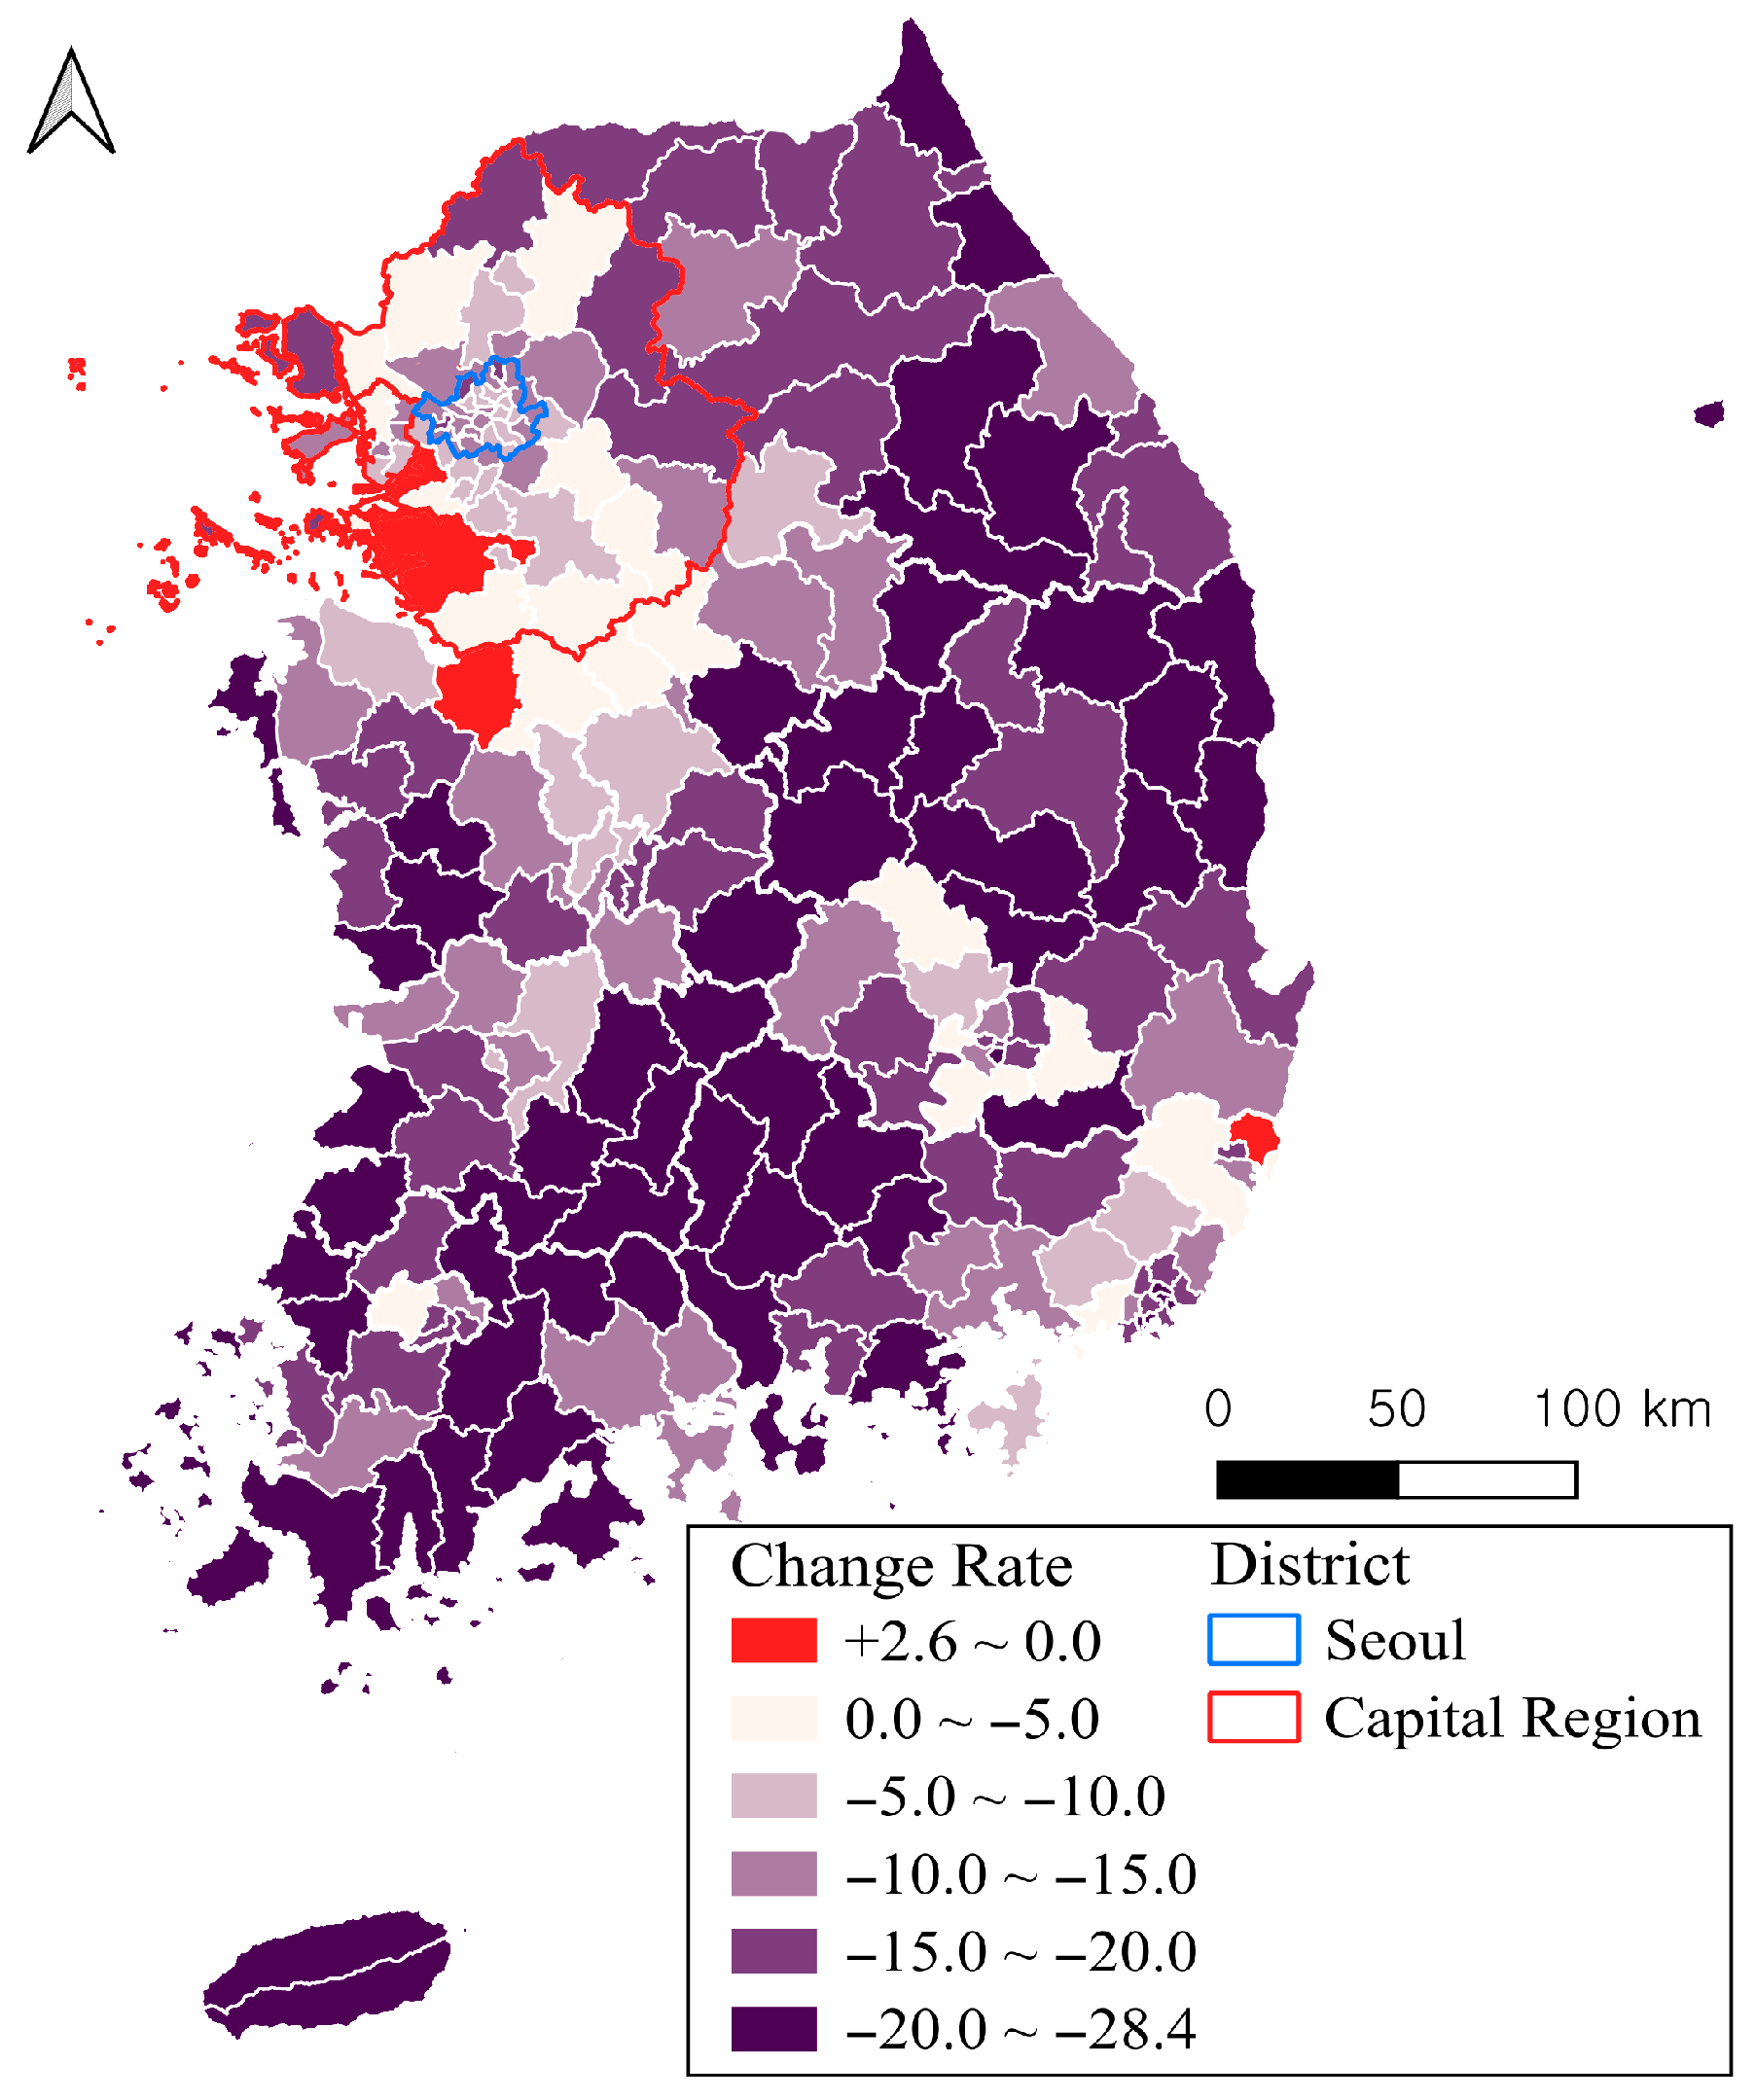
3.2. Youth Population Prediction Using LSTM Model

As demonstrated in the preceding analysis, the LSTM model used in this study exhibited high accuracy for youth population prediction. Building on this, this section presents future youth population predictions based on the model and explores their potential policy and societal implications.
Figure 5 shows the predicted youth population from the LSTM model across the 229 municipalities for 2023 and 2030. In both years, the youth population was heavily concentrated in the capital region, particularly in Seoul, Gyeonggi, and Incheon, with relatively high densities observed in southern Gyeonggi and central Seoul. This pattern can be attributed to the concentration of youth-attracting factors such as higher education institutions, employment opportunities, and cultural amenities. These findings are consistent with those of previous studies [8,9,10], which highlighted the continued concentration of youth in the capital region.
Figure 6 depicts the rate of change in the youth population between 2023 and 2030 in the three regions. Although the overall spatial distribution patterns of the youth population remained largely similar across time points, the population decline trends varied significantly by region. Specifically, areas outside the capital region exhibited a more pronounced decrease in the youth population. This decline is particularly evident in local areas, where the rate of youth population loss is greater. Amid the widespread population decline across most regions, Uiseong (−28.42%), Shinan (−28.42%), Cheongsong (−28.14%), Goheung (−28.02%), and Hapcheon (−27.89%) emerged as the top five areas with the highest predicted youth population declines. These regions were previously designated as population-declining regions by the Ministry of the Interior and Safety in 2021. By contrast, slight increases in the youth population were predicted for Buk-gu in Ulsan (+0.32%), Siheung (+1.06%), Asan (+1.83%), and Hwaseong (+2.63%). These cities are among the major South Korean industrial centers, and as noted in previous studies [50,51,52], their industrial structures play a key role in shaping youth population trends.

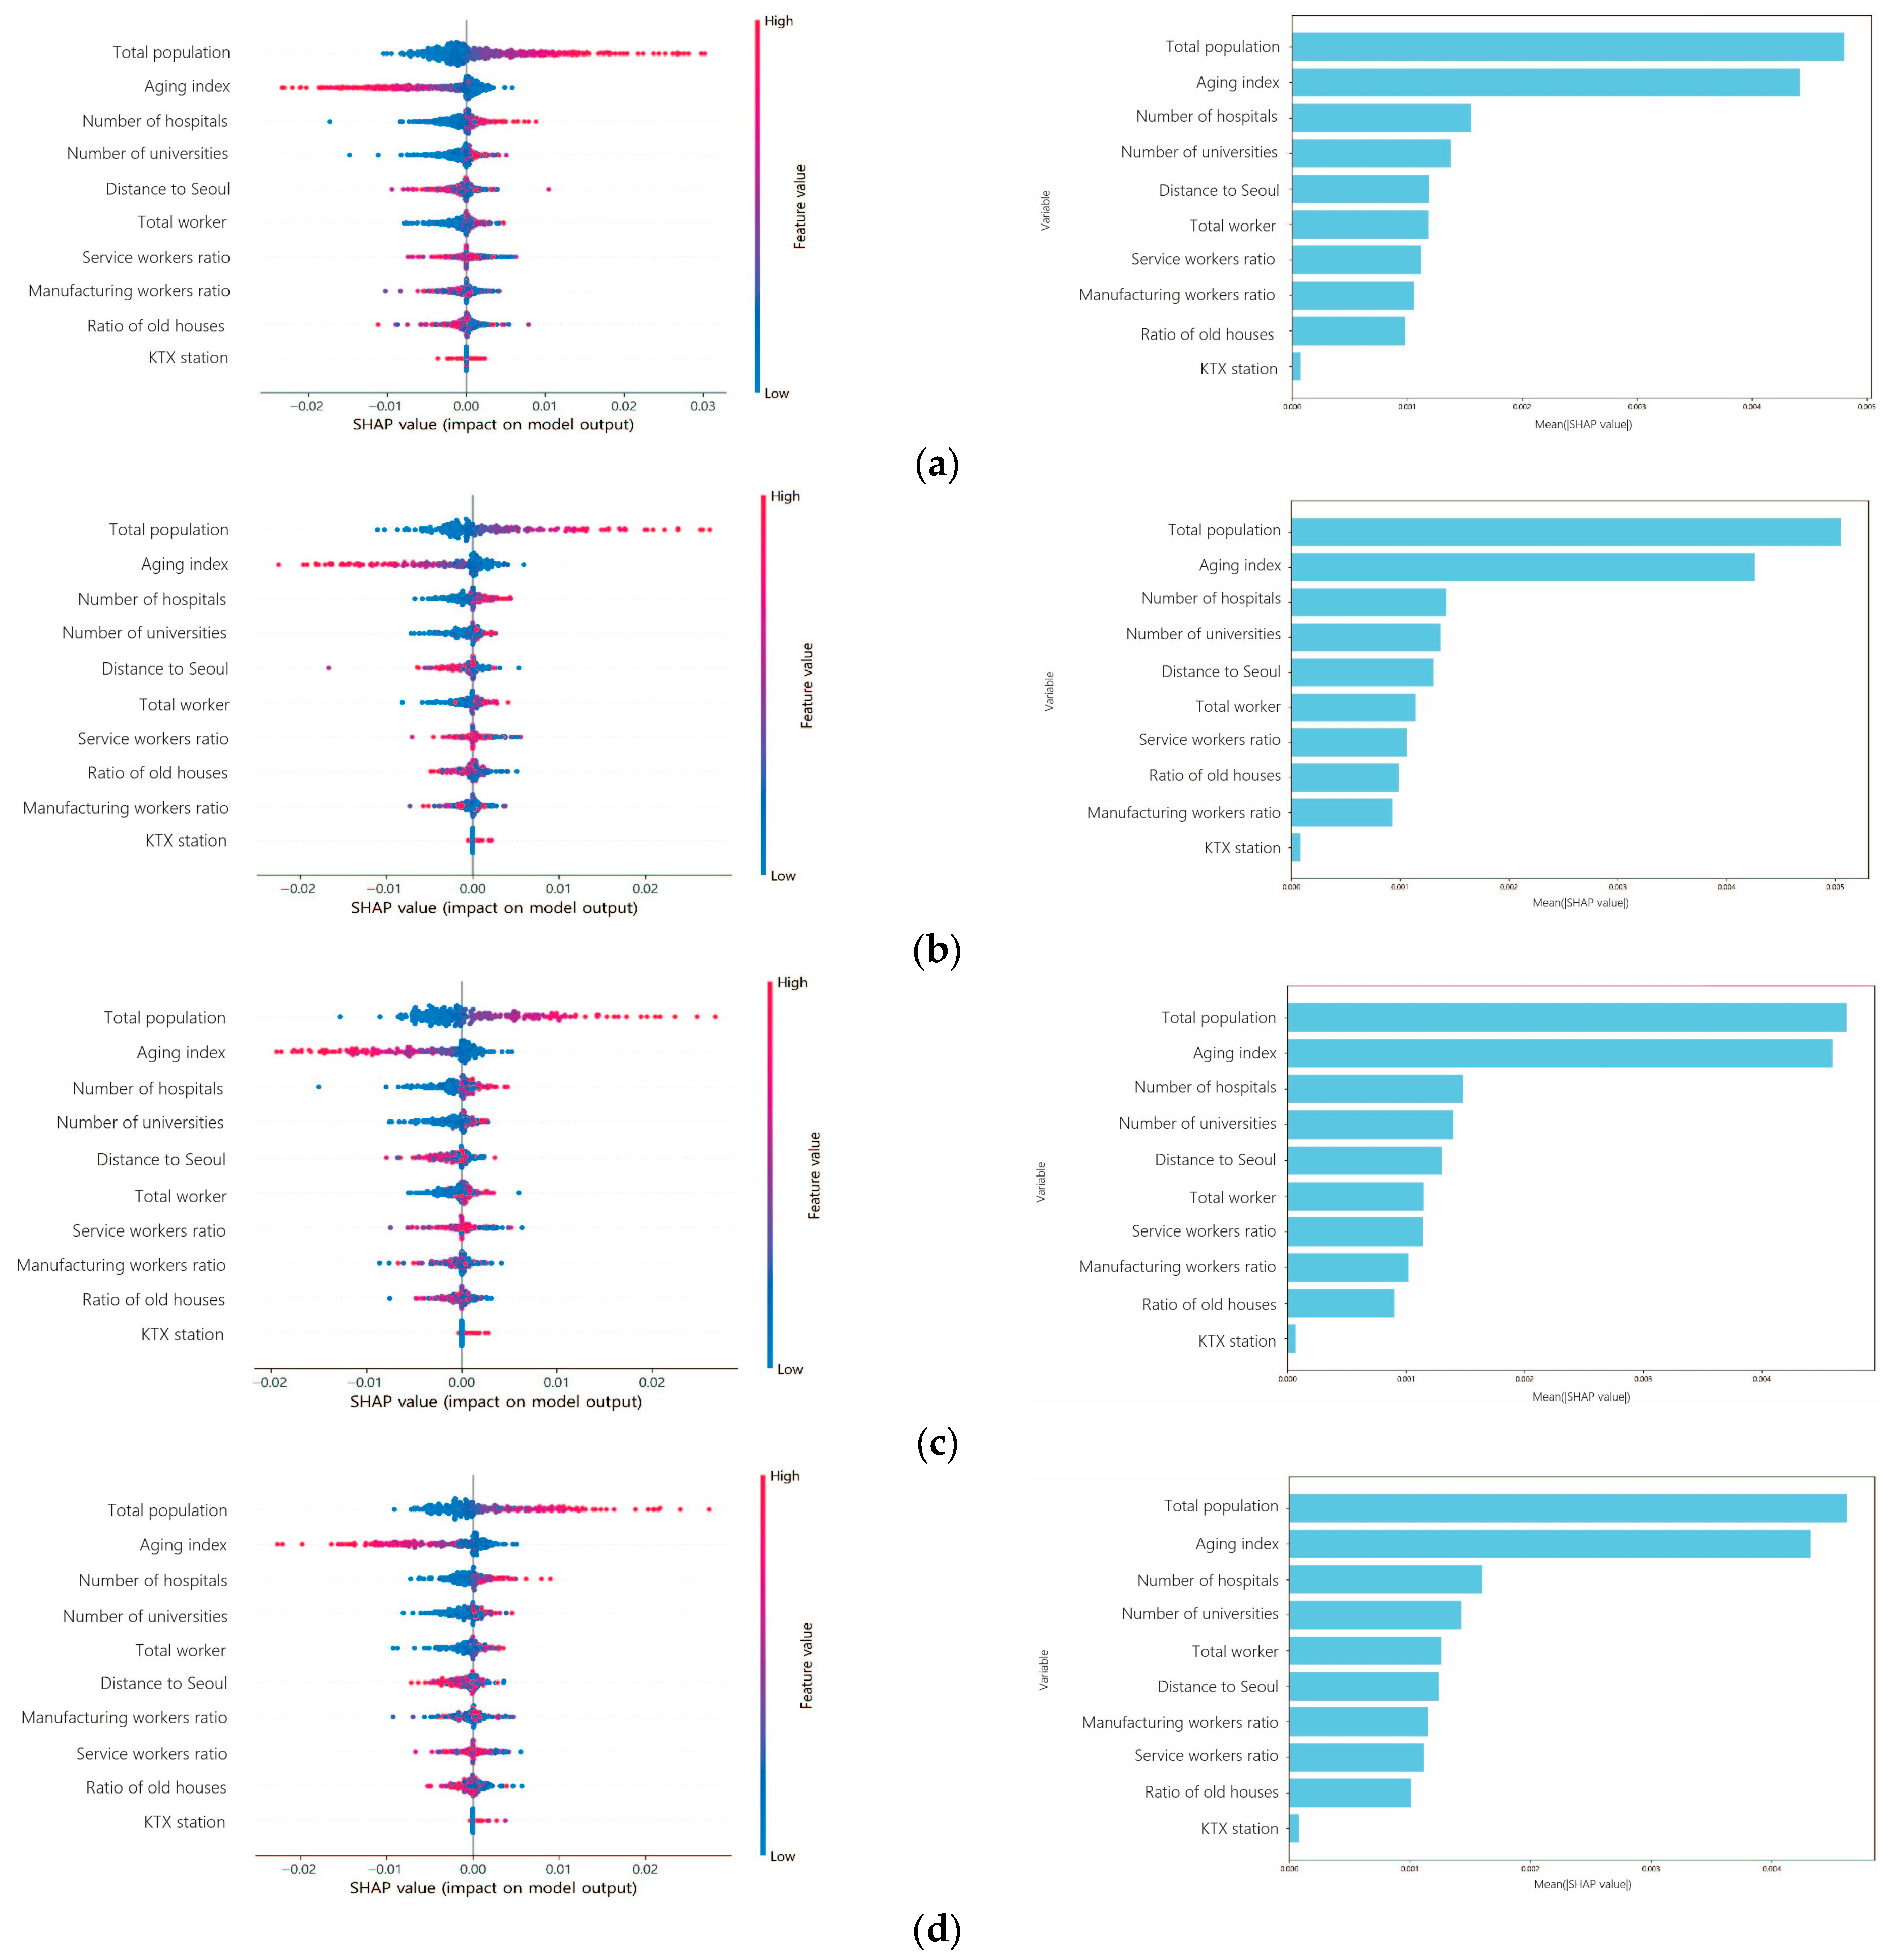
3.3. Interpreting the LSTM Model Using SHAP

Although the LSTM model used in this study effectively predicted youth population trends based on time-series data, it has a key limitation in terms of interpretability. For the youth population, which is influenced by several social and economic factors [53], it is essential to identify and interpret the key drivers of the predictions. Therefore, this section applies the SHAP technique to enhance the interpretability of the LSTM model predictions and analyze the relative importance and directional impact of key variables in youth population forecasting.
Figure 7 shows the SHAP analysis results at the national, special and metropolitan city, city, and county levels. The results indicate that the total population and aging index are the most influential variables in predicting the youth population. This is consistent with the study’s expectation, as the target variable is the change in the youth population. The aging index consistently exhibited a negative contribution, demonstrating that higher levels of age are strongly associated with a decrease in the youth population. Additionally, the number of universities, hospitals, total workers, and distance to Seoul also showed high importance in the prediction. In contrast, variables such as total population, number of hospitals, and number of universities exhibited positive effects, with higher values corresponding to a higher predicted youth population. Distance to Seoul also showed a notable pattern: a shorter distance to Seoul positively influenced the youth population prediction. These findings suggest that spatial proximity to the capital region remains a critical factor influencing the distribution of the youth population.
When comparing the importance of variables across spatial categories, the total population and aging index consistently demonstrated high importance across all spatial units, with the overall structure of the variable importance appearing similar. However, population aging has a greater impact on the youth population decrease in rural areas, such as counties in South Korea. Conversely, at the county level, the importance of total workers was relatively higher than that of other spatial units. This indicates that, in rural areas, the local economic base directly affects the decrease in the youth population size. Additionally, the distance to Seoul showed relatively high importance at the metropolitan level, whereas its contribution to the prediction decreased at the county level. This implies that in rural areas, internal factors such as the local economy and demographic structure exert greater influence on population change than proximity to Seoul.

4. Discussion

4.1. Youth Population Prediction and Spatial Distribution

This study uses an LSTM model that effectively captures temporal dependencies and long-term patterns in time-series data to predict youth population, incorporating social and economic variables that have not been sufficiently considered in previous studies. To this end, the model used variables that reflect the local context, including population, aging index, industrial structure, and educational and medical infrastructure. The prediction accuracy of the model was evaluated using standard metrics such as RMSE, MAE, and MAPE. Compared to the scenario-based population predictions by Statistics Korea, the LSTM model yielded results that more closely aligned with short-term observed values, demonstrating consistent performance at the provincial level. These findings suggest that the LSTM-based prediction approach can help overcome the limitations of traditional population prediction methods, offering greater precision and practicality as a supplementary tool for short-term forecasting and region-specific policy planning.
The prediction results in this study demonstrate that although the youth population is declining nationwide, the speed and pattern of the decrease vary by region, with a particularly pronounced disparity between the capital and local areas. Youth population predictions for 2023 and 2030 indicate an increasingly intense concentration in the capital region and metropolitan cities, suggesting that this is not a temporary fluctuation but a persistent demographic trend. This trend was also evident in the analysis of the change rates. This shows that while the youth population continues to concentrate in the capital region and metropolitan cities, local areas are predicted to experience a comparatively faster population decline. Additionally, the top five regions (Uiseong, Shinan, Cheongsong, Goheung, and Hapcheon) with the highest rates of youth population decline from 2023 to 2030 significantly overlapped with the areas designated as population-declining regions by the Ministry of the Interior and Safety in 2021.

4.2. SHAP-Based Interpretation of Influential Factors

The variable importance analysis using SHAP revealed the following order of importance: total population, aging index, number of hospitals, number of universities, distance to Seoul, total workers, ratio of service workers, ratio of manufacturing workers, ratio of old houses, and presence of a KTX station. Among these, the total population exhibited the highest importance, as areas with larger total populations tended to have higher predicted youth populations. This reflects a structural relationship in which overall population size directly influences the size of the youth population.
The aging index was the second most important variable in predicting the youth population, exhibiting negative effects; regions with a higher aging index tended to have lower predicted youth populations. This suggests that areas with a larger proportion of older adults are more likely to experience youth out-migration or limited youth inflows.
As an infrastructure variable, the number of hospitals showed a strong positive association with regions predicted to have larger youth populations; areas with more hospitals tended to have higher youth population estimates. This suggests that young people tend to place significant value on the quality of infrastructure and that access to medical services positively influences residential decision-making. Similarly, the number of universities emerged as a key factor in attracting youth inflow; areas with more universities were associated with higher predicted youth populations. These results align with those of previous studies [28,29], which also found that a well-conditioned built environment positively influenced the inflow of the youth population.
Shorter distances to Seoul were associated with higher predicted youth populations, suggesting that proximity to the capital significantly influenced young people’s choice of residence. This clearly reflects Korean youths’ preference for residing in the capital region.
The total number of workers, representing the scale of employment within a region, exhibited a positive influence, with more workers tending to have a higher predicted youth population. This suggests that job opportunities are a key factor in the residential decisions of the youth population. In contrast, the ratio of manufacturing workers exhibited relatively low overall importance, and in some regions, a higher share of manufacturing employment was associated with a lower predicted youth population. This implies that youth inflow may be limited to areas with traditional manufacturing.
The ratio of old houses, as an indicator of living conditions, had a negative impact. Areas with a higher ratio of old houses tended to have lower predicted youth populations than others. This finding suggests that regions with poorer residential environments are less likely to attract or retain young people. Although the presence of a KTX station showed relatively low overall importance, regions with a KTX station tended to have a slightly higher predicted youth population. This suggests that the existence of a KTX station may play a modest role as a residential factor for youth.
The SHAP analysis by spatial unit demonstrated that the distance to Seoul was a highly important variable both at the metropolitan city and city levels; however, its influence significantly decreased in counties. This indicates that in rural areas, the youth population tends to prioritize internal residential conditions and the quality of local living infrastructure over external accessibility. Therefore, while proximity to the capital region may serve as a key determinant of population distribution in metropolitan cities, factors such as local employment opportunities play a more important role in local areas than in metropolitan cities.

4.3. Policy Implications

The concentration of the youth population in the capital region stems from the structural concentration of residential foundations and infrastructure in specific areas. Although the decline in the youth population is a common trend across all regions, its speed and pattern vary significantly by area, with notable disparities between the capital and local areas and between large and smaller cities. This trend may exacerbate long-term regional population imbalances and accelerate the decline in local areas. Accordingly, in regions where a decline in the youth population is anticipated, context-specific policies are required, such as fostering regionally specialized industries, creating quality jobs through university collaboration, improving infrastructure, and enhancing residential conditions.
The concentration of the youth population in the capital region can be interpreted not as a short-term migratory shift but as a structural phenomenon driven by recurring disparities in settlement conditions, such as differences in housing, employment, and living infrastructure. Conversely, regions such as Sejong, where the youth population has been maintained or has increased, appear to benefit from a combination of policy-driven factors such as planned urban development and public institution relocation. This suggests that the youth residential choices are shaped by the quality of life and practical living conditions. However, because this study did not include variables that directly account for such policy influences, this interpretation requires further empirical validation in future research.
Nevertheless, the findings of this study offer several implications for policy design that could influence the future spatial distribution of the youth population. First, improving settlement conditions is essential to prevent youth outmigration. This policy direction can be applied universally across all regions. Second, alternative urban centers outside the capital region must be fostered. Previous policies aimed at easing capital concentration have focused primarily on restricting Seoul’s functions. However, there is a need to identify and strategically develop self-sufficient and attractive local cities. As shown in the case of Sejong, decentralizing administrative functions and planning settlement infrastructure can serve as effective policy tools for influencing the actual movement and retention of the youth population.
In conclusion, addressing the complex challenges of the youth population decline and concentration in the capital region requires a more integrated approach that considers the interlinks among settlement infrastructure, industrial structure, education, and housing policies. The prediction results and variable interpretations presented in this study provide an empirical basis for advancing this direction and may serve as meaningful foundational data for future youth population policies and regional planning.

5. Conclusions

This study examined youth population decline, a key driver of regional shrinkage, by developing an LSTM prediction model and analyzing youth population trends in 229 municipalities in South Korea. Specifically, it aimed to address the limitations of previous studies by using time-series data from 2003 to 2022 and reflecting various region-specific variables such as the aging index, industrial structure, and educational and medical infrastructure.
The results indicate that although the youth population is declining nationwide, the rate of decline varies significantly across regions, suggesting a potential entrenchment of youth concentrations in the capital region and metropolitan cities. This trend may exacerbate the dual challenges of youth out-migration and regional imbalance, ultimately accelerating regional shrinkage. Moreover, this study empirically demonstrated that socioeconomic factors, such as settlement conditions and regional infrastructure, play critical roles in shaping the distribution of the youth population. This study may serve as a complementary resource for regional policymaking and for intervariable relationships, which traditional population prediction models have often overlooked.
Despite these contributions, this study did not incorporate all potential factors influencing the youth population. Variables such as policy-related factors and cultural amenities, which can significantly affect demographic shifts, were not included in the study. In addition, the model trained primarily on pre-pandemic data may not fully capture the structural changes induced by recent policy interventions, the COVID-19 pandemic, or other external shocks. This limitation raises concerns regarding the assumption of stationarity and the generalizability of the predictions over a long-term horizon. To address these challenges, future research should consider expanding the scope of explanatory variables, incorporating scenario-based forecasting frameworks to reflect uncertainties, and conducting comparative evaluations with other machine learning techniques to enhance predictive performance and robustness.

Author Contributions

Conceptualization, J.S., S.Y., J.K. and K.K.; methodology, J.S., S.Y., J.K. and K.K.; formal analysis, J.S. and S.Y.; data curation, J.S. and S.Y.; writing—original draft preparation, J.S., S.Y. and J.K.; writing—review and editing, J.K. and K.K.; visualization, J.S. and S.Y.; supervision, K.K.; project administration, K.K.; funding acquisition, K.K. All authors have read and agreed to the published version of the manuscript.

Funding

This research was supported by the Basic Science Research Program through the National Research Foundation of Korea (NRF) funded by the Ministry of Education (RS-2023-00246551).

Institutional Review Board Statement

Not applicable.

Informed Consent Statement

Not applicable.

Data Availability Statement

The original data presented in this study are openly available from the following official sources: KOSIS (https://kosis.kr), SGIS (https://sgis.kostat.go.kr), MOE (https://www.moe.go.kr), HIRA (https://opendata.hira.or.kr), and MOLIT (https://www.molit.go.kr). All datasets are publicly accessible on these websites.

Conflicts of Interest

The authors declare no conflicts of interest.

References

  1. Álvarez-Montoya, J.M.; Ruiz-Ballesteros, E. Newcomers and Rural Crisis: Beyond the Demographic Challenge. A Case Study in Andalusia (Spain). J. Rural Stud. 2024, 108, 103292. [Google Scholar] [CrossRef]
  2. Tulibaleka, P.O.; Katunze, M. Rural-Urban Youth Migration: The Role of Social Networks and Social Media in Youth Migrants’ Transition into Urban Areas as Self-Employed Workers in Uganda. Urban Forum 2024, 35, 329–348. [Google Scholar] [CrossRef]
  3. González-Leonardo, M.; Newsham, N.; Rowe, F. Understanding Population Decline Trajectories in Spain Using Sequence Analysis. Geogr. Anal. 2023, 55, 495–516. [Google Scholar] [CrossRef]
  4. Shin, H. Analysis of Youth Migration Drivers and Implications for Preparing for Local Extinction. Geogr. J. Korea 2024, 58, 121–134. [Google Scholar] [CrossRef]
  5. Lee, J.; Shin, Y.; Cho, K. A Regarding Population Concentration in the Metropolitan Area and Disappearance of Local Areas Policy Consideration. J. Land Public Law Stud. 2024, 107, 397–428. [Google Scholar]
  6. Song, S.; Nam, J. Analysis on Youth Population Movement Patterns and Regional Characteristics in Declining Population Areas: Focused on Outside the Metropolitan Regions. Korea Urban Real Estate Assoc. 2025, 16, 107–135. [Google Scholar]
  7. Kim, H.; Yang, J. Analysis of Changes in Human Capital Characteristics in Occupational Mobility of College Graduates. Korea Spat. Plan. Rev. 2024, 121, 43–58. [Google Scholar] [CrossRef]
  8. Yoo, H.B.; Tak, K.J.; Mun, J.S. A Study on the Factors and Overcoming Methods of Extinction of Provinces in Korea: The Exploration with Machine Learning methods. Korean J. Local Gov. Stud. 2021, 24, 443–476. [Google Scholar] [CrossRef]
  9. Jeon, H.; Lee, G.; Jeon, A. Youth Employment Opportunities and Labor Market Dynamics in Jeonbuk State; Jeonbuk State Institute: Jeonju, Republic of Korea, 2024; Report No. 2024-BR-05. [Google Scholar]
  10. Lee, S. Capital Region Concentration and Regional Population Crisis Due to Youth Migration. Issue Focus 2020, 395, 1–9. [Google Scholar] [CrossRef]
  11. Oh, D.; Jung, E.-J.; Kim, S.-Y.; Lee, E.-J.; Choi, E. A Case Study on Social Economy for Counteracting Regional Decline: Focusing on Cases in Chuncheon City. Soc. Econ. Policy Stud. 2024, 14, 113–140. [Google Scholar] [CrossRef]
  12. Jang, M. Study on Classification of Depopulation Areas According to Crisis of Local Extinction. Geogr. J. Korea 2023, 57, 11–22. [Google Scholar] [CrossRef]
  13. Ju, S. Local Government Depopulation Status and Policy Alternatives. Korean J. Local Gov. Adm. Stud. 2021, 35, 295–321. [Google Scholar]
  14. Smith, S.K.; Tayman, J.; Swanson, D.A. A Practitioner’s Guide to State and Local Population Projections; Springer: Berlin/Heidelberg, Germany, 2013. [Google Scholar]
  15. Park, Y.; Heim LaFrombois, M.E. Planning for Growth in Depopulating Cities: An Analysis of Population Projections and Population Change in Depopulating and Populating US Cities. Cities 2019, 90, 237–248. [Google Scholar] [CrossRef]
  16. Puga-Gonzalez, I.; Bacon, R.J.; Voas, D.; Shults, F.L.; Hodulik, G.; Wildman, W.J. Adapting Cohort-Component Methods to a Microsimulation: A Case Study. Soc. Sci. Comput. Rev. 2022, 40, 1054–1068. [Google Scholar] [CrossRef]
  17. Alghanmi, N.; Alotaibi, R.; Alshammari, S.; Mahmood, A. Population Fusion Transformer for Subnational Population Forecasting. Int. J. Comput. Intell. Syst. 2024, 17, 26. [Google Scholar] [CrossRef]
  18. Kim, Y.; Kim, D. A Study on the Population Estimation of Small Areas using Explainable Machine Learning: Focused on the Busan Metropolitan City. J. Korean Assoc. Geogr. Inf. Stud. 2023, 26, 97–115. [Google Scholar] [CrossRef]
  19. Qiao, Y.; Wang, C.-W.; Zhu, W. Machine Learning in Long-Term Mortality Forecasting. Geneva Pap. Risk Insur.—Issues Pract. 2024, 49, 340–362. [Google Scholar] [CrossRef]
  20. Lee, C.; Lee, H. An Analysis on the Determinants of Youth Population Movement across Regions and Prospects. Korean Econ. Bus. Assoc. 2016, 34, 145–171. [Google Scholar]
  21. Choi, J.; Park, J.; Cho, H. A Study on the Social Migration of Young People and Characteristics in Gyeonggi-Do. J. Korean Cadastre Inf. Assoc. 2023, 25, 34–50. [Google Scholar] [CrossRef]
  22. Lim, T. A Study on Factors Influencing the Influx of Youth Population into Non-Metropolitan Areas: Focusing on Comparative Analysis by Region and Age Group. Reg. Policy Stud. 2024, 35, 45–64. [Google Scholar]
  23. Kim, M.; Kang, M. An Analysis of Individual and Regional Factors Influencing Youth Outflow from Non-Capital Regions. J. Korean Urban Manag. Assoc. 2023, 36, 47–66. [Google Scholar] [CrossRef]
  24. Grossman, I.; Wilson, T.; Temple, J. Forecasting Small Area Populations with Long Short-Term Memory Networks. Socioecon. Plan. Sci. 2023, 88, 101658. [Google Scholar] [CrossRef]
  25. Riiman, V.; Wilson, A.; Milewicz, R.; Pirkelbauer, P. Comparing Artificial Neural Network and Cohort-Component Models for Population Forecasts. Popul. Rev. 2019, 58, 2. [Google Scholar] [CrossRef]
  26. Tanmoy, F.M.; Hossain, Z.; Tasfia, O.; Abrar Hamim, M.; Sadekur Rahman, M.; Tarek Habib, M. Machine Learning Modeling for Population Forecasting; Springer Nature: Singapore, 2024; pp. 213–228. [Google Scholar]
  27. Ko, M.; Kim, K. A Study on the Causes and Factors Explaining the Korean Local Extinction Risk. J. Korean Urban Geogr. Soc. 2021, 24, 17–27. [Google Scholar] [CrossRef]
  28. Park, J.; Kim, D. Policy Directions to Attract and Retain Youth Population in Response to Regional Population Decline; Basic Research Project; Korea Research Institute for Local Administration: Wonju, Republic of Korea, 2020; Volume 40, p. 405. [Google Scholar]
  29. Kim, M.; Yoon, S.; Kim, D. Specialized Plan for Living Conditions in Region area in Response to Local Extinction. J. Korean Reg. Dev. Assoc. 2023, 35, 43–64. [Google Scholar] [CrossRef]
  30. Kim, S.; Lee, S.; Cho, D. Exploring the Impact of Youth Migration on Population Redistribution. J. Korean Cartogr. Assoc. 2024, 24, 73–88. [Google Scholar] [CrossRef]
  31. Hochreiter, S. The Vanishing Gradient Problem during Learning Recurrent Neural Nets and Problem Solutions. Int. J. Uncertain. Fuzziness Knowl.—Based Syst. 1998, 6, 107–116. [Google Scholar] [CrossRef]
  32. Yang, J.; Heo, J.; Kim, J.; Park, Y.; Chu, H.; Park, Y. Deep Neural Network-Based Time Series Atmospheric Refractivity Prediction Model Using Meteorological Observation Data. J. Korean Inst. Electromagn. Eng. Sci. 2023, 34, 860–863. [Google Scholar] [CrossRef]
  33. Lee, C.; Lee, J.; Park, S. Forecasting the Urbanization Dynamics in the Seoul Metropolitan Area Using a Long Short-Term Memory–Based Model. Environ. Plan. B Urban Anal. City Sci. 2023, 50, 453–468. [Google Scholar] [CrossRef]
  34. Bravo, J.M. Forecasting Mortality Rates with Recurrent Neural Networks: A Preliminary Investigation Using Portuguese Data. In Proceedings of the CAPSI 2021 21ª Conferência da Associação Portuguesa de Sistemas de Informação, “Sociedade 5.0: Os desafios e as Oportunidades para os Sistemas de Informação”, Setubal, Portugal, 13–16 October 2021. [Google Scholar]
  35. Schnaubelt, M. A Comparison of Machine Learning Model Validation Schemes for Non-Stationary Time Series Data; FAU Discussion Papers in Economics; Friedrich-Alexander University Erlangen-Nürnberg: Erlangen, Germany, 2019. [Google Scholar]
  36. Hong, Y.-B.; Choi, J.-D. Prediction of KOSPI Index by Time Series based on Convergence Model using Cross-Validation of Time Series Data. J. Korean Oper. Res. Manag. Sci. Soc. 2023, 48, 1–21. [Google Scholar] [CrossRef]
  37. Seo, Y.; Baek, C. A Comparative Study on Cross-Validation Methods for Deep Learning Models in Time Series Prediction. J. Korean Data Inf. Sci. Soc. 2024, 35, 397–410. [Google Scholar]
  38. Cerqueira, V.; Torgo, L.; Mozetič, I. Evaluating Time Series Forecasting Models: An Empirical Study on Performance Estimation Methods. Mach. Learn. 2020, 109, 1997–2028. [Google Scholar] [CrossRef]
  39. Deng, A. Time Series Cross Validation: A Theoretical Result and Finite Sample Performance. Econ. Lett. 2023, 233, 111369. [Google Scholar] [CrossRef]
  40. Stone, M. Cross-Validation and Multinomial Prediction. Biometrika 1974, 61, 509–515. [Google Scholar] [CrossRef]
  41. Wagner, F.; Milojevic-Dupont, N.; Franken, L.; Zekar, A.; Thies, B.; Koch, N.; Creutzig, F. Using Explainable Machine Learning to Understand How Urban Form Shapes Sustainable Mobility. Transp. Res. Part Transp. Environ. 2022, 111, 103442. [Google Scholar] [CrossRef]
  42. Luo, P.; Chen, C.; Gao, S.; Zhang, X.; Majok Chol, D.; Yang, Z.; Meng, L. Understanding of the Predictability and Uncertainty in Population Distributions Empowered by Visual Analytics. Int. J. Geogr. Inf. Sci. 2025, 39, 675–705. [Google Scholar] [CrossRef]
  43. Sunkpho, J.; Se, C.; Wipulanusat, W.; Ratanavaraha, V. SHAP-Based Convolutional Neural Network Modeling for Intersection Crash Severity on Thailand’s Highways. IATSS Res. 2025, 49, 27–41. [Google Scholar] [CrossRef]
  44. Lai, Y.; Sun, W.; Schmöcker, J.-D.; Fukuda, K.; Axhausen, K.W. Explaining a Century of Swiss Regional Development by Deep Learning and SHAP Values. Environ. Plan. B Urban Anal. City Sci. 2023, 50, 2238–2253. [Google Scholar] [CrossRef]
  45. Lee, E. Exploring Transit Use during COVID-19 Based on Xgb and SHAP Using Smart Card Data. J. Adv. Transp. 2022, 2022, 6458371. [Google Scholar] [CrossRef]
  46. Yu, B.; Li, H.; Xing, H.; Ge, W.; Zhou, L.; Zhang, J.; Xu, M.; Yu, C. Geospatial SHAP Interpretability for Urban Road Collapse Susceptibility Assessment: A Case Study in Hangzhou, China. Geomat. Nat. Hazards Risk 2025, 16, 2491473. [Google Scholar] [CrossRef]
  47. Wang, Y.; Hu, L.; Hou, L.; Wang, L.; Chen, J.; He, Y.; Su, X. A SHAP Machine Learning-Based Study of Factors Influencing Urban Residents’ Electricity Consumption-Evidence from Chinese Provincial Data. Environ. Dev. Sustain. 2024, 26, 30445–30479. [Google Scholar] [CrossRef]
  48. Wang, M.; Li, Y.; Yuan, H.; Zhou, S.; Wang, Y.; Ikram, R.M.A.; Li, J. An XGBoost-SHAP Approach to Quantifying Morphological Impact on Urban Flooding Susceptibility. Ecol. Indic. 2023, 156, 111137. [Google Scholar] [CrossRef]
  49. Akter, R.; Susilawati, S.; Zubair, H.; Chor, W.T. Analyzing Feature Importance for Older Pedestrian Crash Severity: A Comparative Study of DNN Models, Emphasizing Road and Vehicle Types with SHAP Interpretation. Multimodal Transp. 2025, 4, 100203. [Google Scholar] [CrossRef]
  50. Ko, J.; Lee, J.; Ku, J. A Study on the Improvement: Local Investment Support Schemes for Local Industry Development and Activation. J. Korean Reg. Dev. Assoc. 2023, 35, 45–68. [Google Scholar]
  51. Cha, G.; Lim, S. An Analysis of Population Change and the Estimation of the Regional Vitality Index in Small Cities of Non-Capital Areas. J. Korean Assoc. Reg. Geogr. 2023, 57, 111–128. [Google Scholar]
  52. Sa, H. A Study on the Spatial Distribution Patterns and Agglomeration Factors of Emerging Industries. J. Korean Econ. Geogr. Soc. 2020, 23, 125–146. [Google Scholar]
  53. Jang, M. Analysis of the Impact of Young Adults’ Social Capital on Regional Mobility. J. Gener. Converg. Technol. Assoc. 2024, 8, 1624–1635. [Google Scholar] [CrossRef]
Figure 1. Youth population trend in South Korea (2003–2022).
Sustainability 17 06905 g001
Figure 2. Administrative divisions of South Korea.
Sustainability 17 06905 g002
Figure 3. Window structure for LSTM model.
Sustainability 17 06905 g003
Figure 4. Scatter plot of predicted vs. actual population values.
Sustainability 17 06905 g004
Figure 5. Predicted youth population in 2023 and 2030 based on the LSTM model: (a) 2023 and (b) 2030.
Sustainability 17 06905 g005
Figure 6. Change rate in the youth population from 2023 to 2030.
Sustainability 17 06905 g006
Figure 7. LSTM-SHAP results: (a) national level, (b) metropolitan city level, (c) city level, (d) county level.
Sustainability 17 06905 g007
Table 1. Description of variables used in the analysis.
VariableVariable NameDescriptionSource
TargetYouth populationNumber of population aged 19–34KOSIS
FeaturePopulationAging indexRatio of population aged 65+ to
population aged 0–14
KOSIS
Total populationTotal number of populationsKOSIS
IndustryTotal workersTotal number of workersSGIS
Proportion of manufacturing workersRatio of manufacturing workers to
total workers
SGIS
Proportion of service workersRatio of service industry workers to
total workers
SGIS
InfrastructureNumber of universitiesNumber of universitiesMOE
Number of hospitalsNumber of hospitalsHIRA
KTX stations (dummy)1 if a KTX station exists, otherwise 0MOLIT
Urban
Characteristics
Proportion of old housesRatio of houses over 30 years old to total number of housesKOSIS
Distance to SeoulDistance to Seoul from the centroidKOSIS
Note: KOSIS = Korea Statistical Information Service; SGIS = Statistical Geographic Information Service; MOE = Ministry of Education; HIRA = Health Insurance Review and Assessment Service; MOLIT = Ministry of Land, Infrastructure and Transport.
Table 2. Hyperparameters used in the LSTM model for population prediction.
HyperparameterValue
Units50
Dropout0.1
Layers2
Optimizerrmsprop
Epochs100
Batch size16
Patience10
Table 3. Evaluation results of the LSTM model on train and test sets.
Evaluation MetricTrain SetTest Set
RMSE6431.1837421.283
MAE3662.5104041.275
MAPE9.17310.086
R20.9820.975
Note: RMSE = root mean squared error; MAE = mean absolute error; MAPE = mean absolute percentage error; R2 = coefficient of determination.
Table 4. Comparison of LSTM and Statistics Korea Prediction Accuracy using MSE, RMSE, and MAE (a) 2023 (b) 2024 (c) 2025.
ModelRMSEMSEMAE
(a)
LSTM23,908.27571,605,20315,792.35
Statistics Korea: Low29,751.86885,172,98422,992.47
Statistics Korea: Medium29,757.49885,508,48722,998.71
Statistics Korea: High29,764.95885,952,25723,005.12
(b)
LSTM32,373.771,048,061,22419,109.88
Statistics Korea: Low31,584.97997,610,48424,391.59
Statistics Korea: Medium34,168.371,167,477,23026,249.65
Statistics Korea: High36,814.021,355,271,78928,136.76
(c)
LSTM29,592.46875,713,52518,629.76
Statistics Korea: Low30,058.16903,492,82923,143.00
Statistics Korea: Medium34,769.181,208,896,58426,399.00
Statistics Korea: High39,675.691,574,160,11429,832.47
Disclaimer/Publisher’s Note: The statements, opinions and data contained in all publications are solely those of the individual author(s) and contributor(s) and not of MDPI and/or the editor(s). MDPI and/or the editor(s) disclaim responsibility for any injury to people or property resulting from any ideas, methods, instructions or products referred to in the content.

