Abstract
In the process of evaluating the quality of a company’s development, the issues related to production capacity and environmental pollution have emerged as significant concerns. Drawing on the methodologies employed in previous related research, this study utilizes the Data Envelopment Analysis with relaxation variables and the Global Malmquist–Luenberger index to measure the green total factor productivity of Chinese heavy-polluting enterprises. The main findings of this study are as follows: (1) It is clearly demonstrated that higher managerial effectiveness has a substantial positive impact on the improvement of a company’s green total factor productivity; (2) the digitalization progress within enterprises serves as a moderating factor in the relationship between managerial effectiveness and green total factor productivity; (3) the extent of financial constraints acts as a mediating variable, intervening in the relationship between managerial efficiency and green total factor productivity; and (4) a threshold effect is detected between managerial effectiveness and the debt repayment pressure faced by enterprises. When the threshold values of managerial effectiveness or the quick ratio are surpassed, the influence of managerial effectiveness on the green total factor productivity of enterprises will undergo a change.
1. Introduction
As the largest developing and populous nation, China has undergone significant economic transformations since the implementation of its reform and opening-up policy, achieving numerous “world firsts” and economic miracles, largely attributable to its unique resource endowment. Nevertheless, this extensive mode of economic growth, characterized by reliance on substantial inputs of labor and energy without significant improvements in industrial structure or technical efficiency, often yields only short-term prosperity. In order to ensure sustainable national development, a shift towards intensive economic growth is required to ensure enduring momentum. The extensive growth model, with its over-reliance on GDP expansion, encourages short-term engagement in low-end processing industries while neglecting the intrinsic dynamics of industrial upgrading and productivity enhancement. This model has been shown to result in environmental degradation due to excessive resource consumption and to fail to enhance the marginal benefits for economic entities. Consequently, resources and the environment have transitioned from being mere endogenous variables influencing economic development to becoming rigid constraints that limit the quality of such development. The detrimental “substitution effect” and “income effect” of environmental damage further impair labor quality and quantity, with substantial economic and social costs incurred in subsequent environmental remediation efforts. With the advent of the Lewis turning point, the scale advantages provided by the demographic dividend have diminished, signaling the need to abandon the outdated reliance on low-end processing. In the context of finite resources and escalating environmental pollution, the paradigms of green and sustainable development have gained prominence.
In 2017, the Chinese government introduced the concept of “high-quality development,” emphasizing the dual objectives of invigorating economic vitality and fostering green development. By 2022, this concept had been elevated to a national priority, reflecting its political significance. Nevertheless, it is important to note that governmental focus alone is insufficient to ensure the achievement of this objective. Enterprises, as the primary emitters and ultimate targets of environmental governance, and key suppliers of societal materials, play a pivotal role in enhancing societal green total factor productivity (GTFP).
As heavy-polluting industries are the main sources of resource consumption and environmental pollution, they have enormous potential for GTFP improvement and value enhancement, making them a key focus of China’s modern environmental regulations (Yan, D., et al., 2024 [1]; Wang, C., & Zhang, Y., 2024 [2]). At the same time, due to the limited environmental influence and survival and development orientation of non-listed companies and small- and medium-sized enterprises, this study will focus on listed companies in heavy-polluting industries.
Although existing studies have explored the determinants of GTFP from a regional perspective (Haiyan Niu et al., 2022 [3]; Tian et al., 2023 [4]), the mechanism analysis at the firm level remains a gap. Moreover, the moderating effect of digital transformation on the relationship between management efficiency and GTFP has not yet been systematically investigated. This paper, for the first time, reveals the mediating role of financial constraints and the moderating effect of digitalization by constructing a firm-level GTFP estimation model and employing a two-stage DEA–Tobit method, filling this research gap. The core questions of this paper are as follows: (1) How does management efficiency affect corporate GTFP through financial constraints? (2) How does corporate digitalization moderate the relationship between management efficiency and GTFP? (3) Does short-term debt repayment pressure create a threshold effect on the impact of management efficiency on GTFP?
2. Literature Review
2.1. Measurement and Determinants of Green Total Factor Productivity (GTFP)
The Data Envelopment Analysis (DEA) method is a widely used technique for measuring green total factor productivity (GTFP). As a non-parametric efficiency evaluation technique, DEA eliminates the need for preset functional forms and objectively weights production efficiency across decision-making units (DMUs) based on their input–output differentials (Da, Y., & Luo, D., 2023) [5]. In terms of methodology, the traditional DEA model, which ignores undesirable outputs, has gradually been replaced, while the SBM-ML model (Chung et al., 1997) [6] and the Super-SBM model (Tone, 2001) [7] have become mainstream. This integration equipped DEA with the capability to systematically evaluate environmental inefficiencies within DMUs. This integration marked a significant theoretical breakthrough in reconciling productivity measurement with ecological constraints (Chen, G., 2014) [8].
Regarding sample selection, most studies are based on provincial or industry-level data, while firm-level research is predominantly concentrated in manufacture or high-tech enterprises in the existing literature. For example, Wang, H. et al. (2022) [9] used data from the Yangtze River Delta Urban Agglomeration (YRDUA) from 2003 to 2018 to investigate the impact of the China (Shanghai) Pilot Free Trade Zone (SPFTZ) on the green total factor productivity (GTFP) of the YRDUA. Wu, Jing et al. (2022) [10] utilized provincial-level economic and environmental statistical data of A-share listed companies in China from 2004 to 2019 to study the role and effects of green innovation in enhancing GTFP from a micro-level perspective. Tong, Lei et al. (2022) [11] examined the impact of environmental protection regulations, green finance, foreign direct investment, and green technology investment on the GTFP of 27 Chinese provinces from 2010 to 2021.
In studies at the enterprise level, most have focused on manufacturing or high-tech companies. For example, Jianlong Wang et al. (2023) [12] used a sample of A-share listed companies in China from 2004 to 2020 and, at the industry level, distinguished between manufacturing, non-high-tech, and non-pollution-intensive industries to explore the impact of digital transformation and its related micro-mechanisms on GTFP. Hong-xing Wen et al. (2024) [13] employed firm-level data of A-share listed companies in China to investigate the impact of environmental insurance on GTFP from 2010 to 2019. Kaixuan Di et al. (2024) [14] used panel data of Chinese listed manufacturing companies from 2011 to 2022 and applied social network analysis to explore the impact of firms’ positions in green collaborative innovation networks on their GTFP and the underlying mechanisms. The reason for the concentration of similar studies on manufacturing or high-tech companies may be that innovation activities in these industries are more frequent and data are more easily accessible. However, this concentration has also led to a lack of research on other industries, such as pollution-intensive industries.
2.2. Influencing Factors of Green Total Factor Productivity
Research on the factors influencing green total factor productivity in enterprises frequently commences with an examination of the financial status, industrial structure, and environmental regulations of enterprises. A positive financial condition in an enterprise fosters its capacity to enhance its own developmental quality (Halbert, L., Henneberry, J., & Mouzakis, F., 2014) [15]. When the available fluid funds of an enterprise are inadequate to ensure production and survival, its decisions tend to favor conservative projects that can have relatively stable expected results in the visible time and abandon projects that contribute to long-term development (Zhang, Y., Xing, T., & Chen, G., 2022) [16]. Xiang et al. (2018) [17] utilized Chinese high-tech small- and medium-sized enterprises as a sample and found that firms can invest more funds in technological innovation to improve their development quality under improved financial conditions. The influence of differing industrial structures on pollution and production efficiency is also a subject of interest. Tian Ze et al. (2023) [18] also found that upgrading industrial structures can effectively promote regional economic development while reducing pollution emissions. The researchers used China’s Yangtze River, Pearl River, and Yellow River basin urban agglomerations as research samples. Furthermore, Li et al. (2021) [19] found that enterprises in high-tech industries often generate less pollution while bringing higher economic benefits from the perspective of 30 provinces in China. Consequently, when deliberating the enhancement of green total factor productivity in a region, scholars will commence from the perspective of refining the local industrial structure (Sun, Y., Liu, Z., Liu, Y., & Bian, P., 2022) [20].
Government policies have the capacity to influence the development of ideas. For instance, the government’s advocacy for environmental protection, coupled with the introduction of pertinent laws and regulations, has the potential to influence the green total factor productivity of enterprises and regions (Zhao, L., & Chen, L., 2022) [21]. As Mao and Failler (2022) [22] have demonstrated, the government can promote the improvement of urban green total factor productivity by promoting green finance and green credit and coordinating the development of resources and the environment. Furthermore, scholars have examined the factors that influence green total factor productivity from the perspectives of climate change, financial development, and the digital economy (Song, Y., Zhang, B., Wang, J., et al., 2022 [23]; Xie, D., & Hu, S., 2023 [24]; Zhang, J., & Wang, B., 2023 [25]).
2.3. Impact of Managerial Characteristics on Development of Enterprises
The separation of ownership and management is a concept in which the ownership and operating rights of an enterprise are divided between different groups. Under the upper echelon theory, the management of the enterprise, as the entity responsible for decision-making and control, exerts a direct influence on the precision and efficacy of the enterprise’s decision-making processes (Heubeck, T., & Ahrens, A., 2025) [26]. It is also responsible for delineating the enterprise’s strategic direction. A review of the extant literature on managerial characteristics reveals two predominant perspectives: the entire team and various subgroups within the team. From the perspective of the entire management team, the impact of management shareholding on a manager’s sense of belonging, the supervision and balance of independent directors on managers, and the impact of management overconfidence on the company’s strategic decision-making are often considered. Hu Guoqiang and Xiao Zhichao (2018) [27] posit that managers inherently possess the motivation to maximize the short-term value of the company, and the allocation of shares to managers can serve to bind them to the company to a certain extent, thereby ensuring the long-term development of the company through the “governance effect”. Wang Shuguang and Wang Bin (2022) [28] posit that independent directors wield negligible influence over corporations in China, attributable to the nation’s distinctive corporate governance culture. Nevertheless, an examination of the individual characteristics of independent directors, including their profession, reputation, and political status, reveals that these “signature directors” can exert a significant influence on the company. Hu Haifeng et al. (2022) [29] further posit that excessive trust in management can result in a misjudgment of the company’s form and the economic market, excessive inclination towards radical strategies, and organizational instability, which can frequently result in violations by the company.
The heterogeneity between different groups within a firm’s management team is often approached from the perspective of the ‘board fault zone’. Wang Zhi and Tan Huan (2023) [30] conducted an analysis using Shanghai and Shenzhen A-shares as samples and found that the stronger the board rupture zone, that is, the greater the differences within the board, the easier it is to suppress the development quality of the firm. At this juncture, due to the discrepancies between subgroups, different subgroups often decline to share information, thereby exacerbating the principal-agent problem. Furthermore, the frequent changes resulting from different subgroups attacking and restraining each other can lead to a significant decline in the operational efficiency and performance of the enterprise. Pu et al. (2023) [31] utilized listed companies in China’s non-financial industry as a research sample to study the impact of board differences on a company’s risk-taking ability and found that board rupture zones were often caused by cognitive differences, which in turn could negatively affect the company’s business development by disrupting internal order and reducing efficiency. Other scholars have conducted research from the perspectives of managerial ability, gender differences, and network centrality (Fu, J., Yang, J., Xia, Y., & Mo, Y., 2022 [32]; Zang, C., & Liu, X., 2022 [33]; Fan, Q., & Qiu, J., 2023 [34]).
2.4. Innovativeness of This Study
The contributions of this study are as follows: (1) it measures GTFP at the enterprise level. Although the academic circle has increasingly considered environmental pollution as an undesired output in the evaluation of development quality, due to computational difficulties, the majority of relevant studies have been conducted from a regional perspective. This paper fills this research gap by calculating GTFP at the enterprise level and delving into the impact of managerial effectiveness; (2) guided by the upper echelon theory and the resource-based view theory, it combines mechanism analysis to gain a deeper understanding of the research topic. The innovative approach of this study is especially remarkable, as it explores the effect of managerial effectiveness on GTFP, an area that has been relatively less explored in the academic literature. Specifically, the study examines the transmission mechanisms mediated by financial constraints and investigates the moderating effects of enterprise digitalization; and (3) it explores how debt repayment pressures, in relation to managerial effectiveness, affect GTFP, offering a more comprehensive and detailed understanding of the financial factors that influence sustainable business practices within enterprises.
2.5. Theoretical Analysis
2.5.1. Impact of Managerial Effectiveness on Green Total Factor Productivity of Enterprises
Classical economics did not consider the impact of individual managerial characteristics on production and operation and assumed homogeneity among enterprise management teams. However, the upper echelon theory acknowledges the variances in the enterprise’s internal and external environments. It posits that the attributes of the management team exert an influence on the enterprise’s practical production and operation. In the context of the separation of ownership and control, the managers of enterprises are recognized as the actual holders of operating rights. However, in the complex internal environment and the ever-changing external environment, managers cannot make judgments about the enterprise, the industry, and the market on the basis of the “all-knowing and all-powerful” state. The heterogeneity of managerial characteristics inevitably leads to differences in strategic choices and actual implementations of strategies. Managerial effectiveness is defined as the effectiveness of management’s subjective initiative in integrating and allocating internal and external resources, seizing opportunities, and responding to crises within the established human and material resources of the firm (Demerjian, P., et al., 2012) [35]. The importance of green total factor productivity is evident, as it emphasizes the quality of enterprise development, thereby helping enterprises to reduce costs and increase efficiency from the source and consequently strengthen their competitiveness. Nevertheless, enhancing green total factor productivity is accompanied by the characteristics of high risk and gradual effectiveness, particularly when a substantial input of resources is required. It is evident that enterprises may allocate excessive resources to green total factor productivity enhancement initiatives, thereby impeding standard production processes (Zhao, Z., & Yan, J., 2023) [36].
The managerial effectiveness of a firm can exert a significant influence on its green total factor productivity, particularly with regard to strategic choices and the integration of resources. The initial impact is evident in the strategic decisions made by the firm. It is evident that managers who hold management rights do not generally possess ownership of the enterprise, as evidenced by the separation of ownership and control in enterprises where the value of the enterprise does not directly align with the interests of the management team. The remuneration of the management team is often contingent on valuation requirements set by shareholders or the board of directors. Consequently, managers are incentivized to prioritize enterprise value, leading to an over-reliance on evaluation indicators. This can result in the marginalization of projects that are beneficial to long-term enterprise development but are not directly linked to management evaluation. However, powerful managers can effectively integrate existing resources to create higher returns and easily achieve assessment targets. The ability of the management team to balance the enterprise’s value with their own interests is facilitated by sufficient energy and strong skills. Their overall awareness is reflected in the enterprise’s strategic choices (Hua, J., Jiang, Z., & Lang, Y., 2022) [37]. In the selection of corporate strategy, it can be reflected that managers with strong effectiveness are aware of the long-term impact of environmental protection as a social responsibility on the enterprise and adjust their strategies in a timely manner to take active and effective measures to cope with it, reducing unexpected outputs such as environmental pollution without causing a significant negative impact on the production and operation of the enterprise.
The presence of robust managerial effectiveness within enterprises will be reflected in their internal management practices. This, in turn, will enable management to establish management models that are based on the production and operational characteristics and needs of enterprises. It will also result in a reduction in the noise of communication between departments (Barzegar, R., et al., 2022) [38]. And, the presence of robust managerial effectiveness can assist enterprises in improving their green total factor productivity by reducing the degree of financial constraints. As the real capital market still requires improvement, the “reservoir” is unable to fully meet the capital needs of enterprises, which leads to more conservative investment decisions (Chen, H., & Yoon, S. S., 2022) [39]. This will result in a reduction in the loss of production factors in the production department and the flow of products between enterprise departments. Projects necessitating long-term investment from enterprises and exhibiting protracted outcomes, such as the enhancement of green total factor productivity, may not garner significant attention (Li, J., 2022) [40]. In addition, improved financing constraints give companies sufficient capacity to adjust their expected output (Scherer, J., & Biemans, W. G., 2025) [41]. In other words, the easing of financing constraints improves corporate profitability by influencing investment decisions and resource allocation, thereby positively affecting corporate green total factor productivity. The preceding analysis suggests the following hypotheses for further investigation:
Hypothesis 1.
Managerial effectiveness can promote the improvement of green total factor productivity in enterprises.
Hypothesis 2.
Improvements in management efficiency ease financing constraints, thereby enhancing profitability and ultimately positively impacting green total factor productivity.
2.5.2. Regulatory Role of Enterprise Digitalization
Under the resource-based view theory, the digitization of enterprises has the capacity to influence the manner in which production and operations are conducted, through the optimization of information and resource collection, analysis, and allocation. In the era of Industry 4.0, information and data have become integral components of social production, functioning as vital means of production. The digital economy uses modern information networks as conduits to digitize information within the production and operation processes of enterprises, thereby integrating it into the production factors (Chen, Y., Xu, S., Lyulyov, O., et al., 2023) [42]. The utilization of contemporary information technology enhances the efficiency and precision of decision-making processes, thereby promoting economic growth through the enhancement of production efficiency and the acceleration of industrial transformation. The adoption and integration of digital technology by enterprises are critical aspects of their digital transformation (Zarte, M., Pechmann, A., & Nunes, I. L., 2022) [43]. Enterprises can optimize production processes through the use of modern information technology, analyze and restructure supply chains, and enhance communication through network platforms to reduce information transmission losses (Beaulieu, M., & Bentahar, O., 2021) [44]. Secondly, the theory of top-level management posits that it is impossible for the management team to achieve a state of complete knowledge of the market and the company’s own situation. Consequently, the preferences of the management team, influenced by their individual characteristics, will be reflected in the decisions they make, resulting in variations in efficiency. The advent of digitalization within enterprises has rendered modern information technology instrumental in facilitating expeditious comprehension of market dynamics. Consequently, management is enabled to attain a more punctual grasp of the enterprise’s production status, thereby augmenting its managerial effectiveness and enabling the formulation of more efficacious decisions through the enterprise’s information sharing platform. The following hypothesis is thus proposed:
Hypothesis 3.
The deepening of digitalization in enterprises can enhance their managerial effectiveness and promote their green total factor productivity.
2.5.3. Threshold Role of Debt Repayment Pressure
The impact of debt repayment pressure on the effectiveness of managerial effectiveness in relation to green total factor productivity is multifaceted, primarily manifesting in the strategic choices made by management. Firstly, while financial leverage can undoubtedly confer numerous advantages upon enterprises, the concomitant financial risks can amplify the debt repayment pressure, potentially leading to self-acceleration of leverage and excessive utilization of credit resources. This phenomenon can give rise to the emergence of zombie enterprises and concomitantly reduce production efficiency by diminishing capital allocation efficiency (Guan, K., & Zhu, H., 2023) [45]. Secondly, heightened debt repayment pressure can also exert an influence on the production and operation of enterprises. When the debt pressure is high, in order to ensure the safety of their principal, creditors will put pressure on the enterprise to choose conservative strategies that may seem more stable but are not conducive to the development of the enterprise (Kini, O., Shenoy, J., & Subramaniam, V., 2017) [46]. Concurrently, elevated debt levels frequently result in more rigorous credit review processes from financial institutions and excessive scrutiny from external analysts, potentially impeding management decision-making (Shen, G., Zhang, Y., & Wang, R., 2018) [47]. Finally, from the perspective of financial constraints, even if a company’s managerial effectiveness can provide creditors and potential investors with an expectation of “good future business performance”, under the considerable pressure of debt repayment, enterprises may encounter increased difficulties in obtaining funds and higher costs in using them, which can lead to a heightened probability of financial hardship and constrained investment in green total factor productivity from a financial perspective. This observation gives rise to the following hypothesis:
Hypothesis 4.
When the debt pressure of a company decreases to a certain threshold, the role of managerial effectiveness in promoting green total factor productivity will increase.
3. Design of Research
With reference to de Melo et al. (2024) [48], we provide a concise overview of the study’s main methodology, as detailed in Figure 1.
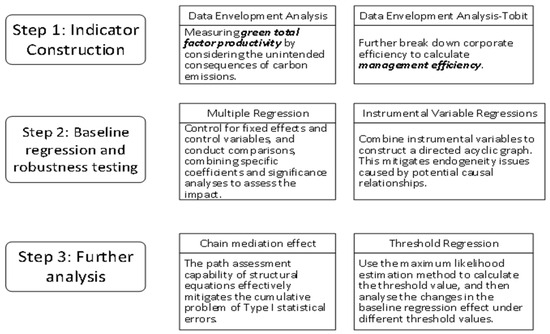
Figure 1.
Overview of main methodology.
3.1. Main Variables
The main variables used in this article are listed in Table 1, and their symbols and measurement methods are briefly introduced. The calculation methods for green total factor productivity and managerial effectiveness are relatively complex and are presented separately in the following text.

Table 1.
Main variables.
3.1.1. Explained Variables
Neoclassical economic theory uses the super-efficiency SBM model to calculate total factor productivity from the perspective of supply and output. Consequently, total factor productivity gradually becomes an important indicator for measuring economic development (Young, A., 1995) [50]. In order to compensate for and repair the ecological damage caused by pollution, a certain amount of financial and human investment is required. From this perspective, total factor productivity, if unadjusted for pollution, will overestimate the level of economic development. Chambers et al. (1996) [51] were the first to propose the incorporation of pollution as an unanticipated output in the measurement of production efficiency, thereby deriving green total factor productivity metric that can more accurately gauge production efficiency. In a similar vein, Fukuyama and Weber (2009) [52] proposed a method of SBM calculation by integrating radial distance functions. This study uses the super-efficient SBM model and combines it with the GML index to measure the green total factor productivity of enterprises.
The method for measuring carbon emission performance is based on the work of Wang Pei et al. (2022) [53].
(1) Take the year-end employment figures of enterprises as the labor input variable.
(2) Take the fixed asset stock of the enterprise as the capital investment variable. The calculation formula is as follows:
The capital stock of the period t is denoted by , the fixed assets added in the period t by , and the price index of fixed asset investment in the province by .
(3) Calculate the energy consumed by the enterprise obtained through the energy consumption of the enterprise (which is obtained by converting the energy consumption of the enterprise into standard coal as the energy input variable) and multiply the coefficient (which is obtained by using the ratio of the enterprise’s operating costs to the industry’s operating costs).
(4) Use the company’s operating revenue as the expected output.
(5) Treat the pollution generated by the enterprise as an unexpected output, in which it is the same as the energy measurement method for the enterprise.
3.1.2. Explain Variables
This study measures the capabilities of corporate managers by drawing on research methods of Demerjian, Lev, and McVay [35] in the context of the actual situation in China. First, sales revenue (Sales) is taken as the output variable, while inventory costs (CoGS), selling, general, and administrative expenses (SG&A), property, plant, and equipment (PPE), net intangible assets (Intan), research and development expenses (R&D), and goodwill (Goodwill) are taken as input variables. Compared to net profit or equity market value, revenue (Sales) more directly reflects the management team’s ability to convert resources into operational outcomes and aligns more closely with the core objective of profit-maximizing enterprises. Hence, it is appropriate to use sales as the output indicator. CoGS reflects the inputs in inventory management. SG&A, which encompass advertising, employee training, IT services, and other period expenses incurred during the current operating year, reflects intangible assets like the quality of the sales team and organizational efficiency. PPE serves as an indicator of fixed asset investments in facilities and equipment. Research and development (R&D) expenditure, as a key driver of long-term revenue growth, represents investments in innovation. Goodwill, which reflects the intangible value inherent in a brand (e.g., customer base), captures the non-physical assets derived from brand equity. Intan collectively represents the residual unmentioned intangible resources, such as patents, trademarks, and copyrights, which contribute to a firm’s competitive advantage. The company’s production efficiency is then calculated using Data Envelopment Analysis (DEA).
The second step is to use the Tobit model to make regression analysis of the firm’s calculated production efficiency on firm size (Size), market share (Market Share), free cash flow (FCF), age of listing (Age), and firm complexity (measured by Herfindahl–Hirschman Index, HHI). At the same time, industry and year fixed effects are controlled to reduce the impact of firm-level factors such as size on the measurement of managerial competence, and cluster effects at the individual and year levels of firms are used to control for cross-sectional and time correlations. While the input–output performance of a firm can reflect management efficiency, the influence of firm-specific characteristics such as size may confound the measurement. This introduces noise into the assessment of managerial effectiveness. Therefore, Demerjian, Lev, and McVay [35] followed Fama and French [53] by incorporating firm size, market share, and other factors as control variables and using regression residuals to measure management efficiency (ME).
3.1.3. Control Variables
Considering that too many omitted variables may cause endogeneity problems by affecting the disturbance terms of multiple regression, this article adds some variables that reflect the financial and management statuses of the firm as control variables to mitigate the impact of causal relationships (Certo, S. T., Busenbark, J. R., Woo, H., et al., 2016) [54]. Based on a comprehensive analysis of scholars’ previous research, the following variables are selected as control variables: firm size, asset–liability ratio, Tobin Q value, firm age, major shareholder ownership ratio, board size, and institutional investor ownership ratio (Xiao, J., Peng, J., & Cheng, S., 2023) [55].
3.2. Model Design
Conduct empirical testing on Hypothesis 1 by constructing the following model:
When testing Hypothesis 2, drawing on the research of Wen Zhonglin and Ye Baojuan (2014) [56], the stepwise analysis method was used to empirically test the mediating effect of financial constraints:
If in Formula (4) is significantly negative, in Formula (5) is also significantly negative and in Formula (5) is significantly positive, which can confirm that the financial constraints (measured by Sa) of the enterprise play a mediating role between managerial effectiveness (ME) and green total factor productivity (GTFP).
The interaction term is introduced to test Hypothesis 3 empirically:
Considering the possibility of collinearity between the explanatory and moderating variables in the model after the interaction term was introduced, this article introduces the interaction term again after centralizing the variables. At this point, if of Formula (6) is significantly regular, it can be confirmed that digitalization of enterprises helps promote the impact of managerial effectiveness (ME) on the green total factor productivity (GTFP) of enterprises.
Regarding Hypothesis 4, the following model is proposed:
This study expects the existence of a single threshold value, that is, when the value of the threshold variable (symbol) exceeds the threshold γ, the coefficient of the impact of managerial effectiveness on green total factor productivity is ; otherwise, it is .
Considering that individual differences can easily lead to endogeneity problems, this article chooses the controlling fixed effects of individuals and time and then runs the Huasman test. If the results reject the null hypothesis at the 1% level, then the control fixed effects of individuals and time are appropriate.
4. Empirical Analyses
4.1. Data Selection and Processing
This article selects data from heavy-polluting enterprises in China’s Shanghai and Shenzhen A-shares from 2015 to 2019. The use of the super-efficient SBM model combined with the GML index needs to balance panel data, which will cause a large number of sample losses. In addition, COVID-19 had a huge impact on the world economy. This paper sets the sample interval between 2015 and 2019. After calculating the carbon emission performance from 2016 to 2019 using Matlab 2020, the relevant financial data were selected from the China Economic and Financial Research Database (CSMAR). As for heavy-polluting enterprises, the State Environmental Protection Administration of China proposed 13 categories of heavy-polluting industries in 2003, and there have been some changes in China’s industrial classification standards since then. This article selects 20 heavy-polluting industries (Industry Codes: B6, B7, B8, B9, B10, B11, C15, C17, C18, C19, C22, C25, C26, C27, C28, C29, C30, C31, C32, and D44). After the above screening, 696 companies were selected as sample companies, and a total of 2784 pieces of data were obtained.
The data in this article come from China Stock Market Accounting Research (CSMAR), China Statistical Yearbook, and China Environmental Statistical Yearbook. Some indicators were manually organized and calculated using EXCEL 2021, Matlab 2020, and Stata 17, and data analysis was performed using Stata 17. A 1% tail reduction was then applied to reduce the impact of extreme values.
4.2. Descriptive Statistics
Before conducting the empirical analysis, this article conducts descriptive statistics and correlation analysis on the relevant variables to analyze their distribution. The results of the descriptive statistics are presented in Table 2. The mean value of green total factor productivity (GTFP) is 1.288, while the median is 1.169 and the standard deviation is 0.450. The median and the mean are both greater than one, indicating that the GTFP of most of the companies is in a state of progress. The average managerial effectiveness of these enterprises is −0.028, with a median of −0.003, indicating that the managerial effectiveness (ME) of most sample enterprises is in a poor state. The standard deviation of the quick ratio (ATR) is 1.614, while the average is 1.534, and the coefficient of variation is greater than one. This indicates that the ATR of these enterprises is significantly different and needs further analysis. The standard deviation between the size and age of the sample enterprises should be greater than one, which is related to the operation of the enterprises themselves. The average leverage of the sample enterprises is 0.421, with a median of 0.412, which is generally within a reasonable range in terms of empirical values. However, it should also be noted that both the maximum and minimum values are extreme situations.
Table 2.
Descriptive statistics.
4.3. Correlation Analysis
By performing a correlation analysis on the explanatory variable, the dependent variable, and the control variable, the data in Table 3 can be obtained. The coefficient between managerial effectiveness (ME) and green total factor productivity (GTFP) was found to be 0.231, which is significant at the 1% level. From the perspective of correlation analysis, it is believed that managerial effectiveness (ME) can significantly promote the development of green total factor productivity (GTFP) in enterprises. This article will use multiple regression models to test this in the following chapters.
Table 3.
Correlation analysis.
Table 4 shows the inflation factor test carried out on the explanatory and control variables. It can be seen that the inflation factors of each variable do not exceed 2, much less than 10, indicating that there is no collinearity problem between the variables used in this study.
Table 4.
Inflation factor test.
4.4. Impact of Managerial Effectiveness on Green Total Factor Productivity
Based on the model set up in the previous section, the impact of managerial effectiveness on a firm’s green total factor productivity is tested, and the empirical results are presented in Table 5. Column (1) of Table 5 is a multiple regression without control variables. This model only controls for individual and time variables. At this point, we can see that the impact of managerial effectiveness (ME) on a firm’s green total factor productivity (GTFP) is significantly positive (coefficient 0.647, significant at the 1% level). After adding the control variables, the impact of managerial effectiveness (ME) on GTFP remains significantly positive (as shown in column (2) of Table 5, with a coefficient of 0.624, significant at the 1% level). At this point, for every 1% increase in managerial effectiveness (ME), the GTFP of the enterprise increases by more than 0.6%.
Table 5.
Benchmark regression.
This result confirms Hypothesis 1. Specifically, enhanced managerial efficiency endows firms with more sophisticated resource allocation capabilities, enabling them to adopt a long-term perspective, reduce carbon emissions during production processes, and thereby improve their green total factor productivity.
4.5. Robustness Check
In order to increase the credibility of the benchmark regression, some robustness tests of the benchmark regression were conducted in this article, resulting in Table 6. Referring to the study by Song Jing et al. (2023) [57], managerial effectiveness (ME) was divided into four groups based on its numerical distribution from small to large, with values assigned to zero, one, two, and three, respectively. The newly generated array was named MEF. Column (1) of Table 6 shows the results of the robustness test for the measurement method with the explanatory variables replaced. As the model has been replaced, only the positive and negative values and the significance of the coefficients need to be considered at this point. At this point, the coefficient is 0.1339, which is significant at the 1% level.
Table 6.
Robustness test.
The endogeneity problem was examined through instrumental variables combined with GMM modeling using two-order least squares. There may be a causal relationship between a firm’s managerial effectiveness (ME) and its green total factor productivity (GTFP). That is, companies with high GTFP often mean that their management structure is well established, their operations are stable, and their managerial effectiveness (ME) can be better utilized. This means that GTFP in turn affects the managerial effectiveness (ME) of companies. To reduce this effect, this article uses lagged first-order managerial effectiveness (ME) as an instrumental variable and combines it with the GMM model to conduct a second-order least squares test.
The results are displayed in column (2) of Table 6, where the number of instrumental variables is equivalent to the number of possible endogenous variables. The p-value of the unidentifiable test is less than 1%, and the F-value of the first-order regression is 27.49. The p-value of the weak instrumental variable test is also less than 1%, which statistically rejects the hypothesis of weak instrumental variables. Furthermore, the findings reveal a significant positive correlation between managerial effectiveness (ME) and green total factor productivity of the enterprise (coefficient 0.564, significant at the 10% level). It is noteworthy that the R-squared value of the GMM model is less than zero, due to the implementation of second-order least squares regression. It is important to note that an R-squared value less than zero does not necessarily compromise the evaluation of the model and should not be given excessive weight (Sribney, W., Wiggins, V., & Drucker, D., 2005) [58].
The average managerial effectiveness (ME) of peers in the same region as a company should be used as an instrumental variable for testing. When conducting horizontal comparative analysis in enterprises, peers who are geographically close to them are an important reference point (Li, F., 2016) [59]. These peers have been found to have similar resource needs and sales orientation to the company itself. When a peer’s managerial effectiveness is significantly enhanced, they exert what has been termed “peer pressure” on the company’s managers through market share and investor warnings, compelling the company to improve its own managerial effectiveness (Zhao, Z., & Wang, P., 2023) [60]. The present article, therefore, calculates the average managerial effectiveness of peers in the same city as a certain enterprise as an instrumental variable for testing, the results of which are shown in column (3) of Table 6. It is evident from this perspective that endogeneity testing has also been conducted.
4.6. Further Analyses
4.6.1. Intermediary Effect of Financial Constraints
For enterprises with high levels of pollution, enhancing their green total factor productivity (GTFP) necessitates the modification of their organizational structure and the allocation of substantial resources to related process innovation and reform. Among these, the impact of financing constraints on corporate profitability (roa) through restrictions on the use of funds is also an important factor affecting green total factor productivity. Managerial effectiveness (ME) is reflected in the collection, organization, and integration of external information and resources by managers. It is evident that financial constraints (SA) and corporate profitability (roa) act as mediating factors between managerial effectiveness (ME) and green total factor productivity (GTFP). To empirically validate this hypothesis, a systematic stepwise test method was used, as illustrated in Table 7, which presents the outcomes of the empirical investigation. The SA index is utilized to gauge the extent of financial constraints encountered by companies. This indicator is a positive indicator, and the larger its value, the more severe the financial constraints that the enterprise is facing.
Table 7.
Chain mediation effect.
Column (1) of Table 7 presents a benchmark regression model. Column (2) of Table 7 examines the impact of managerial effectiveness (ME) on the financial constraints (SA) faced by enterprises. The findings reveal that managerial effectiveness (ME) can effectively alleviate the degree of financial constraints (SA) faced by enterprises (coefficient is −0.019, significant at the 1% level). In Table 7, the SA indicator in column (3) is negative, while the ME indicator is positive, indicating that the impact of financing constraints (SA) is transmitted to profitability (roa). Column (4) of Table 7 confirms that management efficiency (ME) enhances corporate profitability (roa) by alleviating financing constraints (SA), thereby improving green total factor productivity (GTFP). This is because improvements in management efficiency (ME) grant firms greater capacity to identify pathways to alleviate financing constraints (SA). The alleviation of financing constraints (SA) exerts a promotional effect on green total factor productivity (GTFP).
Therefore, to enhance the credibility of the results, we employed structural equation modeling and the bootstrap method to test the chain mediating effect. After incorporating control variables, a total of 1000 bootstrap sampling tests were conducted. The test results are shown in Table 8, which again confirms the chain mediating effect of financing constraints (SA) and profitability (roa).
Table 8.
Bootstrap analysis combined with structural equation modeling.
4.6.2. Regulatory Effect of Enterprise Digitization
The digitalization of enterprises (DGLR) can help managers obtain the information needed for decision-making at a faster speed and with better accuracy. The enterprise digitalization level (DGLR) indicator used in this article is obtained by comparing the proportion of intangible asset expenditures used for digitalization by enterprises in the current year to the total intangible asset expenditures of the year. This indicator is a positive indicator, with a higher value indicating deeper digitalization process of the enterprise. Table 9 presents an empirical analysis of the moderating effects of centralizing the explanatory variable managerial effectiveness (ME) and moderating variable enterprise digitization (DGLR). From column (2) of Table 9, it can be seen that the crossing product term (ME*DGLR) is significantly positive. That is, the digitalization of enterprises can help managers collect more and more accurate information, which can play an important auxiliary role in their decision-making.
Table 9.
The regulatory effect of enterprise digitization.
4.6.3. Threshold Regression
The quick ratio (Atr) is defined as the ratio of a company’s quick assets to its current liabilities, indicating its short-term debt repayment pressure. In comparison to long-term pressure, short-term debt pressure exerts a more significant influence on a company’s business decisions. Table 10 presents the empirical results of the threshold value test. The first row of Table 10 is a test for the single threshold of managerial effectiveness (ME), where the p-value is less than 1% and the F-value is much higher than Crit1’s 29.677. The threshold value is also within the descriptive statistical range. Conversely, the p-value of row (2) in Table 10 is 0.28, which is significantly greater than 0.1 and lacks statistical significance. This indicates that when the managerial effectiveness (ME) itself is used as the threshold value, a single threshold value of −0.528 exists. A similar outcome is observed when the quick ratio (Atr) is used as the threshold value, resulting in a single gate limit of 4.488.
Table 10.
Threshold value test.
Table 11 presents an empirical investigation of the threshold model. Columns (1) and (2) of Table 11 present empirical analyses conducted with managerial effectiveness (ME) as the threshold value. It is evident from the data presented in columns (1) and (2) of Table 11 that when managerial effectiveness (ME) exceeds the threshold of −0.528, there is a substantial increase in the impact of managerial effectiveness on green total factor productivity (GTFP). This is evidenced by a notable increase in the coefficient from 0.137 to 1.049. Columns (3) and (4) of Table 11 present empirical analyses conducted with the enterprise’s own quick ratio (Atr) as the threshold value. It is evident that upon the quick ratio (Atr) surpassing the threshold value of 4.488, there was a substantial decline in the enterprise’s debt pressure, accompanied by a notable attenuation in external perceptions concerning management decision-making. The enterprise was then able to allocate its resources towards projects requiring high short-term investment, such as improving green total factor productivity. The impact of managerial effectiveness (ME) on the green total factor productivity of enterprises has increased to a certain extent (the coefficient has increased from 0.584 to 1.865).
Table 11.
Threshold regression.
5. Conclusions and Suggestions
5.1. Conclusions
This study explored the impact of managerial effectiveness on the green total factor productivity (GTFP) of enterprises through theoretical analysis and empirical testing. Subsequently, a detailed analysis of the results was conducted, leading to the following conclusions:
(1) Managerial effectiveness enables the integration of resources, which not only increases the likelihood of securing funds but also reduces the cost of fund utilization. This, in turn, frees up more resources for projects that demand substantial investment but yield results gradually. Moreover, effective management can incorporate a long-term perspective into the company’s development strategy. Upon recognizing the trend of enhancing production efficiency and environmental protection across generations, they can proactively respond to this trend.
(2) Enterprise digitization represents a crucial strategy for enterprises to thrive in the Industry 4.0 era. The digitization process of enterprises has led to the establishment of an information collection, processing, and sharing platform. For management teams, digitization facilitates the timely and accurate acquisition of industry information and production status. This enables them to make more informed and precise decisions.
(3) The debt repayment pressure serves as a threshold. When the quick ratio surpasses this threshold, the debt burden on the enterprise is significantly reduced, and the influence of external scrutiny on enterprise management diminishes accordingly. As a result, enterprises have more liquid funds at their disposal and the confidence to engage in high-risk, long-term investment projects.
5.2. Countermeasures and Suggestions
Firstly, it is essential to improve the management evaluation framework to ensure a harmonious equilibrium between the short-term goals and long-term development of the enterprise. Major shareholders have the power to appoint and remove the company’s executives through the board of directors. The performance indicators set by the board of directors for executives are directly linked to their remuneration. Consequently, these performance indicators indirectly shape the strategic orientation of the company. Although traditional performance indicators, such as the return on assets, can indeed showcase the value of enterprises, it is important to acknowledge that intangible capabilities, like green total factor productivity (GTFP), can more accurately reflect the quality of an enterprise’s development. Building on traditional financial metrics, this study proposes the construction of a three-dimensional evaluation framework integrating green total factor productivity (GTFP), technological innovation investment intensity, and supply chain sustainability. Specifically, the framework includes two components: (1) convening a quarterly ESG-dedicated audit committee to verify the authenticity of GTFP data; and (2) establishing a dynamic performance-linked mechanism between executive compensation and GTFP improvement (e.g., a 5% increase in performance bonus for each 1% exceeding the GTFP target). The significance of a high quick ratio for the management team remains a topic that warrants further exploration. While the primary objective of enterprises is to maximize profits, and a high quick ratio can relieve debt pressure, it is equally crucial to address the issue of idle funds that often accompany it. Enterprises can leverage AI predictive models to analyze historical data, establish optimal cash holdings thresholds (e.g., covering three months of operational costs), and automatically allocate excess funds to green financial instruments such as carbon-neutral bonds.
Secondly, in line with the development trajectory of Industry 4.0, enterprises should proactively expedite their digital transformation processes. Management teams need to recognize the pivotal importance of the contemporary digital economy as a dominant development trend. Enterprise digitalization enables the systematic organization and comprehensive summarization of information related to production, operation, and the market. Through the analysis of modern information technology, this information can be visualized. As a result, it empowers management to increase the visibility of information, deepen the level of information mining, and enhance the efficiency of enterprise decision-making. Nevertheless, it is important to note that enterprise digitalization represents a substantial investment initiative. When initially implemented, it will, to some degree, disrupt the existing production order. Hence, enterprises are recommended to formulate a well-thought-out plan and gradually advance the digitalization process.
Thirdly, based on Dongtai City’s “Intelligent Transformation, Digital Transformation, and Network Connection” Three-Year Action Plan, the following implementation framework is proposed: (1) Infrastructure Layer (Year 1): Establish a Master Data Management Platform (MDM) to unify the coding systems for materials, customers, and suppliers. This foundational layer ensures data consistency across organizational boundaries, eliminating silos and providing a reliable data backbone for subsequent phases; (2) Data Middle Platform Layer (Year 2): Develop a supply chain digital twin model to achieve real-time, visual monitoring of order fulfillment cycles. By creating a virtual replica of physical supply chain processes, this layer enables predictive analytics, anomaly detection, and agile decision-making, enhancing end-to-end visibility and operational efficiency; and (3) Application Innovation Layer (Year 3): Introduce machine learning algorithms to optimize production scheduling. The goal is to increase the capacity utilization rate to over 85% by dynamically adjusting workflows, reducing downtime, and balancing resource allocation. This layer leverages advanced analytics to drive transformative improvements in productivity and cost-effectiveness.
5.3. Limitations and Future Research Directions
This study provides insights into the impact of managerial effectiveness and digitalization on green total factor productivity in China’s listed heavy-polluting enterprises, but it has several limitations that warrant attention. The study focuses on a single country (China), limiting cross-country comparability. Institutional contexts, such as legal systems, market maturity, and environmental governance models, vary significantly across nations. Investigating whether the observed relationships hold in other emerging or developed economies could enhance the theoretical generalizability of the findings. In addition, due to the decline in production capacity in the post-pandemic era and the instability of supply and sales in the era of prevalent malicious tariffs, significant impacts have been exerted on the stable development of the economy. We thus focused our research on the pre-pandemic period. After global political and economic stability is restored, scholars may consider incorporating new samples.
Author Contributions
J.Y. conceived the topic, combed the relevant literature, and revised the paper. Z.Z. collected and collated the data, conducted quantitative analysis, and wrote the first draft. J.Y. and Z.Z. organized the data and proofread the text. All authors have read and agreed to the published version of the manuscript.
Funding
This research received no external funding.
Institutional Review Board Statement
Not applicable.
Informed Consent Statement
Not applicable.
Data Availability Statement
Data and materials are available from the authors on request.
Conflicts of Interest
The authors declare that they have no known competing financial interests or personal relationships that could have appeared to influence the work reported in this paper.
References
- Yan, D.; Wang, C.; Sun, T.; Wen, D. The Impact of Service Experience on Sustainable Customer Engagement: The Mediation of Green Perceived Value and Customer Satisfaction. Corp. Soc. Responsib. Environ. Manag. 2024, 31, 2175–2194. [Google Scholar] [CrossRef]
- Wang, C.; Zhang, Y. Does environmental investment improve corporate productivity? Evidence from Chinese listed firms. Struct. Change Econ. Dyn. 2024, 70, 398–409. [Google Scholar] [CrossRef]
- Niu, H.Y.; Zhao, X.F.; Luo, Z.L.; Gong, Y.X.; Zhang, X.H. Green credit and enterprise green operation: Based on the perspective of enterprise green transformation. Front. Psychol. 2022, 13, 1041798. [Google Scholar] [CrossRef] [PubMed]
- Tian, M.; Chen, Y.; Tian, G.; Huang, W.; Hu, C. The role of digital transformation practices in the operations improvement in manufacturing firms: A practice–based view. Int. J. Prod. Econ. 2023, 262, 108929. [Google Scholar] [CrossRef]
- Da, Y.; Luo, D. Digital economy, structural dividends, and green total factor productivity. J. Southwest Minzu Univ. 2023, 44, 107–118. [Google Scholar] [CrossRef]
- Chung, Y.; Fare, R. Productivity and undesirable outputs: A directional distance function approach. J. Environ. Manag. 1997, 51, 229–240. [Google Scholar] [CrossRef]
- Tone, K. A slacks-based measure of efficiency in data envelopment analysis. Eur. J. Oper. Res. 2001, 130, 498–509. [Google Scholar] [CrossRef]
- Chen, G. Data Envelopment Analysis and MaxDEA; Intellectual Property Publishing House: Beijing, China, 2014. [Google Scholar]
- Wang, H.; Zhang, Y.; Liu, Z.; Liu, R.; Li, K. The impact and mechanisms of the Shanghai pilot free-trade zone on the green total factor productivity of the Yangtze River Delta Urban Agglomeration. Environ. Sci. Pollut. Res. 2022, 29, 40997–41011. [Google Scholar] [CrossRef] [PubMed]
- Wu, J.; Xia, Q.; Li, Z.Y. Green innovation and enterprise green total factor productivity at a micro level: A perspective of technical distance. J. Clean. Prod. 2022, 344, 131070. [Google Scholar] [CrossRef]
- Tong, L.; Chiappetta Jabbour, C.J.; Belgacem, S.B.; Najam, H.; Abbas, J. Role of environmental regulations, green finance, and investment in green technologies in green total factor productivity: Empirical evidence from Asian region. J. Clean. Prod. 2022, 380 Pt 2, 134930. [Google Scholar] [CrossRef]
- Wang, J.; Liu, Y.; Wang, W.; Wu, H. How does digital transformation drive green total factor productivity? Evidence from Chinese listed enterprises. J. Clean. Prod. 2023, 406, 136954. [Google Scholar] [CrossRef]
- Wen, H.-X.; Cui, T.; Wu, X.-Q.; Nie, P.-Y. Environmental insurance and green productivity: Afirm-level evidence from China. J. Clean. Prod. 2024, 435, P140482. [Google Scholar] [CrossRef]
- Di, K.; Xu, R.; Liu, Z.; Liu, R. How do enterprises’ green collaborative innovation network locations affect their green total factor productivity? Empirical analysis based on social network analysis. J. Clean. Prod. 2024, 438, 140766. [Google Scholar] [CrossRef]
- Halbert, L.; Henneberry, J.; Mouzakis, F. Finance, business property and urban and regional development. Reg. Stud. 2014, 48, 421–424. [Google Scholar] [CrossRef]
- Zhang, Y.; Xing, T.; Chen, G. The path of financial development affecting green total factor productivity—Efficiency channel and technology channel. Financ. Forum 2022, 27, 16–24+54. [Google Scholar] [CrossRef]
- Xiang, D.; Zhang, Y.; Worthington, A.C. Determinants of the use of fintech finance among Chinese small and medium–sized enterprises. In Proceedings of the 2018 IEEE International Symposium on Innovation and Entrepreneurship (TEMS–ISIE), Beijing, China, 30 March–1 April 2018; pp. 1–10. [Google Scholar] [CrossRef]
- Tian, Z.; Si, H.; Ren, Y.; Mao, C. Under the “dual carbon” target, the transformation and upgrading of industries and the improvement of green total factor productivity in the three major river basins. Contemp. Econ. Res. 2023, 4, 100–114. [Google Scholar]
- Li, C.; Xia, W.; Wang, L. The transfer mechanism of pollution industry in China under multi-factor combination model—Based on the perspective of industry, location, and environment. Environ. Sci. Pollut. Res. 2021, 28, 60167–60181. [Google Scholar] [CrossRef] [PubMed]
- Sun, Y.; Liu, Z.; Liu, Y.; Bian, P. Research on the impact of new energy demonstration city construction on green total factor productivity. Macroecon. Res. 2022, 134–146. [Google Scholar] [CrossRef]
- Zhao, L.; Chen, L. Research on the impact of government environmental information disclosure on green total factor productivity: Empirical experience from Chinese provinces. Int. J. Environ. Res. Public Health 2022, 19, 729. [Google Scholar] [CrossRef] [PubMed]
- Mao, K.; Failler, P. Local government debt and green total factor productivity—Empirical evidence from Chinese cities. Int. J. Environ. Res. Public Health 2022, 19, 12425. [Google Scholar] [CrossRef] [PubMed]
- Song, Y.; Zhang, B.; Wang, J.; Kwek, K. The impact of climate change on China’s agricultural green total factor productivity. Technol. Forecast. Soc. Change 2022, 185, 122054. [Google Scholar] [CrossRef]
- Xie, D.; Hu, S. Green finance, industrial structure and urban industrial green total factor productivity. Stud. Int. Financ. 2023, 46–56. [Google Scholar] [CrossRef]
- Zhang, J.; Wang, B. Development of digital economy and improvement of green total factor productivity. J. Audit Econ. 2023, 107–115. [Google Scholar]
- Heubeck, T.; Ahrens, A. Sustainable by ideology? The influence of CEO political ideology and Ivy League education on ESG (environmental, social, and governance) performance. Bus. Strategy Environ. 2025, 34, 4785–4810. [Google Scholar] [CrossRef]
- Hu, G.; Xiao, Z. Stock mispricing, managerial shareholdings and firms’ R&D investment—Empirical evidence from China’s high-tech listed firms. Collect. Essays Financ. Econ. 2018, 34, 58–68. [Google Scholar] [CrossRef]
- Wang, S.; Wang, B. Independent director system, corporate governance, and governance culture of state-owned enterprises. Soc. Sci. Front 2022, 101–112. [Google Scholar]
- Hu, H.; Bai, Z.; Wang, A. A study on the influence of management overconfidence on company’s illegal behavior. Econ. Surv. 2022, 39, 89–98. [Google Scholar] [CrossRef]
- Wang, Z.; Tan, H. Research on the impact of board faultlines on the high-quality development of enterprises. China Soft Sci. 2023, 134–146. [Google Scholar]
- Pu, G.; Xie, Y.; Wang, K. Board faultlines and risk-taking. Financ. Res. Lett. 2023, 51, 103404. [Google Scholar] [CrossRef]
- Fu, J.; Yang, J.; Xia, Y.; Mo, Y. Managerial ability and enterprise strategic risk taking: “March forward” or “shrink back”? Collect. Essays Financ. Econ. 2022, 38, 69–79. [Google Scholar] [CrossRef]
- Zhang, C.; Liu, X. Heterogeneous pay equity preference of different female managers—Based on the comparison of directors and supervisors. China Soft Sci. 2022, S1, 193–203. [Google Scholar]
- Fan, Q.; Qiu, J. Does the social network of independent directors affect company performance forecasts? Based on the perspective of opportunistic governance by management. Financ. Account. Mon. 2023, 44, 84–93. [Google Scholar] [CrossRef]
- Demerjian, P.; Lev, B.; McVay, S. Quantifying managerial ability: A new measure and validity tests. Manag. Sci. 2012, 58, 1229–1248. [Google Scholar] [CrossRef]
- Zhao, Z.; Yan, J. The impact of investor sentiment on firms’ green total factor productivity—Facilitator or inhibitor? Environ. Sci. Pollut. Res. 2023, 30, 70303–70314. [Google Scholar] [CrossRef] [PubMed]
- Hua, J.; Jiang, Z.; Lang, Y. Managerial ability, internal control and markups of enterprises. Econ. Probl. 2022, 123–129. [Google Scholar] [CrossRef]
- Barzegar, R.; Martin, B.; Fleming, G.; Jatana, V.; Popat, H. Implementation of the ‘picnic’ handover huddle: A quality improvement project to improve the transition of infants between paediatric and neonatal intensive care units. J. Paediatr. Child Health 2022, 58, 2016–2022. [Google Scholar] [CrossRef] [PubMed]
- Chen, H.; Yoon, S.S. Does technology innovation in finance alleviate financing constraints and reduce debt-financing costs? Evidence from China. Asia Pac. Bus. Rev. 2022, 28, 467–492. [Google Scholar] [CrossRef]
- Li, J. Analysis on the relationship between financing constraints and research and development from the perspective of the location of top management network. Discret. Dyn. Nat. Soc. 2022, 2022, 8690801. [Google Scholar] [CrossRef]
- Scherer, J.; Biemans, W.G. Unite and conquer–end-to-end value creation through intra-organizational purchasing-sales integration. Ind. Mark. Manag. 2025, 126, 236–250. [Google Scholar] [CrossRef]
- Chen, Y.; Xu, S.; Lyulyov, O.; Pimonenko, T. China’s digital economy development: Incentives and challenges. Technol. Econ. Dev. Econ. 2023, 29, 518–538. [Google Scholar] [CrossRef]
- Zarte, M.; Pechmann, A.; Nunes, I.L. Knowledge framework for production planning and controlling considering sustainability aspects in smart factories. J. Clean. Prod. 2022, 363, 132283. [Google Scholar] [CrossRef]
- Beaulieu, M.; Bentahar, O. Digitalization of the healthcare supply chain: A roadmap to generate benefits and effectively support healthcare delivery. Technol. Forecast. Soc. Change 2021, 167, 120717. [Google Scholar] [CrossRef]
- Guan, K.; Zhu, H. Capital market liberalization and corporate leverage manipulation: Empirical evidence from the Shanghai-Hong Kong and Shenzhen-Hong Kong stock connect. World Econ. Stud. 2023, 4, 73–86+135. [Google Scholar] [CrossRef]
- Kini, O.; Shenoy, J.; Subramaniam, V. Impact of financial leverage on the incidence and severity of product failures: Evidence from product recalls. Rev. Financ. Stud. 2017, 30, 1790–1829. [Google Scholar] [CrossRef]
- Shen, G.; Zhang, Y.; Wang, R. Structural tax reduction and corporate deleveraging. J. Financ. Res. 2018, 105–122. [Google Scholar]
- de Melo, G.A.; Peixoto, M.G.M.; Barbosa, S.B.; Alves, A.J.S.; Souza, A.C.L.; Mendonça, M.C.A.; de Castro Júnior, L.G.; Santos, P.G.D.; Serrano, A.L.M. Generating insights to improve the performance of communities supported agriculture: An analysis focused on female participation, governance structure and volume of food distributed. Environ. Dev. Sustain. 2024. [Google Scholar] [CrossRef]
- Hadlock, C.J.; Pierce, J.R. New evidence on measuring financial constraints: Moving beyond the KZ index. Rev. Financ. Stud. 2010, 23, 1909–1940. [Google Scholar] [CrossRef]
- Young, A. The tyranny of numbers: Confronting the statistical realities of the East Asian growth experience. Q. J. Econ. 1995, 110, 641–680. [Google Scholar] [CrossRef]
- Chambers, R.G.; Chung, Y.; Färe, R. Benefit and distance functions. J. Econ. Theory 1996, 70, 407–419. [Google Scholar] [CrossRef]
- Fukuyama, H.; Weber, W.L. A directional slacks-based measure of technical inefficiency. Socio-Econ. Plan. Sci. 2009, 43, 274–287. [Google Scholar] [CrossRef]
- Wang, P.; Huang, S.; Yang, Z.; Guo, F. The impact of environmental protection tax on corporate green total factor productivity. Tax. Res. 2022, 11, 66–73. [Google Scholar] [CrossRef]
- Certo, S.T.; Busenbark, J.R.; Woo, H.; Semadeni, M. Sample selection bias and Heckman models in strategic management research. Strateg. Manag. J. 2016, 37, 2639–2657. [Google Scholar] [CrossRef]
- Xiao, J.; Peng, J.; Cheng, S. Factor market distortion, capital favoritism, and total factor productivity of energy enterprises. Manag. Rev. 2023, 35, 27–41. [Google Scholar] [CrossRef]
- Wen, Z.; Ye, B. Mediation effect analysis: Methods and model development. Adv. Psychol. Sci. 2014, 22, 731–745. [Google Scholar] [CrossRef]
- Song, J.; Chen, L.; Ye, T. Managerial ability and corporate digital transformation: Enabling innovation under performance shortfalls. Mod. Financ. Econ. 2023, 43, 23–39. [Google Scholar] [CrossRef]
- Sribney, W.; Wiggins, V.; Drucker, D. Negative and missing R-squared for 2SLS/IV. Stata J. 2005, 5, 561–571. [Google Scholar]
- Li, F. Endogeneity in CEO power: A survey and experiment. Invest. Anal. J. 2016, 45, 149–162. [Google Scholar] [CrossRef]
- Zhao, Z.; Wang, P. The impact of managerial competence on corporate carbon performance: An empirical study based on Chinese heavy polluters. Front. Energy Res. 2023, 11, 1130339. [Google Scholar] [CrossRef]
Disclaimer/Publisher’s Note: The statements, opinions and data contained in all publications are solely those of the individual author(s) and contributor(s) and not of MDPI and/or the editor(s). MDPI and/or the editor(s) disclaim responsibility for any injury to people or property resulting from any ideas, methods, instructions or products referred to in the content. |
© 2025 by the authors. Licensee MDPI, Basel, Switzerland. This article is an open access article distributed under the terms and conditions of the Creative Commons Attribution (CC BY) license (https://creativecommons.org/licenses/by/4.0/).