Abstract
Tourism management in coastal destinations is vital to guide activity towards sustainable practices that ensure lower social and environmental impacts with greater benefits for the local community and experiences for tourists, especially in mature destinations where the main product is the beach. The aim of this research is to calculate the Tourist Carrying Capacity (TCC) of a stretch of beach in Mazatlán, Mexico, under past, present, and future scenarios, under different intensities of use. The main findings indicate that by 2025 the Effective Carrying Capacity (ECC) is 19,644, 29,822, and 4911 users with intensive, medium, and low occupancy levels, respectively. A decrease of −30.63% was found between the Effective Carrying Capacity of the 2025 scenario with respect to 2005 and a decrease of −68.90% is predicted for the year 2050 with respect to the current one, indicating an accelerated trend in the decrease of physical space and, therefore, greater pressure on the coastal ecosystem in case the trend of tourists goes upward, without being sustainably managed. These results are useful for agencies involved in beach and tourism management in mature coastal destinations.
1. Introduction
Tourism remains one of the most significant economic activities in contemporary society due to its substantial contribution to the social and economic development of regions. However, alongside its benefits, tourism can also generate adverse impacts, particularly when not managed efficiently under principles of sustainability. This concern becomes especially pressing in mature tourist destinations, where sustained visitor flows exert considerable pressure on local natural resources, infrastructure, and public services. Over time, such pressures may drive destinations toward a phase of decline within their tourism area life cycle, as noted by Butler [1].
Among various types of destinations, sun-and-sea locations have played a pivotal role in global tourism expansion. These destinations originated in the mid-19th century in Northern Europe, with Atlantic City emerging as the first planned beach resort in North America [2,3]. During the mid-20th century, second-generation destinations along the coasts of Spain and Latin America emerged, often following Fordist mass tourism models [2], later evolving into third-generation destinations focused on luxury infrastructure and market segmentation [1,4].
Despite this evolution in development models and sophistication planning, many beach destinations have struggled to ensure the sustainable management of natural resources. Numerous studies have documented the socio-cultural and environmental consequences of unregulated tourism growth. In response, the concept of Tourist Carrying Capacity (TCC) has gained increasing relevance as a planning tool to define the maximum number of visitors that a destination can accommodate without incurring adverse effects or undermining visitor satisfaction [4]. This concept is particularly valuable in sun-and-sea destinations, which currently represent a large share of global tourist flows. According to the UNWTO, international tourist arrivals reached 1.3 billion in 2023, with approximately 40% directed to coastal destinations [5].
The recent literature has expanded the methodological scope of TCC estimation, incorporating environmental, physiological, legal, and technological dimensions [6,7,8,9,10,11]. While some of these approaches rely on real-time monitoring using advanced technologies [11], their applicability in emerging economies remains limited. Furthermore, there is a growing recognition that the inclusion of social dimensions—such as resident and tourist satisfaction—can significantly enhance the relevance of TCC assessments for achieving a sustainable balance between destination competitiveness and ecological integrity [12,13,14]. However, studies with longitudinal and localized evidence in mature destination contexts under different intensities of use remain underexplored.
A recurrent finding across case studies is that many beaches, particularly in mature coastal destinations, are currently used beyond their estimated carrying capacity [15,16,17]. Overcrowding leads not only to environmental degradation but also to declining visitor satisfaction and diminished economic benefits for local communities.
In Mexico, for example, coastal tourism has seen a strong post-pandemic recovery. In 2023, approximately 40 million international tourists visited the country, 60% of whom chose beach destinations [18]. While over 30 beaches have adopted sustainable practices and some have earned Blue Flag certification, challenges persist—particularly during peak seasons when overcrowding strains physical and social carrying limits [9,10].
Mazatlán, one of Mexico’s top five beach destinations (see Figure 1 for Mazatlán’s geographic location), exemplifies this situation. With over 20 km of coastline and nearly 2.5 million tourists in 2023—60% of them from the United States and Canada—beach use in Mazatlán has intensified, particularly during winter and spring [18,19]. This raises an important question for sustainable tourism planning in this destination: How does the Tourist Carrying Capacity of a Mazatlán’s beach change across past, present, and future scenarios under varying intensities of use and what are the potential implications for sustainable coastal tourism management?
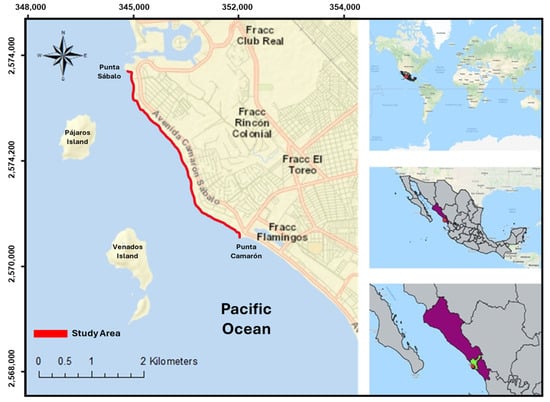
Figure 1.
Geographic location of Mazatlán, Sinaloa, Mexico (own elaboration).
The aim of this research is to calculate the Tourist Carrying Capacity (TCC) of the beach stretch between Punta Camarón and Punta Sábalo in Mazatlán, Mexico, under three scenarios—past (2005), present (2025), and future (2050)—considering different intensities of use.
The contribution of this research offers a novel insight to the existing literature by providing a longitudinal, scenario-based TCC estimation in a mature beach destination—an approach that remains underexplored. This study’s data-driven insights are intended to support decision-making processes for coastal tourism planning, particularly in destinations facing growing visitor pressure and ecosystem vulnerability.
2. Materials and Methods
The methodology used in this study to assess the Tourist Carrying Capacity (TCC) is based on the model proposed by Cifuentes [12,13], with specific adaptations drawn from Rodrguez [20]. This methodological framework involves the estimation of three successive levels of carrying capacity: Physical Carrying Capacity (PCC), Real Carrying Capacity (RCC), and Effective Carrying Capacity (ECC).
Each of these levels is interrelated according to the formulation presented by Cifuentes [13], as detailed below:
PCC ≥ RCC ≥ ECC
Physical Carrying Capacity (PCC).
Physical Carrying Capacity is the maximum limit of visits that can be made to the site during a day. It is given by the relationship between visitation factors (visiting hours and visiting time), available space, and space requirements per visitor. The following formula is used to calculate the Physical Carrying Capacity:
PCC = S/sp × NV
S = Available area, in square meters.
sp = Area used per person for beach activities.
NV = Number of times the site can be visited by the same person in a day.
In Prieto’s [21] research work, it is mentioned that there are several opinions on the optimal surface area per beach user, the area specified by the United Nations World Tourism Organization (UNWTO) [22] for recreational activities in public spaces under normal conditions is 4 m2/user, Botero [23] in his publication uses 10 m2/user due to the pandemic of Covit 19 and Roig [24] uses 15 m2/user for sustainability reasons. In addition, Ortega [25] presents in his research three occupancy criteria: intensive 5 m2/user, medium 10 m2/user and low 25 m2/user, values far removed from those of the UNWTO.
In the present research project, considering past, present, and future scenarios and the authors, the data shown in Table 1 are used.

Table 1.
Criteria for beach user surfaces by scenario.
To obtain the number of times the site can be visited by the same person in a day (NV) we use the following formula:
Hv = Visiting hours.
Tv = Time needed to visit the attraction.
The total time the area is open, and the time needed to visit the site were not considered for the carrying capacity calculations because these variables are appropriate for other tourist attractions that have an established schedule, but not for recreational activities on the beaches. On the beaches and in the coastal zone, it is impossible to control the entry and length of stay of tourists. Therefore, the simplified formula is used:
S = total surface of the visited area.
sp = area occupied by each visitor.
2.1. Real Carrying Capacity (RCC)
Real Carrying Capacity is the maximum limit of visits, determined from the PCC of a site, after subjecting it to correction factors defined according to the characteristics of the site. The general formula for the correction factors is:
where:
Cfx = Correction factor for variable “X”.
Mlx = Limiting magnitude of variable “X”.
Mtx = Total magnitude of variable “X” (Total of the area to be evaluated).
To obtain the correction factor, the environmental and social aspects were considered with some modifications made by Rodríguez [20]. Since the methodology of Cifuentes [12,13] does not specify how they are selected for each tourist attraction in the area, in this methodological proposal, the following factors were selected as those that apply directly to the area under study:
2.1.1. Environmental Category
The environmental category includes physical and ecological variables that influence the sustainability and resilience of coastal areas. These factors are essential for determining the potential impact of tourism activities on the natural environment and play a critical role in estimating the RCC. One of the most relevant environmental variables in this context is the erodibility of the beach area.
Erodibility
Refers to the degree to which a specific site is prone to erosion, which can be influenced by both natural and anthropogenic factors. In this study, two main variables are considered to assess erodibility: the slope of the terrain and the soil texture. These variables are used to estimate the vulnerability of the site to erosion processes that could compromise its physical integrity and long-term sustainability.
The classification criteria and corresponding values used to determine the erodibility factor are presented in Table 2.
Table 2.
Slope ranges and soil types to obtain erodibility.
Now, the combinations of slope ranges with soil types generate three levels of erosion risk, low, medium, and high, as shown in Table 3.
Table 3.
Erosion risk due to soil type and slope.
Subsequently, the sum of the sectors or surfaces (lengths) of those with medium and high susceptibility must be added up and then the value obtained is used to replace it in the general formula, where the value is related to the surface available for visitors and the correction factor is obtained as a percentage, multiplying the result by 100. It is recommended that when the slope is less than 10%, the correction value is taken as zero.
Accessibility
Is the degree of difficulty for a person to move freely on the slopes of the site. Terrain with slopes of less than 10% are of low difficulty, slopes of 10–20% are of medium difficulty, and slopes greater than 20% are of high difficulty.
For its calculation, the medium and high difficulty sectors are added together to replace this value in the general formula and obtain the percentage of the accessibility correction factor.
Precipitation
Is a factor that makes it impossible to visit the recreation area, due to the unwillingness of visitors to stay in a place in the rain. The following expression is used to calculate it:
Solar Brightness
Is the total hours of sunshine that, due to its strong radiation, affects the stay of users during their visit to the recreation area. It is obtained by the following expression:
Disturbance to Wildlife
The life cycle stages of the potentially affected species present in the area are recorded and the following formula is used:
Disturbance to Flora
The types of vegetation in the area are recognized and the meters corresponding requiring greater protection and importance are determined. If there is not on the site, the correction value is taken as zero.
2.1.2. Social Category
Temporary Site Closures
The hours the site is temporarily closed or restricted for maintenance, management, and/or administrative purposes are accounted for.
Tourist Satisfaction
Is obtained by means of a five-point Likert scale evaluation, in which 125 tourists were surveyed. This is a representative sample with a 90% confidence level and a 7% of error rate. Of the total respondents, 45% were surveyed during peak season and 55% during the low season, specifically in the months of April and May 2025, respectively.
The respondents indicate how satisfied they were with fourteen items corresponding to four dimensions of the beach area, which are cleanliness, infrastructure, equipment, and safety (see Table 4). The scale used was: 1 = Not at all satisfied, 2 = Not very satisfied, 3 = Somewhat satisfied, 4 = Satisfied, 5 = Completely satisfied. These items were taken from a previous study that analyzes the adaptation of beaches in this destination based on the Mexican standard NMX-AA-120-SCFI-2016 [26] and Blue Flag [27], which evaluate the quality and sustainability of beaches [28,29,30].
Table 4.
Items for assessing tourist satisfaction.
Resident Satisfaction
Is obtained by applying the survey from the previous point (Table 4). A total of 117 residents were surveyed using a simple random sampling method, with a 95% confidence level and a 10% margin of error. Of the total respondents, 19% were surveyed during the peak season and 81% during the low season, specifically in the months of April and May 2025, respectively. The same scale was used: 1 = Not at all satisfied, 2 = Not very satisfied, 3 = Somewhat satisfied, 4 = Satisfied, 5 = Totally satisfied. At the end, a total average of the percentage of all the items is obtained, thus being the value of the resident’s satisfaction correction factor.
Once all the calculations of the correction factors selected in each category are available, the Analytic Hierarchy Process (AHP) [31] is used to calculate the priority of each of the elements being compared, in this case the correction factors Then, when the results of the correction factors for each category are available, the Analytical Hierarchical Process (AHP) is carried out to weight the weights of the factors. This methodology, known as AHP, solves complex problems with multiple criteria through the support of experts in the field [31]. A matrix of paired comparisons is first elaborated, where what is called the priority of each of the elements being compared, in this case of the correction factors, is calculated. This is a square matrix in which the variables are placed in a row and a column. The elements of A correspond to a value of comparative relevance between variables, according to the scale shown in Table 5.
Table 5.
Scale of comparative relevance.
Then, with the hierarchy well defined and the relevance scale (Table 5), the expert should make pairwise comparisons at each level of the matrix hierarchy. These comparisons reflect the expert’s perception of the relative contributions (weights) of the two indicators to the total objective. Each cross-cell represents the preference for the alternative in each row when compared to each column. When the values are equal, the number 1 should be written because the alternative is being compared with itself. A matrix should be made for each expert for each category (environmental and social) as shown in Table 6. To synthesize the data of the correction factors, comparisons are made by pairs of sub-indicators, first asking the question “Which of the two is the most important” and second “By how much?
Table 6.
Matrix of paired comparisons of weights of three indicators.
Once the matrices are constructed, the expert judgments are synthesized through the following steps: first, the values in each column of the comparison matrix are summed. Second, each element in the matrix is divided by the corresponding column total, resulting in a normalized matrix. Third, the values corresponding to each correction factor are summed across rows, and their average is calculated to determine the relative weight. Fourth, the averages obtained from the experts in each category are aggregated.
With this information, the resulting percentages are multiplied by the corresponding weights of the correction factors. The sum of these weighted values for each category is referred to as the adjusted correction factor. Finally, the total correction factor is obtained by multiplying the adjusted correction factors of the two categories.
Then, the obtained value is replaced in the following formula to find the value of the Real Carrying Capacity:
2.2. Management Capacity (MC)
Optimal management capacity is defined as the best state or conditions that the administration of an area should have to develop its activities and achieve its objectives [12,13,29]. It is analyzed by means of the satisfaction of the actors involved in the administration and operation of the beaches, on four dimensions: cleanliness, infrastructure, equipment and safety [13,29]. The scale used is: 1 = Not at all satisfied, 2 = Not very satisfied, 3 = Somewhat satisfied, 4 = Satisfied, 5 = Completely satisfied. The survey data are shown in Table 7.
Table 7.
Items to evaluate management capacity.
2.3. Effective Carrying Capacity (ECC)
This refers to the maximum number of people that can stay on the beaches in the study area. The following formula is used to calculate the Effective Carrying Capacity:
RCC = Real Carrying Capacity.
MC = Management capacity.
3. Results
This section presents the results of the carrying capacity calculations under three temporal scenarios: 2005 (past), 2025 (present), and 2050 (projected). The methodology was applied to the coastal stretch from Punta Camarón to Punta Sábalo in Mazatlán, Mexico, following the adapted framework proposed by Cifuentes [12,13] and Rodríguez [20]. The results are organized according to the three levels of carrying capacity: PCC, RCC, and ECC.
3.1. Physical Carrying Capacity
The results of the surface calculation shown in Table 8 were obtained for the 2005 scenario, with satellite images downloaded from Google Earth Pro software 7.6.3 [32]; for the 2025 scenario, a photogrammetric survey was performed with a DJI AIR 2S UAV (Unmanned Aerial Vehicle) (see Figure 2). The UAV flight missions were planned and executed with the Dronelink 5.2.0 application [33]. The images obtained were captured at an altitude of 100 m at double grid, with a ground sample distance of 2.84 cm/pixel, frontal overlap of 75% and lateral overlap of 70%, maximum speed of 16 km/hr. (see Figure 3). Photogrammetric processing was performed using the software Pix4D 4.10.0 [34]. The Pix4D application is software for processing images that are obtained using UAVs and mobile devices. It uses state-of-the-art algorithms and sophisticated photogrammetric processing techniques (see Table 9), generates point clouds, digital surface models and orthomosaics (see Figure 4). The surface was obtained with QGIS software 3.20 [35] Figure 5. Finally, to determine the beach area for the 2050 scenario, a linear model was used and the trend line was calculated based on Intergovernmental Panel on Climate Change (IPCC) predictions of land loss due to sea level rise [36] (see Figure 6).
Table 8.
Beach user areas by scenario.

Figure 2.
DJI’s UAV (unmanned aerial vehicle) AIR 2S with CMOS sensor camera installed, 20 megapixel 2.4-micron resolution, 22 mm wide angle lens, f/2.8 aperture.
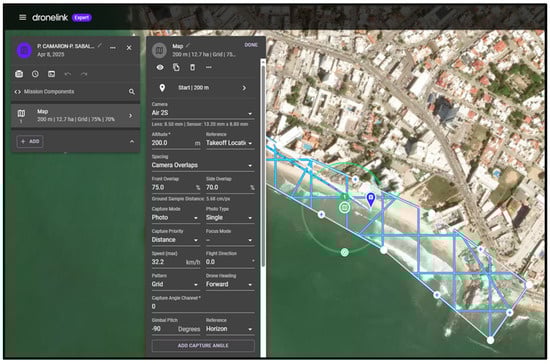
Figure 3.
Dronelink 5.2.0 application interface. On the left side, there are two black drop-down lists that provide information about the unmanned aerial vehicle’s flight plan, such as the UAV’s make and model, altitude, speed, and mesh type (single or double). On the right side, marked with blue lines, is part of the study area selected to execute the planned flight mission.
Table 9.
Photogrammetric processing of PIX4D 4.10.0 software.

Figure 4.
Products obtained from Pix4D software. In (a) in the upper part the dense point cloud of the capture of the UAV camera (in red the points), (b) the DSM (Digital Surface Model), (c) the orthomosaic of a part of the section of the study area and (d) 3D view of the orthomosaic and placement of the UAV for the capture of the georeferenced images.
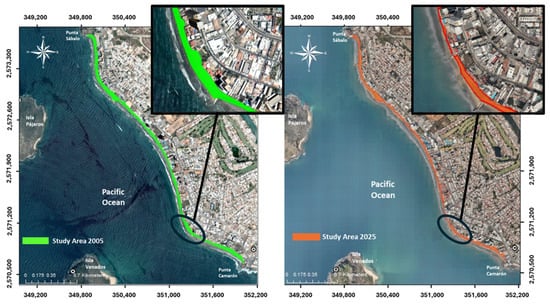
Figure 5.
Beach area for the 2005 scenarios on the left and 2025 scenarios on the right, obtained using QGIS software. An enlargement is shown for each scenario, comparing and showing the loss of surface area for a section of the entire study area of the Punta Camarón-Punta Sábalo segment.

Figure 6.
Trend line of beach area loss by 2050 for the P. Camarón-P. Sábalo beach section. Sábalo.
Applying Formula (4), we obtain the CCF for the proposed scenarios and the results are shown in Table 10 and plotted in Figure 7.
Table 10.
Physical Carrying Capacity by scenario.

Figure 7.
Comparison of Physical Carrying Capacity by use criteria for the 2005, 2025, and 2050 scenarios.
3.2. Real Carrying Capacity
The Real Carrying Capacity (RCC) refers to the capacity of a given area to accommodate visitors, considering environmental, physical, social, and management-related limitations. It is obtained by applying a series of correction factors to the Physical Carrying Capacity (PCC), which account for conditions that may reduce the usable space and time for tourism activities. The RCC provides a more realistic estimate by adjusting for factors that affect the safe and sustainable use of the area under study.
The present study classifies correction factors into two main categories: environmental and management. The following subsections describe the variables considered under each category, the methodology used for their assessment, and the resulting values.
3.2.1. Environmental Category
This category includes natural and ecological variables that may restrict the full use of the beach area. These factors directly affect the safety and comfort of tourists, as well as the integrity of the ecosystem. The environmental correction factors considered in this study include erodibility, tides, wind, and solar radiation.
Erodibility
To evaluate the erodibility of the beach segment from Punta Camarón to Punta Sábalo, an in situ topographic profile survey was conducted using a leveling instrument to determine the average slope of the terrain. The resulting average slope was 5.89%, which is below the 10% threshold commonly used as a reference for high-risk erosion zones.
According to the methodological framework established by Cifuentes [13], a slope below 10% indicates minimal erosion risk; therefore, the correction factor for erodibility is assigned a value of zero. This adjustment is applied using Equation (6), which accounts for the reduction in usable area based on environmental limitations.
Accessibility
As in the previous point, when the slope is less than 10%, the correction value is taken as zero. The slope on the beaches of Mazatlán 5.89%; therefore, the value is taken as zero to apply it to the Formula (7), then:
Precipitation
The rainy season starts in July and ends in October. July, August, September, and October (4 months) are the months with the highest rainfall with 183.5, 247.9, 268.9, and 229.0 mm respectively according to information obtained from the National Meteorological Service (SMN) of the National Water Commission (CONAGUA) [14]. Applying Formula (8):
Solar Brightness
The maximum annual temperatures in Mazatlán occur from May to October (184 days), ranging from 32 °C to 39.5 °C from 12 pm to 3:30 pm [14]. With Formula (9), we obtain:
Disturbance to Wildlife
The species that is affected on Mazatlán’s beaches is the olive ridley turtle (Lepidochelys olivacea). Its nesting season is from July to November (5 months) on the beaches of Mazatlán. The disturbance factor is calculated using Formula (10):
Disturbance to Flora
There are no flora on Mazatlán’s beaches that is endangered by the tourism sector, so it is considered zero. Applying the Formula (11) we obtain:
3.2.2. Social Category
The social category encompasses factors related to human interaction, behavior, and public policy that may influence the accessibility and usability of beach areas for tourism. These factors include periodic restrictions on access, safety concerns, or specific regulations that may limit visitor presence during certain times of the year. The application of these correction factors allows for a more accurate estimation of the Real Carrying Capacity (RCC), particularly in destinations where social dynamics significantly affect tourism operations.
Temporary Site Closures
In the case of Mazatlán, the beaches are accessible to the public throughout the year without scheduled or seasonal closures. As a result, there are no periods during which access is restricted due to administrative, cultural, or environmental reasons. Therefore, the correction factor associated with temporary site closures is zero. This value is applied in accordance with Equation (12), which adjusts the Real Carrying Capacity by accounting for the proportion of time a site is unavailable for tourism use.
Tourist Satisfaction
The following are the results (Table 11) of the survey applied to tourists on the Punta Camarón-Punta Sábalo stretch of beach. A total of 125 responses were obtained from tourists using the beaches, a sample with a 90% confidence level and a 7% error rate.
Table 11.
Results of the tourist satisfaction survey.
Resident Satisfaction
The following are the results (Table 12) of the survey applied to tourists on the Punta Camarón-Punta Sábalo stretch of beach. There were 117 responses from residents, a sample with 95% confidence and 10% error rate.
Table 12.
Resident satisfaction survey results.
3.3. Calculation of Real Carrying Capacity
The entire methodology of Saaty’s Hierarchical Analysis [31], which was used to obtain the weighting of the weights of the factors, is developed in Appendix A. Table 13 and Table 14 below show the results of the adjusted correction factors for the environmental and social categories and are the result of multiplying the percentages of the weights obtained by the experts and the values of the correction factors from the surveys.
Table 13.
Adjusted correction factors. Environmental category.
Table 14.
Adjusted correction factors. Social category.
Then, to obtain the total correction factor, the values of the adjusted correction factors of the two categories were multiplied by applying Formula (13):
Total Correction Factor = 0.88 × 0.74 = 0.65
Finally, the value obtained is replaced with Formula (14) to find the value of the Real Load Capacity per scenario presented in Table 15 and Figure 8:
Table 15.
Results of the calculation of the Real Carrying Capacity for the 2005, 2025, and 2050 scenarios.

Figure 8.
Comparison of Real Carrying Capacity by use criteria for the 2005, 2025, and 2050 scenarios.
3.4. Management Capacity
Management capacity (MC), as defined in Section 2: Materials and Methods, is the best state or conditions that the administration of an area should have to develop its activities and achieve its objectives. The results obtained in this section were achieved by applying a survey to personnel from the Beaches Operator of the Municipality of Mazatlán and the Aquatic Rescue Squadron of the Municipal Police of the Municipality of Mazatlán. The sample consisted of three managers per agency, and the results are shown in Table 16.
Table 16.
Results of the survey application to obtain the management capacity of the Punta Camarón-Punta Sábalo beach stretch.
The management capacity for the Punta Camarón-Punta Sábalo stretch of beaches is: CM = 0.726.
3.5. Effective Carrying Capacity
As explained in the Materials and Methods section, Effective Carrying Capacity (ECC) this refers to the maximum number of people that can stay on the beaches in the study area. For its calculation, the CCR is multiplied by the CM (Formula (15)) and the results by scenario are shown in Table 17 and plotted in Figure 9. It should be noted that in the absence of historical information and data for forecasting, the Total Correction Factor—including the environmental and social category—and the management capacity were considered constant over time.
Table 17.
Results of the Effective Carrying Capacity for the 2005, 2025, and 2050 scenarios.
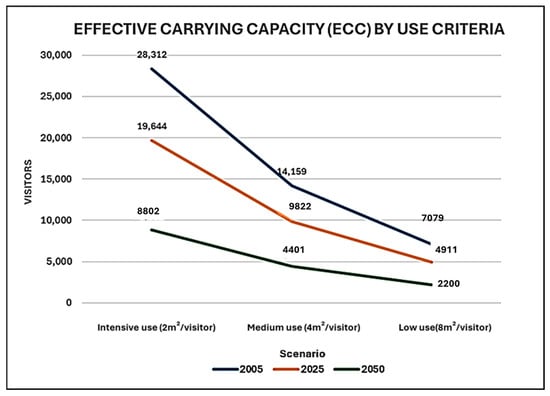
Figure 9.
Comparison of Effective Carrying Capacity (ECC) by criteria for the 2005, 2025, and 2050 scenarios.
The results presented in Table 17 clearly illustrate a downward trend in the number of users supported per scenario. These figures highlight current deficiencies in the area’s management capacity, suggesting that exceeding the calculated carrying capacities would lead to accelerated degradation of the beach. However, these results should be interpreted with caution. The values of 19,644, 29,822 and 4911 users per day under high, medium, and low occupancy levels, respectively, for the 2025 scenario, represent the number of users that the beach can sustainably accommodate under current conditions. Nonetheless, it is important to recognize that although certain periods—such as holidays—exceed these limits significantly, there are also extended times during the year when beach usage is minimal.
It is particularly noteworthy that during the 2024 Easter holiday period, the study area recorded a total of 318,185 users. When distributed across the analyzed surface, this results in an average of only 0.74 m2 per user—an extremely saturated condition when compared with the thresholds established in this study. This evidence underscores the critical need for implementing measures to regulate beach occupancy during peak tourist seasons. Failure to do so could lead to the accelerated environmental degradation of the coastal zone.
Finally, as observed in Table 17, it is important to note that the calculated carrying capacity is inversely proportional to its spatial requirement, i.e., the greater the carrying capacity, the smaller the area (in square meters) required per beach user.
4. Discussion
The findings of this study highlight the progressive reduction of usable beach area along the Punta Camarón–Punta Sábalo coastline in Mazatlán, Mexico, and how this decline compromises the Tourist Carrying Capacity (TCC) of the destination. Specifically, the analysis across three temporal scenarios (2005, 2025, 2050) and three intensity levels (high, medium, and low) reveals a clear downward trend in both Physical, Real, and Effective Carrying Capacity.
The decreasing trend in ECC values, from 28,312 in 2005 to 19,644 in 2025 under an intensive use scenario, demonstrates that the TCC of the study area has been significantly reduced over time; in addition to this, the ECC for 2050 is projected to fall to 8802, highlighting the spatial vulnerability of the coastal zone.
These data along the three scenarios corroborates Butler’s [1] assertion that mature tourist destinations are susceptible to deterioration if adaptive management strategies are not implemented. This reduction in carrying capacity is both physical and functional, posing a serious threat to the ecological sustainability and long-term tourism competitiveness of the area.
The occupancy density observed during Easter Week 2024 (0.74 m2 per user) clearly indicates an extreme saturation of beach space, which far exceeds the acceptable limits proposed in the simulated scenarios. This critical condition supports the warnings issued by Botero et al. [23] about the risks of overcrowding in post-COVID-19 mass tourism contexts. Similar saturation phenomena have been documented in other Latin American destinations [9,25,28,29,30], often due to insufficient regulation, which has led to the degradation of beach resources.
The projected scenario for 2050 reveals a 68.90% reduction in Effective Carrying Capacity (ECC) compared to 2025, reflecting the accelerated process of coastal erosion. This projection is consistent with the impacts of ‘coastal squeeze’ previously reported in the literature [16] and reinforces concerns about the vulnerability of sun and sea tourism to the impacts of climate change, as discussed by several authors [8,17].
Although Blue Flag certification is a widely recognized environmental quality standard, its limitations in managing peak season overcrowding have been reaffirmed in this study [10,18]. This underscores the need for more targeted, proactive, and technologically accessible mechanisms for local beach management, particularly in emerging economies, as emphasized in another research [11].
The findings suggest that if tourist demand continues to grow without adequate spatial planning and governance strategies, the TCC will continue to decline, exacerbating environmental pressures and reducing the quality of the tourism experience. This emphasizes the urgency of adopting adaptive, evidence-based management approaches tailored to the changing physical and social dynamics of coastal areas.
Although this study did not empirically test the direct causal effects of TCC decline on ecological sustainability or tourism competitiveness, the declining trend of ECC observed across all scenarios raises important questions for future research and policy.
Finally, the coastal segment of Punta Camarón—Punta Sábalo is undergoing a spatial and ecological contraction process. If not addressed, this could lead to irreversible loss of beaches and associated ecosystems. Although tourism growth and urban expansion have contributed to the economic development of Mazatlán, environmental costs may soon outweigh the benefits. These changes threaten various recreational activities on the coast and sea and could decrease the appeal of the destination, underscoring the urgent need for sustainable management and regulatory innovation.
5. Conclusions
Tourism has emerged as one of the most dynamic social, cultural, and economic phenomena in recent decades, consolidating its position as a fundamental sector in both national and international economies. However, in many cases, its rapid expansion has occurred in a disorganized and unregulated manner, generating significant negative impacts on the environments in which it develops. In response to these challenges, the adoption of a sustainable development framework within the tourism sector has gained prominence. This approach seeks to ensure the environmental, economic, and social viability of tourism through planning instruments, among which the concept of TCC stands out.
Regarding available methodologies for estimating TCC, this study confirms that there is no consensus in the literature on the variables and indicators that should be considered. A review of the state-of-the-art revealed theoretical and practical limitations that must be addressed and adjusted based on the specific territorial and socioenvironmental characteristics of the site under study. Consequently, this research was designed to produce an estimate grounded in empirical data, tailored to the context of the destination.
The methodology applied, based mainly on the framework proposed by Cifuentes [12,13] and adapted through contributions from Rodrguez [20], has demonstrated robustness and flexibility by integrating environmental, social and governance dimensions. This multidimensional approach aligns with the holistic methodologies advocated by Culibrk et al. [10] and Long et al. [6]. Moreover, the inclusion of the Analytic Hierarchy Process (AHP) [31] to weigh the correction factors adds methodological rigor and improves the precision of the model, in line with recent best practices in similar coastal evaluations [14,15].
The use of an Unmanned Aerial Vehicle (UAV) to help us calculate the Physical Carrying Capacity for the 2025 scenario was a major contribution due to its ability to generate high-resolution orthomosaics and digital terrain models. This information significantly improved the estimation of key variables such as usable area, restricted use zones, and access routes, making the capacity calculation more accurate and efficient.
The deliberate inclusion of environmental and social correction factors in the TCC estimate reflects a strategic methodological decision aligned with the principles of sustainable development. In doing so, this study ensures that the results obtained transcend simple spatial or physical metrics and incorporate considerations of environmental resilience and social well-being, key elements to achieve truly sustainable tourism planning.
A significant strength of this study lies in the incorporation of tourist and resident perceptions into social correction factors. This approach responds to the recommendation of Navarro Jurado et al. [15], who emphasize that the social dimension is often underestimated in capacity evaluations. It is also consistent with the findings of Gálvez-Izquieta and Mendoza-Tarabó [30], who argue that a decrease in resident satisfaction may signal a loss of social legitimacy for tourism activities, an emerging risk for Mazatlán if current trends persist.
One of the primary limitations encountered in this study was the scarcity of secondary data relevant to the study area, which required extensive fieldwork, direct observation, and the collection of primary information. Furthermore, the analysis was limited to one of the most visited and hotel dense segments of the destination. Future studies should extend the scope of analysis to other coastal sectors within the municipality to allow for broader generalization and comparative insights.
In response to the research question, this study confirms that the Tourist Carrying Capacity of a beach segment in Mazatlán has declined substantially from 2005 to 2025, and is projected to decrease even further by 2050, across all usage intensities. This trend reveals a pressing need for evidence-based and anticipatory management strategies to safeguard the long-term sustainability of coastal tourism.
Despite these limitations, this research provides valuable empirical evidence for decision-making in Mazatlán and other mature coastal destinations facing similar socioenvironmental pressures. The projections for 2050 highlight the urgent need for intervention, with an estimated 68.90% reduction in effective capacity that poses a serious threat not only to the physical integrity of the coastal environment but also to the sustainability of Mazatlán’s main tourist asset, its beaches. Although the resilience of sun-and-sea tourism is acknowledged, the long-term sustainability of such destinations will ultimately depend on their capacity to anticipate, manage, and mitigate the impacts of overcrowding, climate change, and socio-environmental degradation.
The findings of this study lead to the conclusion that the destination evaluated is in a critical process of degradation in both the physical and functional capacities of its beaches. This situation jeopardizes the site’s potential to remain competitive and sustainable as a tourist destination, as similarly identified in other studies of mature tourism areas [1,2,4]. The evident trend toward overcrowding, especially during peak seasons, along with the absence of adequate controls, reveals a growing discrepancy between the effective capacity of the beach area and its current usage levels, a concern also reported in other Latin American coastal contexts [23,25,28,29,30].
In the case of Mazatlán, currently there is no legal framework to regulate or protect beach use, nor any institutional program dedicated to coastal recovery or restoration. This regulatory gap underscores the urgent need to implement mechanisms to manage tourist flows and improve local governance capacities. These mechanisms should be supported by accessible technological tools and by fostering active participation of local residents and stakeholders, in agreement with recent successful case studies documented in the literature [11,30,31].
Future research should extend the methodology to other coastal areas in Mazatlán and Sinaloa for a broader comparative analysis. Incorporating dynamic modeling (e.g., simulations, time series data) would improve predictive capacity and long-term monitoring. Enhancing community participation and stakeholder engagement can refine social correction factors. Furthermore, developing a GIS-integrated decision support system would support real-time management and transparent decision-making. These actions aim to strengthen the sustainable governance of coastal tourism. In addition, future studies should explore the causal relationships between changes in Tourist Carrying Capacity and the long-term tourism competitiveness of mature coastal destinations, particularly through interdisciplinary approaches that integrate ecological, social, and management indicators.
Author Contributions
Conceptualization, P.A.A.C. and B.A.L.-C.; methodology, P.A.A.C.; software, E.O.B.S., J.A.S.R., and J.A.A.-C.; validation, P.A.A.C., B.A.L.-C., N.I.P.O., E.O.B.S., and J.A.A.-C.; formal analysis, P.A.A.C., B.A.L.-C., and J.A.A.-C.; investigation, P.A.A.C. and B.A.L.-C.; resources, P.A.A.C. and B.A.L.-C.; data curation, E.O.B.S., N.I.P.O., J.A.S.R., and J.A.A.-C.; writing—original draft preparation, P.A.A.C., B.A.L.-C., N.I.P.O., J.A.S.R., and E.O.B.S.; writing—review and editing, P.A.A.C. and B.A.L.-C.; visualization, P.A.A.C. and B.A.L.-C.; supervision, P.A.A.C. and B.A.L.-C.; project administration, P.A.A.C. and B.A.L.-C.; All authors have read and agreed to the published version of the manuscript.
Funding
This research received no external funding.
Institutional Review Board Statement
According to the research ethics committee of Universidad Autónoma de Sinaloa, this research is “non-risk research” because it does not involve intervention, risk to participants, or sensitive data collection, so it is exempt from formal ethical review. Therefore, ethical approval was not required for this study. This classification is supported by Article 17, Section I of the Regulations of the General Health Law on Health Research in Mexico. https://www.diputados.gob.mx/LeyesBiblio/regley/Reg_LGS_MIS.pdf (accessed on 10 June 2025).
Informed Consent Statement
Informed consent was obtained from all subjects involved in this study.
Data Availability Statement
All data generated or analyzed during this study are included in this published article.
Acknowledgments
The authors would like to express their sincere gratitude to the Facultad de Ingeniería y Tecnología de Mazatlán, Escuela de Turismo Mazatlán, Facultad de Informática Mazatlán, and Facultad de Ciencias Económico Administrativas de Mazatlán of the Universidad Autónoma de Sinaloa for providing the facilities and institutional support necessary to carry out this research. Special thanks are also extended to the Cuerpo Académico Conservación de las Costas y Puertos (UAS-CA-316) and Cuerpo Académico Tecnología Educativa I+D+i (UAS-CA-303) for their valuable guidance and collaboration throughout the development of this work.
Conflicts of Interest
The authors declare no conflicts of interest.
Appendix A. Developed AHP Methodology
With the correction factors obtained for the environmental and social categories, the weighting of the comparison matrix weights was calculated with the participation of six experts (Operadora de Playas del Municipio de Mazatlán, Escuadrón de Salvamento Acuático de la Policía Municipal de Mazatlán and a researcher from the area of Coastal Management of the Universidad Autónoma de Sinaloa), according to Saaty’s AHP model [28].
- Environmental Category
Table A1.
Results: paired comparisons matrix. Expert 1.
Table A1.
Results: paired comparisons matrix. Expert 1.
| Correction Factors | Erodibility | Accessibility | Precipitation | Solar Brightness | Disturbance to Wildlife | Disturbance to Flora |
|---|---|---|---|---|---|---|
| Erodibility | 1 | 1 | 3 | 0.2 | 1 | 3 |
| Accessibility | 1 | 1 | 3 | 0.2 | 1 | 3 |
| Precipitation | 0.333 | 0.333 | 1 | 0.2 | 0.333 | 1 |
| Solar brightness | 5 | 5 | 5 | 1 | 5 | 7 |
| Disturbance to wildlife | 1 | 1 | 3 | 0.2 | 1 | 3 |
| Disturbance to flora | 0.333 | 0.333 | 1 | 0.143 | 0.333 | 1 |
| Total | 8.667 | 8.667 | 16 | 1.943 | 8.667 | 18 |
Table A2.
Results: paired comparison matrix. Expert 2.
Table A2.
Results: paired comparison matrix. Expert 2.
| Correction Factor | Erodibility | Accessibility | Precipitation | Solar Brightness | Disturbance to Wildlife | Disturbance to Flora |
|---|---|---|---|---|---|---|
| Erodibility | 1 | 5 | 7 | 9 | 9 | 3 |
| Accessibility | 0.2 | 1 | 0.333 | 7 | 5 | 3 |
| Precipitation | 0.143 | 3 | 1 | 7 | 5 | 3 |
| Solar brightness | 0.111 | 0.143 | 0.143 | 1 | 0.333 | 0.2 |
| Disturbance to wildlife | 0.111 | 0.2 | 0.2 | 3 | 1 | 0.333 |
| Disturbance to flora | 0.333 | 0.333 | 0.333 | 0.2 | 3 | 1 |
| Summation | 1.899 | 9.677 | 9.009 | 27.2 | 23.333 | 10.533 |
Table A3.
Results: paired comparison matrix. Expert 3.
Table A3.
Results: paired comparison matrix. Expert 3.
| Correction Factor | Erodibility | Accessibility | Precipitation | Solar Brightness | Disturbance to Wildlife | Disturbance to Flora |
|---|---|---|---|---|---|---|
| Erodibility | 1 | 7 | 9 | 7 | 1 | 1 |
| Accessibility | 0.143 | 1 | 5 | 7 | 0.2 | 0.2 |
| Precipitation | 0.111 | 0.2 | 1 | 5 | 0.143 | 0.143 |
| Solar brightness | 0.143 | 0.1433 | 0.2 | 1 | 0.1423 | 0.143 |
| Disturbance to wildlife | 1 | 5 | 7 | 7 | 1 | 1 |
| Disturbance to flora | 1 | 5 | 7 | 7 | 1 | 1 |
| Summation | 3.397 | 18.343 | 29.2 | 34 | 3.486 | 3.486 |
Table A4.
Results: paired comparison matrix. Expert 4.
Table A4.
Results: paired comparison matrix. Expert 4.
| Correction Factor | Erodibility | Accessibility | Precipitation | Solar Brightness | Disturbance to Wildlife | Disturbance to Flora |
|---|---|---|---|---|---|---|
| Erodibility | 1 | 7 | 9 | 7 | 1 | 1 |
| Accessibility | 0.143 | 1 | 5 | 7 | 0.2 | 0.2 |
| Precipitation | 0.111 | 0.2 | 1 | 5 | 0.143 | 0.143 |
| Solar brightness | 0.143 | 0.1433 | 0.2 | 1 | 0.1423 | 0.143 |
| Disturbance to wildlife | 1 | 5 | 7 | 7 | 1 | 1 |
| Disturbance to flora | 1 | 5 | 7 | 7 | 1 | 1 |
| Summation | 3.397 | 18.343 | 29.2 | 34 | 3.486 | 3.486 |
Table A5.
Results: paired comparisons matrix. Expert 5.
Table A5.
Results: paired comparisons matrix. Expert 5.
| Correction Factors | Erodibility | Accessibility | Precipitation | Solar Brightness | Disturbance to Wildlife | Disturbance to Flora |
|---|---|---|---|---|---|---|
| Erodibility | 1 | 1 | 3 | 0.2 | 1 | 3 |
| Accessibility | 1 | 1 | 3 | 0.2 | 1 | 3 |
| Precipitation | 0.333 | 0.333 | 1 | 0.2 | 0.333 | 1 |
| Solar brightness | 5 | 5 | 5 | 1 | 5 | 7 |
| Disturbance to wildlife | 1 | 1 | 3 | 0.2 | 1 | 3 |
| Disturbance to flora | 0.333 | 0.333 | 1 | 0.143 | 0.333 | 1 |
| Total | 8.667 | 8.667 | 16 | 1.943 | 8.667 | 18 |
Table A6.
Results: paired comparison matrix. Expert 6.
Table A6.
Results: paired comparison matrix. Expert 6.
| Correction Factor | Erodibility | Accessibility | Precipitation | Solar Brightness | Disturbance to Wildlife | Disturbance to Flora |
|---|---|---|---|---|---|---|
| Erodibility | 1 | 7 | 9 | 7 | 1 | 1 |
| Accessibility | 0.143 | 1 | 5 | 7 | 0.2 | 0.2 |
| Precipitation | 0.111 | 0.2 | 1 | 5 | 0.143 | 0.143 |
| Solar brightness | 0.143 | 0.1433 | 0.2 | 1 | 0.1423 | 0.143 |
| Disturbance to wildlife | 1 | 5 | 7 | 7 | 1 | 1 |
| Disturbance to flora | 1 | 5 | 7 | 7 | 1 | 1 |
| Summation | 3.397 | 18.343 | 29.2 | 34 | 3.486 | 3.486 |
- Social Category
Table A7.
Results: paired comparison matrix. Expert 1.
Table A7.
Results: paired comparison matrix. Expert 1.
| Correction Factors | Temporary Closures | Tourist Satisfaction | Resident Satisfaction |
|---|---|---|---|
| Temporary Closures | 1 | 0.143 | 0.2 |
| Tourist satisfaction | 7 | 1 | 1 |
| Resident satisfaction | 5 | 1 | 1 |
| Summation | 13 | 2.143 | 2.2 |
Table A8.
Results: paired comparison matrix. Expert 2.
Table A8.
Results: paired comparison matrix. Expert 2.
| Correction Factors | Temporary Closures | Tourist Satisfaction | Resident Satisfaction |
|---|---|---|---|
| Temporary Closures | 1 | 3 | 0.143 |
| Tourist satisfaction | 0.333 | 1 | 0.2 |
| Resident satisfaction | 7 | 5 | 1 |
| Summation | 8.333 | 9 | 1.343 |
Table A9.
Results: paired comparisons matrix. Expert 3.
Table A9.
Results: paired comparisons matrix. Expert 3.
| Correction Factors | Temporary Closures | Tourist Satisfaction | Resident Satisfaction |
|---|---|---|---|
| Temporary Closures | 1 | 5 | 5 |
| Tourist satisfaction | 0.2 | 1 | 0.2 |
| Resident satisfaction | 0.2 | 5 | 1 |
| Total | 1.4 | 11 | 6.2 |
Table A10.
Results: paired comparison matrix. Expert 4.
Table A10.
Results: paired comparison matrix. Expert 4.
| Correction Factors | Temporary Closures | Tourist Satisfaction | Resident Satisfaction |
|---|---|---|---|
| Temporary Closures | 1 | 0.143 | 0.2 |
| Tourist satisfaction | 7 | 1 | 1 |
| Resident satisfaction | 5 | 1 | 1 |
| Summation | 13 | 2.143 | 2.2 |
Table A11.
Results: paired comparison matrix. Expert 5.
Table A11.
Results: paired comparison matrix. Expert 5.
| Correction Factors | Temporary Closures | Tourist Satisfaction | Resident Satisfaction |
|---|---|---|---|
| Temporary Closures | 1 | 0.143 | 0.2 |
| Tourist satisfaction | 7 | 1 | 1 |
| Resident satisfaction | 5 | 1 | 1 |
| Summation | 13 | 2.143 | 2.2 |
Table A12.
Results: paired comparison matrix. Expert 6.
Table A12.
Results: paired comparison matrix. Expert 6.
| Correction Factors | Temporary Closures | Tourist Satisfaction | Resident Satisfaction |
|---|---|---|---|
| Temporary Closures | 1 | 0.143 | 0.2 |
| Tourist satisfaction | 7 | 1 | 1 |
| Resident satisfaction | 5 | 1 | 1 |
| Summation | 13 | 2.143 | 2.2 |
Subsequently, each element of the comparison matrix was divided by the sum of its column:
- Environmental category
Table A13.
Results: normalized paired comparisons matrix. Expert 1.
Table A13.
Results: normalized paired comparisons matrix. Expert 1.
| Correction Factors | Erodibility | Accessibility | Precipitation | Solar Brightness | Disturbance to Wildlife | Disturbance to Flora |
|---|---|---|---|---|---|---|
| Erodibility | 0.115 | 0.115 | 0.188 | 0.103 | 0.115 | 0.167 |
| Accessibility | 0.115 | 0.115 | 0.188 | 0.103 | 0.115 | 0.167 |
| Precipitation | 0.038 | 0.038 | 0.063 | 0.103 | 0.038 | 0.056 |
| Solar brightness | 0.577 | 0.577 | 0.312 | 0.514 | 0.577 | 0.389 |
| Disturbance to wildlife | 0.115 | 0.115 | 0.188 | 0.103 | 0.115 | 0.167 |
| Disturbance to flora | 0.038 | 0.038 | 0.063 | 0.074 | 0.038 | 0.056 |
Table A14.
Results: normalized paired comparisons matrix. Expert 2.
Table A14.
Results: normalized paired comparisons matrix. Expert 2.
| Correction Factors | Erodibility | Accessibility | Precipitation | Solar Brightness | Disturbance to Wildlife | Disturbance to Flora |
|---|---|---|---|---|---|---|
| Erodibility | 0.523 | 0.517 | 0.777 | 0.331 | 0.386 | 0.285 |
| Accessibility | 0.105 | 0.103 | 0.037 | 0.257 | 0.214 | 0.285 |
| Precipitation | 0.076 | 0.310 | 0.111 | 0.257 | 0.214 | 0.285 |
| Solar brightness | 0.059 | 0.015 | 0.016 | 0.037 | 0.014 | 0.019 |
| Disturbance to wildlife | 0.059 | 0.021 | 0.022 | 0.111 | 0.043 | 0.032 |
| Disturbance to flora | 0.176 | 0.034 | 0.037 | 0.007 | 0.129 | 0.095 |
Table A15.
Results: normalized paired comparisons matrix. Expert 3.
Table A15.
Results: normalized paired comparisons matrix. Expert 3.
| Correction Factors | Erodibility | Accessibility | Precipitation | Solar Brightness | Disturbance to Wildlife | Disturbance to Flora |
|---|---|---|---|---|---|---|
| Erodibility | 0.294 | 0.382 | 0.310 | 0.206 | 0.287 | 0.287 |
| Accessibility | 0.042 | 0.055 | 0.171 | 0.206 | 0.057 | 0.057 |
| Precipitation | 0.033 | 0.011 | 0.034 | 0.147 | 0.0417 | 0.041 |
| Solar brightness | 0.042 | 0.008 | 0.007 | 0.029 | 0.041 | 0.041 |
| Disturbance to wildlife | 0.294 | 0.273 | 0.240 | 0.206 | 0.287 | 0.287 |
| Disturbance to flora | 0.294 | 0.273 | 0.240 | 0.206 | 0.287 | 0.287 |
Table A16.
Results: normalized paired comparisons matrix. Expert 4.
Table A16.
Results: normalized paired comparisons matrix. Expert 4.
| Correction Factors | Erodibility | Accessibility | Precipitation | Solar Brightness | Disturbance to Wildlife | Disturbance to Flora |
|---|---|---|---|---|---|---|
| Erodibility | 0.294 | 0.382 | 0.310 | 0.206 | 0.287 | 0.287 |
| Accessibility | 0.042 | 0.055 | 0.171 | 0.206 | 0.057 | 0.057 |
| Precipitation | 0.033 | 0.011 | 0.034 | 0.147 | 0.0417 | 0.041 |
| Solar brightness | 0.042 | 0.008 | 0.007 | 0.029 | 0.041 | 0.041 |
| Disturbance to wildlife | 0.294 | 0.273 | 0.240 | 0.206 | 0.287 | 0.287 |
| Disturbance to flora | 0.294 | 0.273 | 0.240 | 0.206 | 0.287 | 0.287 |
Table A17.
Results: normalized paired comparisons matrix. Expert 5.
Table A17.
Results: normalized paired comparisons matrix. Expert 5.
| Correction Factors | Erodibility | Accessibility | Precipitation | Solar Brightness | Disturbance to Wildlife | Disturbance to Flora |
|---|---|---|---|---|---|---|
| Erodibility | 0.115 | 0.115 | 0.188 | 0.103 | 0.115 | 0.167 |
| Accessibility | 0.115 | 0.115 | 0.188 | 0.103 | 0.115 | 0.167 |
| Precipitation | 0.038 | 0.038 | 0.063 | 0.103 | 0.038 | 0.056 |
| Solar brightness | 0.577 | 0.577 | 0.312 | 0.514 | 0.577 | 0.389 |
| Disturbance to wildlife | 0.115 | 0.115 | 0.188 | 0.103 | 0.115 | 0.167 |
| Disturbance to flora | 0.038 | 0.038 | 0.063 | 0.074 | 0.038 | 0.056 |
Table A18.
Results: normalized paired comparisons matrix. Expert 6.
Table A18.
Results: normalized paired comparisons matrix. Expert 6.
| Correction Factors | Erodibility | Accessibility | Precipitation | Solar Brightness | Disturbance to Wildlife | Disturbance to Flora |
|---|---|---|---|---|---|---|
| Erodibility | 0.294 | 0.382 | 0.310 | 0.206 | 0.287 | 0.287 |
| Accessibility | 0.042 | 0.055 | 0.171 | 0.206 | 0.057 | 0.057 |
| Precipitation | 0.033 | 0.011 | 0.034 | 0.147 | 0.0417 | 0.041 |
| Solar brightness | 0.042 | 0.008 | 0.007 | 0.029 | 0.041 | 0.041 |
| Disturbance to wildlife | 0.294 | 0.273 | 0.240 | 0.206 | 0.287 | 0.287 |
| Disturbance to flora | 0.294 | 0.273 | 0.240 | 0.206 | 0.287 | 0.287 |
- Social Category
Table A19.
Results: normalized paired comparisons matrix. Expert 1.
Table A19.
Results: normalized paired comparisons matrix. Expert 1.
| Correction Factors | Temporary Closures | Tourist Satisfaction | Resident Satisfaction |
|---|---|---|---|
| Temporary Closures | 0.077 | 0.067 | 0.091 |
| Tourist satisfaction | 0.538 | 0.467 | 0.455 |
| Resident satisfaction | 0.384 | 0.467 | 0.455 |
Table A20.
Results: normalized paired comparisons matrix. Expert 2.
Table A20.
Results: normalized paired comparisons matrix. Expert 2.
| Correction Factors | Temporary Closures | Tourist Satisfaction | Resident Satisfaction |
|---|---|---|---|
| Temporary Closures | 0.12 | 0.333 | 0.106 |
| Tourist satisfaction | 0.04 | 0.111 | 0.149 |
| Resident satisfaction | 0.84 | 0.556 | 0.745 |
Table A21.
Results: normalized paired comparisons matrix. Expert 3.
Table A21.
Results: normalized paired comparisons matrix. Expert 3.
| Correction Factors | Temporary Closures | Tourist Satisfaction | Resident Satisfaction |
|---|---|---|---|
| Temporary Closures | 0.714 | 0.455 | 0.806 |
| Tourist satisfaction | 0.143 | 0.091 | 0.032 |
| Resident satisfaction | 0.143 | 0.455 | 0.161 |
Table A22.
Results: normalized paired comparisons matrix. Expert 4.
Table A22.
Results: normalized paired comparisons matrix. Expert 4.
| Correction Factors | Temporary Closures | Tourist Satisfaction | Resident Satisfaction |
|---|---|---|---|
| Temporary Closures | 0.077 | 0.067 | 0.091 |
| Tourist satisfaction | 0.538 | 0.467 | 0.455 |
| Resident satisfaction | 0.384 | 0.467 | 0.455 |
Table A23.
Results: normalized paired comparisons matrix. Expert 5.
Table A23.
Results: normalized paired comparisons matrix. Expert 5.
| Correction Factors | Temporary Closures | Tourist Satisfaction | Resident Satisfaction |
|---|---|---|---|
| Temporary Closures | 0.077 | 0.067 | 0.091 |
| Tourist satisfaction | 0.538 | 0.467 | 0.455 |
| Resident satisfaction | 0.384 | 0.467 | 0.455 |
Table A24.
Results: normalized paired comparisons matrix. Expert 6.
Table A24.
Results: normalized paired comparisons matrix. Expert 6.
| Correction Factors | Temporary Closures | Tourist Satisfaction | Resident Satisfaction |
|---|---|---|---|
| Temporary Closures | 0.077 | 0.067 | 0.091 |
| Tourist satisfaction | 0.538 | 0.467 | 0.455 |
| Resident satisfaction | 0.384 | 0.467 | 0.455 |
The sum of each correction factor was then added up and the average was calculated as a percentage, as shown in Table A25, Table A26, Table A27, Table A28, Table A29, Table A30, Table A31, Table A32, Table A33, Table A34, Table A35 and Table A36.
- Environmental category
Table A25.
Results of the factor summation matrix and averages. Expert 1.
Table A25.
Results of the factor summation matrix and averages. Expert 1.
| Correction Factors | Total | Average (%) |
|---|---|---|
| Erodibility | 0.803 | 13.388 |
| Accessibility | 0.803 | 13.388 |
| Precipitation | 0.336 | 5.606 |
| Solar brightness | 2.947 | 49.114 |
| Disturbance to wildlife | 0.803 | 13.387 |
| Disturbance to flora | 0.307 | 5.116 |
Table A26.
Results of factor summation matrix and averages. Expert 2.
Table A26.
Results of factor summation matrix and averages. Expert 2.
| Correction Factors | Summation | Average (%) |
|---|---|---|
| Erodibility | 2.821 | 47.030 |
| Accessibility | 1.002 | 16.702 |
| Precipitation | 1.253 | 20.879 |
| Solar brightness | 0.159 | 2.653 |
| Disturbance to wildlife | 0.286 | 4.769 |
| Disturbance to flora | 0.478 | 7.965 |
Table A27.
Results of the matrix of summation of factors and averages. Expert 3.
Table A27.
Results of the matrix of summation of factors and averages. Expert 3.
| Correction Factors | Summation | Average (%) |
|---|---|---|
| Erodibility | 1.764 | 29.398 |
| Accessibility | 0.588 | 9.807 |
| Precipitation | 0.307 | 5.115 |
| Solar brightness | 0.168 | 2.801 |
| Disturbance to wildlife | 1.586 | 26.439 |
| Disturbance to flora | 1.586 | 26.439 |
Table A28.
Results of the matrix of summation of factors and averages. Expert 4.
Table A28.
Results of the matrix of summation of factors and averages. Expert 4.
| Correction Factors | Summation | Average (%) |
|---|---|---|
| Erodibility | 1.764 | 29.398 |
| Accessibility | 0.588 | 9.807 |
| Precipitation | 0.307 | 5.115 |
| Solar brightness | 0.168 | 2.801 |
| Disturbance to wildlife | 1.586 | 26.439 |
| Disturbance to flora | 1.586 | 26.439 |
Table A29.
Results of the factor summation matrix and averages. Expert 5.
Table A29.
Results of the factor summation matrix and averages. Expert 5.
| Correction Factors | Total | Average (%) |
|---|---|---|
| Erodability | 0.803 | 13.388 |
| Accessibility | 0.803 | 13.388 |
| Precipitation | 0.336 | 5.606 |
| Solar brightness | 2.947 | 49.114 |
| Disturbance to wildlife | 0.803 | 13.387 |
| Disturbance to flora | 0.307 | 5.116 |
Table A30.
Results of the factor summation matrix and averages. Expert 6.
Table A30.
Results of the factor summation matrix and averages. Expert 6.
| Correction Factors | Total | Average (%) |
|---|---|---|
| Erodability | 1.764 | 29.398 |
| Accessibility | 0.588 | 9.807 |
| Precipitation | 0.307 | 5.115 |
| Solar brightness | 0.168 | 2.801 |
| Disturbance to wildlife | 1.586 | 26.439 |
| Disturbance to flora | 1.586 | 26.439 |
- Social category
Table A31.
Results of the factor summation matrix and averages. Expert 1.
Table A31.
Results of the factor summation matrix and averages. Expert 1.
| Correction Factors | Summation | Average (%) |
|---|---|---|
| Temporary Closures | 0.234 | 7.817 |
| Tourist satisfaction | 1.459 | 48.656 |
| Resident satisfaction | 1.306 | 43.528 |
Table A32.
Results of the factor summation matrix and averages. Expert 2.
Table A32.
Results of the factor summation matrix and averages. Expert 2.
| Correction Factors | Total | Average (%) |
|---|---|---|
| Temporary Closures | 0.560 | 18.657 |
| Tourist satisfaction | 0.300 | 10.001 |
| Resident satisfaction | 2.140 | 71.341 |
Table A33.
Results of factor summation matrix and averages. Expert 3.
Table A33.
Results of factor summation matrix and averages. Expert 3.
| Correction Factors | Summation | Average (%) |
|---|---|---|
| Temporary Closures | 1.975 | 65.843 |
| Tourist satisfaction | 0.266 | 8.867 |
| Resident satisfaction | 0.759 | 25.290 |
Table A34.
Results of the factor summation matrix and averages. Expert 4.
Table A34.
Results of the factor summation matrix and averages. Expert 4.
| Correction Factors | Summation | Average (%) |
|---|---|---|
| Temporary Closures | 0.234 | 7.817 |
| Tourist satisfaction | 1.459 | 48.656 |
| Resident satisfaction | 1.306 | 43.528 |
Table A35.
Results of the factor summation matrix and averages. Expert 5.
Table A35.
Results of the factor summation matrix and averages. Expert 5.
| Correction Factors | Summation | Average (%) |
|---|---|---|
| Temporary Closures | 0.234 | 7.817 |
| Tourist satisfaction | 1.459 | 48.656 |
| Resident satisfaction | 1.306 | 43.528 |
Table A36.
Results of the factor summation matrix and averages. Expert 6.
Table A36.
Results of the factor summation matrix and averages. Expert 6.
| Correction Factors | Summation | Average (%) |
|---|---|---|
| Temporary Closures | 0.234 | 7.817 |
| Tourist satisfaction | 1.459 | 48.656 |
| Resident satisfaction | 1.306 | 43.528 |
With the answers from the previous calculations, the results of the experts in each category were averaged and are shown in Table A37 and Table A38.
- Environmental category
Table A37.
Average weights of correction factors. Environmental category.
Table A37.
Average weights of correction factors. Environmental category.
| Correction Factor | Expert 1 | Expert 2 | Expert 3 | Expert 4 | Expert 5 | Expert 6 | Average (%) |
|---|---|---|---|---|---|---|---|
| Erodability | 13.388 | 47.031 | 29.398 | 29.398 | 13.388 | 29.398 | 27.0 |
| Accessibility | 13.388 | 16.702 | 9.807 | 9.807 | 13.388 | 9.807 | 12.15 |
| Precipitation | 5.606 | 20.879 | 5.115 | 5.115 | 5.606 | 5.115 | 7.91 |
| Solar brightness | 49.114 | 2.653 | 2.801 | 2.801 | 49.114 | 2.801 | 18.21 |
| Disturbance to wildlife | 13.388 | 4.770 | 26.439 | 26.439 | 13.388 | 26.439 | 18.50 |
| Disturbance to flora | 5.116 | 7.965 | 26.439 | 26.439 | 5.116 | 26.439 | 16.25 |
- Social category
Table A38.
Average weights of correction factors. Social category.
Table A38.
Average weights of correction factors. Social category.
| Correction Factor | Expert 1 | Expert 2 | Expert 3 | Expert 4 | Expert 5 | Expert 6 | Average (%) |
|---|---|---|---|---|---|---|---|
| Temporary Closures | 7.817 | 18.657 | 65.843 | 7.817 | 7.817 | 7.817 | 19.30 |
| Tourist satisfaction | 48.656 | 10.002 | 8.868 | 48.656 | 48.656 | 48.656 | 35.58 |
| Resident satisfaction | 43.530 | 71.341 | 25.290 | 43.530 | 43.530 | 43.530 | 45.12 |
References
- Butler, R. Mature Tourist Destinations: Can We Recapture and Retain the Magic? In Renovation and Restructuring of Tourist Destinations in Coastal Areas: Framework of Analysis, Processes, Instruments and Realities; Vera, F., Rodríguez, I., Eds.; Universitat de Valencia: Valencia, Spain, 2012. [Google Scholar]
- Knowles, T.; Curtis, S. The Market Viability of European Mass Tourist Destinations. A Poststagnation Life-Cycle Analysis. Int. J. Tour. Res. 1999, 1, 87–96. [Google Scholar]
- Acerenza, M. Conceptualization, Origin and Evolution of Tourism; Trillas: Guadalajara, Mexico, 2006. [Google Scholar]
- Butler, R. Coastal Tourist Resorts: History, Development and Models. ACE Archit. City Environ. 2014, 9, 203–228. [Google Scholar] [CrossRef]
- World Tourism Organization (UNWTO). Home-World Tourism Organization. Available online: https://www.unwto.org (accessed on 11 May 2025).
- Long, C.; Lu, S.; Chang, J.; Zhu, J.; Chen, L. Tourism Environmental Carrying Capacity Review, Hotspot, Issue, and Prospect. Int. J. Environ. Res. Public Health 2022, 19, 16663. [Google Scholar] [CrossRef]
- Perruolo, G.; Camargo, C. Estimation of Tourist Carrying Capacity in the Chorro El Indio Area, Táchira State, Venezuela. Cuad. Geogr. Rev. Geogr. 2017, 26, 77–90. [Google Scholar] [CrossRef]
- Aktymbayeva, A.; Nuruly, Y.; Artemyev, A.; Assipova, Z. Balancing Nature and Visitors for Sustainable Development: Assessing the Tourism Carrying Capacities of Katon-Karagay National Park, Kazakhstan. Sustainability 2023, 15, 15989. [Google Scholar] [CrossRef]
- Bernal, B.; Montero, N.; Vázquez, S. A Comparative Study of the Tourism Carrying Capacity of the State of Baja California between 2019 and 2022. Sustainability 2024, 16, 3938. [Google Scholar] [CrossRef]
- Culibrk, A.; Dimitrakopoulos, P.G.; Kokkoris, G.D.; Eleftheriadou, M.; Tzoraki, O. A Holistic Approach to Assessing Visitor Numbers on Protected Natura 2000 Beaches: The Case of Western Peloponnese, Greece. Environ. Impact Assess. Rev. 2025, 112, 107824. [Google Scholar] [CrossRef]
- Sempere-Tortosa, M.; Toledo, I.; Marcos-Jorquera, D.; Carbonell, D.; Gilart-Iglesias, V.; Aragonés, L. A New Occupancy Index Model Based on Artificial Vision for Enhancing Beach Management. J. Environ. Manag. 2024, 370, 122675. [Google Scholar] [CrossRef]
- Cifuentes, M. Determinación de Capacidad de Carga Turística en Áreas Protegidas; CATIE: Turrialba, Costa Rica, 1992. [Google Scholar]
- Cifuentes, M. Capacidad de Carga Turística de las Áreas de Uso Público del Monumento Nacional Guayabo, Costa Rica; WWF Central America: San José, Costa Rica, 1999. [Google Scholar]
- Dong, X.; Gao, S.; Xu, A.; Luo, Z.; Hu, B. Research on Tourism Carrying Capacity and the Coupling Coordination Relationships between Its Influencing Factors: A Case Study of China. Sustainability 2022, 14, 15124. [Google Scholar] [CrossRef]
- Navarro Jurado, E.; Damian, I.M.; Fernández-Morales, A. Carrying Capacity Model Applied in Coastal Destinations. Ann. Tour. Res. 2013, 43, 1–19. [Google Scholar] [CrossRef]
- Aguilar, P.; Mendoza, E.; Silva, R. Interaction between Tourism Carrying Capacity and Coastal Squeeze in Mazatlán, Mexico. Land 2021, 10, 900. [Google Scholar] [CrossRef]
- Vandarakis, D.; Malliouri, D.; Petrakis, S.; Kapsimalis, V.; Moraitis, V.; Hatiris, G.-A.; Panagiotopoulos, I. Carrying Capacity and Assessment of the Tourism Sector in the South Aegean Region, Greece. Water 2023, 15, 2616. [Google Scholar] [CrossRef]
- Secretaría de Turismo de México (SECTUR). Tourism in Mexico. Available online: https://www.gob.mx/sectur (accessed on 11 May 2025).
- SECTUR; Universidad del Occidente. Competitiveness Agendas of Mexico’s Tourism Destinations: Mazatlan Sinaloa; SECTUR: Mexico City, Mexico, 2014. Available online: http://www.sectur.gob.mx/wp-content/uploads/2015/02/PDF-Mazatlan.pdf (accessed on 11 May 2025).
- Rodríguez Torres, S. Methodological proposal for the measurement of the tourist carrying capacity of Haynes Cay in San Andres Island. Master’s Thesis, Universidad Externado de Colombia, Bogotá, Colimbia, 2018. Available online: https://bdigital.uexternado.edu.co/entities/publication/9d6f9e9e-1279-48ea-81b9-36c57592d171 (accessed on 10 June 2025).
- Prieto Campos, A.; Díaz Cuevas, P. Approaches to the beaches carrying capacity in times of COVID-19: The case of the Andalusian Atlantic coast. Boletín Asoc. Geógrafos Españoles 2021, 88, 1–46. [Google Scholar] [CrossRef]
- World Tourism Organization, UNWTO. Sustainable Development Indicators for Tourism Destinations: A Practical Guide; World Tourism Organization: Madrid, Spain, 2005. [Google Scholar]
- Botero, C.M.; Mercadé, S.; Cabrera, J.A.; Bombana, B. Sun and Beach Tourism in the Context of COVID-19. Scenarios and Recommendations; Red Iberoamericana de Gestión y Certificación de Playas–PROPLAYAS: Santa Marta, Colombia, 2020. [Google Scholar]
- Roig, F.X. Analysis of the carrying capacity of coastal spaces, coves and beaches, located in natural areas of special interest on the island of Menorca. In Turismo y Transformaciones Urbanas en el Siglo XXI; Pumares, P., Asencio, M.A., Eds.; University of Almería: Almería, Spain, 2002; pp. 325–335. [Google Scholar]
- Ortega, J.L.C.; Dagostino, R.M.C.; Olivas, M.L.B. Tourist carrying capacity of Punta Perula Beach and Cocinas Island Beach as a strategy for sustainable tourism use. Cimexus 2019, 14, 11–26. [Google Scholar]
- Secretaría de Economía. NMX-AA-120-SCFI-2016, Requisitos y Especificaciones de Sustentabilidad de Playas [NMX-AA-120-SCFI-2016]. 2016. Available online: http://www.economia-nmx.gob.mx/normas/nmx/2010/nmx-aa-120-scfi-2016.pdf (accessed on 10 June 2025).
- López, B.A. The Life Cycle of Mazatlán from the Analysis of Social Change in the Tourism System. Master’s Thesis, Universidad Autónoma de Sinaloa, Mazatlán, Sinaloa, Mexico, 2018. [Google Scholar]
- Aranguren, J.; Moncada, J.A.; Naveda, J.; Rivas, D.; Lugo, C. Evaluation of the tourist carrying capacity of Conomita beach, Guanta Municipality, Anzoátegui State. Rev. De Investig. 2008, 64, 31–42. [Google Scholar]
- Fernández, J.M.; Bértola, G.R. Tourist carrying capacity of the beaches of Mar Chiquita County, Buenos Aires Province, Argentina. J. Mar. Coast. Sci. 2014, 6, 55–73. [Google Scholar] [CrossRef]
- Gálvez-Izquieta, P.C.; Mendoza-Tarabó, A.E. Tourist carrying capacity as a tool for sustainable beach development: Montañita case, Santa Elena province, Ecuador. Rev. Empres. 2020, 14, 1–7. [Google Scholar] [CrossRef]
- Saaty, T. Analytical hierarchical method (AHP)-basic principles. In Evaluación y Decisión Multicriterio. Reflexiones y Experiencias; Martínez, E., Escudey, M., Eds.; USACH, UNESCO: Santiago, Chile, 1998; pp. 17–46. [Google Scholar]
- Google LLC (n.d.). Google Earth [Software]. Available online: https://earth.google.com (accessed on 11 May 2025).
- Dronelink (n.d.). Automated Drone Mission Planning Software. Available online: https://www.dronelink.com/ (accessed on 11 May 2025).
- Pix4D S.A. (n.d.). Pix4D: Photogrammetry Software for Professional Drone Mapping. Available online: https://www.pix4d.com/ (accessed on 11 May 2025).
- QGIS.org (n.d.). QGIS Geographic Information System [Software]. Available online: https://qgis.org/ (accessed on 11 May 2025).
- IPCC. Summary for Policymakers. In Climate Change 2023: Synthesis Report. Contribution of Working Groups I, II and III to the Sixth Assessment Report of the Intergovernmental Panel on Climate Change; Lee, H., Romero, J., Eds.; IPCC: Geneva, Switzerland, 2023. [Google Scholar]
Disclaimer/Publisher’s Note: The statements, opinions and data contained in all publications are solely those of the individual author(s) and contributor(s) and not of MDPI and/or the editor(s). MDPI and/or the editor(s) disclaim responsibility for any injury to people or property resulting from any ideas, methods, instructions or products referred to in the content. |
© 2025 by the authors. Licensee MDPI, Basel, Switzerland. This article is an open access article distributed under the terms and conditions of the Creative Commons Attribution (CC BY) license (https://creativecommons.org/licenses/by/4.0/).