Abstract
The Belt and Road Initiative (BRI) prioritizes infrastructure investment to enhance regional connectivity and foster sustainable economic development. Therefore, this empirical study aims to examine the impact of the BRI, specifically through Chinese foreign direct investment (CFDI) on sustainable growth in Bangladesh. The study employs the Mann–Kendall trend analysis and the generalized method of moments (GMM). For the Mann–Kendall trend analysis, sectoral FDI and output data from four major industrial sectors, obtained from Bangladesh Bank and CEIC for the period 1996–2020, are used to analyze trends in industrial development. Additionally, to assess the BRI’s role in sustainable development, this study compares green gross domestic product (GGDP) and gross domestic product (GDP) using a GMM analysis of CFDI inflows across 16 industrial sectors from 2013 to 2022, sourced from various databases. Findings reveal that CFDI significantly contributes to domestic industrial growth, particularly in the manufacturing and construction sectors. Although Bangladesh joined the BRI in 2016, a notable surge in CFDI appears from 2011–2012, partially driven by Bangladesh’s economic liberalization policies, and reflects early strategic investment consistent with China’s expanding economic diplomacy, which was later formalized under the BRI framework. The two-step system GMM results demonstrate that CFDI has a stronger impact on GGDP (0.0350) than on GDP (0.0146), with GGDP showing faster convergence (0.6027 vs. 0.1800), highlighting more robust and rapid sustainable growth outcomes. This underscores the significant Chinese investment in green sectors in Bangladesh. The study also demonstrates that the BRI supports the achievement of Sustainable Development Goals (SDGs) 7 (green energy) and 9 (sustainable infrastructure). These insights offer valuable direction for future research and policy, suggesting that Bangladesh should prioritize attracting green-oriented CFDI in sectors like energy, manufacturing, and construction, while also strengthen.
1. Introduction
Launched in 2013, the Belt and Road Initiative (BRI) seeks to enhance transnational connectivity and facilitate cross-border trade through large-scale infrastructure development [1]. By investing in critical infrastructure—such as transportation networks, ports, and energy systems—the BRI aims to reduce logistical constraints and attract foreign direct investment (FDI) in previously underserved regions [2]. In addition to physical infrastructure, the initiative promotes industrial growth in sectors such as manufacturing and renewable energy, thereby contributing to job creation and local economic development [3]. Hence, as a recognized catalyst for economic advancement, FDI plays a pivotal role in fostering sustainable development and long-term economic growth [4,5]. According to the United Nations Conference on Trade and Development (UNCTAD)’s World Investment Report 2024, global FDI flows rose to USD 1.3 trillion in 2023, up from USD 204.9 billion in 1990. In developing countries, FDI stimulates capital accumulation and industrialization, while in developed nations, it facilitates technology transfer and productivity gains. Studies confirm FDI’s positive effects on industrial structures, trade, and economic growth [6,7] and, beyond economic growth, FDI influences environmental sustainability [8]. Although some suggest weak or negative spillovers from foreign-owned firms [9,10], others signify that the impact of FDI varies by sector, country, and timeframe [11,12].
Since the BRI’s launch in 2013, China’s foreign trade has driven technology spillovers in BRI countries, while its investments have had more lasting impacts [13]. China’s foreign trade and investments have driven technology spillovers in BRI countries, though the extent of benefits varies by region due to differences in absorptive capacity [14]. Chinese FDI (CFDI), particularly in manufacturing, has accelerated industrialization by creating jobs, transferring technology, and enhancing local production [15]. However, some studies question its net benefits, citing concerns over economic growth stagnation and limited socio-economic contributions [16,17]. Amid global economic integration, CFDI and the BRI are expected to drive industrial growth and sustainable development in Bangladesh. Although research on FDI’s effects is mixed, showing both positive [18,19] and negative outcomes [20]. The BRI presents opportunities for trade, infrastructure, and market access, particularly through the Bangladesh–China–India–Myanmar Economic Corridor (BCIM-EC), benefiting key sectors like ready-made garments (RMGs) [21,22]. However, challenges remain, including geopolitical risks and persistent trade deficits with China, despite improved trade costs and supply chain integration [23].
Existing literature highlights the BRI as a transformative global infrastructure investment strategy aimed at enhancing regional connectivity, economic integration [24], and industrial development [15]. While past studies have predominantly focused on the BRI’s association with economic growth [2], trade [25], and development [26]—especially within China—there is growing recognition of the initiative’s potential to promote sustainable development through green investment and technological modernization. Recent scholarly work underscores the BRI’s alignment with Sustainable Development Goals (SDGs), particularly SDG 7 (sustainable energy) [27] and SDG 9 (infrastructure and industrial innovation) [28], and emphasizes the role of CFDI in supporting industrial upgrading, employment generation [14,15], and environmentally friendly growth [27,28,29,30] in host countries. Moreover, green financing, improved energy structures, and absorptive capacity in recipient nations are shown to mediate the effectiveness of CFDI spillovers [28,29]. However, there remains a research gap in assessing these dynamics in the context of Bangladesh. Therefore, this study hypothesizes that participation in the BRI significantly increases CFDI inflows into Bangladesh and that these investments have a greater positive impact on green gross domestic product (GGDP) than on traditional gross domestic product (GDP), particularly by fostering industrialization and sustainable growth.
This paper has two objectives: (a) to find the implications of Chinese investment in Bangladesh since the preparatory stage and (b) to acknowledge the role of BRI in sustainable development of Bangladesh. To secure the objectives the present study aims to address two key research questions: (a) How does the CFDI influence industrial growth of Bangladesh? and (b) How does the increased level of industrial CFDI since the BRI impact the sustainable growth of Bangladesh? The organization of the paper is as follows: Section 2 reviews the conceptual and empirical literature. Section 3 consists of empirical methodology, description of data, and variables. Section 4 contains results and discussion. The last section describes conclusions and policy implications.
This study makes several key contributions. First, it is a pioneering effort to analyze the role of the BRI in Bangladesh’s industrial growth through CFDI, using data from 1996 to 2022. Second, it contributes to the discussion on the BRI’s role in Bangladesh’s GGDP and GDP from 2013 to 2022. Third, the study explores the absorptive capacity perspective, investigating how industrial growth affects CFDI spillovers and promotes sustainable development in Bangladesh. It also finds that industrial CFDI has threshold effects on sustainable development. Additionally, the study employs the Mann–Kendall (M-K) approach and two-step system generalized method of moments (GMM) estimation to assess these relationships.
2. Literature Review
Endogenous growth theory, as developed by Romer and Lucas, underscores sustained economic growth as driven by investments in research and development (R&D), global trade, and human capital, emphasizing knowledge spillovers and learning effects [31,32]. Within this framework, FDI is recognized as a vital catalyst that enhances capital productivity, particularly in developing economies [33]. Industrialization, closely linked to economic transformation, also depends heavily on FDI to acquire advanced technologies and reduce inequality. For sustainable long-term growth, a strategic shift from resource-seeking to market-seeking FDI is crucial. Inspired by East Asia’s development model, many developing nations prioritize industrialization, leveraging FDI to stimulate job creation, capital accumulation, and sustainable growth. However, inadequate human capital and technological capacity in many countries limit their ability to fully harness these benefits, making FDI indispensable.
FDI, through technology transfer and transnational knowledge sharing, plays a significant role in fostering economic development [34]. Its impact on growth is strongly mediated by governance quality, with evidence from Organisation for Economic Co-operation and Development (OECD) countries indicating that robust institutional frameworks amplify FDI’s positive effects [35]. In African economies, while FDI’s short-term growth impact is limited, its long-term contributions are more pronounced [36]. At the national level, FDI tends to increase carbon emissions in early development stages but contributes to reductions in later stages, whereas regional impacts remain heterogeneous [36]. Olorogun et al. [37] similarly affirm FDI’s positive influence on growth. Furthermore, FDI promotes sustainable development when economic globalization and development levels remain below critical thresholds [38], and its combined spillover effects with trade support long-term sustainability [39]. In the UAE, FDI aligned with financial development has also supported renewable energy advancement [40].
CFDI plays a vital role in industrial upgrading [14,15]. A panel-corrected standard errors (PCSE) estimation indicates that CFDI in Sub-Saharan Africa (SSA) has a positive but statistically insignificant impact on industrialization, suggesting that current investment levels are insufficient to drive significant industrial development [41]. Public–private coordination, as in Nigeria, enhances outcomes through job creation and skills development [15]. FDI spillovers depend on host countries’ absorptive capacity—shaped by institutions, R&D, and financial markets [42,43,44]—while financial development influences the effectiveness of technology transfer [14]. Noor et al. [45] highlight sectors in Pakistan and other BRI countries with potential for integration into China’s global value chains, promoting sustainable industrial growth. Empirical evidence from Pakistan demonstrates a strong positive effect of CFDI on economic growth, confirmed by various studies employing models like autoregressive distributed lag (ARDL) [46]. Similarly, using a regression model study on African contexts reflect the stabilizing and growth-promoting effects of CFDI [47]. The role of foreign direct investment in human capital is highlighted as consistently boosting GDP growth, emphasizing the importance of skill development in host countries [33]. Moreover, institutional quality mediates the developmental impact of CFDI, with better institutions amplifying GDP per capita growth, underscoring governance as a key determinant of investment outcomes [48].
Utilizing annual time series data spanning from 1991 to 2020, a Johansen cointegration technique alongside a vector error correction model (VECM) study’s empirical findings reveals a long-run negative relationship between FDI inflows and RMG export performance in Bangladesh [49]. Another study suggests that FDI demonstrates a positive correlation with GDP growth, exports, imports, employment within export processing zones (EPZs), and exchange rate movements. Conversely, a significant negative correlation is observed between FDI and both the corporate tax rate and the inflation rate [50]. Based on these arguments, authors hypothesize:
H0a:
CFDI inflows do not enhance the GDP in Bangladesh.
Sustainable development is increasingly central to international policy, with concepts like “green development” and “sustainable investment” shaping economic law, trade, and finance [51,52] due to regulatory changes, investor preferences, and the evolution in fiduciary duty [53]. The United Nation’s SDGs, introduced in 2015, require collaboration among state and non-state actors to address global challenges [54]. Unlike traditional environmental policies, sustainable development integrates economic, environmental, and social factors, balancing resource conservation with economic growth.
Infrastructure development is fundamental to achieving SDG 9 on industry, innovation, and infrastructure, but global funding gaps remain large. The BRI, as the world’s largest infrastructure investment program, aims to address these deficits while promoting economic and environmental integration across finance, energy, and sustainability sectors [54]. China’s green BRI policies, such as the Belt and Road Ecological and Environmental Cooperation Plan [55,56], align closely with global sustainability frameworks [57]. Research indicates that the BRI and associated FDI flows facilitate green investments, technological spillovers, and industrial modernization in host countries [28]. Aligning BRI projects with SDGs offers partner nations pathways to transition towards sustainable economies, reinforcing China’s commitment to sustainable development and domestic economic reforms [54]. The BRI promotes economic and environmental integration, particularly through energy and green finance. Green financing has been shown to improve energy efficiency and support SDG 7’s goals. A study (2005–2018) identified disparities in energy financing, renewable energy use, and emissions across BRI countries, with probit regression confirming the potential of private green finance to enhance energy systems [27]. Another study revealed a non-linear U-shaped link between economic openness, FDI spillovers, and green growth in China, shaped by regional absorptive capacities [29]. Liu et al. [28] found that stronger energy structures attract greener Chinese outward foreign direct investment (OFDI). Since the BRI’s launch, such investments have notably increased in energy sectors of partner countries. A GMM analysis further highlights that composition and technology effects are key drivers of green growth—reducing pollution and promoting cleaner innovation [30].
The economic literature on Bangladesh has traditionally concentrated on the roles of foreign aid and microfinance in shaping development outcomes. Within this context, studies such as Glisovic et al. [58] underscore the tensions between rapid volume growth and valuation pressures in the global microfinance sector—an insight particularly relevant to Bangladesh, where the microfinance industry has expanded significantly but now faces challenges in sustainability, investor expectations, and impact delivery. However, Bangladesh also faces severe environmental challenges, including climate change, air pollution, and widespread environmental degradation, which exacerbate its vulnerability. These challenges manifest in the form of rising sea levels, frequent flooding, and increased frequency of cyclones, which disproportionately affect coastal areas and agricultural productivity [59,60]. Furthermore, air pollution resulting from industrial activities and construction projects leads to detrimental health outcomes, such as respiratory diseases [61,62]. Although economic growth remains essential, it alone is insufficient to mitigate the associated environmental impacts. Based on these arguments, authors hypothesize:
H0b:
CFDI inflows do not enhance the GGDP in Bangladesh.
While existing literature explores the linkage between industry relocation and sustainable economic development in countries such as Pakistan [45] and Ethiopia [63], this study contributes by analyzing the implications of CFDI and the BRI for industrialization and sustainable development in Bangladesh. By examining these dynamics, the study seeks to provide empirical insights into the BRI’s role in shaping Bangladesh’s economic and environmental landscape, highlighting its potential to drive sustainable industrial growth.
3. Data and Methods
3.1. Trend Analysis
Drawing upon existing literature to examine the impacts of CFDI on industrial growth, this study employs Sen’s slope method [64] and the Mann–Kendall (M–K) test to analyze trends in Chinese industrial investment, total industrial output, total industrial FDI, and domestic company performance [65,66]. In order to calculate the trends and significance of the trends, the study employed a non-parametric estimator, Sen’s slope [64], and the M–K test [65,66] that detects the presence of the trend in time series against the null hypothesis of no trend. The M-K trend test is commonly used for data analysis because it is a non-parametric test, meaning it is applicable to any data distribution, unlike other trend tests that require a specific order of the data. Additionally, the modified (sequential) M-K trend test [67], an adaptation of the original M-K test, is used to detect non-linearity. This modification can identify trends throughout a time series, providing more detailed information on how trends change over a specific period of time or across years. The M-K trend test is advantageous because it can be used for both linear and non-linear trend analysis. The test statistic S in M–K is calculated using the following equation:
where and are the annual values for the and terms and is the sample size. is calculated as
To detect the trend, a hypothesis is set as follows: the null hypothesis () signifies no trend. The alternative hypothesis () signifies the presence of a trend, either an increasing or decreasing trend. If the sample size is greater than or equal to 10, the S-statistic approximately acts like a normal distribution, and the test is accomplished with a normal distribution with the mean and its variance calculated as follows:
The probability associated with S and the sample size n is calculated to assess the significance of the trend. The standard normal distribution (Z-statistic) depicts the significance of the trend where it is positive or negative. The standard normal distribution is computed as follows:
In a two-tailed test, at a given α level of significance, ( is accepted if , where is calculated from the standard normal distribution tables. The significance of the present study will be presented using the p-values calculated by evaluating values. In addition, a non-parametric method (Sen’s slope estimator) was applied to calculate the magnitude of the observed trends. Sen’s slope calculates both the linear rate of change and associated confidence levels, expressed as:
Here, and are the values at times and , where is greater than , and Q is a slope. Furthermore, the sequential M–K test was applied to detect abrupt changes in detected trends [67]. This approach considers forward, , and backward, , sequential statistics. It also compares the relative magnitude of data as opposed to the data values themselves. The forward sequential statistic is standardized with a unit standard deviation and a mean of zero. In the display of the sequential M–K test, the upper and lower confidence limits are +1.96 and −1.96. When the progressive M–K values cross these limits, it suggests a significant abrupt change at .
3.2. Two-Step System GMM
According to the nature of the secondary data referencing 16 industrial sectors of CFDI, this study employs the two-step system GMM for estimating the BRI’s impact on the GDP and GGDP of Bangladesh. Additionally, this empirical estimation approach also employs fixed and random effects. This scholarly assessment process forms the following econometric model based on the two-step system GMM.
This research estimates Models (7) and (8) using the two-step system GMM estimation approach, which can solve the endogeneity problem resulting from the non-zero relationship between potential endogenous factors and the error term, as well as the presence of non-constant variance, while it is permitting for unobserved heterogeneity. Due to the substantial existence of some primary variables, we choose the two-step system GMM estimator over the first-difference GMM estimator. In the presence of highly persistent independent variables, the lagged-level variables are poor instruments, as emphasized by previous studies [68,69]. As a result, the first-difference GMM, which uses lagged level variables as instruments, has significant finite sample biases. In the meantime, in terms of lower bias and higher efficiency, the system GMM estimator outperforms the first-difference GMM estimator [70]. This research uses Windmeijer’s finite sample adjustment to alleviate the strong downward bias in the standard errors of the two-step system GMM estimates during the empirical estimation process [71]. The empirical estimation also conducts the Hansen J test [72] to validate the instruments, and the Arellano and error autocorrelation tests [73] of order 1 and order 2 have been employed for the consistency of the estimated results.
In this study, a two-period lag of the independent variables is applied for the estimation process because, in economic models, FDI is frequently endogenous due to the possibility of unobserved inputs or reverse causality (e.g., economic growth attracting FDI). Lagged values of endogenous variables are employed as tools in system GMM to deal with this problem. In order to meet the instrument exogeneity criteria, a two-period lag is usually selected because it is both relevant to the variable being instrumented and far away enough to be uncorrelated with the current error term [73]. Instruments are needed to manage the correlation between the lagged variables and the error term when lagged dependent variables and additional explanatory variables, such as FDI, are included in dynamic panel models. Because it strikes a compromise between exogeneity and instrument strength (relevance), the two-period lag is frequently employed in the system GMM. While a one-period lag may still be associated with the error term, lags of more than two periods may reduce the instrument’s significance [69]. Using lagged differences as instruments for levels and lagged levels as instruments for differences, the system GMM integrates equations in levels and initial differences. Because it is uncorrelated with the differenced error term, assuming no serial correlation, a two-period lag of FDI is frequently employed, guaranteeing good instruments [68]. Because FDI decisions are impacted by historical economic conditions, a two-year lag is frequently justified in empirical studies including FDI. This avoids the problem of weak instruments while capturing the delayed effect. This is especially important in investment or growth models where foreign direct investment has a long-lasting impact [68,69,74,75,76]. The Sargan or Hansen test for over identifying limitations can be used to experimentally validate the use of a two-period lag. These tests determine if the instruments are exogenous, including the two-period lag of FDI. The two-period lag is appropriate if the test does not reject the null hypothesis [77,78].
3.3. Variables
3.3.1. Data Description
For trend analysis, the total domestic companies, CFDI, four industrial sectors’ total FDI, and their output data from 1996 to 2020 are used with an exception in the gas consumption proxy of energy sector output due to data unavailability. Data are sourced from Bangladesh Bank and CEIC.
Moreover, this study conducted GMM analysis on 16 sectors (Agriculture and Fishing, Banking, Cement, Chemicals and Pharmaceuticals, Computer Software and IT, Construction, Fertilizer, Food, Gas and Petroleum, Leather and Leather Products, Metal and Machinery Products, Other Sectors, Power, Telecommunications, Textile and Wearing, and Trading) of Bangladesh covering the period 2013 to 2022 of Chinese foreign direct investment (CFDI) to measure the role of the BRI in economic development of Bangladesh. Those sectors are crucial for Bangladesh’s economy because they encompass a wide range of economic events and domestic policies, including regional financial crisis, significant shifting economic policies, COVID-19 crisis, geopolitical dynamics, and domestic political dynamics. Data is collected from Bangladesh Bank, Ministry of Finance of Bangladesh, and the World Bank [79,80,81]. A detail of all variables are presented in Table 1.

Table 1.
A detailed explanation of all used variables.
3.3.2. Dependent Variables
Industrial growth. Three indicators of number of local companies, total output, and total industrial sectoral FDI compared to CFDI in four sectors (manufacturing, energy, construction, and information, communication and technology (ICT)) are used as dependent variables. At present, there are more than 670 Chinese companies registered in Bangladesh [83], and the literature suggests that energy, manufacturing, ICT, and construction are some major sectors within which local companies in Bangladesh are encouraged to collaborate with China [84]. Hence, the present study analyzes the implication of the BRI (CFDI) in these sectors of Bangladesh. For industrial output, manufacturing output (manufacturing), gross domestic product (GDP) from construction (construction), mobile users (ICT), and gas consumption (energy) are considered as dependent variables.
Gross domestic product. Gross domestic product (GDP) represents the monetary value of all final goods and services produced within a country’s borders over a specified period (typically quarterly or annually). It includes market transactions and certain non-market outputs, such as government-provided education and defense [85]. Growth analysis necessitates measuring a country’s GDP, as it reveals the key drivers of economic expansion. Theoretically, GDP can be assessed using two principal methods—the expenditure approach and the income approach. The expenditure approach calculates GDP based on total spending on final goods and services, incorporating personal consumption, investment, government spending, and net exports. Conversely, the income approach aggregates incomes earned by households and firms, including wages and corporate profits. While both rely on distinct data sources, slight discrepancies may arise, prompting statistical adjustments to reconcile the two. However, the absence of a unified formula linking the two approaches limits a comprehensive understanding of GDP measurement and its role in modeling economic growth [86].
Green gross domestic product. In the shift towards sustainable development, the focus has moved away from simply pursuing faster economic growth to prioritizing a higher standard of human well-being that is equitably shared and sustainable [87]. Green gross domestic product (GGDP) modifies the conventional GDP by incorporating environmental costs and benefits, such as pollution reduction, resource depletion, and changes in ecological quality [88]. This approach reflects the recognition that economic activity is inherently linked to the natural environment and that sustainable development necessitates a balance between economic growth and environmental stewardship [89,90]. A major advancement in this area is the United Nations’ System of Environmental-Economic Accounting (SEEA), which provides a standardized framework for integrating environmental indicators into national economic accounts [91]. Complementary to this, the World Bank’s “Adjusted Net Savings” (ANS) indicator [92] and the “Ecological Footprint,” developed by the Global Footprint Network [93], offer additional tools for measuring sustainability. The latter quantifies human demand on natural resources in terms of land area and productivity, while biocapacity represents an ecosystem’s ability to regenerate resources and absorb waste [94]. In a nutshell GGDP is an alternative economic indicator that accounts for the environmental costs, including resource depletion cost, environmental pollution cost, and environmental improvement cost. It adjusts traditional GDP by deducting these environmental costs, offering a way to quantify the monetary impact of economic progress on the environment [82].
3.3.3. Independent Variables
Chinese foreign direct investment (CFDI). A key indicator for assessing the impact of the BRI on Bangladesh’s industrialization is Chinese foreign direct investment (CFDI). This study evaluates CFDI flows across the four abovementioned major sectors over the period from 1996 to 2020 using trend analysis. Furthermore, the contribution of CFDI to sustainable development is analyzed across sixteen designated sectors (mentioned above), employing a two-step system generalized method of moments (GMM) estimation approach over the course of 2013–2022.
3.3.4. Control Variables
For avoiding endogeneity and multicollinearity, this study selected the following control variables with proper justification. Additionally, to maintain model parsimony and avoid overfitting, only the variables that were most empirically supported and pertinent to policy were included.
International trade. International trade is widely recognized as another key driver of sustainable development [95]. Former GATT Director-General Arthur Dunkel emphasized that trade is not the goal of environmentally sustainable economic development but a powerful enabler [96].
Trade openness (TO). TO is significantly reduces GGDP in India and widens the gap between GDP and green GDP [97]. Similarly, data from 81 countries and 19 South Asian countries indicate that trade openness is linked to slower GDP growth [98,99]; additionally, trade openness has a notably beneficial effect on economic growth regarding the study of five emerging market economies [100].
Exchange rate (ER). The economic growth of a developing country is highly affected by the fluctuations in ER [101], and there is a positive relationship between the ER and economic growth is validated in both the short run [102] and long run [103], mainly for developing countries [104,105,106].
Consumer price index (CPI). CPI is an index number that measures the price of goods and services that are always used by consumers or households usually used to measure the rate of inflation, which also affects the GDP of a country [107,108,109,110].
4. Results and Discussion
4.1. BRI and Industrial Trend in Bangladesh
Today China is the largest business and trade partner of Bangladesh and the annual bilateral trade between the two countries was around USD 24 billion in 2023 [111] and placed in the top position with 14.57% of total bilateral trade considering both export and import [112]. In 2021, China exported USD 24.1 billion worth of goods to Bangladesh, up from USD 652 million in 1995 [113] and in 2024 the percentage was 25.20% [112]. Now China provides a number of benefits for exports with Bangladesh and duty-free export advantages are among of them. Bangladesh exported an additional 5161 products to China for duty-free benefits and the total number of products China received was 8256 in 2020, including items accepted by the Asia Pacific Trade Agreement (APTA) [114].
In Bangladesh, industrialization—particularly in sectors like textiles, apparel, leather, pharmaceuticals, and shipbuilding—presents a strategic path for increasing GDP, per capita income, and social productivity. This shift supports economic development by generating employment, improving living standards, reducing reliance on foreign resources, and fostering technological advancement [115]. The government is consistently implementing comprehensive measures to develop and promote various industrial sectors, including manufacturing, fuel and energy, agriculture and forestry, mineral extraction and processing, tourism and services, construction, and ICT-based industries, to ensure sustainable economic growth and national energy security. Hence, to accelerate the pace of industrialization in the country, the government announced the “National Industrial Policy 2016.” The key objectives of this policy include promoting green growth and SDGs [116].
Inclusive industrial growth can be seen after 2010 (Figure 1a), with an abrupt increase in 2016 (Figure 1b), the same year of joining the BRI, through the generation of productive employment to create new entrepreneurs, mainstreaming women in the industrialization process, and international market linkage creation in the form of domestic company numbers. This growth has been characterized by an expansion in productive employment opportunities, which have not only absorbed surplus labor from agrarian sectors but also contributed to the emergence of new entrepreneurs, particularly among youth and returnee migrants [117]. A key dimension of this industrialization process has been the mainstreaming of women into the formal industrial labor force. In sectors such as ready-made garments (RMGs), textiles, and light manufacturing, the participation of women has notably increased, due in part to policy interventions aimed at enhancing gender equity in employment and improving access to skills training, finance, and social protection [118].
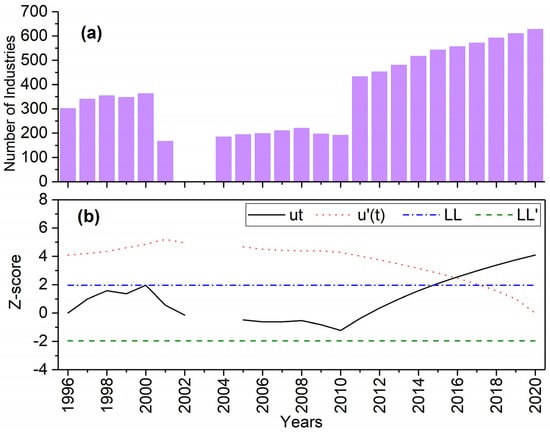
Figure 1.
(a) Trend of Number of Industries, (b) an abrupt change in number of industries derived from sequential Mann–Kendal test statistic. Ut is forward sequential while U′t is backward sequential statistic. LL and LL′ are the confidence limits at ±1.96 (α = 5%), significance of CFDI in sub-sectoral industrial total FDI trend.
Moreover, Bangladesh’s integration into the BRI has facilitated international market linkages by enhancing transport and logistics infrastructure, modernizing port facilities, and improving cross-border connectivity. These developments have enabled domestic enterprises—especially small and medium-sized enterprises (SMEs)—to enter global value chains, as reflected in the notable increase in the number of registered industrial and export-oriented companies’ post-2016 [119]. The resultant formalization and diversification of the industrial base mark a significant step toward sustainable and inclusive economic transformation.
The post-2016 surge in industrial dynamism, marked by inclusive employment generation, entrepreneurial expansion, gender integration, and global market access, suggests that BRI participation has acted as a critical catalyst in reshaping Bangladesh’s industrial landscape toward greater inclusivity and resilience. Thus, the present study suggests the existence of an inflection point in the industrialization process, which aligns well with the methodological framework of event studies. This approach is commonly applied in case studies of emerging markets [120], helping to identify significant turning points and assess their impact on economic development. By incorporating this method, the study provides a deeper understanding of how specific events or policy interventions influence industrial growth trajectories in developing economies.
The time series data (Figure 2) [13,121] on industrial sector-based CFDI indicates that the BRI has significantly influenced the manufacturing and energy sectors, particularly in 2018—two years after joining the initiative—when CFDI reached the highest amount of investment of USD 1159.42 million. This investment had a substantial effect on annual FDI in both sectors, with manufacturing seeing the greatest boost. In contrast, by 2022, CFDI had a notable impact on the ICT sector.
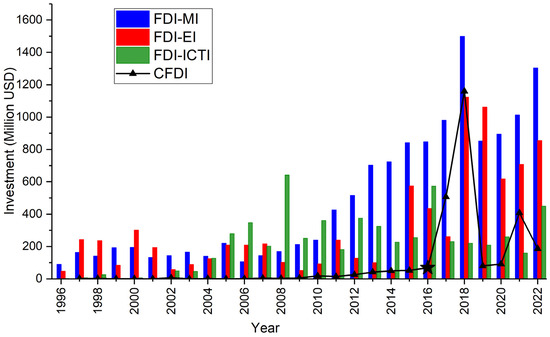
Figure 2.
Trends of industrial-sector-based FDI and Chinese FDI in Bangladesh. (FDI refers to foreign direct investment, CFDI refers to Chinese foreign direct investment, MI refers to investment in manufacturing, EI refers to investment in energy, and ICTI refers to investment in information and communication technology).
Our trend analysis shows that CFDI began reaching a significant upward trend around 2010–2011, well before Bangladesh joined the BRI in 2016, and its significance has continued to rise without disruption (Figure 3a). This can be viewed as an early manifestation of China’s evolving global investment policy, which later became more systematically institutionalized under the BRI framework. This early wave of investment was largely shaped by China’s “Go Global” (走出去) policy, which, since the early 2000s, encouraged Chinese enterprises to internationalize in order to secure new markets, access resources, and optimize production costs in response to rising wages and economic restructuring at home [81]. Bangladesh, with its competitive labor costs, growing industrial base, and advantageous geographic location along the Bay of Bengal, was well-positioned to attract such outward investment. In parallel, the Government of Bangladesh undertook several proactive policy measures—such as offering fiscal incentives, establishing special economic zones (SEZs), and liberalizing trade and investment regulations—to attract foreign capital, especially in the manufacturing and infrastructure sectors [122]. These developments converged with China’s strategic interests in building logistical and economic corridors that would later be formalized under the BRI. Importantly, the investments made during this pre-BRI period laid critical groundwork for future BRI-linked projects by strengthening bilateral ties and establishing Chinese commercial presence in key sectors such as energy, construction, and transport. Moreover, early bilateral cooperation agreements—including the signing of MoUs in 2010—signaled a shared long-term vision between the two countries that anticipated greater connectivity and integration [123]. The BRI, officially launched in 2013 and embraced by Bangladesh in 2016, subsequently provided a cohesive economic platform that absorbed and accelerated these earlier trends. As such, the early rise of CFDI in Bangladesh reflects not an isolated phenomenon but a considered continuity that foreshadowed the deeper infrastructural and industrial integration envisioned under the BRI [124].
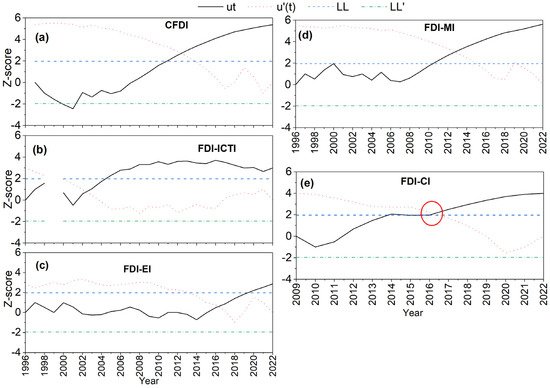
Figure 3.
An abrupt change in (a) China’s amount of foreign direct investment (FDI), contribution of FDI to (b) investment in information and communication technology (ICTI), (c) investment in energy (EI), (d) investment in manufacturing (MI), and (e) investment in construction (CI) derived from sequential Mann–Kendal test statistic. Ut is forward sequential while U′t is backward sequential statistic. LL and LL′ are the confidence limits at ±1.96 (α = 5%).
The analysis also reveals that sectoral FDI had a substantial impact on the energy sector (in 2020), while manufacturing saw this impact even earlier, in 2010 significantly and in 2013 abruptly, linked to the significance of CFDI. The construction sector, closely aligned with CFDI trends, reached both significant and abrupt points precisely in the same year as Bangladesh’s entry into the BRI. In contrast, the ICT sector has been the least affected by CFDI, with a notable shift occurring as early as 2004—long before CFDI’s influence became significant—though its trend has maintained steady growth above the significance level.
Our results also indicate a strong connection between industrial output and CFDI in Bangladesh. As shown in Figure 4, when CFDI reached significance from 2010–2011 (Figure 3a), output from the manufacturing sector and GDP from construction had already surpassed the significance level in the same period and continued upward, indicating the influence of Chinese investment. Additionally, the number of mobile users rose above the significance level around the same time, further highlighting CFDI’s role. However, gas consumption reached significance in 2006, suggesting only a minor role for CFDI in this sector. In summary, the results emphasize CFDI’s substantial impact on manufacturing output, GDP from construction, and the ICT sector, while its role in the energy sector appears negligible. Despite substantial CFDI in Bangladesh’s energy sector, its limited impact on energy output is largely attributed to corruption, weak governance, and implementation delays [125]. Transparency International Bangladesh (TIB) reported that over BDT 390 crore was misappropriated in just three projects due to inflated land costs and non-competitive bidding [126]. For example, several key projects have shown financial progress of less than 15% over multiple years [127]. Additionally, high-cost power agreements, like the USD 500 million owed to India’s Adani Group, have strained public finances, prompting reassessment of investment strategies, including with China [128]. These issues collectively blunt the effectiveness of CFDI in improving Bangladesh’s energy infrastructure.
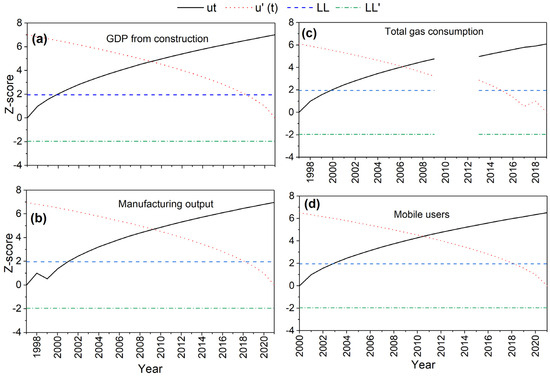
Figure 4.
An abrupt change in (a) GDP from construction, (b) Manufacturing output, (c) Total gas consumption, (d) Mobile users derived from sequential Mann–Kendal test statistic. Ut is forward sequential while U′t is backward sequential statistic. LL and LL′ are the confidence limits at ±1.96 (α = 5%).
4.2. Two-Step Generalized Method of Moments (GMM) Analysis
4.2.1. Summary Statistics
The descriptive statistics are presented in Table 2. The minimum and maximum FDI are BDT 0 and BDT 838 × 106, respectively.
Table 2.
Descriptive Statistics.
The Pearson correlation matrix is presented in Table 3. The Chinese FDI is positively correlated to Bangladesh’s GDP and GGDP. Almost all variables are positive and significantly associated with each other except trade openness (TO), which showed negative relation with other variables.
Table 3.
Correlation Matrix.
4.2.2. Result Analysis: GMM
According to the estimated results in Table 4, this study uses the fixed effect (FE) and random effect (RE); however, we could not accept the null hypothesis at a 5% level of significance regarding the Hausman test result (). It concludes that the RE should be considered here. Chinese FDI (lagged 2) may impact Bangladesh’s GDP positively, but the estimated result is not statistically significant.
Table 4.
Results of Classical and Dynamic Panel Data Analysis of GDP.
The control variable CPI (lagged 2) may increase the GDP, and the finding is highly statistically significant. This means that higher inflation motivates the producer to increase their production level, leading to a GDP rise. In addition, the official exchange rate (lagged 2) and trade openness (lagged 2) may reduce Bangladesh’s GDP, and the findings are statistically significant at a 1% level. The production sector of Bangladesh is mainly dependent on imported raw materials [129,130,131,132,133,134,135], so a rise in the exchange rate may reduce Bangladesh’s GDP. Similarly, interestingly, the trade openness of Bangladesh’s economy may reduce the GDP due to illegal money flight through export [136,137].
The two-step system GMM model is conducted to examine the impact of Chinese FDI on Bangladesh’s GDP using the econometric model (Equation (1)), and the result is shown in Table 4. The estimated result does not suffer from serial correlation regarding the AR 1 (Pr > z = 0.054) and AR 2 (Pr > z = 0.733) tests, and we fail to reject the null hypothesis. According to the Sargan (Prob > chi2 = 0.067) and Hansen tests (Prob > chi2 = 0.503), the instruments are valid for the two-step system GMM estimation, and we may not reject the null hypothesis at a 5% level of significance. The dynamic term in Table 4 column 4, lagged dependent variable, of the two-step system GMM is highly statistically significant. Our estimated result of key variable Chinese FDI (lagged 2) increases Bangladesh’s GDP, and the finding is statistically significant at a 1% level. This result indicates that GDP is influenced by CFDI which basically rejects our null hypothesis (H0a). The control variable CPI (lagged 2) raises the GDP, and the finding is highly statistically significant. Higher inflation motivates the producer to increase their production level, leading to a rise in GDP. Additionally, the official exchange rate (lagged 2) and trade openness (lagged 1) reveal the reduction of the GDP of Bangladesh, and the findings are statistically significant at 1% and 5% levels, respectively.
These results are significantly different from the former findings in Bangladesh [114,138] due to different methods and variables. Possibly, previous studies suffered from the problem of endogeneity or data limitations. To overcome these problems, the study uses industry-level panel data instead of time series data and, for addressing endogeneity, a two-step GMM is applied.
In addition, Bangladesh’s ready-made garment (RMG) industry accounts for approximately 84.58% of the nation’s overall export revenue [121]. The production sector in Bangladesh heavily relies on imported raw materials [129,130,131,132,133,134,135], meaning that an increase in the exchange rate can negatively impact the country’s GDP. Additionally, the trade openness of Bangladesh’s economy may also lead to a decrease in GDP, as illegal money outflows through exports could be a contributing factor [136,137].
In contrast (Table 5), this research also examines the impact of Chinese FDI on Bangladesh’s green GDP, and the result is shown in Table 5 using the econometric model, Equation (2). The study uses the fixed effect (FE) and random effect (RE); however, we could not accept the null hypothesis at a 5% level of significance regarding the Hausman test result () and conclude that the RE should be considered here.
Table 5.
Results of Classical and Dynamic Panel Data Analysis of GGDP.
In Table 5 column 4, the estimated result does not suffer from serial correlation regarding the AR 2 (Pr > z = 0.297) tests, and we fail to reject the null hypothesis at a 5% level of significance. According to the Hansen test (Prob > chi2 = 0.167), the instruments are valid for the two-step system GMM estimation, and we may not reject the null hypothesis at a 5% level of significance. The dynamic term lagged dependent variable of the two-step system GMM is statistically significant at a 10% level. Chinese FDI (lagged 2) impacts Bangladesh’s GGDP positively, and the estimated result is statistically significant. The findings demonstrate a strong effect of CFDI on GGDP, which necessitates the rejection of the second hypothesis (H0b).
Bangladesh has become a global leader in the production of sustainable clothing, with 244 RMG factories certified by the Leadership in Energy and Environmental Design (LEED) program of the U.S. Green Building Council. Remarkably, Bangladesh is home to 68 of the top 100 LEED-certified factories worldwide, including 9 of the top 10 and 18 of the top 20. This accomplishment shows how far the nation has come in adopting environmentally friendly manufacturing practices. Additionally, 550 more clothing companies are reportedly in the process of obtaining LEED certification, according to industry sources, highlighting the industry’s strong momentum toward green transformation [139]. Through direct participation and significant investments in economic zones, more than 300 Chinese businesses are bolstering 529 Bangladesh’s eco-friendly textile and apparel industry, with more than 150 sizable businesses currently functioning or preparing to do so [140,141].
The control variables CPI (lagged 2) and official exchange rate (lagged 2) may increase the GGDP, and the finding is highly statistically significant. This means that higher inflation motivates the producer to increase their production level, leading to a GGDP rise. In addition, the official exchange rate may increase the GGDP of Bangladesh because most of the exported goods are produced using environmentally friendly materials that meet the foreign buyers’ requirements [142,143,144]. Additionally, the trade openness (lagged 1) may reduce Bangladesh’s GGDP, and the finding is statistically insignificant due to export-based money laundering abroad [136,137]. The production sector of Bangladesh primarily relies on imported raw materials [129,130,131,132,133,134], which means that an increase in the exchange rate negatively affects Bangladesh’s GGDP.
This empirical estimation explores an interesting result that Chinese FDI may have a higher impact in increasing GGDP than the GDP of Bangladesh. According to the estimated results of the two-step system GMM in Table 3 and Table 4, the FDI coefficients are 0.0146 and 0.0350, respectively. Additionally, the dynamic term of the two-step system GMM indicates that any disequilibrium in GDP and GGDP may increase each year, and GGDP may converge faster than GDP due to the coefficients of GDP and GGDP being 0.1800 and 0.6027, respectively.
4.2.3. Discussion of Result
The study investigates the potential role of CFDI in facilitating green industrialization and growth in Bangladesh and our findings suggest that CFDI supports Bangladesh’s commitment to achieving the Sustainable Development Goals (SDGs), particularly SDG 7 (affordable and clean energy) and SDG 9 (industry, innovation, and infrastructure). Empirical evidence points to that CFDI plays a substantial role in promoting green growth, particularly through investments in the renewable energy sector, which are crucial for reducing the country’s dependence on fossil fuels [145].
Moreover, the BRI has provided Bangladesh with an opportunity to build infrastructure that enhances energy efficiency, thus reducing carbon emissions and supporting sustainable development [112]. In addition to the direct investment in infrastructure, CFDI also facilitates the transfer of green technologies to Bangladesh, providing critical tools for advancing environmental sustainability. By facilitating the diffusion and adoption of green technologies, CFDI not only accelerates the transition toward environmentally responsible industrial practices but also contributes to the establishment of a green growth model that harmonizes economic expansion with ecological stewardship. This aligns with the conclusions of Liu et al. [28] who emphasize that environmentally conscious FDI can serve as a catalyst for industrial structure upgrading by integrating sustainable practices into domestic industrial system.
Furthermore, the results of this study suggest that CFDI has the potential to significantly bolster the performance of the manufacturing sector. These dynamics may also lead to positive employment effects by creating new job opportunities within emerging green industries and associated supply chains. This observation is consistent with the findings of Chen et al. [15], who argue that foreign investment, particularly from China, has a demonstrable capacity to generate employment and support inclusive economic development in host countries.
Collectively, these outcomes underscore the multifaceted influence of Chinese foreign direct investment (CFDI), which not only accelerates the transition toward advanced industrial structures through technology transfer and capacity building but also aligns with broader environmental objectives by fostering green innovation, low-carbon infrastructure, and sustainable resource utilization. This dual contribution positions CFDI as a strategic driver of both economic transformation and long-term ecological resilience in host countries.
4.2.4. Robustness of the Result
The study applies the GMM to check the robustness of the models. The two-step first-difference GMM takes care of the issue of endogeneity, including heterogeneity. Table 6 reveals that Chinese FDI has a significant influence on Bangladesh’s GDP. The reason is that China makes investments in infrastructural development, manufacturing, and textile industries. Through this FDI, it diffuses technologies, resulting in economic growth in Bangladesh. The finding corroborates our previous result. Similarly, the consumer price index contributes to increasing GDP due to rising prices, which increase nominal GDP in Bangladesh. However, the lagged exchange rate and trade openness both have a negative impact on GDP. Depreciation of currency enhances the import cost, because of its export depending on imported raw materials, which ultimately reduces the net export and GDP. Additionally, trade openness, in the short run, creates a challenging environment, where Bangladeshi domestic industries possibly lose the market share to international firms. It appears there is a negative consequence of trade openness on GDP.
Table 6.
Two-step first-difference GMM: GDP.
For the robustness of our findings, the two-step first-difference GMM reveals that Chinese FDI has a dominant impact to enhance the green GDP in Bangladesh, reported in Table 7. Chinese investment in renewable sectors with cheaper green technology helps to improve the green GDP in Bangladesh. This FDI, overall, reduces the reliance on fossil fuel, which degrades the environmental quality and hampers sustainable development.
Table 7.
Two-step first-difference GMM: Green GDP.
5. Contributions and Policy Implications
This study offers a comprehensive empirical examination of Chinese foreign direct investment (CFDI) in Bangladesh over the period from 1996 to 2022, applying a hybrid methodological approach that integrates Mann–Kendall (M-K) trend analysis and the two-step system generalized method of moments (GMM) estimation technique. The Mann–Kendall test, a robust non-parametric method for detecting monotonic trends in time-series data, is employed for the period 1996 to 2020 to trace the temporal evolution of CFDI inflows. This facilitates a comparative analysis of the pre- and post-Belt and Road Initiative (BRI) periods in relation to their respective contributions to domestic industrial growth. Meanwhile, the two-step system GMM estimation is applied to the 2013–2022 period, aligning with the formal inception of the BRI, to rigorously assess the causal relationship between CFDI and sustainable development indicators.
The analysis highlights a pivotal shift in investment dynamics around 2010, marked by a significant acceleration of CFDI, especially in the manufacturing, energy, and ICT sectors. The surge in CFDI from 2011–2012 was partly driven by Bangladesh’s economic liberalization policies aimed at attracting foreign investment and reflected early deliberate initiatives aligned with China’s expanding economic diplomacy. These initial engagements laid the essential groundwork that was subsequently formalized and greatly expanded under the BRI. This increase in investment is closely linked to China’s strategic involvement through BRI-related projects, which have acted as a conduit for large-scale infrastructure development and industrial modernization in Bangladesh.
The empirical results reveal that industrial CFDI has a consistently positive and statistically significant impact on both gross domestic product (GDP) and green GDP (GGDP). Interestingly, the effect on GGDP—a composite measure that captures the intersection of economic growth and environmental sustainability—is even more pronounced than on conventional GDP. This finding indicates that the influx of Chinese investment has not only enhanced Bangladesh’s industrial and economic output but has also facilitated a transition toward greener, more sustainable industrial practices. Export-oriented sectors, in particular, have benefited from the adoption of environmentally efficient technologies and compliance with international sustainability standards, amplifying the overall developmental impact of CFDI. Hence, the study concludes that BRI-induced CFDI plays a dual role: stimulating conventional industrial growth while simultaneously advancing the country’s green development agenda.
This study makes several key contributions to the literature and policy discourse. First, it provides empirical evidence of CFDI’s differentiated impact on green growth versus overall economic expansion, underscoring the role of sustainable industrial practices in maximizing FDI benefits. Unlike previous studies that primarily focus on FDI’s general economic impact, this research explicitly quantifies the green growth effects of CFDI, contributing new insights into the intersection of foreign investment and sustainability in developing economies. Second, methodologically, the study integrates the M-K trend analysis with two-step system GMM, offering a robust framework for analyzing long-term investment trends while addressing endogeneity concerns. The use of the M-K test in the context of CFDI flows is a novel approach that can serve as a model for similar analyses in other developing economies. Third, by situating its analysis within the framework of the BRI, the study enhances the understanding of how international economic initiatives drive sector-specific growth. It provides nuanced insights into how BRI-facilitated investments are shaping Bangladesh’s industrial landscape, particularly in sustainable development.
The findings of this study carry critical policy implications for both Bangladesh and China, particularly in the context of the BRI and the increasing trend of CFDI in Bangladesh’s industrial sectors. Given the BRI’s demonstrated role in accelerating FDI growth in Bangladesh’s manufacturing, construction, and energy sectors, national industrial strategies should be aligned with BRI objectives to attract further investments. Sector-specific incentives should be designed to channel FDI into underdeveloped industries that support long-term green growth goals, ensuring that economic expansion is both inclusive and environmentally sustainable. Furthermore, the sustained growth of CFDI—even before the formal launch of the BRI—indicates that Bangladesh must continue enhancing its infrastructure, regulatory efficiency, and institutional frameworks to maintain and expand its attractiveness to foreign investors. Streamlining regulatory processes and reinforcing investor-friendly policies will be crucial in sustaining CFDI momentum.
Although this study could not isolate the direct effects of COVID-19, its findings suggest that CFDI in Bangladesh has shown resilience. This resilience should be leveraged in post-pandemic recovery strategies, with a focus on attracting green and sustainable investments. By fostering an investment climate that balances economic expansion with environmental sustainability, Bangladesh can maximize the long-term benefits of CFDI and position itself as a leader in sustainable industrial growth within the BRI framework.
Author Contributions
Writing—original draft preparation, S.N.A.; writing—review and editing, M.S., M.S.U., and M.M.H.; supervision, S.B. All authors have read and agreed to the published version of the manuscript.
Funding
This research was funded by the National Natural Science Foundation of China (Grant nos. 41971340, 41271410 and 42050410321).
Institutional Review Board Statement
Not applicable.
Informed Consent Statement
Not applicable.
Data Availability Statement
The data used in this paper are available upon request from the corresponding author.
Conflicts of Interest
The authors declare no conflicts of interest.
References
- Johnston, L.A. The Belt and Road Initiative: What Is in It for China? Asia Pac. Policy Stud. 2019, 6, 40–58. [Google Scholar] [CrossRef]
- Du, J.; Zhang, Y. Does One Belt One Road Initiative Promote Chinese Overseas Direct Investment? China Econ. Rev. 2018, 47, 189–205. [Google Scholar] [CrossRef]
- Chen, M.X.; Lin, C. Foreign Investment Across the Belt and Road: Patterns, Determinants, and Effects; World Bank: Washington, DC, USA, 2018. [Google Scholar] [CrossRef]
- Almfraji, M.A.; Almsafir, M.K. Foreign Direct Investment and Economic Growth Literature Review from 1994 to 2012. Procedia Soc. Behav. Sci. 2014, 129, 206–213. [Google Scholar] [CrossRef]
- Iamsiraroj, S. The Foreign Direct Investment–Economic Growth Nexus. Int. Rev. Econ. Financ. 2016, 42, 116–133. [Google Scholar] [CrossRef]
- Alfaro, L.; Chanda, A.; Kalemli-Ozcan, S.; Sayek, S. Does Foreign Direct Investment Promote Growth? Exploring the Role of Financial Markets on Linkages. J. Dev. Econ. 2010, 91, 242–256. [Google Scholar] [CrossRef]
- Kim, H.H.; Lee, H.; Lee, J. Technology Diffusion and Host-Country Productivity in South–South FDI Flows. Jpn. World Econ. 2015, 33, 1–10. [Google Scholar] [CrossRef]
- Yue, S.; Yang, Y.; Hu, Y. Does Foreign Direct Investment Affect Green Growth? Evidence from China’s Experience. Sustainability 2016, 8, 158. [Google Scholar] [CrossRef]
- Hanson, G.H. Should Countries Promote Foreign Direct Investment? In G-24 Discussion Paper Series; United Nations Conference on Trade and Development, United Nations Center for International Development, Harvard University: Cambridge, MA, USA, 2001. [Google Scholar]
- Görg, H.; Greenaway, D. Much Ado about Nothing? Do Domestic Firms Really Benefit from Foreign Direct Investment? World Bank Res. Obs. 2004, 19, 171–197. [Google Scholar] [CrossRef]
- Alfaro, L. Foreign Direct Investment and Growth. In Does the Sector Matter? Mimeo, Harvard Business School: Boston, MA, USA, 2003. [Google Scholar]
- Lean, H.H. The Impact of Foreign Direct Investment on the Growth of the Manufacturing Sector in Malaysia. Int. Appl. Econ. Manag. Lett. 2008, 1, 41–45. [Google Scholar]
- Akter, S.N.; Bi, S.; Qiu, X.; Sarker, M.N.I. Technological Prospects of Belt and Road Initiative in Bangladesh. Heliyon 2023, 9, e17549. [Google Scholar] [CrossRef]
- Jiang, M.; Luo, S.; Zhou, G. Financial Development, OFDI Spillovers, and Upgrading of Industrial Structure. Technol. Forecast. Soc. Change 2020, 155, 119974. [Google Scholar] [CrossRef]
- Chen, Y.; Sun, I.Y.; Ukaejiofo, R.U.; Xiaoyang, T.; Brautigam, D. Learning from China? Manufacturing, Investment, and Technology Transfer in Nigeria; Discussion Paper-01565, Development Strategy and Governance Division; IFPRI: Washington, DC, USA, 2016. [Google Scholar]
- Ross, A.G.; Fleming, N. The Impact of Chinese Foreign Direct Investment on Host Country Economic Growth. J. Dev. Stud. 2023, 37, 6. [Google Scholar] [CrossRef]
- Sattar, A.; Hassan, A.; Hussain, M.N.; Sakhi, U.; Elahi, A.R. Impact of Foreign Direct Investment on Socio-Economic Development in Belt and Road Countries. Cogent Econ. Financ. 2022, 10, 2143772. [Google Scholar] [CrossRef]
- Islam, S.; Fei, X.Y.; Kumar, R. The Role of Chinese Foreign Direct Investment (FDI) in Accelerating the Economic Growth of Bangladesh. IOSR J. Bus. Manag. 2020, 22, 17–25. [Google Scholar]
- Reza, S.M.; Fan, H.; Reza, T.; Wang, B. The Impact of Foreign Direct Investment Inflows on Economic Growth: Evidence from Bangladesh. J. Bus. Retail. Manag. Res. 2018, 12, 2. [Google Scholar] [CrossRef]
- Rahman, A. Impact of Foreign Direct Investment on Economic Growth: Empirical Evidence from Bangladesh. Int. J. Econ. Financ. 2015, 7, 178. [Google Scholar] [CrossRef]
- Ahmed, C.M. Analyzing the Future of the Bangladesh-China-India-Myanmar Economic Corridor and Its Impacts on Bangladesh’s Trading System. Master’s Thesis, University of Dhaka, Dhaka, Bangladesh, 2021. [Google Scholar]
- Hossain, S.M.; Hosoe, N. Foreign Direct Investment in the Readymade Garment Sector of Bangladesh. Bangladesh Dev. Stud. 2020, 43, 1–34. [Google Scholar]
- Mashrafy, M.; Ullah, R. Impact of the Belt and Road Initiative on China-Bangladesh Economic Relations. Int. J. Soc. Polit. Econ. Res. 2024, 11, 165–179. [Google Scholar] [CrossRef]
- Ma, S. Growth Effects of Economic Integration: New Evidence from the Belt and Road Initiative. Econ. Anal. Policy 2022, 73, 753–767. [Google Scholar] [CrossRef]
- Enderwick, P. The Economic Growth and Development Effects of China’s One Belt, One Road Initiative. Strateg. Change 2018, 27, 447–454. [Google Scholar] [CrossRef]
- Chen, Y.; Fan, Z.; Zhang, J.; Mo, M. Does the Connectivity of the Belt and Road Initiative Contribute to the Economic Growth of the Belt and Road Countries? Emerg. Mark. Financ. Trade 2019, 55, 3227–3240. [Google Scholar] [CrossRef]
- Chuc, A.T.; Chien, F.; Hussein, M.A.; Ramli, Y.; Soelton, S.P.; Iqbal, S.; Bilal, A.R. Estimating the Role of Green Financing on Energy Security, Economic, and Environmental Integration of BRI Member Countries. Singap. Econ. Rev. 2021, 1–19. [Google Scholar] [CrossRef]
- Liu, H.; Wang, Y.; Jiang, J.; Wu, P. How Green Is the “Belt and Road Initiative”?–Evidence from Chinese OFDI in the Energy Sector. Energy Policy 2020, 145, 111709. [Google Scholar] [CrossRef]
- Song, X.; Zhou, Y.; Jia, W. How Do Economic Openness and R&D Investment Affect Green Economic Growth?—Evidence from China. Resour. Conserv. Recycl. 2019, 146, 405–415. [Google Scholar] [CrossRef]
- Zhang, D.; Mohsin, M.; Rasheed, A.K.; Chang, Y.; Taghizadeh-Hesary, F. Public Spending and Green Economic Growth in BRI Region: Mediating Role of Green Finance. Energy Policy 2021, 153, 112256. [Google Scholar] [CrossRef]
- Romer, P. Endogenous technological change. J. Polit. Econ. 1990, 98, 71–102. [Google Scholar] [CrossRef]
- Lucas, R.E., Jr. On the mechanics of economic development. J. Monet. Econ. 1988, 22, 3–42. [Google Scholar] [CrossRef]
- Park, S.-D. The Nexus of FDI, R&D, and Human Capital on Chinese Sustainable Development: Evidence from a Two-Step Approach. Sustainability 2018, 10, 2063. [Google Scholar] [CrossRef]
- Narula, R.; Dunning, J.H. Industrial Development, Globalization and Multinational Enterprises: New Realities for Developing Countries. Oxf. Dev. Stud. 2000, 28, 2. [Google Scholar] [CrossRef]
- Opoku, E.E.O.; Yan, I.K.M. Industrialisation as driver of sustainable economic growth in Africa. J. Int. Trade Econ. Dev. 2019, 28, 30–56. [Google Scholar] [CrossRef]
- Liu, Y.; Hao, Y.; Gao, Y. The environmental consequences of domestic and foreign investment: Evidence from China. Energy Policy 2017, 108, 271–280. [Google Scholar] [CrossRef]
- Iamsiraroj, S.; Ulubaşoğlu, M.A. Foreign direct investment and economic growth: A real relationship or wishful thinking? Econ. Model. 2015, 51, 200–213. [Google Scholar] [CrossRef]
- Ozawa, T. Foreign Direct Investment and Economic Development. Transnat. Corp. 1992, 1, 27–54. [Google Scholar]
- Raza, S.A.; Shah, N.; Arif, I. Relationship Between FDI and Economic Growth in the Presence of Good Governance System: Evidence from OECD Countries. Glob. Bus. Rev. 2021, 22, 1471–1489. [Google Scholar] [CrossRef]
- Yimer, A. The Effects of FDI on Economic Growth in Africa. J. Int. Trade Econ. Dev. 2023, 32, 2–36. [Google Scholar] [CrossRef]
- Megbowon, E.; Mlambo, C.; Adekunle, B. Impact of China’s Outward FDI on Sub-Saharan Africa’s Industrialization: Evidence from 26 Countries. Cogent Econ. Financ. 2019, 7, 1681054. [Google Scholar] [CrossRef]
- Krammer, S.M.S. International R&D spillovers in emerging markets: The impact of trade and foreign direct investment. J. Int. Trade Econ. Dev. 2010, 19, 591–623. [Google Scholar]
- Azman-Saini, W.N.W.; Law, S.H.; Ahmad, A.H. FDI and economic growth: New evidence on the role of financial markets. Econ. Lett. 2010, 107, 211–213. [Google Scholar] [CrossRef]
- Kergroach, S. National Innovation Policies for Technology Upgrading through GVCs: A Cross-Country Comparison. Technol. Forecast. Soc. Change 2019, 145, 258–272. [Google Scholar] [CrossRef]
- Noor, A.; Shahzad, H.A.; Gull, K.; Zaib, A. Sustainable Economic Development and Industrial Relocation: JRSP, 2021, Vol. 58, No. 1. Asia and Pacific. Available online: https://pu.edu.pk/images/journal/history/PDF-FILES/34_58_1_21.pdf (accessed on 23 November 2024).
- Ahmad, M.S.; Szczepankiewicz, E.I.; Yonghong, D.; Ullah, F.; Ullah, I.; Loopesco, W.E. Does Chinese Foreign Direct Investment (FDI) Stimulate Economic Growth in Pakistan? An Application of the Autoregressive Distributed Lag (ARDL Bounds) Testing Approach. Energies 2022, 15, 2050. [Google Scholar] [CrossRef]
- Sylvaire, D.D.Y.; Qing, W.H.; Ran, C.H.; Kassai, D.L.; Vincent, N.; Douce, D.A.C.; Frank, O.-K.; Nicaise, N.P.; Traore, F.; Boris, A.F. The Impact of China’s Foreign Direct Investment on Africa’s Inclusive Development. Soc. Sci. Humanit. Open 2022, 6, 100276. [Google Scholar] [CrossRef]
- Miao, M.; Lang, Q.; Borojo, D.G.; Yushi, J.; Zhang, X. The Impacts of Chinese FDI and China–Africa Trade on Economic Growth of African Countries: The Role of Institutional Quality. Economies 2020, 8, 53. [Google Scholar] [CrossRef]
- Islam, M.M. An Empirical Analysis of Foreign Direct Investment, Ready-Made Garment Exports, and Employment in Bangladesh. J. Int. Econ. Manag. 2024, 24, 17–39. [Google Scholar] [CrossRef]
- Chowdhury, T.A.; Snigdha, N.T. Some Recent Trends and Implications of Foreign Direct Investment in Bangladesh. J. Dev. Areas 2023, 57, 221–244. [Google Scholar] [CrossRef]
- Aseeva, A. (Un) Sustainable Development(s) in International Economic Law: A Quest for Sustainability. Sustainability 2018, 10, 4022. [Google Scholar] [CrossRef]
- Gammage, C.; Tonia, N. Sustainable Trade, Investment and Finance: Toward Responsible and Coherent Regulatory Frameworks; Edward Elgar Publishing: Cheltenham, UK, 2019. [Google Scholar]
- De Mariz, F.; Aristizábal, L.; Andrade Álvarez, D. Fiduciary Duty for Directors and Managers in the Light of Anti-ESG Sentiment: An Analysis of Delaware Law. Appl. Econ. 2024, 57, 4309–4320. [Google Scholar] [CrossRef]
- Yin, W. Integrating Sustainable Development Goals into the Belt and Road Initiative: Would It Be a New Model for Green and Sustainable Investment? Sustainability 2019, 11, 6991. [Google Scholar] [CrossRef]
- Ascensão, F.; Fahrig, L.; Clevenger, A.P.; Corlett, R.T.; Jaeger, J.A.G.; Laurance, W.F.; Pereira, H.M. Environmental Challenges for the Belt and Road Initiative. Nat. Sustain. 2018, 1, 206–209. [Google Scholar] [CrossRef]
- Alkon, M.; He, X.; Paris, A.R.; Liao, W.; Hodson, T.; Wanders, N.; Wang, Y. Water Security Implications of Coal-Fired Power Plants Financed through China’s Belt and Road Initiative. Energy Policy 2019, 132, 1101–1109. [Google Scholar] [CrossRef]
- Cuiyun, C.; Chazhong, G. Green Development Assessment for Countries along the Belt and Road. J. Environ. Manag. 2020, 263, 110344. [Google Scholar] [CrossRef]
- Glisovic, J.; Gonzalez, H.; Saltuk, Y.; de Mariz, F. Volume Growth and Valuation Contraction, Global Microfinance Equity Valuation Survey 2012. SSRN Electron. J. 2012. [Google Scholar] [CrossRef]
- Karim, M.F.; Mimura, N. Impacts of Climate Change and Sea-Level Rise on Cyclonic Storm Surge Floods in Bangladesh. Glob. Environ. Change 2008, 18, 490–500. [Google Scholar] [CrossRef]
- Rahman, M.M.; Mahamud, S.; Thurston, G.D. Recent Spatial Gradients and Time Trends in Dhaka, Bangladesh, Air Pollution and Their Human Health Implications. J. Air Waste Manag. Assoc. 2019, 69, 478–501. [Google Scholar] [CrossRef]
- Rahman, M.M.; Hasanuzzaman, A.B.M.; Chisty, M.A.; Alam, E.; Islam, M.K.; Islam, A.R.M.T. Perceived-Air Pollution and Self-Reported Health Status: A Study on Air Pollution-Prone Urban Area of Bangladesh. Front. Public Health 2025, 13, 1382471. [Google Scholar] [CrossRef]
- Mahbub, T.; Ahammad, M.F.; Tarba, S.Y.; Mallick, S.M.Y. Factors Encouraging Foreign Direct Investment (FDI) in the Wind and Solar Energy Sector in an Emerging Country. Energy Strategy Rev. 2022, 41, 100865. [Google Scholar] [CrossRef]
- Bharti, M.S. The Sustainable Development and Economic Impact of China’s Belt and Road Initiative in Ethiopia East Asia. J. Chin. Econ. 2023, 40, 175–194. [Google Scholar] [CrossRef]
- Sen, P.K. Estimates of the Regression Coefficient Based on Kendall’s Tau. J. Am. Stat. Assoc. 1968, 63, 1379–1389. [Google Scholar] [CrossRef]
- Mann, H.B. Nonparametric Tests Against Trend. Econometrica 1945, 13, 245–259. [Google Scholar] [CrossRef]
- Kendall, M.G. Rank Correlation Methods, 3rd ed.; Griffin: London, UK, 1975. [Google Scholar]
- Sneyers, S. On the Statistical Analysis of Series of Observations; Technical Note No. 143, WMO No. 725 415; Secretariat of the World Meteorological Organization: Geneva, Switzerland, 1990; 192p. [Google Scholar]
- Arellano, M.; Bover, O. Another Look at the Instrumental Variable Estimation of Error-Components Models. J. Econom. 1995, 68, 29–51. [Google Scholar] [CrossRef]
- Blundell, R.; Bond, S. Initial Conditions and Moment Restrictions in Dynamic Panel Data Models. J. Econom. 1998, 87, 115–143. [Google Scholar] [CrossRef]
- Soto, M. System GMM Estimation with a Small Sample; Barcelona Economics Working Paper Series Working Paper #395; Barcelona Economics: Barcelona, Spain, 2009. [Google Scholar]
- Windmeijer, F. A Finite Sample Correction for the Variance of Linear Efficient Two-Step GMM Estimators. J. Econom. 2005, 126, 25–51. [Google Scholar] [CrossRef]
- Hansen, L.P. Large Sample Properties of Generalized Method of Moments Estimators. Econometrica 1982, 50, 1029–1054. [Google Scholar] [CrossRef]
- Arellano, M.; Bond, S. Some Tests of Specification for Panel Data: Monte Carlo Evidence and an Application to Employment Equations. Rev. Econ. Stud. 1991, 58, 277–297. [Google Scholar] [CrossRef]
- Alfaro, L.; Chanda, A.; Kalemli-Ozcan, S.; Sayek, S. FDI and Economic Growth: The Role of Local Financial Markets. J. Int. Econ. 2004, 64, 89–112. [Google Scholar] [CrossRef]
- Trinh, N.H.; Nguyen, Q.A.M. The Impact of Foreign Direct Investment on Economic Growth: Evidence from Vietnam. Dev. Ctry. Stud. 2015, 5, 1–9. [Google Scholar]
- Asongu, S.A.; Odhiambo, N.M. Foreign Direct Investment, Information Technology and Economic Growth Dynamics in Sub-Saharan Africa. Telecommun. Policy 2020, 44, 101838. [Google Scholar] [CrossRef]
- Roodman, D. How to Do xtabond2: An Introduction to Difference and System GMM in Stata. Stata J. 2009, 9, 86–136. [Google Scholar] [CrossRef]
- Ofori, I.K.; Asongu, S.A. ICT Diffusion, Foreign Direct Investment and Inclusive Growth in Sub-Saharan Africa. Telemat. Inform. 2021, 65, 101718. [Google Scholar] [CrossRef]
- World Bank Group. World Development Indicators. Available online: https://databank.worldbank.org/source/world-development-indicators/preview/on (accessed on 21 September 2024).
- Finance Division, Ministry of Finance, Government of the People’s Republic of Bangladesh. Available online: https://mof.gov.bd/ (accessed on 21 September 2024).
- Central Bank of Bangladesh. Available online: https://www.bb.org.bd/en/index.php/publication/publictn/1/30 (accessed on 28 September 2024).
- Wang, Y.; Xue, T.; Xu, S. Green GDP Calculation Methods and Practical Applications Based on an Environmental Perspective. Highlights Bus. Econ. Manag. 2023, 17, 139–143. [Google Scholar] [CrossRef]
- Xinhua. Roundup: China-Bangladesh Enterprises Development Forum Highlights Cooperation. Xinhua. 2023. Available online: https://english.news.cn/ (accessed on 28 September 2024).
- Mohammad, F.M.; Tang, Z. An Assessment of Bangladesh Collaboration with Chinese Companies Across Various Sectors. Int. J. Econ. Commer. Manag. 2019, 7, 386. [Google Scholar]
- Callen, T. What Is Gross Domestic Product? Financ. Dev. 2008, 45, 48–49. Available online: https://www.imf.org/external/pubs/ft/fandd/2008/12/pdf/basics.pdf (accessed on 23 February 2024).
- Trinh, T.H. A Primer on GDP and Economic Growth. Int. J. Econ. Res. 2017, 14, 13–24. [Google Scholar]
- Stjepanović, S.; Tomić, D.; Škare, M. Green GDP: An Analyses for Developing and Developed Countries. E+M Èkon. Manag. 2019, 22, 4–17. [Google Scholar] [CrossRef]
- Arrow, K.; Bolin, B.; Costanza, R.; Dasgupta, P.; Folke, C.; Holling, C.; Jansson, B.-O.; Levin, S.; Mäler, K.-G.; Perrings, C.; et al. Economic Growth, Carrying Capacity, and the Environment. Environ. Dev. Econ. 1996, 1, 104–110. [Google Scholar] [CrossRef]
- Rockström, J.; Steffen, W.; Noone, K.; Persson, Å.; Chapin, F.S., III; Lambin, E.F.; Lenton, T.M.; Scheffer, M.; Folke, C.; Schellnhuber, H.J.; et al. A Safe Operating Space for Humanity. Nature 2009, 461, 472–475. [Google Scholar] [CrossRef]
- Stiglitz, J.E.; Sen, A.K.; Fitoussi, J.-P. Report by the Commission on the Measurement of Economic Performance and Social Progress; Commission on the Measurement of Economic Performance and Social Progress: Paris, France, 2009. [Google Scholar]
- United Nations. System of Environmental-Economic Accounting (SEEA); United Nations: New York, NY, USA, 2013. [Google Scholar]
- Nordhaus, W.D. The “Stern Review” on the Economics of Climate Change. In National Bureau of Economic Research Working Paper Series; Cambridge University Press: Cambridge, UK, 2006; p. 12741. [Google Scholar]
- World Bank. The Changing Wealth of Nations: Measuring Sustainable Development in the New Millennium; World Bank: Washington, DC, USA, 2011. [Google Scholar] [CrossRef]
- Bazan, G. Our Ecological Footprint: Reducing Human Impact on the Earth. Electron. Green J. 1997, 1, 7. [Google Scholar] [CrossRef]
- Balassa, B. Policy Responses to Exogenous Shocks in Developing Countries. Am. Econ. Rev. 1986, 5, 75–78. [Google Scholar]
- Weiss, E.B. Environment and Trade as Partners in Sustainable Development: A Commentary. Am. J. Int. Law 1992, 86, 728–735. [Google Scholar] [CrossRef]
- Ahmad, S.M.; Malik, M.A.; Masood, R.Z. Assessing the Effects of Trade Openness on Sustainable Development: Evidence from India. Asian J. Sustain. Soc. Responsib. 2020, 5, 1. [Google Scholar] [CrossRef]
- Intisar, R.A.; Yaseen, M.R.; Kousar, R.; Usman, M.; Makhdum, M.S.A. Impact of Trade Openness and Human Capital on Economic Growth: A Comparative Investigation of Asian Countries. Sustainability 2020, 12, 2930. [Google Scholar] [CrossRef]
- 99. Ramzan, M.; Sheng, B.; Shahbaz, M.; Song, J.; Jiao, Z. Impact of Trade Openness on GDP Growth: Does TFP Matter? J. Int. Trade Econ. Dev. 2019, 28, 1616805. [Google Scholar] [CrossRef]
- Raghutla, C. The Effect of Trade Openness on Economic Growth: Some Empirical Evidence from Emerging Market Economies. Public Adm. Dev. 2020, 40, 3. [Google Scholar] [CrossRef]
- Chaudhry, A.F.; Butt, A.R. Comparative Impact of Unofficial and Official Exchange Rates on the Economy of Pakistan. World Rev. Bus. Res. 2014, 4, 181–195. [Google Scholar]
- Rautava, J. The Role of Oil Prices and the Real Exchange Rate in Russia’s Economy—A Cointegration Approach. J. Comp. Econ. 2004, 32, 315–327. [Google Scholar] [CrossRef]
- Abounoori, E.; Zobeiri, H. Exchange Rate Gap Effect on Economic Growth in Iran. Int. Rev. Bus. Res. Pap. 2010, 6, 66–77. [Google Scholar]
- Akpan, E.O.; Atan, J.A. Effects of Exchange Rate Movements on Economic Growth in Nigeria. CBN J. Appl. Stat. 2011, 2, 1–14. [Google Scholar]
- Edwards, S. Are Devaluations Contractionary? NBER Work. Pap. 1985, 1676, 1–23. [Google Scholar]
- Avellán, L.M. Parallel Exchange Rates and Economic Performance in Developing Countries: Is the Medicine Worse than the Disease? Ph.D. Thesis, Graduate School of the University of Maryland, College Park, MD, USA, 2004. JEL Classification: F31, F32, F41. [Google Scholar]
- Lamah, I.A.L.; Yanto, H.; Setyadharma, A. The Impact of Consumer Price Index, Foreign Direct Investment, Bank Credit, and Labour Force on Economic Growth in Indonesia. Bus. Econ. Anal. J. 2021, 1, 79–91. Available online: https://journal.unnes.ac.id/nju/index.php/beaj (accessed on 21 November 2024). [CrossRef]
- Chen, X.-S.; Kim, M.G.; Lin, C.-H.; Na, H.J. Development of Per Capita GDP Forecasting Model Using Deep Learning: Including Consumer Goods Index and Unemployment Rate. Sustainability 2025, 17, 843. [Google Scholar] [CrossRef]
- O’Donovan, N. Turning Less into More: Measuring Real GDP Growth in the Green Transition. Ecol. Econ. 2024, 224, 108293. [Google Scholar] [CrossRef]
- Amaral, A.; Dyhoum, T.E.; Abdou, H.A.; Aljohani, H.M. Modeling for the Relationship between Monetary Policy and GDP in the USA Using Statistical Methods. Mathematics 2022, 10, 4137. [Google Scholar] [CrossRef]
- The Daily Star. FTA with China May Cost Bangladesh Tk 15,000cr a Year: Study; The Daily Star: Hammond, LA, USA, 29 March 2024; Available online: https://www.thedailystar.net/business/economy/news/fta-china-may-cost-bangladesh-tk-15000cr-year-study-3577116 (accessed on 28 September 2024).
- Government of the People’s Republic of Bangladesh. Bangladesh Bureau of Statistics (BBS) Monthly Release: Foreign Trade Statistics, January 2024, Issue 204; Statistics and Informatics Division (SID); Ministry of Planning: Dhaka, Bangladesh, 28 March 2024.
- Menon, S. Economic Ties Between China and Bangladesh: Dynamics and Implications; China and Asia, CiCM Insights: 5 February 2024. Available online: https://orcasia.org/article/589/economic-ties-between-china-and-bangladesh (accessed on 28 September 2024).
- Sakib, M.N. Chinese Foreign Direct Investment and Economic Growth of Bangladesh: A VECM Analysis. SSRN Electron. J. 2021. [Google Scholar] [CrossRef]
- Kinrebiyo, F. Bangladesh’s Leap from Poverty to Textile Powerhouse Offers Lessons for Countries in Africa. World Economic Forum. 16 February 2024. Available online: https://www.weforum.org/stories/2024/02/how-bangladesh-offers-lessons-for-sustainable-industrialization-in-africa/ (accessed on 10 June 2025).
- Roy, S. Industrial Policy 2016 of Bangladesh: An Assessment from the Green Perspective. Bangladesh J. Public Admin. 2019, 25. [Google Scholar] [CrossRef]
- International Labour Organization. Employment and Decent Work for Peace and Resilience: Bangladesh Country Brief; ILO: Geneva, Switzerland, 2017. [Google Scholar]
- Mamun, M.A.A.; Hoque, M.M. The Impact of Paid Employment on Women’s Empowerment: A Case Study of Female Garment Workers in Bangladesh. World Dev. Sustain. 2022, 1, 100026. [Google Scholar] [CrossRef]
- Bangladesh Investment Development Authority (BIDA). Investment Climate and Reforms in Bangladesh: Annual Report 2017; BIDA: Dhaka, Bangladesh, 2018.
- Bergmann, D.R.; Ferreira Savoia, J.R.; de Melo Sousa, B.; de Mariz, F. Evaluation of Merger and Acquisition Processes in the Brazilian Banking Sector by Means of an Event Study. Rev. Bras. Gest. Neg. 2015, 17, 1105–1115. Available online: https://ssrn.com/abstract=2967371 (accessed on 10 June 2025). [CrossRef][Green Version]
- Asaduzzaman, M. FDI as an Opportunity for Economic Growth of Bangladesh: A VECM Analysis. SSRN Electron. J. 2019. [Google Scholar] [CrossRef]
- Buckley, P.J.; Clegg, L.J.; Cross, A.R.; Liu, X.; Voss, H.; Zheng, P. The determinants of Chinese outward foreign direct investment. J. Int. Bus. Stud. 2007, 38, 499–518. [Google Scholar] [CrossRef]
- Bangladesh Economic Zones Authority (BEZA). Investment Opportunities in Economic Zones. 2011. Available online: https://www.beza.gov.bd (accessed on 1 June 2025).
- Panda, J.P. China’s Investment in South Asia under the BRI: A Bangladesh Perspective. J. Asian Secur. Int. Aff. 2018, 5, 137–159. [Google Scholar]
- Yu, H. Motivation behind China’s ‘One Belt, One Road’ Initiatives and Establishment of the Asian Infrastructure Investment Bank. J. Contemp. China 2017, 26, 353–368. [Google Scholar] [CrossRef]
- Financial Express. Corruption and Irregularities Permeate Power and Energy Sector, Says Adviser; Financial Express: Uttar Pradesh, India, 2024; Available online: https://thefinancialexpress.com.bd/trade/corruption-and-irregularities-permeate-power-and-energy-sector-says-adviser (accessed on 23 March 2025).
- Transparency International Bangladesh (TIB). Corruption in Land Purchase Eats Away Tk 390cr in Power Projects; Tribune: Dhaka, Bangladesh, 2022; Available online: https://www.dhakatribune.com/bangladesh/corruption/270102 (accessed on 23 March 2025).
- Financial Express. Two China-Funded Projects in Slow Lane; Financial Express: Uttar Pradesh, India, 2021; Available online: https://thefinancialexpress.com.bd/economy/two-china-funded-projects-in-slow-lane-1638585138 (accessed on 23 March 2025).
- Financial Times. Bangladesh Reassesses Power Deals Amid Debt Concerns; Financial Times: London, UK, 2024; Available online: https://www.ft.com/content/176b6884-8e69-47ee-990c-c78a26793d7c (accessed on 23 March 2025).
- Alam, M.S.; Natsuda, K. The Competitive Factors of the Bangladeshi Garment Industry in the Post-MFA Era. Can. J. Dev. Stud./Rev. Can. D’études Du Dév. 2016, 37, 316–336. [Google Scholar] [CrossRef]
- Hossen, M.H.; Rahman, A.S.; Kabir, A.S.; Hasan, M.F.; Ahmed, S. Systematic Assessment of the Availability and Utilization Potential of Biomass in Bangladesh. Renew. Sustain. Energy Rev. 2017, 67, 94–105. [Google Scholar] [CrossRef]
- Shah, I.H.; Dong, L.; Park, H.-S. Characterization of Resource Consumption and Efficiency Trends in Bangladesh, India, and Pakistan: Economy-Wide Biotic and Abiotic Material Flow Accounting from 1978 to 2017. J. Clean. Prod. 2020, 250, 119554. [Google Scholar] [CrossRef]
- Mia, S.; Akter, M. Ready-Made Garments Sector of Bangladesh: Its Growth, Contribution, and Challenges. Econ. World 2019, 7, 17–26. [Google Scholar] [CrossRef]
- Sujauddin, M.; Koide, R.; Komatsu, T.; Hossain, M.M.; Tokoro, C.; Murakami, S. Characterization of Ship Breaking Industry in Bangladesh. J. Mater. Cycles Waste Manag. 2015, 17, 72–83. [Google Scholar] [CrossRef]
- Sujauddin, M.; Koide, R.; Komatsu, T.; Hossain, M.M.; Tokoro, C.; Murakami, S. Ship Breaking and the Steel Industry in Bangladesh: A Material Flow Perspective. J. Ind. Ecol. 2017, 21, 191–203. [Google Scholar] [CrossRef]
- Swazan, I.S.; Das, D. Bangladesh’s Emergence as a Ready-Made Garment Export Leader: An Examination of the Competitive Advantages of the Garment Industry. Int. J. Glob. Bus. Compet. 2022, 17, 162–174. [Google Scholar] [CrossRef]
- Milon, M.N.U.; Zafarullah, H. Uncovering the Depths of Trade-Based Money Laundering: Evidence from a Seaport in Bangladesh. J. Money Laund. Control 2024, 27, 604–618. [Google Scholar] [CrossRef]
- Zafarullah, H.; Haque, H. Policies, Instrumentalities, Compliance and Control: Combatting Money Laundering in Bangladesh. J. Money Laund. Control 2023, 26, 189–204. [Google Scholar] [CrossRef]
- Khattak, A.; Park, Y.-E. Environmental Upgrading of an Apparel Firm in Bangladesh: A Case Study of VIYELLATEX. Emerald Emerg. Mark. Case Stud. 2018, 8, 1–16. [Google Scholar] [CrossRef]
- Yang, N.; Ha-Brookshire, J.E. Chinese textile and apparel manufacturers’ moral duty positions, goals and structures toward sustainability. J. Fash. Mark. Manag. Int. J. 2020, 25, 448–464. [Google Scholar] [CrossRef]
- Textile Focus. Chinese Enterprises Play a Vital Role in Bangladesh’s Textile and RMG Sector, Covering the Entire Supply Chain. 9 March 2025. Available online: https://textilefocus.com/chinese-enterprises-play-a-vital-role-in-bangladeshs-textile-and-rmg-sector-covering-the-entire-supply-chain/ (accessed on 23 March 2025).
- Rashid, S. Do Manufacturing Firms in Bangladesh Acquire ISO Certificates to Offset the Handicap of Credit Constraints? SN Bus. Econ. 2021, 1, 31. [Google Scholar] [CrossRef]
- Reza, A.K.; Islam, M.S.; Shimu, A.A. Green Industry in Bangladesh: An Overview. Environ. Manag. Sustain. Dev. 2017, 6, 124. [Google Scholar] [CrossRef]
- Bhuiyan, J.A.N.; Dutta, D. Analysis of Flood Vulnerability and Assessment of the Impacts in Coastal Zones of Bangladesh Due to Potential Sea-Level Rise. Nat. Hazards 2012, 61, 729–743. [Google Scholar] [CrossRef]
- Li, M.; Wang, J.; Chen, Y. Evaluation and Influencing Factors of Sustainable Development Capability of Agriculture in Countries Along the Belt and Road Route. Sustainability 2019, 11, 2004. [Google Scholar] [CrossRef]
Disclaimer/Publisher’s Note: The statements, opinions and data contained in all publications are solely those of the individual author(s) and contributor(s) and not of MDPI and/or the editor(s). MDPI and/or the editor(s) disclaim responsibility for any injury to people or property resulting from any ideas, methods, instructions or products referred to in the content. |
© 2025 by the authors. Licensee MDPI, Basel, Switzerland. This article is an open access article distributed under the terms and conditions of the Creative Commons Attribution (CC BY) license (https://creativecommons.org/licenses/by/4.0/).