Article

Impact of Ecological Education on University Students’ Environmentally Sustainable Behavior—Evidence from China

1
College of Marxism, Sichuan Agricultural University, Chengdu 611130, China
2
Zhejiang Institute of Administration, Hangzhou 310000, China
3
Chongzhou Administrative College, Chongzhou 611235, China
4
College of Water Resources and Hydropower, Sichuan Agricultural University, Chengdu 611130, China
*
Authors to whom correspondence should be addressed.
These authors contributed equally to this work.
Sustainability 2025, 17(13), 6051; https://doi.org/10.3390/su17136051
Submission received: 26 May 2025 / Revised: 27 June 2025 / Accepted: 29 June 2025 / Published: 2 July 2025

Abstract

With the development of higher education, college students have become a new and important group for environmentally sustainable development. How to evaluate and strengthen the practical effect of ecological education is of great significance. Based on the survey data of 1579 university students, this study constructed a systematic index system of ecological education by using a hierarchical evaluation method. Moreover, OLS (Ordinary Least Squares), Oprobit, and intermediary effect models were used to analyze the influence relationship and mechanism of the two empirically and IV-Oprobit was used to solve the endogeneity problem. The results show the following: (1) Ecological education can effectively promote the sustainable behavior of university students, and the probability of university students implementing sustainable behavior increases by 10.7% with each unit increase in the level of ecological education. (2) Environmental value perception such as in individual economic value perception, social value perception, and health value perception are all important mediating channels of ecological education, among which health value perception has the strongest mediating effect. (3) Particulate Matter 2.5 (PM2.5) exposure positively moderates the impact of university students’ environmental value perception on their sustainable behavior. (4) There is a significant correlation between university students’ household registration, participation in environmental associations and hometown social networks, and sustainable behaviors. (5) The influence of ecological education on students’ behaviors shows heterogeneity in family household registration. Students from rural families have a higher level of environmental behavior and value perception than those from urban families. Moreover, they are more likely to exhibit behaviors under the influence of ecological education. The above results provide reference suggestions for the ecological education policy system and offer theoretical support and policy inspiration for promoting sustainable behaviors among global college students and enhancing the efficiency of ecological education in universities.

1. Introduction

Ecological education originated from the environmental pollution problems attached to the development of human economy and society. Since 1960, the negative effect of rapid economic development has prompted disorderly and excessive resource development and consumption to gradually approach or even exceed the limit of environmental carrying capacity, resulting in the deterioration of the global ecological environment. Many scholars have begun to advocate the popularization of environmental protection concepts in the future [1]. In August 1973, the first Environmental Protection Conference issued Several Decisions on Protecting and Improving the Environment, which, for the first time, paid attention to the important role of universities in carrying out ecological environment education. It proposed that “universities should set up environmental protection majors and courses to train technical personnel” [2]. With the further development of economic globalization, environmental problems such as excessive chemical pollution and rising climate and ecological imbalance continued to worsen all over the world [3], and all sectors of society increasingly recognized the significance of sustainable environmental development [4]. During this period, ecological education in universities gradually matured. More and more universities have begun to conduct environmental sustainability education in various ways [5]. In recent years, the issue of environmental sustainability has received unprecedented attention from the global society. Many countries have designed a large number of environmental education programs on university campuses [6] through ecological environment courses [7], environmental experiments [8], and more. Environmental protection experience activities [9] change university students’ cognition and behavior. For example, Columbia University is promoting the environmental protection intentions of university students through the establishment of an ecological education learning system, and the same is true in developing countries, and the University of Lagos conducts regular solid waste recycling education every semester, which influences the sustainable behavior of most students, and great environmental benefits have been achieved [10].
Ecological education in China is also receiving increasing attention from the government and the public. No one is immune from global environmental pollution, and China also suffers from severe ecological damage [11]. China has become the country with the largest annual garbage output in the world, and ecological problems such as deforestation and vegetation destruction have emerged endlessly, causing serious negative impacts on the environment [12]. Since the 18th National Party Congress of China in 2012, ecological protection has become a significant strategy of the country, and the government has also carried out a series of policies, but no good results have been achieved at present [13]. For example, the intensity of pesticide application in China is 9.95 kg/hm2, and the intensity of chemical fertilizer application is 323.32 kg/hm2, both of which are much higher than the internationally recognized upper limit of safety values. China’s environmentally sustainable development is still stagnant; a major reason is that the significant importance of the youth group has been underestimated in the policy system. It is urgent to start with ecological education in universities to change the next generation’s environmental protection cognition and behavior [14]. As we all know, China has a huge number of university students. The Chinese Bureau of Statistics has reported that in the last five years, the number of general undergraduate, master’s, and doctoral students in China has been increasing. There are currently 36.594,000 general undergraduate and professional students and 3.654 million master’s and doctoral students and more than 200 million university graduates. Moreover, they are within the existing higher education system and have the advantage of conducting ecological education, which is something that children do not possess. University students have become an important part of the population in China, and their environmentally sustainable behavior (abbreviated as sustainable behavior) directly determines the environmental change of the whole country [15]. If we can change the environmental behavior of university students, it will become a new engine for environmental purification in the world.
Therefore, this paper attempts to make hypotheses regarding the influence of ecological education on college students’ environmental behaviors, its mechanism of action, and the regulatory role of PM2.5 and to verify and analyze the above hypotheses using survey data and econometric models.

2. Literature Review and Theoretical Analysis

2.1. Ecological Education and University Students’ Sustainable Behavior

Individual environmental sustainability behavior is influenced by many factors such as gender [16], age [17], education [18], geographical location [19], duty [20], income [21], and others. Family resources such as relationships, labor flow [22], market conditions, social learning [23], and the cultural environment [24] are significantly correlated. External influences mainly focus on government policies [25], technology integration and application [26], market regulation and docking [27], etc. For young university students, some scholars have verified the positive impact of ecological education on the sustainable protection behavior of university students [28].
University ecological education has always been the focus of pedagogy and resource economics research, and many scholars have conducted beneficial explorations [10,29]. At present, the research of ecological education mainly focuses on the following aspects: first, the concept of ecological education, the practice of environmental protection education in higher education, the theoretical mechanism, and the ecological cognition of university students. These studies have mainly discussed the concept of ecological education and individual values in universities. For example, Zheng et al. (2018)’s paper reflects on the ecological crisis from the perspective of sustainable development of humanity and society and proposes that ecological education can promote university students’ awareness of ecological issues [30], improve their awareness of public responsibility, and contribute to the harmonious development of man and nature. Developing a green and sustainable lifestyle: The second aspect is mainly about the research on the practical path of ecological education. For example, Cao (2018) investigated the ecological civilization education at Henan University and found that ecological education mainly relies on curriculum education and practical activities at the same time [11]. There are still shortcomings such as insufficient intensity and inaccurate objects of ecological education. Liu et al. (2023) conducted an empirical study on 1622 university students in Sichuan Province and found that university ecological civilization education exerts its influence mainly through the path of affecting students’ value perception and ultimately changes the environmental protection intention of university students [8]. The third aspect is the research on the change in the ecological education system. Jiang (2022) believes that the connotation of the ecological education system should change with the times [31]. Under the guidance of modern environmental ethics, the connotation of ecological civilization education has changed from a single environmental education to a synthesis of ecological sustainability concepts and it is of great significance to develop new research directions. Li et al. (2024)’s further study found that ecological education is a systematic science that should innovate management, mechanism, incentive, and evaluation systems in accordance with basic social science and humanism principles [32]. The fourth aspect is the empirical research on the impact of ecological education. Ma et al. (2021) argued that educational institutions could add value to public environmental policy by raising environmental awareness among residents and then mobilizing people to protect the environment and sustainable development [33]. Formal university environmental education, like via ecological environment courses, has been used as a great channel to educate students on the use of waste sorting [34]. Some scholars have found that ecological education can achieve a positive interaction between the government and social individuals [35], improve public environmental awareness and thinking ability, and promote students to improve the concept of sustainable development and environmental literacy [36]. Meanwhile, through the analysis and application of human capital theory, some scholars have proposed that education and training can deepen student’s cognitive and protection of the environment in the field of ecological environment [37]. Harring et al. (2017) found that education has a tremendous positive impact on environmental behavior [38]. However, few scholars have conducted studies on the influencing mechanism. Fielding (2012) proposed that ecological education can affect individuals’ environmentally sustainable development behaviors by inducing the formation of internal control sites related to their environmental value cognition and guilt [39], but this point still lacks empirical verification.
In conclusion, Hypothesis 1 (H1) is put forward in this paper:
Hypothesis 1 (H1).
Ecological education has a positive impact on university students’ sustainable behavior.

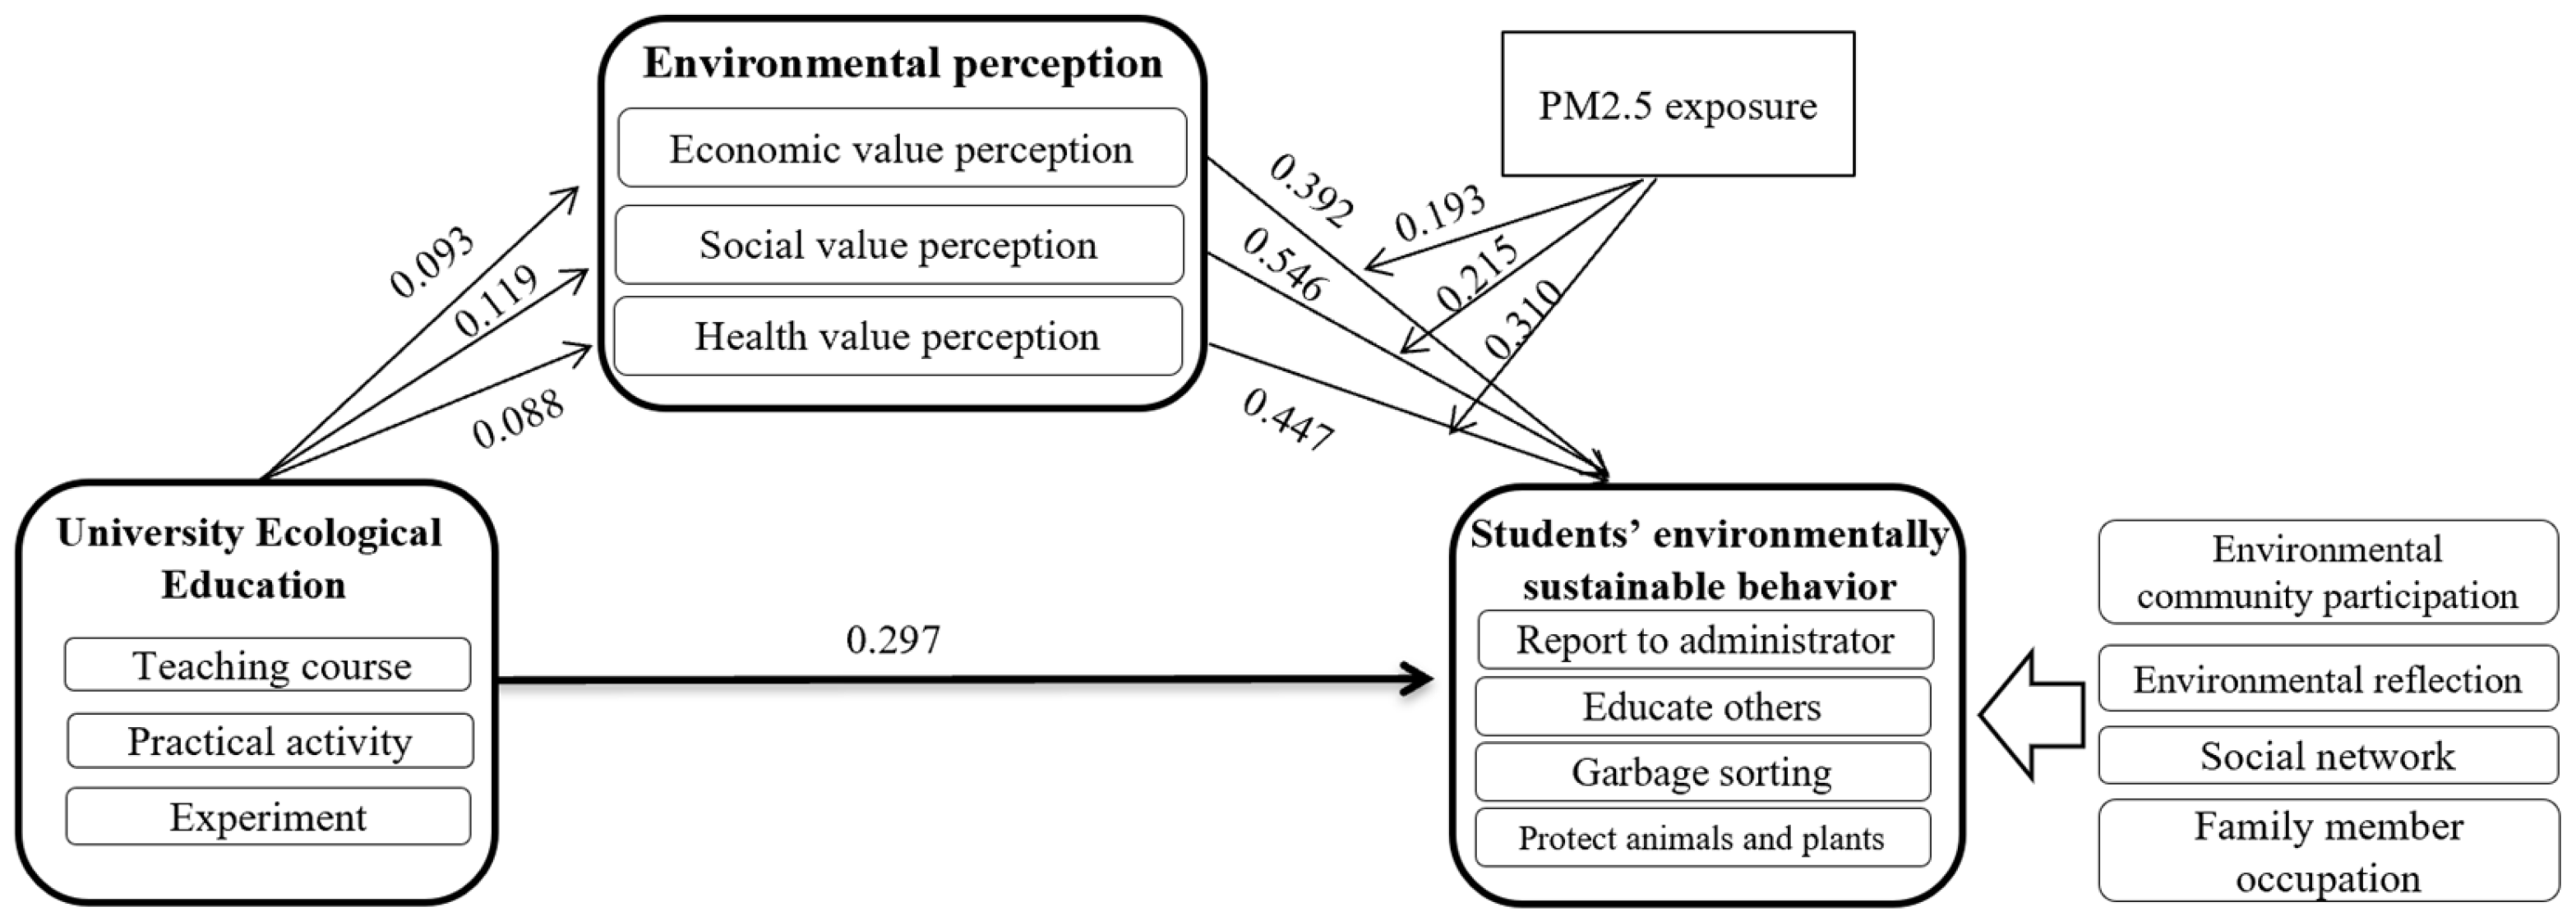
2.2. The Mediating Role of Environmental Protection Perception

Cost–benefit theory is an important theory to predict the behavior of rational economic individuals that can fully explore the motivation of individual human behaviors [40]. The core of this theory is that, in any case, individuals will adjust their actions and decisions according to the dynamic changes of their own interests and, ultimately, in order to maximize their own interests. The same is true for students in the process of deciding whether to protect the environment. When they perceive that the expected benefits of the behavior for themselves are greater than the comprehensive costs to be paid, they are finally willing to adopt the behavior after comparing and considering the cost and benefits [25]. The core of their will to act is whether environmental protection is valuable. In recent years, eco-economic man theory has been widely used in the analysis of economic behavior in the field of environment. According to this analysis, under the intersection of the ecological environment and economic environment, people still pursue the maximum benefit, but the benefit at this time is not limited to economic rationality: for the long-term survival of human reproduction, they have to take into account the potential environmental benefits that behavior will bring, so they must take into account the ecological rationality in their decision. The existing research usually divides benefit perception into three dimensions: economic, health, and social benefit perception [23]. So, university students’ final decision on whether to protect the environment is based on the cognition of the economy, environment, and society. If the marginal benefit of the behavior is more than the cost, they will want to follow through. Otherwise, they could ignore the behavior. The higher the environmental perception is, the more likely they are to find the increased economic, health, and social benefits of sustainable behavior.
Therefore, we propose the following:
Hypothesis 2a (H2a).
The economic value perception of the environment plays an intermediary role in the effect.
Hypothesis 2b (H2b).
The health value perception of the environment plays a mediating role in the effect.
Hypothesis 2c (H2c).
The social value perception of the environment plays a mediating role in the effect.

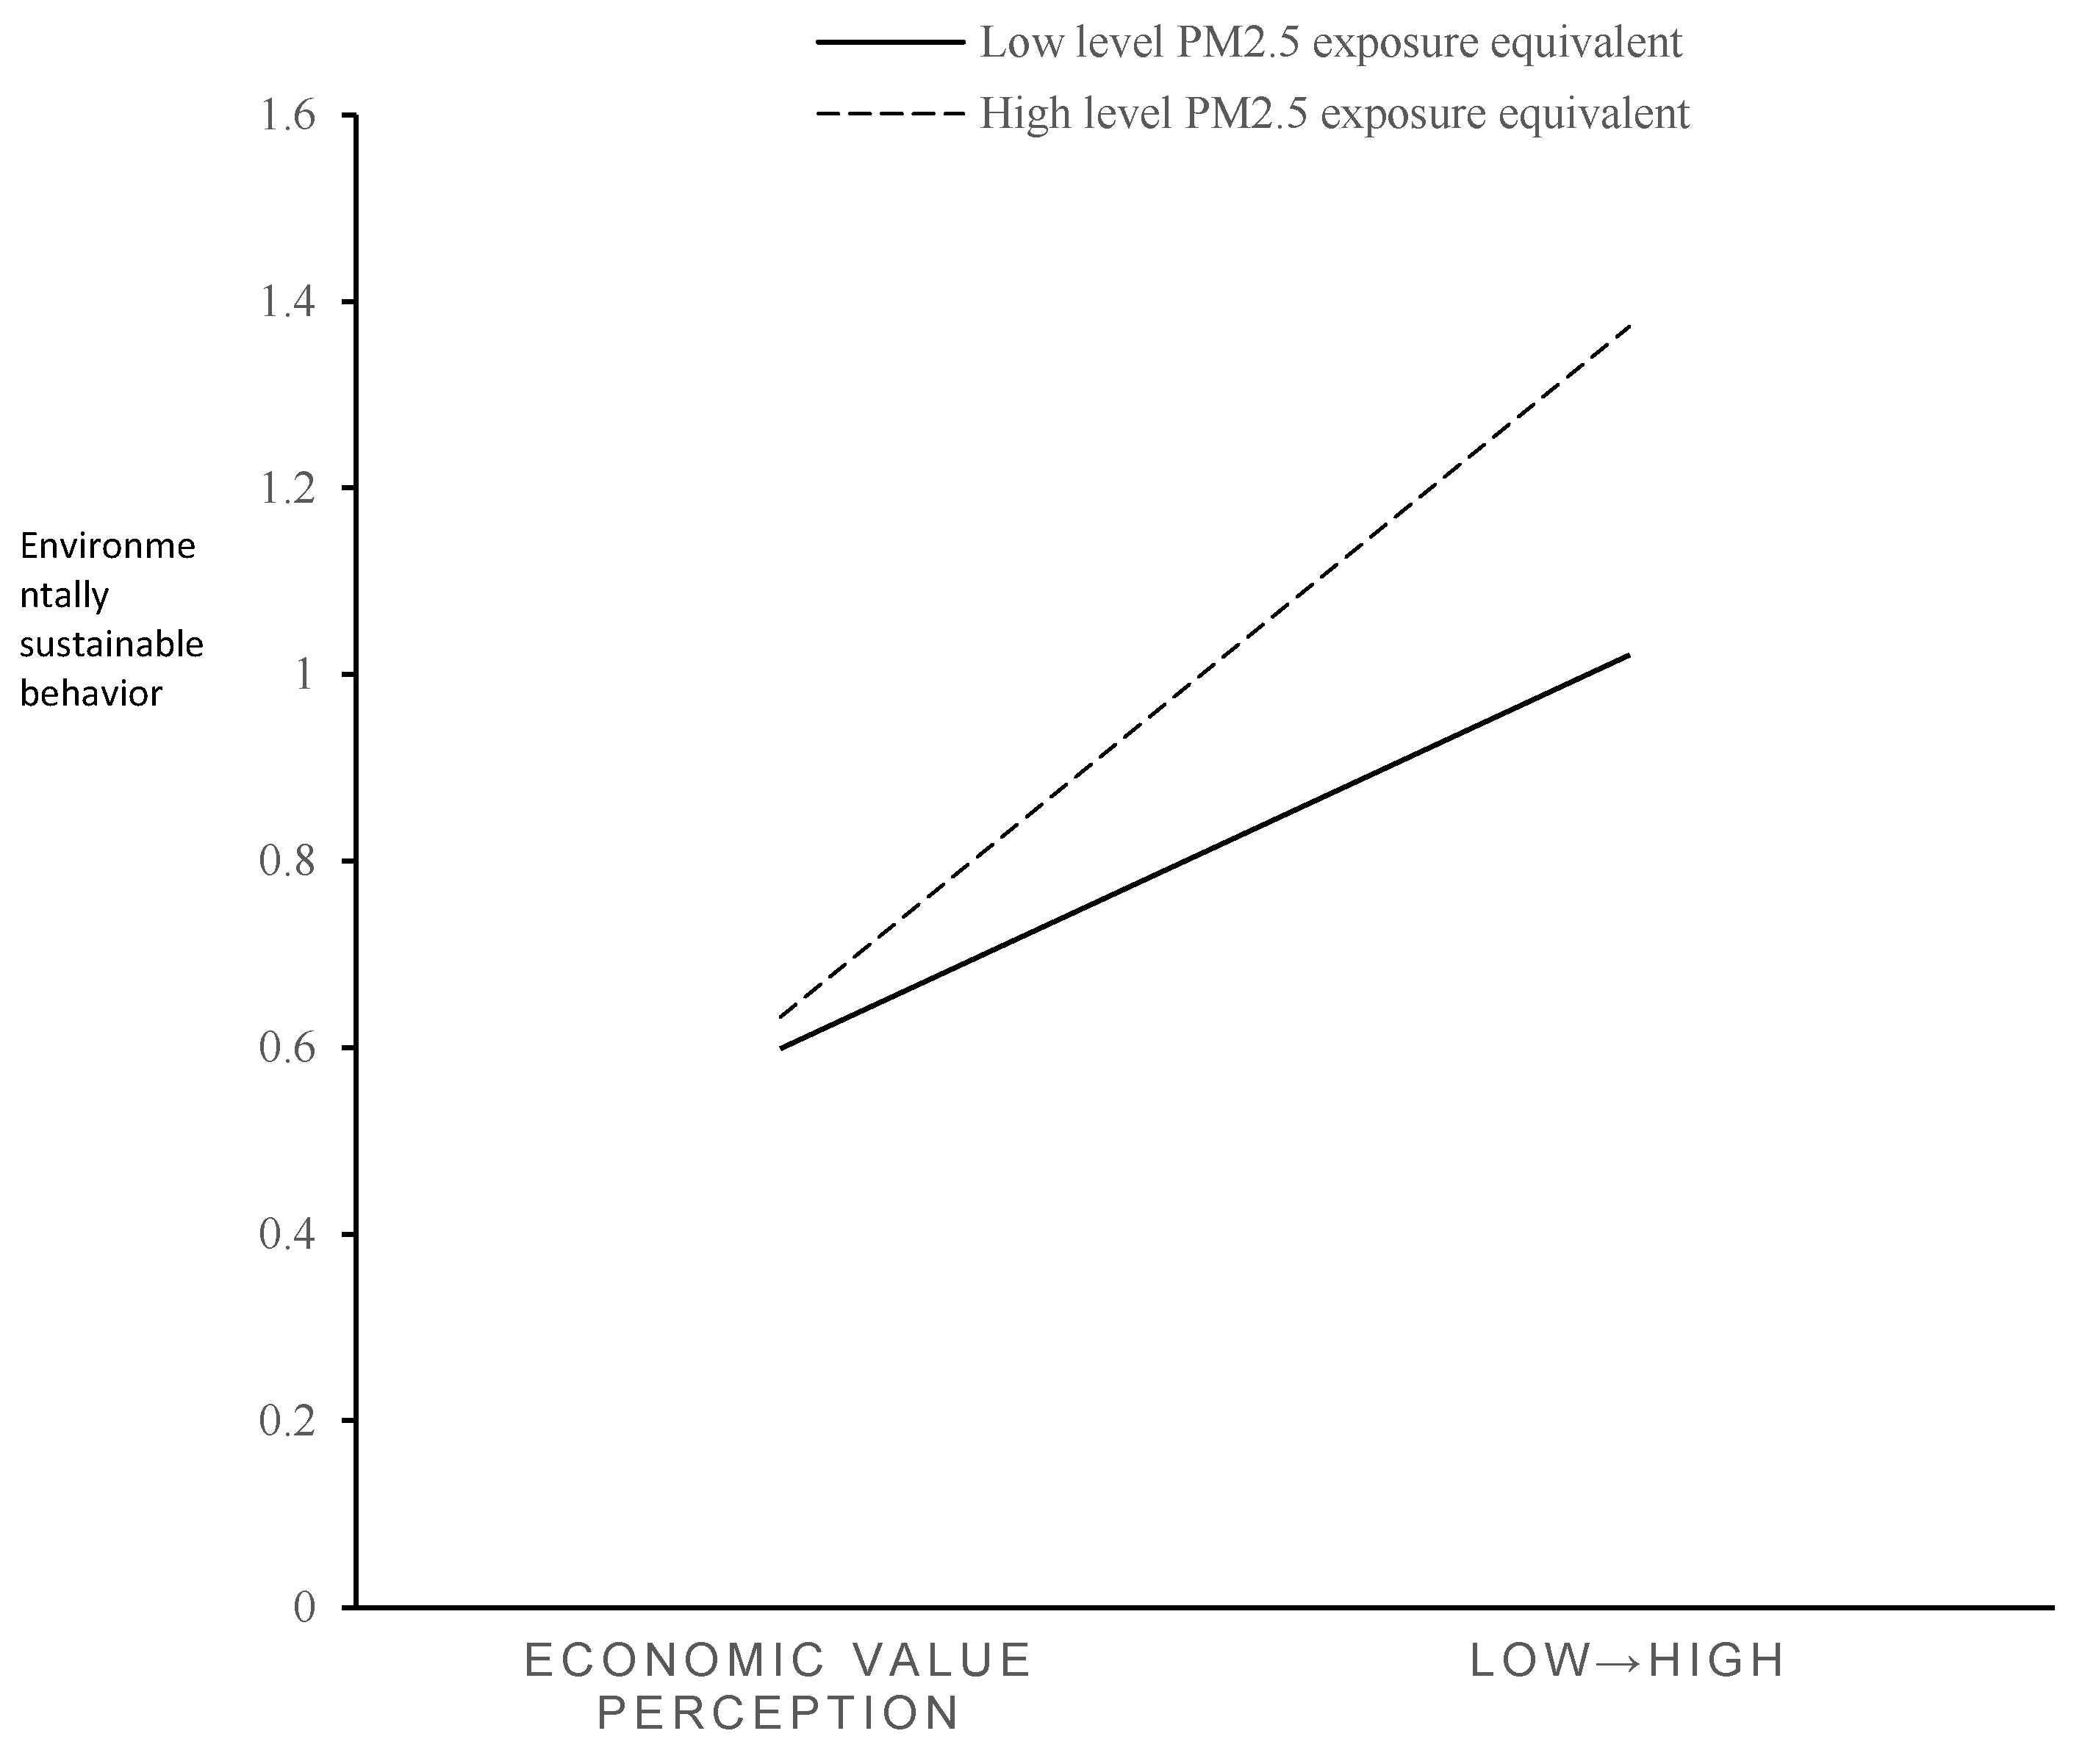
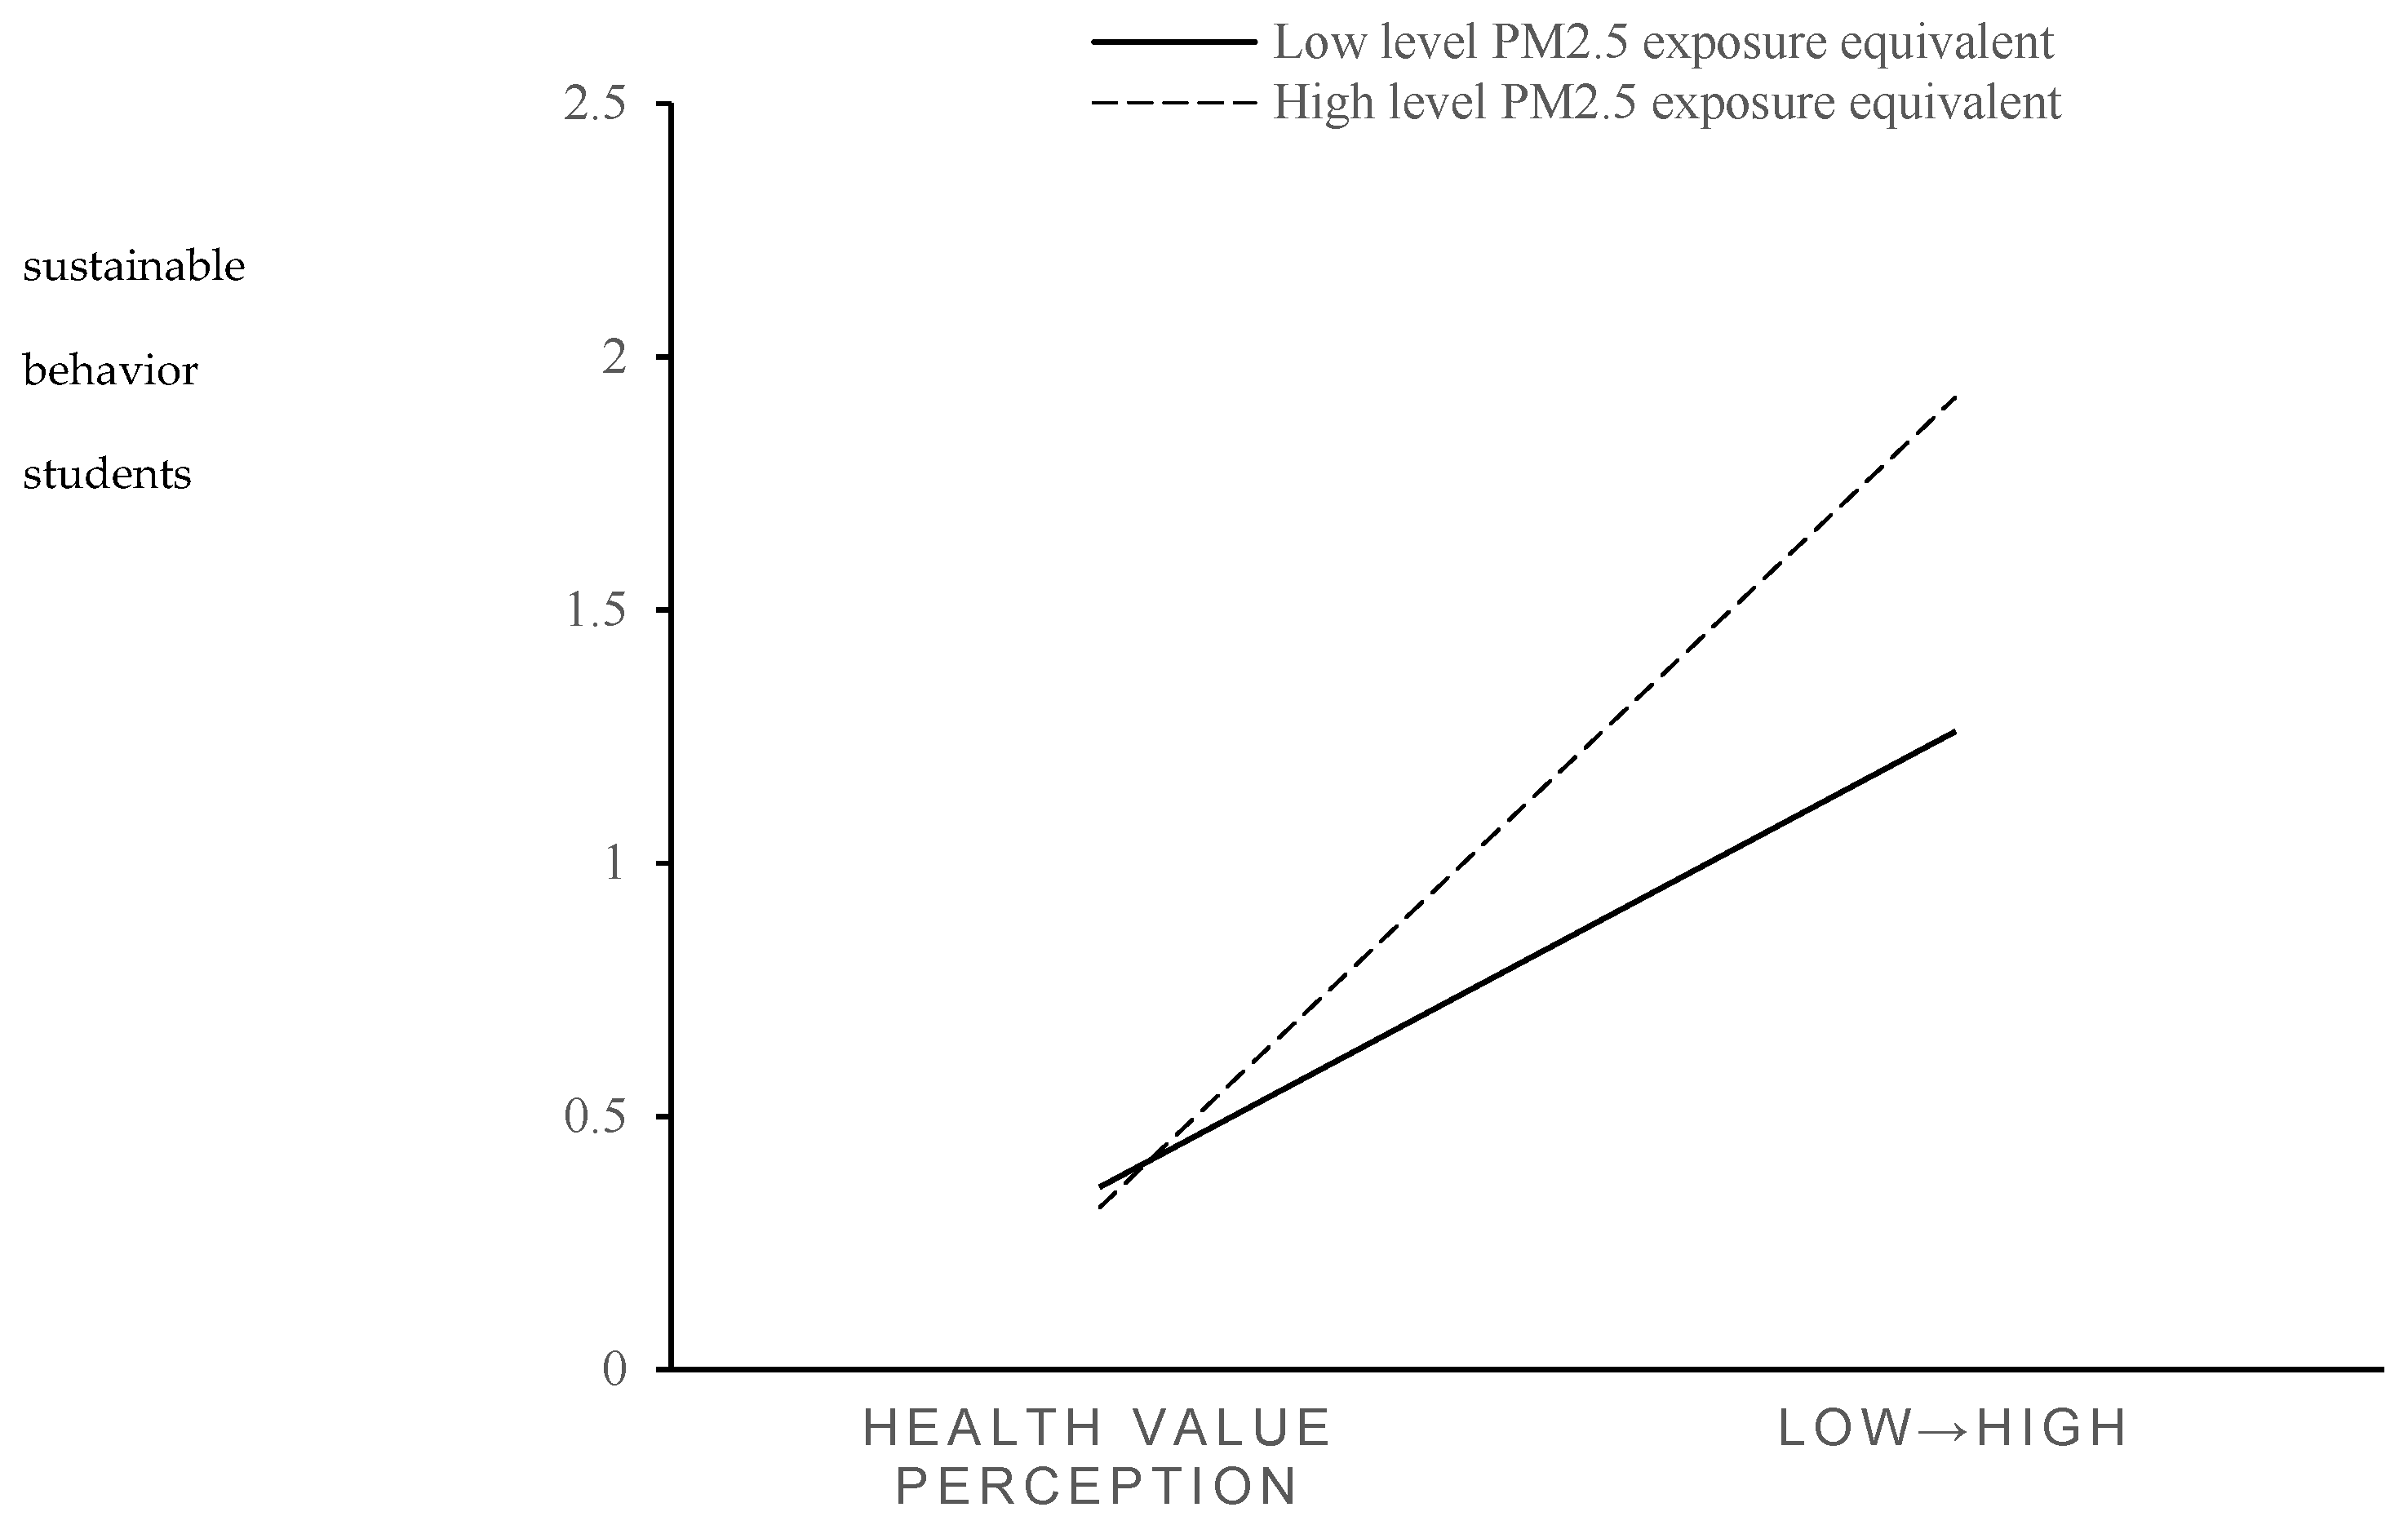
2.3. The Regulating Effect of PM2.5 Exposure

Existing studies have shown that air pollution has a direct impact on individuals’ pro-environment behaviors. Air pollution causes consequences such as haze and acid rain, which conveys signals of environmental damage to the public and enables the public to intuitively perceive changes in air quality and then make decisions on pro-environment behaviors. The increase in the PM2.5 concentration will change public health [41], the degree of emphasis on health [42], people’s cognition [43], and the public green shape [44] and encourage residents to change resource allocation [45]. Some scholars have also pointed out that different individuals have different levels of risk perception and the degree to which it is transformed into pro-environment behavior. Some people’s perception of environmental risk can directly stimulate positive pro-environment behavior; the other part of the public’s concern for the environment only stays at the “verbal” level, unwilling to translate into actual actions, and the public is even indifferent to pollution [46,47].
According to the “pollution-driven hypothesis” of sustainable behavior, the more serious the environmental pollution is, the easier the public’s awareness of environmental protection will be awakened and thus the more sustainable behaviors will occur [48]. However, studies on this hypothesis have been inconsistent. The reason is that most studies directly use environmental pollution indicators as independent variables to predict pro-environmental behavior without considering the possibility of interaction between objective environmental pollution indicators and other psychological variables. This paper intends to further investigate the “pollution-driven hypothesis” that is not only reflected in the pollution variables themselves but also reflected in the interaction level of pollution and psychological variables. In areas with serious air pollution, individuals directly feel the impact of pollution in their daily lives. Under the premise that university students have a high level of awareness of environmental benefits, their reflection on environmental risks may be enhanced. In this context, air pollution may exacerbate individuals’ concerns about environmental problems and positively regulate the impact of environmental perception on their adoption of sustainable behaviors. Conversely, in areas with better air quality, individuals may still not feel the urgent need to change their behavior, even if economic, social, and health perceptions of environmental protection actually exist.
Accordingly, the following hypotheses are proposed:
Hypothesis 3 (H3a).
PM2.5 exposure positively moderates the impact of perceived economic value on university students’ sustainable behavior.
Hypothesis 3 (H3b).
PM2.5 exposure positively moderates the impact of social value perception on university students’ sustainable behavior.
Hypothesis 3 (H3c).
PM2.5 exposure positively regulates the impact of perceived health value on university students’ sustainable behavior.

3. Variables

3.1. Data Sources

To explore the relationships among ecological education, environmental perception, PM2.5 exposure, and college students’ implementation of sustainable behaviors, the Youth Research Center of the Youth League Committee of Sichuan Agricultural University organized a special investigation. In January 2024, Sichuan Agricultural University developed a questionnaire on sustainable environmental behaviors among college students using stratified random sampling. We randomly selected two universities from the three regions of West China, Central China, and East China as the research sample bank. Through random selection, Sichuan Agricultural University, Northwest A&F University, Henan University, Huazhong Agricultural University, Northeastern University, and Nanjing University were selected. The research subjects included all the students registered at the above-mentioned universities. The Youth Research Center of the Youth League Committee of Sichuan Agricultural University has entrusted the youth institutions of various universities to randomly distribute online electronic questionnaires to students on campus, and the students will conduct secondary dissemination and invitation on campus. This random sampling technique provides equal participation opportunities for all college students in the sample universities, which helps ensure the universality of the research results and makes them comparable to those found by all students. After statistics, a total of 1652 questionnaires were obtained. Among them, 73 questionnaires were eliminated due to incomplete information and incorrect filling logic. Ultimately, a total of 1579 valid questionnaires were obtained and the effective rate of the questionnaires reached 95.58%. The samples from Sichuan Agricultural University, Northwest A&F University, Henan University, Huazhong Agricultural University, Northeastern University, and Nanjing University accounted for 18.8%, 16.4%, 17.1%, 16.2%, 15.9%, and 15.6%, respectively. The survey contents included information on topics such as ecological education in universities, the personal resource endowments of college students, and the perception of environmental value and sustainable behaviors.

3.2. Variable Selection

The explained variable of this study was the sustainable behavior of university students. The problems measured by the questionnaire were formed by us based on the practices in the existing relevant literature [23], combined with the actual situation of the index design, and through comprehensive consideration, and the questionnaire was designed as follows: “whether they will report environmental pollution to managers”, “whether they will publicize environmentally sustainable development to others”, “whether they will implement garbage sorting behavior”, and “whether they will protect animals and plants from harm”. The samples answering “yes” and “no” under each question were assigned values of 1 and 0, respectively, and the cumulative values of the scores of the four questions were used to characterize the sustainable behaviors of university students. The statistical results showed that 71.8% of the samples would carry out garbage sorting behaviors and 86.4% of the samples would protect animals and plants from harm, indicating that in China, which has achieved rapid economic development, most university students themselves are willing to protect the environment from harm. But on the other hand, only 37.9% of university students will report environmental pollution to managers, and only 41.5% of university students will publicize environmentally sustainable development to others, indicating that university students have a high level of environmental protection behavior. However, most people are unwilling to change the will of others and supervise others to protect the environment, the essence of which is that their subjective motivation and determination to achieve environmentally sustainable development are not enough.
In the existing literature, the frequency of students receiving ecological education is generally used to represent the level of ecological education in university [8]. It measures the educational level only by the number of times students receive ecological education. This measurement method is too simple and has large errors. It neglects the fact that the current university ecological education includes teaching courses, practical activities, and environmental experiments. More importantly, the nature of the number of time students receive ecological education only concerns whether students participate in each activity, and it is impossible to measure the degree of participation and information acquisition of students in this education. Therefore, in order to systematically measure ecological education indicators, this study asked students about the number of times they had participated in ecological courses, practical activities, and environmental experiments organized by the university and asked them about their satisfaction in participating in these educational activities. The sample answers of “dissatisfied”–“satisfied” were assigned scores of 1–5, respectively. The statistical results showed that the numbers of sample university students participating in environmental teaching courses, environmental practice activities, and environmental experiments last year were 3.455, 4.065, and 3.972, respectively, indicating that the current ecological education in Chinese universities has a high popularity. The satisfaction level of the samples participating in environmental teaching courses was the lowest, and the satisfaction level of environmental practice activities was the highest 4.045, involving items like campus green public welfare, social media publicity, watching environmental videos, and other practical activities. This indicates that students’ satisfaction and acceptance of teaching courses are lower than those of environmental practice activities and environmental experiments, which may be closely related to young people’s preference for outdoor practice and experience. In order to systematically evaluate the level of ecological education, the key lies in empowering the three levels and six indicators. In order to avoid the subjectivity of the Delphi method and the limitation of factor analysis focusing on the analysis of quantitative variables, the analytic hierarchy process (AHP) was adopted, and six experts in pedagogy, psychology, and university administrators were invited. According to the existing practice of using the A.L. Saaty 1–9 proportion method [19], the relative importance of variables at each level was scored. After processing, the discriminant matrix was obtained, and weights were assigned to each variable to finally obtain the comprehensive evaluation of ecological education levels. The index weights are shown in Table 1.
The mediating variable of this study was environmental value perception, which was divided into economic value perception, social value perception, and health value perception. The questionnaire was designed as follows: it asked whether students believe that the implementation of sustainable behavior leads to a considerable economic income, promotes sustainable social development, and improves public health. We assigned the sample answers “yes” and “no” to the values 1 and 0, respectively. The statistical results showed that 53.1%, 38.9%, and 51.7% of the samples agreed that environmental protection behavior has economic benefits, social value, and health value, indicating that the current Chinese university students have the highest cognition and recognition of the health value of environmental protection behavior, while the cognition of its social value is relatively low.
The regulating variable was PM2.5 exposure, and university students have mobility characteristics. In this study, the daily mean value of PM2.5 in the survey subjects’ main residence last year was selected to measure the PM2.5 equivalent. The data were derived from the national ambient air quality status released by the Ministry of Ecology and Environment of China from January to December 2023, from which the PM2.5 concentrations of the cities where the samples were located were singled out and the PM2.5 exposure of the main environment where each sample was located was formed after average processing. Statistics showed that the average PM2.5 concentration in the sample area was 33.2 μg/m3, an increase of 7.1% compared with the previous year, indicating that the air pollution situation in China is still serious. Specifically, among the cities where the sample was located, the average PM2.5 exposure in Aba and Garze was the lowest, with only 13.2 μg/m3 and 7.5 μg/m3. Cities such as Changzhi and Hengshui had the highest average exposure to PM2.5.
Referring to existing studies [49,50,51,52], the control variables mainly included individual characteristics and family endowments. In this paper, nine variables, such as political identity, household registration, environmental association participation, and the environmental reflection of the samples, were controlled, as shown in Table 2.

4. Measurement Model and Tests

4.1. Measurement Model

Ordered probit regression is a common statistical model for dealing with ordered categorical dependent variables. It is particularly suitable for cases where the explained variables are ordered values. Its estimation results are more accurate compared to those of Ols and Logit [23]. In order to explain the change and influence of the ordinal variables, the ordinal probit model can be used to estimate changes in the ordinal variables:
B e h a v i o r i = α 0 + α 1 e d u c a t i o n i + α 2 X i + μ i
B e h a v i o r i represents the sustainable behavior of the I-th student; e d u c a t i o n i i is ecological education in universities. X i encapsulates control variables including the resource characteristics of university students in various aspects, etc. μ i is a random disturbance item. Assuming the μ~N(0, 1) distribution, the model is as follows:
P ( B e h a v i o r = 0 | x ) = P ( B e h a v i o r * r 0 x = φ ( r 0 α 1 e d u c a t i o n i α 2 X i )
P ( B e h a v i o r = 1 | x ) = P ( r 0 < B e h a v i o r * r 1 x = φ r 1 α 1 B e h a v i o r i α 2 X i φ ( r 0 α 1 e d u c a t i o n i α 2 X i )
P ( B e h a v i o r = 4 | x ) = P ( r 3 B e h a v i o r * x = 1 φ ( r 3 α 1 e d u c a t i o n i α 2 X i )
In Formula (2), r 0 < r 1 < r 2 < r 3 is the parameter to be estimated. The values of B e h a v i o r i range from 0 to 4, indicating the degree of university students’ participation in sustainable behavior. The higher the values are, the higher the frequency of sample participation will be. By constructing the likelihood function, finally, in order to estimate the parameters of the model, we use the maximum likelihood method to solve it.
To calculate whether students’ perception of economic value, health value, and social value plays an important role in mediating between ecological education and sustainable behavior, according to the existing research, we construct a mediation effect test:
Y k i = α 0 e d u c a t i o n i + β 0 X i + μ 0
p e r c e p t i o n i = α 2 e d u c a t i o n i + β 2 X i + μ 2
Y k i = α 3 e d u c a t i o n i + β 3 p e r c e p t i o n i + X 0 X i + μ 3
In Equation (3), α 0 reflects the total effect of ecological education on university students’ sustainable behavior and α 2 represents the effect of ecological education on the mediating variables. p e r c e p t i o n i is university students’ perception of economic value, health value, and social value. In Equation (5), α 3 , β 3 respectively represent the direct effects of ecological education and value cognition of waste sorting on the sustainable behavior of student i. Combing (4) and (5), we can get the mediating effect α 2 β 3 ; this is the indirect influence of ecological education on the sustainable behavior of university students through three mediating variables. Finally, α 2 β 3 / α 0 represents the mediating effect ratio, showing the size of this mediating effect of the influence.

4.2. Tool Selection

The data collected in this study were tested and empirically analyzed using SPSS software version 26 and STATA software version 16.0. Firstly, SPSS software was used to verify the reliability and validity of the data, and the Cronbach’s α coefficient of each variable was calculated to evaluate the reliability of the questionnaire measurement problem. SPSS has good ease of use and a simple graphical interface [16]. It does not require writing complex commands but provides a wide range of data statistical analysis, covering basic data analysis needs, from simple descriptive statistics to test analysis. Furthermore, SPSS has a relatively high efficiency in processing data. Currently, most researchers in the field of statistics choose it for data processing. Therefore, in this study, SPSS was used for data factor analysis to test the reliability and validity of the scale.
Compared with SPSS, STATA software has stronger functions in handling correlation analysis [37]. The input commands it uses not only include descriptive analysis, multiple regression, and simple regression but also have extensive statistical analysis capabilities, enabling it to quickly and effectively conduct regression analysis on large-scale data using hundreds of models. It also features powerful programming and scalability. By writing code, it automates the implementation of cumbersome data analysis tasks and encapsulates its own code into custom functional modules. The IV-Oprobit model used in this study was precisely implemented with the help of the CMP code in STATA software, which can control the endogeneity problem in causal relationship analysis to the greatest extent. Therefore, in this study, STATA software was used to conduct analyses of the main effect, mediating effect, and moderating effect.

4.3. Validity and Reliability Tests

To ensure that the tool had surface validity, content validity, and conceptual validity, this study tested the three types of validity before the empirical test. The questionnaire was filled out in both Chinese and English by three professors from the College of Economics of Sichuan Agricultural University and doctoral students familiar with this research topic. They reviewed and evaluated the content and structure of the questionnaire and formed a formal questionnaire measurement scale based on their feedback and modifications. To test the content validity of the research tool, since the factor analysis method could define and summarize the basic dimensions of the measured components, SPSS software was used for the test in this study. Due to the diversity of the target groups involved, exploratory factor analysis (EFA) was adopted in this study [5]. Firstly, before conducting factor analysis, KMO and Bartlett sphere tests need to be carried out to determine whether the sample data is suitable for factor analysis. The closer the KMO is to 1, the more suitable it is for common factor analysis. Generally, it is believed that when the KMO is greater than 0.7, factor analysis is more suitable. As shown in Table 3, the KMO value of the survey data was 0.738 > 0.7, indicating that the research data was suitable for extracting information and explained 77.7% of the variance. The significance probability of the Bartlett sphere test was 0.000 < 0.001, also indicating that this study was suitable for factor analysis.
In this study, the optimal oblique rotation method was adopted to extract factors. The principal component analysis method was used to rotate the original variables. After the rotation iteration, convergence was achieved and the following pattern matrix was obtained. Through the principal component analysis method, three common factors were derived from the analysis method and research design. Each question type had a relatively high factor loading coefficient on the corresponding factor. The factor loading coefficients of all question items were higher than 0.5, and the eigenvalues were all greater than 1. The loading coefficients on other factors were relatively low, meeting the requirements of factor analysis. This indicates that the degree of aggregation of the variables in this study was good. The specific results are shown in Table 4.
Reliability and reliability refer to the degree of consistency in obtaining the same results when repeatedly measuring the same thing using the same indicators or measurement tools. The most commonly used indicator for evaluating internal consistency in behavioral science is Cronbach’s alpha coefficient. In this study, the Cronbach’s α values for ecological education, sustainable behavior, and cognition were 0.812, 0.818, and 0.826, respectively, which indicates that the research tools had a strong internal consistency.
Validity and effectiveness measure whether the comprehensive evaluation system can accurately reflect the evaluation purpose and requirements. It refers to the degree of accuracy to which a measuring tool can measure the features it intends to measure. Since the measurement items of this study were obtained through multiple discussions and literature synthesis, the content validity was relatively good. The method adopted for the structural validity analysis was factor analysis. The KMO value of this study was greater than 0.7, indicating that the structural validity of the questionnaire was good.
Convergence validity: Convergence validity refers to the degree to which a feature is well measured by its index. Convergence validity depends on whether the variable load of the observed specific factor is high. The evidence of convergence validity is examined through confirmatory factor analysis, in which all items of the scale are loaded on their respective dimensions. It was calculated through the SPSS tool that in this study, the AVE values of ecological education, sustainable behavior, and cognition were 0.708, 0.712, and 0.723, respectively, all greater than 0.5, indicating that the variables had a high convergent validity.
In terms of composite reliability, SPSS software was used and the method of factor analysis was adopted to calculate the composite reliability of a single dimension in the multi-dimensional test. The composite reliability of each dimension was between 0.90 and 0.96. Comparatively speaking, Cronbach’s α coefficient underestimated the reliability of each dimension, further proving the reliability of the variable measurement in this study.
In addition, to ensure the reliability of the model estimation [23], this study also conducted multicollinearity tests on all variables and found that the variance inflation factor (VIF) of the variables was less than 2, indicating that there was no multicollinearity problem in all the variable data selected in this study.

5. Results

5.1. Impact of Ecological Education on University Students’ Sustainable Behavior

As shown in Table 5, models (1) and (2) used the OLS and Oprobit models, respectively, to investigate the impact of ecological education in universities on the sustainable behaviors of sample students on the basis of controlling interference factors such as household registration, environmental association participation, and environmental reflection. The results showed that teaching courses, practical activities, and environmental experiments all had significant positive effects on students’ sustainable behavior, all at the level of 1–5%, among which environmental practice activities had the highest impact coefficient and the strongest significance. It could be seen that for university students who participated in environmental protection practice activities, their chance to implement sustainable behaviors was 7.1% higher than that of other university students. In models (3) and (4), the OLS and Oprobit models were used, respectively, to find that the overall degree of ecological education had a positive and significant effect on the sustainable behavior of the sample university students at the level of 1%. The results showed that the higher the level of ecological education in university was, the more likely students were to implement sustainable behavior.
It is worth paying special attention to the fact that the relationship between individuals receiving ecological education and their sustainable behavior may have led to endogeneity problems due to common two-way causal reasons, resulting in bias in the estimation results [51,52]. Therefore, this study adopted the method of instrumental variables to make corrections. Based on the selection principle that instrumental variables should be correlated with endogenous explanatory variables and unrelated to disturbance terms [53], this study took the average level of ecological education received by students in the same class as the instrumental variable. Due to the social herding effect, the level of university students’ participation in ecological education was easily affected by their classmates, but the average level of ecological education received by class students was not directly related to the sustainable behavior of the sample, and the verification results of regression analysis also supported the above theoretical analysis, so this variable was suitable to be used as an instrumental variable in this study. Accordingly, model (5) showed the estimation results using IV-Oprobit. The lnsig value was significant at the 1% level, and the two-stage estimation was significant through the likelihood ratio test, indicating that the estimation results after using the instrumental variable method were more accurate. After controlling for the problem of two-way causal endogeneity, the impact coefficient of ecological education in universities was 0.297. The significance level was consistent with the estimated results of model (4), which further confirms the positive effect of ecological education on university students’ sustainable behavior. Model (6) estimated the marginal effect after controlling the endogenous problem. The results showed that the probability of university students implementing sustainable behaviors increased by 10.7% with each increase of one unit in the level of ecological education in universities. H1 has been verified.
In terms of other control variables, household registration, participation in environmental associations, environmental reflection, social networks, and the occupations of family members all had an impact on the sustainable behavior of sample students. Specifically, the impact of household registration on students’ sustainable behavior was significantly positive at the level of 10%. Students from rural areas had long-term direct contact with the ecological environment, had a stronger sense of environmental home, and were more likely to implement sustainable behavior. The probability that university students participating in environmental associations were willing to implement sustainable behaviors was 5.2% higher than that for other university students. Since university environmental associations were keen on organizing student activities, university students who joined environmental associations tended to receive more ecological and environmental information in collective activities and had a higher probability of implementing environmental protection behaviors. Environmental reflection positively affected sustainable behavior at the level of 10%. The possible reason was that cognition was the driving force of behavior, and the higher the degree of reflection on environmental damage was, the more likely university students were to implement sustainable behavior. The probability of university students with good social networks being willing to implement sustainable behavior was 5.3% higher than that of other groups. The group with a high level of social network had more interpersonal communication and information exchange, and it was easier for them to perceive the benefit of environmental protection. The influence of family members’ occupations on students’ sustainable behavior was significantly positive at the level of 1%. The more relatives and friends of university students were engaged in environmental industry, the more likely they were to rely on their superior information resources to enable their sustainable behavior.

5.2. The Mediating Effect of Economic Value Perception and the Regulating Effect of PM2.5 Exposure

Theoretical analysis suggests that university students’ economic value perception of environmental protection may play a partial mediating role in the impact of ecological education in university on their sustainable behaviors. In order to empirically test this hypothesis and clarify the transmission mechanism, the step-by-step regression method used by Zhang et al. (2024) was used for analysis [24]. As shown in Table 6, model (1) used probit to estimate and test the impact of ecological education on sample economic value perception, and the results showed that ecological education had a positive impact on university students’ economic value perception of implementing sustainable behaviors at the 1% level. Model (2) mainly studied the latter half of the process of the intermediary effect. The results showed that the impact of economic value perception on university students’ sustainable behavior was also significantly positive at the 1% level, indicating that the more economic benefits university students believe that implementing sustainable behavior can bring, the more likely they are to start businesses because of the potential benefits. Model (3) introduced independent variables and intermediary variables at the same time, and the results showed that the estimated coefficients of ecological education received by university students and their economic value perception were both positive and the influence on the explained variables was also significant at the level of 1%. Column (4) shows the estimation results using IV-Oprobit. The lnsig value was −0.063, which was significant at the level of 1%, and the two-stage estimation was significant. After controlling for the bidirectional causal endogeneity between the independent variable and the dependent variable, the settlement results were consistent with the above, and ecological education and economic value perception at university both played a positive role in promoting the sustainable behavior of university students. Compared with the IV-Oprobit estimated coefficient of ecological education without the introduction of economic value perception, the impact coefficient of ecological education on the sustainable behavior of the samples was lower, which preliminarily proved that university students’ economic value perception of environmental protection plays a part of the intermediary effect in this impact.
Based on the calculation results of model (1)–(4), it is not difficult to find that individual economic value perception plays a partial mediating role in the process of ecological education affecting students’ sustainable behavior. Specifically, with the enrichment of ecological education in university, students gain knowledge and personally feel and practice in teaching courses, practical activities, and environmental experiments, and their perception level of the economic value that environmental protection can bring is constantly improved. Under the comprehensive judgment of cost and benefit, they are prompted to adopt sustainable behaviors, and hypothesis H2a is confirmed.
In order to test the hypothesis that PM2.5 exposure plays a moderating role in the latter half of the above mediation effect, model (5) simultaneously introduced economic value perception, the implementation of sustainable behavior PM2.5 exposure, and their interaction terms and used Oprobit for empirical calculation. The results show that the impact of economic value perception and PM2.5 exposure on the sustainable behavior of university students was positively significant at the 1% and 10% levels, and the interaction term was positively significant at the 10% level, indicating that the PM2.5 exposure played a positive moderating role in the impact of economic value perception on the sustainable behavior of the sample. Hypothesis H3a has been verified. As a visual variable of environmental risk, the higher the exposure to PM2.5 is, the more likely it is to prompt university students to examine whether their own behaviors have caused damage to the environment. When university students have a higher perception of environmental protection economic value, as rational economic individuals, a higher exposure to PM2.5 is likely to stimulate their awareness and determination of environmental protection. PM2.5 exposure can positively regulate the impact of perceived economic value on students’ sustainable behavior.

5.3. Mediating Effect of Social Value Perception and the Moderating Effect of PM2.5 Exposure

As shown in Table 7, five models were used to verify the hypothesis. The calculation results of model (1)–(3) showed that ecological education has a significantly positive impact on the social value perception of the samples implementing sustainable behaviors. Under the catalysis of ecological education in university, when university students agree that environmental protection can promote the sustainable development of society, they are more likely to implement sustainable behaviors. That is, university students’ perception of social value plays a part of mediating effect in the influence of ecological education on promoting their sustainable behavior. Specifically, the more ecological education in university is enriched, the audience’s perception of environmental protection to promote social sustainable development will change accordingly, and university students will be more likely to form value recognition and social achievement recognition for implementing sustainable behaviors and thus be willing to adopt sustainable behaviors. Model (4) showed the results estimated by using IV-Oprobit. After controlling for the problem of two-way causal endogeneity, it once again verified the positive promoting effect of ecological education in universities and university students’ social value perception on their sustainable behaviors and the partial mediating effect of social value perception, further verifying hypothesis H2b.
In model (5), social value perception, sustainable behavior PM2.5 exposure, and their interaction were introduced. The results showed that both social value perception and PM2.5 exposure positively affected the sustainable behavior of university students at the significant level of 1%, and the interaction term was positively significant at the level of 10%. It could be seen that the implementation of sustainable behavior PM2.5 exposure positively moderated the impact of social value perception on their sustainable behavior. The explanation is that on the premise that university students have a strong sense of social benefit for implementing sustainable behaviors, the stronger the actual ambient air pollution is, the greater is the environmental risk of the environment in which the sample is located, and the more likely they are to perceive the accessibility of improving social welfare and achieving sustainable development through environmental protection. H3b can be verified by positively adjusting the stimulating performance of social value perception on students’ implementation of sustainable behaviors.

5.4. The Mediating Effect of Health Value Perception and the Moderating Effect of PM2.5 Exposure

Similarly, as shown in Table 8, models (1)–(4) verified the positive impact of ecological education on university students’ perceived health value, the positive impact of individuals’ perceived environmental health value on their environmental sustainability behavior, and the partial mediating effect of university students’ perceived health value. Specifically, with the deepening of ecological education in university, individuals’ perception of the value of environmental protection and health continued to improve. Students may have been more likely to agree that implementing sustainable behaviors can slow down environmental pollution, improve ecological balance, and ultimately benefit human health, thus increasing the probability of willing to implement sustainable behaviors accordingly. Hypothesis H2c has been verified. In model (5), health value perception, PM2.5 exposure, and their interaction terms were also introduced. The results showed that the perceived health value and PM2.5 exposure had a positive impact on the sustainable behavior of university students, and the interaction term was positively significant at the significance level of 1%, which indicates that hypothesis H3c is valid.
Through the above empirical results, it is obvious that ecological education can help college students enhance their understanding of the economic, social, and health values of environmental protection. These three high-level understandings will further promote their environmental protection behaviors under the adjustment of PM2.5 exposure. Therefore, this paper has derived a theoretical model to analyze the environmental protection behaviors of college students (Figure 1).

5.5. Heterogeneity Analysis of Urban and Rural Households

Due to natural factors and historical reasons, China has a relatively differentiated urban–rural dual structure, with differences in infrastructure construction, education level, consciousness, and cognition between urban and rural areas [54]. China’s urbanization development is extremely rapid. The huge population base has led to the diversification of population concentration areas. China’s population concentration areas can mainly be divided into three categories: cities, towns, and rural areas. A city refers to a human settlement with a permanent resident population of over 500,000, mainly consisting of non-agricultural activities and non-agricultural population. For example, there are various provincial capital cities and prefecture-level cities in China. A town refers to a settlement with a permanent resident population of less than 500,000, where non-agricultural and agricultural activities coexist, such as in various counties and districts in China. Rural areas are regions where agricultural activities are dominant and the population is sparsely distributed, and these are widely distributed throughout China. Recent studies have found that urban and rural household residents also have different performances in terms of environmental behavior [55]. In the existing heterogeneity analysis of environmental behavior, samples are generally simply divided into urban and rural areas [56]. Few studies have conducted more detailed divisions of and research on the three dimensions of urban, town, and rural areas in combination with the reality of China’s large span of urban and rural areas. Therefore, according to the household registration addresses of college students, this study divided the samples into three groups: urban, town, and rural households.
As shown in Table 9, in terms of college students’ perception of environmental value, students from urban families had the highest level of economic value perception of environmental protection, which may have been due to the fact that young people who grow up in cities have more understanding and cognition of emerging environmental protection industries while students born in rural areas may find it difficult to find the economic growth benefits brought by the environment. In contrast, students from urban households have a significantly lower perception of the social and health value of environmental protection than students from town and rural households. The possible explanation is that college students from cities have difficulty in direct contact with the ecological environment while rural residents have been exposed to agriculture, forestry, animal husbandry, and fishery for a long time and their social sustainable development welfare and physical health are closely related to the surrounding natural environment and the condition of the natural environment will affect their social and health interests [57]. Therefore, students from rural and town households have a higher perception of environmental social value and health value. In this study, college students from rural households were more likely to report to management, promote environmental sustainability to others, implement garbage sorting, and protect plants and animals; their overall degree of sustainable behavior was also the highest. Students who grow up in densely populated cities are less likely to pay more attention to environmental risks and human–land relations. There is a lack of reflection on the relationship between people and land and a genuine environmental motivation [58]. In contrast, China’s town area is located at the junction of urban and rural areas, and there is neither complete environmental protection publicity and guidance facilities nor lands that families own. As a result, people who grow up here have a weak sense of home and a less sense of environmentally sustainable development.
As shown in Table 10, grouping regression results showed that the impact of ecological education on college students’ sustainable behaviors was heterogeneous. After controlling for endogenous problems, the impact of ecological education on students’ sustainable behaviors in urban households was significantly positive only at the 5% level. In both town households and rural households, the positive impact of ecological education on their sustainable behavior was significant at the level of 1%, and the marginal effect was greater in rural households. The possible explanation is that most of the students from rural families are engaged in agriculture, forestry, animal husbandry, and fishery, which are directly related to the development and utilization of natural resources, so they have more opportunities to contact with nature and then have more opportunities to think about the relationship between man and nature [23]. When they receive ecological education at university, they accumulate more environmental knowledge and value perception; are more likely to accept ecological education, understand and receive information, and transform their own actions; and are more likely to stimulate their sustainable behaviors. On the contrary, individuals growing up in cities are constantly exposed to too many miscellaneous stimuli, and in the state of overload, they may have low expectations and confidence in environmental optimization [57] and lack the endogenous motivation to consciously implement sustainable behaviors.

5.6. Robustness Test

First, the model robustness test of the main effect model was carried out. Replacing the main effect model with the Logit, the results of the impact of ecological education on university students’ sustainable behavior were still significant at the significance level of 1%, indicating that the model was robust.
Secondly, the model robustness test of the intermediary effect model was carried out. Instead of the mediating-effect test method, the Sobel method and Bootstrap method were used to test [59]. The results showed that the mediating-effect test of students’ perception of environmental value, such as in economic value perception, social value perception, and health value perception, was significant at the level of 1%; that is, the three types of environmental value perception all played a partial mediating role in the main effect, and the mediating effect values were 0.006, 0.007, and 0.008, respectively (Table 11). The mediating effect accounted for 11.5%, 13.5%, and 15.4%, respectively, which confirmed the robustness of the three mediating transmission mechanisms, and found that the perceived health value had the greatest mediating effect on the sustainable behavior of university students in ecological education.
Thirdly, we conducted a robustness test on the moderating effect. The empirical test found that PM2.5 exposure can positively regulate the impact of perceived economic, social, and health values on university students’ sustainable behavior. In order to further compare the strength of the interaction effect, the method of Aiken et al. (1991) was referred to and SPSS26.0 was used for data analysis [60]. The Process macro program was used to test the above three adjustment effects and draw the adjustment effect diagram. As shown in Figure 2, in the case of high PM2.5 exposure, the regression slope of economic value perception and sustainable behavior of university students was greater, indicating that the effect of economic value perception was relatively strong at this time. In the case of low PM2.5 exposure, the regression slope was smaller, indicating that PM2.5 exposure positively moderates the positive impact of economic value perception on university students’ sustainable behavior. Similarly, in the case of high PM2.5 exposure, the regression slope of health and social value perception and sustainable behavior of university students was greater, and PM2.5 exposure played a positive moderating role (Figure 3 and Figure 4). Thus, the more serious external environmental pollution is, the more likely it is to stimulate the public’s perception of health benefits of environmental protection [48] and the more likely it is to stimulate the positive promoting effect of health-benefit perception on university students’ sustainable behavior [8].

6. Discussion

6.1. Marginal Contribution

Similar to the research of Velempini (2025) [61], this study also adopted the questionnaire survey method, revealing that the popularization of environmental education can ultimately achieve the sustainable development goals. It is also suggested that environmental education be effectively mainstreamed in the school curriculum and practical learning environment to enable society to be resilient. However, what is different from this is that we have adopted all quantifiable specific problems to measure the scope and indicators of ecological education and the level of students’ sustainable behaviors more scientifically. With the help of quantitative models, this paper can draw more detailed scientific conclusions. Compared with the research of Bibi et al. (2025) [62], the survey sample of this study exceeded 1000, which was much higher than the 42 samples they selected. We also found that ecological education has a positive and significant impact on students’ behaviors. After receiving environmental education courses, individuals’ future environmental protection behaviors changed. However, our research conclusion is more in-depth: we have discovered the mediating transmission mechanism of this positive impact. Ecological education first extends to environmental behavior by influencing individuals’ value perception, which is more targeted for the optimization of policy recommendations. And comparison with the research of Cai et al. (2025) [63] reveals that we have further refined the scope of self-efficacy perception, expounded it from three dimensions, and further deepened the research on the influencing factors of students’ environmental behaviors. The similarity with the research of Wu et al. (2025) [64] lies in that we have both found that environmental education is of great significance in promoting the construction of social ecological civilization. However, we avoided the structural equation model they used. For microscopic survey data, the SEM model is prone to overfitting due to factors such as small sample sizes and data types. Comparing with the research of Ballarotto et al. (2025) [65], they found that self-attitude is an important factor influencing an individual’s environmental behavior. On this basis, we further refined an individual’s subjective attitude into economic, social, and health cognition. This comprehensive measurement system was more comprehensive and systematic than the previous subjective attitude. This research mainly had the following innovative contributions. First, a systematic index system for ecological education was constructed by using the hierarchical evaluation method, including three dimensions: teaching courses, practical activities, and environmental experiments. Different from previous studies that only measured from the objective frequency, we selected six indicators from the objective reality and subjective psychology levels and incorporated individuals’ subjective evaluations of affairs into the measurement system. This was more comprehensive and scientific than the indicators of previous studies because subjective attitudes can affect students’ subjective acceptance of affairs. Second, this study did not use single micro-survey data or panel statistical data like previous studies [29,33], but cleverly combined the two kinds of data and analyzed the survey data of Chinese university students and the PM2.5 exposure data at the municipal level. The empirical results were more reliable and had more guiding significance at the macro level. Third, most studies directly use environmental pollution indicators as independent variables to predict pro-environmental behaviors [10,32] without considering the possibility of interaction between objective environmental pollution indicators and other psychological variables. This study considered the interaction between objective air pollution and individual subjective psychological factors and found that the driving effect of environmental pollution was not entirely a direct influence, but a large part of the effect channels came from the interaction with individual psychological variables, which provided a reference for the study of the interaction between real pollution and public psychological variables in the field of environmental economics. Fourth, it was different from previous simple regression analysis studies [30,31], and this study constructed a systematic framework for analyzing college students’ sustainable behaviors, including three transmission paths of economic, social, and health value perception. It particularly considered the moderating effect of PM2.5 air pollution variables in the individual’s area and fully combined subjective cognition with objective environmental conditions. The use of the instrumental variable method and IV-Oprobit to control the endogeneity of the model greatly improved the robustness and scientificity of the model. Fifth, we found that the influence of ecological education on students’ behavior is heterogeneous among urban, town, and rural families. In contrast, students from rural families have a higher level of environmentally sustainable behavior and perception of environmental values and are more influenced by ecological education in universities. This is related to their closer proximity to the natural environment, revealing the logic of a phenomenon: the environment of an individual’s birthplace will subconsciously change their future views and acceptance of ecological education.

6.2. Policy Suggestions

First of all, universities should not only exert influence through environmental classroom teaching but also pay attention to practical activities in the forms of campus green public welfare, social media promotion, watching environmental videos, environmental research projects, and environmental natural science experiments, guiding college students to think about the relationship between humans and nature, thereby cultivating college students’ sense of responsibility and belonging to the environment. This can inspire them to think deeply about environmental protection issues and then consciously practice sustainable behaviors.
Secondly, universities should encourage students to enhance their awareness of the value of environmental protection. Through regular and mobile lectures and classroom learning, scientifically interpreting the current situation and causes and potential risks of environmental pollution will continuously enhance young college students’ awareness of the economic, social, and health values of implementing sustainable behaviors and continuously cultivate their intrinsic motivation to carry out sustainable behaviors.
Thirdly, for college students in low-pollution areas, various media resources, such as campus radio, bulletin boards, and online platforms, can be fully utilized to enhance environmental protection publicity efforts. Meanwhile, environmental protection posters should be posted regularly on campus bulletin boards to enable college students to fully understand and absorb real environmental threats. The government should create a social atmosphere of protecting nature and caring for the environment in society through public opinion propaganda, public guidance, and other means.
Fourth, we must pay attention to adjusting ecological education strategies for different household registrations to meet the needs of different groups. With regard to college students from cities, they should be encouraged to go out of their campuses and urban areas. Through on-site investigations and practical activities, they should have more contact and experience with the natural environment and enhance their understanding of theoretical knowledge related to the environment. For college students from rural areas, their close ties with families, villages, land, etc. should be utilized to transform their perception of environmental risks and positive environmental attitudes into actual environmentally friendly living and working behaviors.

6.3. Research Prospects

The data in this study represented a cross-sectional section. Its explanatory power in causal reasoning was not as strong as that of panel data. Moreover, there were also some limitations in data collection and the analysis of the influence mechanism of pro-environmental behaviors. In future research, it is possible to further explore the construction of more systematic subjective psychological indicators for students and objective evaluation indicators for education, thereby establishing a more complete indicator system for ecological education in universities. Future research can further explore whether there are other important mediating variables between environmental risk perception and pro-environmental behavior and thereby investigate their chain mediating effects. In future research, a longer time scale and a wider range of survey data are still needed to further verify the results of this study. In future research, sample data from multiple universities can also be collected, focusing on the differences in education and effects on environmental sustainability among different universities. However, this indicates for the targeted policies that part of the schools need to carry out environmental education more.

7. Conclusions

Based on the cross-sectional survey data of Chinese college students, this study adopted the AHP to construct a systematic index system for ecological education in universities and sustainable behaviors of college students. A variety of econometric model systems were adopted to explain their influence relationships and mechanisms. It was found that ecological education in universities can effectively promote sustainable behaviors among college students. The three types of environmental value perceptions of individuals are all important mediating channels of ecological education, among which the mediating effect of health value perception is the strongest. Meanwhile, the PM2.5 exposure equivalent positively moderates the impact of value perception on their sustainable behaviors. More interestingly, the influence of ecological education on students’ behaviors shows heterogeneity among urban and rural families. Students from rural families have a higher level of perception of sustainable behaviors and environmental values and are more likely to be influenced by ecological education.

Author Contributions

W.H., Q.Y., Y.C., L.L., J.D., Q.W., J.W. and H.M. contributed to the study conception and design. All authors have read and agreed to the published version of the manuscript.

Funding

This research was funded by the Research Center for Agricultural Modernization and Rural Revitalization project no. AMRR2024006, Research Center for Agricultural Modernization and Rural Revitalization project no. AMRR2024010, and Sichuan Academy of Social Sciences “Chengdu-Chongqing area double city economic circle construction” project no. 24YBCY03.

Institutional Review Board Statement

Not applicable.

Informed Consent Statement

Not applicable.

Data Availability Statement

Data cannot be shared publicly because the ownership of the data lies with the institution.

Conflicts of Interest

The authors declare no conflicts of interest.

References

  1. Carson, R.; Darling, L.; Darling, L. Silent Spring; Houghton Mifflin: Boston, MA, USA, 1962. [Google Scholar]
  2. Gough, A. Mutualism: A different agenda for environmental and science education. Int. J. Sci. Educ. 2002, 24, 1201–1215. [Google Scholar] [CrossRef]
  3. Nowak-Marchewka, K.; Osmólska, E.; Stoma, M. Progress and Challenges of Circular Economy in Selected EU Countries. Sustainability 2025, 17, 320. [Google Scholar] [CrossRef]
  4. Wu, S.; Xiao, Y.; Pacala, A.; Badulescu, A.; Khan, S. Understanding Chinese Farmers’ Behavioral Intentions to Use Alternative Fuel Machinery: Insights from the Technology Acceptance Model and Theory of Planned Behavior. Sustainability 2024, 16, 11059. [Google Scholar] [CrossRef]
  5. Al Husban, W. The Impact of Integrating Sustainable Development Goals on Students’ Awareness and Pro-Environmental Behavior: A Case Study of Jordan. Sustainability 2025, 17, 2588. [Google Scholar] [CrossRef]
  6. Chwialkowska, A.; Bhatti, W.A.; Glowik, M. The Influence of Cultural Values on Pro-Environmental Behavior. J. Clean. Prod. 2020, 268, 122305. [Google Scholar] [CrossRef]
  7. Sunari, R.; Nurhayati, S. Community environmental education through a local knowledge-based learning program on plastic waste management. J. Educ. 2023, 5, 13093–13099. [Google Scholar]
  8. Liu, S.; Luo, L. A Study on the Impact of Ideological and Political Education of Ecological Civilization on College Students’ Willingness to Act Pro-Environment: Evidence from China. Int. J. Environ. Res. Public Health 2023, 20, 2608. [Google Scholar] [CrossRef]
  9. Leeuw, A.; Valois, P.; Ajzen, I.; Schmidt, P. Using the Theory of Planned Behavior to Identify Key Beliefs Underlying Pro-Environmental Behavior in High-University Students: Implications for Educational Interventions. J. Environ. Psychol. 2015, 42, 128–138. [Google Scholar] [CrossRef]
  10. Mbama, C.A.; Otegbulu, A.; Beverland, I.; Beattie, T.K. Solid waste recycling within higher education in development countries: A case study of the University of Lagos. J. Mater. Cycles Waste Manag. 2023, 25, 886–898. [Google Scholar] [CrossRef]
  11. Cao, M.Y. The current situation and countermeasures of ecological civilization education in Henan Province’s universities. China Adult Educ. 2018, 98–101. Available online: http://kdd.epsnet.com.cn/documentDetail?aId=1081569&keyword=%E6%B2%B3%E5%8D%97%E7%9C%81%E9%AB%98%E6%A0%A1%E7%94%9F%E6%80%81%E6%96%87%E6%98%8E%E6%95%99%E8%82%B2%E7%8E%B0%E7%8A%B6%E5%8F%8A%E5%BA%94%E5%AF%B9 (accessed on 28 June 2025). (In Chinese).
  12. Gong, Y.; Li, Y.; Sun, Y. Waste sorting behaviors promote subjective well-being: A perspective of the self-nature association. Waste Manag. 2023, 157, 249–255. [Google Scholar] [CrossRef] [PubMed]
  13. Mónus, F. Environmental Education Policy of Universitys and Socioeconomic Background Affect Environmental Attitudes and Pro-Environmental Behavior of Secondary University Students. Environ. Educ. Res. 2022, 28, 169–196. [Google Scholar] [CrossRef]
  14. Tong, Y.; Liu, J.; Liu, S. China is implementing “Garbage classification” action. Environ. Pollut. 2020, 259, 113707. [Google Scholar] [CrossRef] [PubMed]
  15. Wang, Q.; Niu, G.; Gan, X.; Cai, Q. Green Returns to Education: Does Education Affect pro-Environmental Attitudes and Behaviors in China? PloS ONE 2022, 17, e0263383. [Google Scholar] [CrossRef]
  16. Qiao, D.; Luo, L.; Zheng, X.; Fu, X. External Supervision, Face Consciousness, and Pesticide Safety Use: Evidence from Sichuan Province, China. Int. J. Environ. Res. Public Health 2022, 19, 7013. [Google Scholar] [CrossRef]
  17. Qiao, D.; Luo, L.; Chen, C.; Qiu, L.; Fu, X. How does social learning influence Chinese farmers’ safe pesticide use behavior? An analysis based on a moderated mediation effect. J. Clean. Prod. 2023, 430, 139722. [Google Scholar] [CrossRef]
  18. Sutisno, A.N.; Novianawati, N.; Hidayatullah, M.A. Domestic Waste Management Strategy through Realization of University Waste Banks towards Students Scientific Behavior. Int. J. Educ. Qual. Quant. Res. 2023, 2, 1–6. [Google Scholar] [CrossRef]
  19. Luo, L.; Qiao, D.; Wang, L.; Qiu, L.; Liu, Y.; Fu, X. Farmers’ cognition of the COVID-19 outbreak, risk perception and willingness of green production. J. Clean. Prod. 2022, 380, 135068. [Google Scholar] [CrossRef]
  20. Qiao, D.; Luo, L.; Zhou, C.; Fu, X. The influence of social learning on Chinese farmers’ adoption of green pest control: Mediation by environmental literacy and moderation by market conditions. Environ. Dev. Sustain. 2023, 25, 13305–13330. [Google Scholar] [CrossRef]
  21. Yazdanpanah, M.; Feyzabad, F. Investigating Iranian farmers’ satisfaction with agricultural extension programs using the American customer satisfaction index. J. Agric. Food Inf. 2017, 18, 123–135. [Google Scholar] [CrossRef]
  22. Zhang, R.; Luo, L.; Liu, Y.; Fu, X. Impact of Labor Migration on Chemical Fertilizer Application of Citrus Growers: Empirical Evidence from China. Sustainability 2022, 14, 7526. [Google Scholar] [CrossRef]
  23. Luo, L.; Qiao, D.; Tang, J.; Wan, A.; Qiu, L.; Liu, X.; Liu, Y.; Fu, X. Training of Farmers’ Cooperatives, Value Perception and Members’ Willingness of Green Production. Agriculture 2022, 12, 1145. [Google Scholar] [CrossRef]
  24. Zhang, S.; Luo, Y.; Zhang, P. A comparative study of factors influencing residents’ waste sorting behavior in urban and rural areas of China. Heliyon 2024, 10, E30591. [Google Scholar] [CrossRef] [PubMed]
  25. Cao, G.; Liu, P.; Cao, R. Resident motivations, policy types and multisphere waste sorting intention in China from a dual-interest integration perspective: An expanded goal-framing theory. Environ. Impact Assess. Rev. 2024, 108, 107596. [Google Scholar] [CrossRef]
  26. Alshurideh, M.; Kurdi, B.A.; Shaltoni, A.M.; Ghuff, S.S. Determinants of Pro-Environmental Behaviour in the Context of Emerging Economies. Int. J. Sustain. Soc. 2019, 11, 257–277. [Google Scholar] [CrossRef]
  27. Zebardast, L.; Radaei, M. The Influence of Global Crises on Reshaping Pro-Environmental Behavior, Case Study: The COVID-19 Pandemic. Sci. Total Environ. 2022, 811, 151436. [Google Scholar] [CrossRef]
  28. Luo, L.; Yang, Q.; Qiao, D.; Cao, Y.; Ding, J.; Ma, H.; Wei, J. How does environmental education affect college students’ waste sorting behavior: A heterogeneity analysis based on educational background. J. Environ. Manag. 2025, 389, 126064. [Google Scholar] [CrossRef]
  29. Huang, P.; Westman, L. China’s imaginary of ecological civilization: A resonance between the state led discourse and sociocultural dynamics. Energy Res. Soc. Sci. 2021, 81, 102253. [Google Scholar] [CrossRef]
  30. Zheng, Q.J.; Xu, A.X.; Kong, D.Y.; Deng, H.P.; Lin, Q.Q. Correlation Between the Environmental Knowledge, Environmental Attitude, and Behavioral Intention of Tourists for Ecotourism in China. Appl. Ecol. Environ. Res. 2018, 16, 51–62. [Google Scholar] [CrossRef]
  31. Jiang, J. Research on strengthening ecological civilization education in ethnic universities under the “dual carbon” goal. Ethn. Educ. Res. 2022, 33, 84–91. [Google Scholar]
  32. Li, X.; Qin, W.; Qi, F.; Zhang, S. Regional differences in China’s ecological civilization construction from an evolutionary perspective and the influencing factors. Int. J. Sustain. Dev. World Ecol. 2024, 32, 627–638. [Google Scholar] [CrossRef]
  33. Ma, Z.; Li, C.; Xue, Y.; Nduneseokwu, C.K.; Wang, X.; Harder, M.K. From pioneer to promotion: How can residential waste diversion non-profit organizations (NPOs) best co-evolve in modern China? Environ. Challenges 2021, 3, 100055. [Google Scholar] [CrossRef]
  34. Liefländer, K.; Bogner, F.X. Educational impact on the relationship of environmental knowledge and attitudes. Environ. J. Educ. Res. 2018, 24, 611–624. [Google Scholar] [CrossRef]
  35. Peng, H.; Shen, N.; Ying, H.; Wang, Q. Factor analysis and policy simulation of domestic waste sorting behavior based on a multiagent study—Taking Shanghai’s garbage classification as an example. Environ. Impact Assess. Rev. 2021, 89, 106598. [Google Scholar] [CrossRef]
  36. Jurdi, R.; Hage, H.; Chow, H. Cognitive and behavioural environmental concern among university students in a Canadian city: Implications for institutional interventions. Aust. J. Environ. Educ. 2019, 35, 28–61. [Google Scholar] [CrossRef]
  37. Luo, L.; Qiao, D.; Tang, J.; Wang, L.; Liu, Y.; Fu, X. Research on the influence of education and training of farmers’ professional cooperatives on the willingness of members to green production-perspectives based on time, method and content elements. Environ. Dev. Sustain. 2024, 26, 987–1006. [Google Scholar]
  38. Harring, N.; Jagers, S.C. Why do people accept environmental policies? The prospects of higher education and changes in norms, beliefs and policy preferences. Environ. Educ. Res. 2017, 24, 791–806. [Google Scholar] [CrossRef]
  39. Fielding, K.S.; Head, B.W. Determinants of young Australians’ environmental actions: The role of responsibility attributions, locus of control, knowledge and attitudes. J. Environ. Educ. Res. 2012, 18, 171–186. [Google Scholar] [CrossRef]
  40. Wu, L.; Yi, F.; Bu, Y.; Lu, W.; Huang, Y. Toward scientific collaboration: A cost-benefit perspective. Res. Policy 2024, 53, 104943. [Google Scholar] [CrossRef]
  41. Hannah, R.; Oliva, P. The effect of pollution on labor supply: Evidence from anatural experiment in Mexico City. J. Public Econ. 2015, 122, 68–79. [Google Scholar] [CrossRef]
  42. Schlenker, W.; Walker, W.R. Airports, Air pollution, and contemporaneous health. Rev. Econ. Stud. 2015, 83, 768–809. [Google Scholar] [CrossRef]
  43. Chen, S.; Oliva, P.; Zhang, P. The effect of air pollution on migration: Evidence from China. J. Dev. Econ. 2022, 156, 102833. [Google Scholar] [CrossRef]
  44. Cheng, Y.; Du, K.; Yao, X. Stringent environmental regulation and inconsistent green innovation behavior: Evidence from air pollution prevention and controlaction plan in China. Energy Econ. 2023, 120, 106571. [Google Scholar] [CrossRef]
  45. Li, Y.; Hu, W.; Jiang, Y. How does air pollution affect capital allocation efficiency. Ecol. Indic. 2024, 158, 111617. [Google Scholar] [CrossRef]
  46. Gupta, S.; Ogden, D.T. To buy or not to buy? A social dilemma perspective on green buying. J. Consum. Mark. 2009, 26, 376–391. [Google Scholar] [CrossRef]
  47. Vicente, M.A.; Fernández, A.; Izagirre, J. Environmental knowledge and other variables affecting pro-environmental behaviour: Comparison of university students from emerging and advanced countries. J. Clean. Prod. 2013, 61, 130–138. [Google Scholar] [CrossRef]
  48. Zhou, Z.H.; Liu, J.H.; Zeng, H.X.; Zhang, T.; Chen, X. How does soil pollution risk perception affect farmers′ pro-environmental behavior? The role of income level. J. Environ. Manag. 2020, 270, 110806. [Google Scholar] [CrossRef]
  49. Yuan, Y.; Sun, L.; She, Z.; Chen, S. Influence of Digital Literacy on Farmers’ Adoption Behavior of Low-Carbon Agricultural Technology: Chain Intermediary Role Based on Capital Endowment and Adoption Willingness. Sustainability 2025, 17, 2187. [Google Scholar] [CrossRef]
  50. Luo, X.; Ye, Q.; Huang, X.; Zhao, B.; Liu, H. How Do Multidimensional Relational Networks Affect Large-Scale Grain Producers’ Adoption of Low-Carbon Fertilization Technology? Sustainability 2025, 17, 289. [Google Scholar] [CrossRef]
  51. Luo, L.; Qiao, D.; Zhang, R.; Luo, C.; Fu, X.; Liu, Y. Research on the Influence of Education of Farmers’ Cooperatives on the Adoption of Green Prevention and Control Technologies by Members: Evidence from Rural China. Int. J. Environ. Res. Public Health 2022, 19, 6255. [Google Scholar] [CrossRef]
  52. Liu, G.; Chen, C.; Fu, X.; Liu, Y.; Khan, N.; Luo, L. Has the agricultural cooperatives served each member fairly? A new perspective based on utilization level of member services. PLoS ONE 2024, 19, e0294439. [Google Scholar] [CrossRef] [PubMed]
  53. Li, Y.; Mohd Nordin, N.R.; Akhter, S.; Kumar, T.; Shaheen, M. Does green entrepreneurial behavior enhance through entrepreneurship education, perceived ability to use technology, and commitment to environment? Understanding the contribution of entrepreneurial motivation and university support. Econ. Res. Ekon. Istraž. 2023, 36, 1–12. [Google Scholar] [CrossRef]
  54. Ambrosius, J.D.; Gilderbloom, J.I. Who’s greener? Comparing urban and suburban residents’ environmental behaviour and concern. Local Environ. 2015, 20, 836–849. [Google Scholar] [CrossRef]
  55. Sheasby, J.; Smith, A. Examining the factors that contribute to pro-environmental behaviour between rural and urban populations. Sustainability 2023, 15, 6179. [Google Scholar] [CrossRef]
  56. Chileshe, B.; Moonga, M.S. Disparities in pro-environmental behaviour between rural and Urban areas in Zambia. Multidiscip. J. Lang. Soc. Sci. Educ. 2019, 2, 196–215. [Google Scholar]
  57. Shi, J.G.; Xu, K.; Si, H.; Song, L.; Duan, K. Investigating intention and behaviour towards sorting household waste in Chinese rural and urban–rural integration areas. J. Clean. Prod. 2021, 298, 126827. [Google Scholar] [CrossRef]
  58. Anderson, D.J.; Krettenauer, T. Connectedness to nature and pro-environmental behaviour from early adolescence to adulthood: A comparison of urban and rural Canada. Sustainability 2021, 13, 3655. [Google Scholar] [CrossRef]
  59. Wooldridge, J. Econometric Analysis of Cross-Section and Panel Data; MIT Press: Cambridge, MA, USA, 2010. [Google Scholar]
  60. Aiken, L.S.; West, S.G. Multiple Regression: Testing and Interpreting Interactions; Sage: Newbury Park, CA, USA, 1991. [Google Scholar]
  61. Velempini, K. Assessing the Role of Environmental Education Practices Towards the Attainment of the 2030 Sustainable Development Goals. Sustainability 2025, 17, 2043. [Google Scholar] [CrossRef]
  62. Bibi, S.; Nousheen, A.; Siddiquah, A. Effect of an environmental education course on prospective teachers’ pro-environmental behavior: A study in education for sustainable development perspective. Int. J. Sustain. High. Educ. 2025. [Google Scholar] [CrossRef]
  63. Cai, Q.; Chen, W.; Wang, M.; Di, K. The impact of self-determined efficacy on university student’s environmental conservation intentions: An SEM-ANN exploration. Environ. Dev. Sustain. 2025, 1–38. [Google Scholar] [CrossRef]
  64. Wu, X.; Jia, W.; Wu, T. Mechanism by Which Environmental Education Influences Pro-Environmental Behavior in Wuyishan National Park, China. Sustainability 2025, 17, 43. [Google Scholar] [CrossRef]
  65. Ballarotto, G.; Ghezzi, V.; Velotti, P. Feeling the Nature to Foster Sustainability: The Mediating Role of (Self) Compassion. Sustainability 2025, 17, 351. [Google Scholar] [CrossRef]
Figure 1. Theoretical analysis model of university students’ sustainable behavior.
Sustainability 17 06051 g001
Figure 2. Moderating effect of PM2.5 exposure on economic value perception.
Sustainability 17 06051 g002
Figure 3. Moderating effect of PM2.5 exposure on social value perception.
Sustainability 17 06051 g003
Figure 4. Moderating effect of PM2.5 exposure on health value perception.
Sustainability 17 06051 g004
Table 1. Empowerment results of ecological education.
VariableDimensionWeightIndicatorMeanStandard DeviationWeight
Ecological educationTeaching course0.3119The number of environmental courses attended last year3.4550.8410.0780
Satisfaction with environmental teaching courses3.8090.8000.2339
Practical activity0.4905The number of ecological practice activities participated in last year4.0650.7020.1226
Satisfaction with ecological environment practice4.0450.6940.3679
Environmental experiment0.1976The number of environmental experiments I participated in last year3.9720.8510.0329
Satisfaction with environmental experiments3.9740.6400.1647
Table 2. Definition and assignment of variables.
Variable TypeVariableAssignMeanStandard Deviation
Explained variablesustainable behavior of university studentsWhether environmental pollution is reported to management: Yes = 1; No = 00.3790.441
Whether to promote environmental sustainability to others: Yes = 1; No = 00.4150.397
Whether to implement garbage sorting: Yes = 1; No = 00.7180.501
Whether to protect plants and animals from harm: Yes = 1; No = 00.8640.442
Overall degree of sustainable behavior: The sum of the four behavior assignments2.3761.037
Explanatory variableEcological educationTeaching courseThe number of environmental courses attended last year3.4550.841
Satisfaction with environmental teaching courses: dissatisfied = 1, less satisfied = 2, generally = 3, more satisfied = 4, satisfied = 53.8090.800
Practical activityThe number of ecological practical activities participated in last year4.0650.702
Satisfaction with ecological practical activities: dissatisfied = 1, less satisfied = 2, generally = 3, more satisfied = 4, satisfied = 54.0450.694
Environmental experimentThe number of environmental experiments participated in last year3.9720.851
Satisfaction with environmental experiments: dissatisfied = 1, less satisfied = 2, generally = 3, more satisfied = 4, satisfied = 53.9740.640
Overall degreeAHP is used to assign weight to six indexes3.9320.531
Intermediate variableEnvironmental value perceptionEconomic value perceptionEnvironmental protection has considerable economic benefits: Yes = 1; No = 00.5310.471
Social value perceptionEnvironmental protection can promote sustainable social development: Yes = 1; No = 00.3890.435
Health value perceptionEnvironmental protection can improve public health: Yes = 1; No = 00.5170.484
Regulating variablePM2.5 exposure Daily average of PM2.5 exposure in permanent residence last year/μg/m333.21.432
Controls variableIndividual characteristicsGender Male = 0; Female = 10.608 0.480
Political identityMember of the Communist Party of China: Yes = 1; No = 00.2230.426
Household registrationTown = 0; Rural = 10.474 0.483
Environmental Association ParticipationWhether to join the ecological environment association: Yes = 1; No = 00.400 0.476
Environmental reflectionDegree of reflection on current environmental damage: Low = 1; Lower = 2; Generally = 3; Higher = 4; High = 53.352 0.891
Health levelPhysical health: Very Poor = 1; Difference = 2; Generally = 3; Better = 4; Good = 54.099 0.955
Family resourcesSocial networkHave extensive social relationships: Yes = 1; No = 00.697 0.434
Hometown natural environmentHometown environmental governance level: Very Low = 1; Lower = 2; Generally = 3; Higher = 4; High = 53.173 0.728
Family member occupationThe number (from three generations) of relatives engaged in environmental protection related work2.433 1.798
Table 3. KMO and Bartlett test.
KMO 0.738
Bartlett testApproximate Chi-square769.751
df231
Sig.0.000
Table 4. Factor analysis mode matrix.
ItemFactor 1Factor 2Factor 3
Report environmental pollution0.659
Promote environmental sustainability to others0.647
Implement garbage sorting0.692
Protect plants and animals from harm0.685
Environmental courses0.774
Satisfaction with environmental teaching courses0.712
Ecological practical activities0.768
Satisfaction with ecological practical activities0.720
Environmental experiments0.785
Satisfaction with environmental experiments0.731
Economic value perception0.852
Social value perception0.827
Health value perception0.883
Eigenvalue3.4824.1199.546
Variance%52.72140.97437.463
Note: Extraction method: principal component analysis method. Rotation method: Caesar normalization–optimal oblique intersection method.
Table 5. Effects of ecological education on sustainable behavior of university students.
VariableModel (1)
OLS
Model (2)
Oprobit
Model (3)
OLS
Model (4)
Oprobit
Model (5)
IV-Oprobit
Model (6)
Marginal Effect
Teaching course0.046 **
(0.028)
0.139 **
(0.098)
Practical activity0.071 ***
(0.039)
0.193 ***
(0.112)
Environmental experiment0.039 **
(0.030)
0.128 **
(0.129)
Overall degree of ecological education0.048 ***
(0.020)
0.154 ***
(0.041)
0.297 ***
(0.060)
0.107 ***
(0.024)
Gender −0.004
(0.022)
−0.014
(0.047)
−0.002
(0.025)
−0.010
(0.053)
−0.032
(0.063)
−0.010
(0.022)
Political identity0.012
(0.030)
0.044
(0.092)
0.024
(0.026)
0.091
(0.070)
0.081
(0.050)
0.022
(0.021)
Household registration0.034 **
(0.019)
0.129 **
(0.054)
0.041 **
(0.018)
0.131 **
(0.051)
0.113 *
(0.070)
0.039 *
(0.028)
Environmental Association Participation0.048 **
(0.030)
0.138 **
(0.082)
0.040 **
(0.022)
0.134 **
(0.069)
0.158 **
(0.062)
0.052 **
(0.021)
Environmental reflection0.033 *
(0.021)
0.109 **
(0.072)
0.023 *
(0.012)
0.074 **
(0.041)
0.069 *
(0.051)
0.027 *
(0.024)
Health level−0.019
(0.014)
−0.034
(0.030)
−0.011
(0.020)
−0.033
(0.037)
−0.063
(0.041)
−0.021
(0.012)
Social network0.051 **
(0.030)
0.157 **
(0.084)
0.047 **
(0.019)
0.150 **
(0.066)
0.133 *
(0.072)
0.053 *
(0.022)
Hometown natural environment0.015
(0.012)
0.042
(0.054)
0.012
(0.010)
0.032
(0.042)
0.040
(0.045)
0.012
(0.010)
Family member occupation0.053 ***
(0.025)
0.062 ***
(0.033)
0.023 ***
(0.009)
0.050 ***
(0.027)
0.060 ***
(0.027)
0.024 ***
(0.009)
Sample size157915791579157915791579
Adjust R2/Pseudo R2/lnsig0.0420.0500.0520.049−0.061 ***
(0.000)
LRchi2/F7.9395.38
(0.000)
9.4299.21
(0.000)
89.21
(0.000)
Log likelihood −984.745−995.23−2948.352
Note: ***, ** and * represent the significance levels of 1%, 5% and 10%, respectively, the figures in brackets are robust standard errors of the coefficients, and the data in the table are rounded results. The same is the case below.
Table 6. Mediating effects of economic value perception and regulating effects of PM2.5 exposure.
VariableModel (1) Oprobit
Economic Value Perception
Model (2) Oprobit
Sustainable Behavior
Model (3) Oprobit
Sustainable Behavior
Model (4) IV-Oprobit
Sustainable Behavior
Model (5) Oprobit
sustainable Behavior
Ecological education0.093 ***
(0.028)
0.141 ***
(0.042)
0.273 ***
(0.053)
Economic value perception0.392 ***
(0.041)
0.413 ***
(0.050)
0.384 ***
(0.074)
0.311 ***
(0.073)
PM2.5 exposure0.193 *
(0.122)
Economic value perception × PM2.5 exposure0.179 *
(0.158)
Control variableControlControlControlControlControl
Sample size15791579157915791579
LRchi2/Wald chi292.43
(0.000)
119.35
(0.000)
139.29
(0.000)
125.83
(0.000)
150.36
(0.000)
Pseudo R2/lnsig0.0460.0670.070−0.063 ***
(0.020)
0.070
Loglikelihood−1434.325−993.63−953.526−3145.363−993.536
Note: *** and * represent the significance levels of 1% and 10%, respectively.
Table 7. Mediating effect of social value perception and regulating effect of PM2.5 exposure.
VariableModel (1) Oprobit
Social Value Perception
Model (2) Oprobit
Sustainable Behavior
Model (3) Oprobit
Sustainable Behavior
Model (4) IV-Oprobit
Sustainable Behavior
Model (5) Oprobit
Sustainable Behavior
Ecological education0.119 ***
(0.027)
0.138 ***
(0.032)
0.246 ***
(0.072)
Social value perception0.546 ***
(0.066)
0.495 ***
(0.072)
0.512 ***
(0.077)
0.397 ***
(0.091)
PM2.5 exposure0.215 ***
(0.078)
Social value perception × PM2.5 exposure0.181 *
(0.144)
Control variableControlControlControlControlControl
Sample size15791579157915791579
LRchi2/Wald chi2101.32
(0.000)
150.49
(0.000)
161.53
(0.000)
165.62
(0.000)
180.32
(0.000)
Pseudo R2/lnsig0.0570.0700.076−0.064 ***
(0.020)
0.084
Loglikelihood−817.735−943.236−955.363−3042.965−967.351
Note: *** and * represent the significance levels of 1% and 10%, respectively.
Table 8. Mediating effects of health value perception and regulating effects of PM2.5 exposure.
VariableModel (1) Oprobit
Health Value Perception
Model (2) Oprobit
Sustainable Behavior
Model (3) Oprobit
Sustainable Behavior
Model (4) IV-Oprobit
Sustainable Behavior
Model (5) Oprobit
Sustainable Behavior
Ecological education0.088 ***
(0.034)
0.131 ***
(0.030)
0.257 ***
(0.072)
Health value perception0.447 ***
(0.053)
0.468 ***
(0.070)
0.519 ***
(0.081)
0.451 ***
(0.073)
PM2.5 exposure0.310 ***
(0.099)
Health value perception × PM2.5 exposure0.353 ***
(0.121)
Control variableControlControlControlControlControl
Sample size15791579157915791579
LRchi2/Wald chi2120.26
(0.000)
149.15
(0.000)
168.82
(0.000)
166.74
(0.000)
198.63
(0.000)
Pseudo R2/lnsig0.0520.0690.091−0.066 ***
(0.012)
0.091
Loglikelihood−991.462−953.58−982.14−2946.732−942.83
Note: *** represents the significance levels of 1%.
Table 9. Comparative analysis of environmental cognition and behavior of college students from urban, town, and rural households.
VariableUrban Households
N = 493
Town Households
N = 576
Rural Households
N = 510
Economic value perception0.5400.5330.520
Social value perception0.3540.3720.442
Health value perception0.4980.5050.549
Reported to management:0.3630.3590.417
Promote environmental sustainability to other0.3980.4050.443
Implement garbage sortin0.7200.6790.760
Protect plants and animals 0.8110.8440.938
Overall degree of sustainable behavior2.2922.2872.558
Table 10. Heterogeneity analysis of the impact of ecological education on environmental sustainability behavior of college students from urban, town, and rural households.
VariableModel (1) IV-Oprobit
Urban Households
Model (2) IV-Oprobit
Town Households
Model (3) IV-Oprobit
RURAL Households
ecological education0.267 **
(0.052)
0.292 ***
(0.063)
0.318 ***
(0.058)
Control variableControlControlControl
Sample size493576510
lnsig−0.059 ***
(0.000)
−0.062 ***
(0.000)
−0.061 ***
(0.000)
LRchi287.83
(0.000)
92.34
(0.000)
91.03
(0.000)
Loglikelihood−2875.977−2998.051−2963.748
Note: *** and ** represent the significance levels of 1% and 5%, respectively.
Table 11. Test of mediation effects via Bootstrap.
Total EffectMediating EffectSpecific GravityStandard Deviation BootSELower LLCIUpper ULCI
Economic value perception0.0520.0060.1150.0020.0020.011
Social value perception 0.0520.0070.1350.0030.0030.012
Health value perception 0.0520.0080.1540.0030.0030.013
Disclaimer/Publisher’s Note: The statements, opinions and data contained in all publications are solely those of the individual author(s) and contributor(s) and not of MDPI and/or the editor(s). MDPI and/or the editor(s) disclaim responsibility for any injury to people or property resulting from any ideas, methods, instructions or products referred to in the content.

