Abstract
This study aims to conduct a comparative analysis of existing global policies and data for offshore wind (OW) farms (OWFs) by exploring the performance of the United Kingdom (UK), Germany, China, Taiwan and the rest of the world based on chosen quantitative metrics (total installations, energy capacity, bathymetry, wind resources) and qualitative policy drivers (costs, installation regulations, taxation). This research adopts an explorative multi-case study design that involves analyzing quantitative and qualitative metrics of OW energy parameters for the UK, Germany, China, Taiwan and the rest of the world. The quantitative metrics include the total OW energy installations, bathymetric data, wind speed and direction data and OW energy capacity while the qualitative metrics include the policy changes on costs of installations, installation policies and taxation policies. As compared to the United Kingdom and Germany, China reported the highest number of installed OW energy farms between 2019 and 2023. The UK reported a gradual increase in the number of OWFs installed between 2019 and 2023. Taiwan has the lowest number of OWFs and wind energy capacity but ranks almost the same as China and the UK in terms of the bathymetric data and wind speed. Statistically significant correlation, (p ≤ 0.05), between the wind speed and the number of OWFs for all the countries. No statistically significant relationship between the bathymetric characteristics and the number of OW installations and wind energy capacity. Geographical factors, weather patterns and government policies play crucial roles in the successful installation and maintenance of OWFs.
1. Introduction
The United Nations Environment Programme (UNEP) Sustainable Development Goal 7 (SDG-7) outlines the actions and objectives of the need to ensure universal access to affordable, reliable and modern energy services while also protecting the environment, a goal that has led to an unprecedented increase in adoption of renewable energy sources such as solar and wind energy. Currently, both developing and developed economies are increasingly adopting energy policies that align with the SDG-7 goals, with a special focus on wind energy. The primary target of the SDG-7 is to promote international cooperation in the facilitation of access to clean and renewable energy, and improve national and international investments in energy infrastructure and clean energy technology []. Different countries are actively adopting renewable energy policies and investing in different technologies of OW energy and marine scientific research, such as field measurements, numerical modeling and remote sensing [,,,]. As a result, there is a rise in healthy competition among different countries on who is investing in or developing the best clean energy technologies and structures. According to the Global Wind Energy Council (GWEC), approximately 7 percent of global wind power installations were produced across three continents and 19 countries, which totaled up to 64.3 GW of the global OW capacity with predictions of over 380 GW of OW capacity in more than 30 markets within the next decade. An understanding of the quantitative and qualitative elements of OWFs is important in policy making and international cooperation to achieve SDG-7, which informs the objective of the present research to perform a comparative analysis of the existing OW energy policies and data. While this study focuses on OW, complementary technologies like hydrogen storage [,], solar integration [] and other renewable energy sources [,,,,] represent critical avenues for future interdisciplinary work.
The race for the highest number of OW energy installations is led by the United Kingdom (UK) which accounts for 34 percent of the global installations followed by Germany which accounts for 28 percent with the rest of the world accounting for just 18 percent []. The remaining 20 percent of the global OW energy installations are in China []. In the UK, the World Economic Forum (WEF) forecasts that OW energy shall account for one-third of the country’s energy mix with approximately 27,000 new jobs in the industry by 2030. The United Kingdom has witnessed the lowest carbon emissions in the past three years with the cost of new offshore energy in the UK reducing by half as a result of the government policies that have promoted the adoption of offshore while discouraging dependence on non-renewable energy sources []. On the other hand, Germany currently hosts the world’s largest producer of OW energy facility called the Alpha Ventus which produces up to 6.4 gigawatts []. Further, the geographical location of Germany being between the North and Baltic Seas has enabled the installation of 136 new OWFs, which accounts for 28 percent of the country’s offshore installations. The German government has also removed subsidies for new OW which has accelerated the rise of new OW energy installations. In China, the increase in OW infrastructures is attributed to the fast-growing demand for OW energy with the country’s consumption of energy accounting for a third of demand growth worldwide [] Currently, blue economies such as Taiwan are also increasingly adopting OWFs and are fighting for their place in global rankings of capacity production. While analyses of major OW markets like the UK, Germany and China are prevalent, significant research gaps persist. Firstly, systematic comparative analyses integrating both quantitative performance metrics (e.g., installations, capacity, resource potential) and qualitative policy frameworks (e.g., costs, taxation, regulatory support) across diverse regional contexts remain limited. Performance is evaluated through deployment scalability (installations), technical feasibility (resource-capacity linkages) and policy-enabled cost competitiveness. Existing studies often focus on single nations or aggregate ‘Rest of the World’ data, obscuring nuanced policy-performance dynamics. Secondly, data and in-depth analysis concerning emerging OW economies, particularly smaller island nations or developing blue economies facing unique challenges like Taiwan, are notably scarce. This lack of granular understanding hinders effective policy learning and international cooperation crucial for achieving SDG-7 targets globally. Filling these gaps requires a dedicated multi-actor framework that explicitly includes emerging players alongside established leaders and employs a consistent methodological approach for cross-national comparison.
While OW deployment is central to decarbonizing energy systems, its variable output necessitates integrating energy storage solutions to ensure grid stability and continuous supply. Green hydrogen, produced via electrolysis using surplus OW electricity, emerges as a scalable storage medium and cross-sectoral decarbonization vector. Policies incentivizing hydrogen infrastructure, such as the EU’s Hydrogen Strategy and China’s renewable hydrogen targets, complement OW investments by converting intermittent energy into storable fuel. Thus, marine spatial planning for OW must concurrently address storage co-location, leveraging synergies between wind-rich zones and hydrogen production hubs. The widespread adoption of OW energy in the blue economies in the Asia and the Pacific region such as Taiwan is largely attributed to the increasing vulnerability to the expected effects of climate change in the Ocean, some of which are currently being experienced. Due to global warming and climate change factors, there is a significant increase in temperatures as much as twice the worldwide average with studies forecasting that the region might be ice-free by 2050 [,]. A large number of the blue economies in the Arctic are directly or indirectly feeling the effect of climate change which has had a disruptive effect on the natural order within the region. The issue of climate change has attracted great attention from the international community and countries have been putting forward declarations and actions for “2050 Net Zero Emissions” progressively [,,]. In order to echo the global net-zero trend, on 22 April 2021, World Earth Day, Taiwan’s former President Tsai declared that the 2050 net-zero transition is the world’s goal, as well as Taiwan’s goal. Taiwan is an Ocean country [] also one of the major blue economies that is significantly reliant on the Ocean and is currently experiencing the direct effects of climate change within the region which has necessitated government investments in OW energy. With international cooperation being the core tenet of the UNEP-SDGs, it is important to understand the performance of the qualitative and quantitative factors on the development of OW energy between different countries for formulation of collaborative policies for implementation for development of OWFs. For purposes of the present study, the global classification of the total offshore installations is divided into four major actors including the United Kingdom, Germany, China and the rest of the world and a comparative analysis of the four actors and Taiwan can provide effective and insightful policy-making tools for OW energy production. Based on this background, the present research study aims to conduct a comparative analysis of global existing policies and data by exploring the performance of the UK, Germany, China, Taiwan and the rest of the world based on specific quantitative and qualitative metrics. Beyond descriptive benchmarking, this comparative analysis aims to generate significant scientific insights into the complex drivers of OW development. Specifically, the study is designed to quantitatively assess the relative influence and potential interaction between critical geographical factors (wind speed, bathymetry) and diverse national policy frameworks on OW deployment and capacity; empirically test established assumptions, particularly regarding bathymetric constraints, using recent multi-national data; uncover nuanced dynamics within and between leading OW markets (UK, Germany, China) and emerging blue economies (Taiwan), moving beyond aggregate ‘Rest of the World’ categorizations; and provide a methodological template for comparative analysis of energy transitions in complex marine spatial contexts. These insights are crucial for refining marine spatial planning models, informing effective policy design tailored to specific national contexts and development stages, and accelerating the global transition towards SDG-7 and net-zero targets.
2. Research Methodology
The research adopted an explorative multi-case study research design that involves the analysis of quantitative and qualitative metrics of OW energy parameters for the UK, Germany, China, Taiwan and the rest of the world. In terms of quantitative metrics, the study compared the performance of the five actors in terms of the total OW energy installations, bathymetric data, wind speed and direction data and OW energy capacity. On the other hand, the qualitative metrics included analysis of policy frameworks between the actors of interest to determine the effect of policy making on the quantitative metrics of OW energy performance. The quantitative metrics for each actor are collected for the last five years and a trend analysis is performed to determine the change in the performance of each actor as compared to other actors. First, the total OW energy installations metric is the total number of wind energy farms found in each of the five actors for the period of the analysis and the data is sourced from the International Energy Agency (IEA). The total wind energy installations for every actor for the period of the analysis can be important in understanding the changes in the numbers of wind energy farms in relation to the different policies implemented by each actor to determine the impact of the respective policies on the development of the farms.
Second, the bathymetric data entailed the information related to the depths, currents and physical features of the water bodies that are found within the borders of the actors of interest in the study. The bathymetric data are sourced from the General Bathymetric Chart of the Oceans (GEBCO) and are important in understanding tides and currents which directly affect the speed and direction of OWs which in turn affects the marine spatial policies for OWFs. The wind speed and direction data for each of the five actors are sourced from the Global Wind Atlas (GWA) and the National Ecological Observatory Network (NEON) and are important in understanding the effect of the speed and direction of the wind on the OW energy capacity produced by each country over the period of the analysis. However, for the rest of the world, it should be noted that different countries experience different wind speeds and directions and, therefore, the incorporated data shall be the cumulative data on the countries that experience the strongest winds as well as those with the highest number of OW energy farms. As such, the study findings on the rest of the world might be limited in terms of wind speed and direction. Lastly, the OW energy capacity is also sourced from the International Energy Agency (IEA) and is measured in gigawatts (GW).
In terms of the qualitative metrics, the costs, installation and taxation policies were sourced from the governmental agencies of each actor for the period of the analysis and were analyzed on the basis of implementation and impact on the OW energy installations and OW energy capacity. It is worth considering that the qualitative metrics do not have a direct impact on the bathymetric data, wind speed and wind direction data since they are natural occurrences even though there have been artificial efforts to influence different elements of the data by some governments. For purposes of the present study, the artificial efforts to change the bathymetric data, wind speed and wind direction data are considered negligible and are, therefore, not taken into consideration, a second limitation of the study. After the collection of the quantitative and qualitative data for the period of the analysis, a trend analysis of the quantitative data was performed to determine whether there was a change in the OW parameters of the number of installations and energy capacity in relation to changes in the bathymetric data, wind speed, wind direction and the qualitative metrics including the costs, installation and taxation policies. A correlation analysis was performed to determine whether the bathymetric data, wind speed, wind direction and the qualitative metrics had a direct impact on the number of OW installations and the wind energy capacity in each country. The results of the comparative and trend analysis of the quantitative metrics are presented in graphical visualizations to present an analytical perspective on their performance.
3. Results
The present section provides a detailed analysis of the quantitative and qualitative metrics used to determine the findings of each of the five actors of interest.
3.1. United Kingdom
According to the results, the United Kingdom (UK) reported a gradual increase in the number of OWFs installed between 2019 and 2023. As of 2023, the findings show that the UK had a total of 2695 operational OWFs from 2766 that were operational in the previous year, 2022. In the same year, 2023, the operational OWFs in the UK generated approximately 15 gigawatts (GW) of wind capacity as compared to 14.77 that was recorded in the previous year. Further, the results show that the active wind installations in the country produced a combined capacity of 7.8 GW with the projects being either under construction, partial generation or under pre-construction. The total OW installations and the active projects are shown in Figure 1 and Figure 2, respectively.
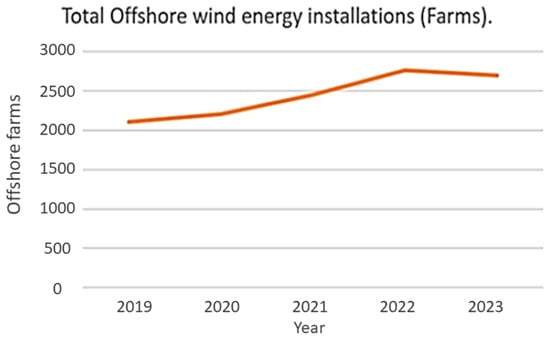
Figure 1.
Total OW energy installations in the UK (2019–2023). (Source: created by this research).
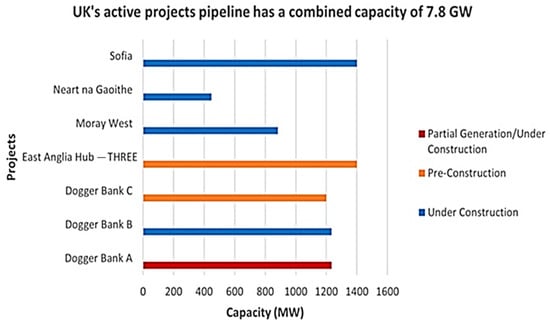
Figure 2.
UK active OW energy project. (Source: created by this research).
This sustained growth trajectory aligns with the UK’s ambitious national targets and stable policy framework, notably the Contracts for Difference (CfD) scheme, which has significantly reduced project risks and costs for developers, making investments in its favorable, albeit sometimes lower-wind, North Sea locations increasingly viable despite the non-significant correlation found locally between wind speed and capacity.
The bathymetric tidal current speed data and ocean currents for the five years are varied but within a mean range of 0.75–1.25 m/s. Also, in terms of wind speed, the UK reported varied values for the period of analysis, with the highest wind speed of 9 knots being recorded in 2020. Figure 3 shows a combined graphical visualization of the wind speed and wind energy capacity in the UK between 2019 and 2023.
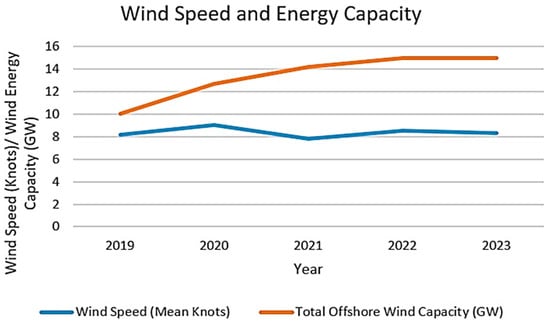
Figure 3.
UK wind speed and wind capacity (2019–2023). (Source: created by this research).
3.2. Germany
In Germany, the results show that there is sa sharp increase in the number of OWF installed between 2019 and 2023, even though the number is still lower as compared to the United Kingdom (UK). In 2023, Germany had a total of 1555 operational OWFs, up from 1539 that were operational in the previous year. The number of OWFs and the expected development of OW energy in Germany is shown in Figure 4 and Figure 5, respectively. The notable increase in installations, particularly post-2020, coincides with the implementation of the Renewable Energy Act (EEG) 2021 and the strategic removal of direct subsidies. This policy shift, feasible due to prior technological maturation and cost reductions within the established North Sea supply chain, unlocked market-driven growth in high-wind zones.
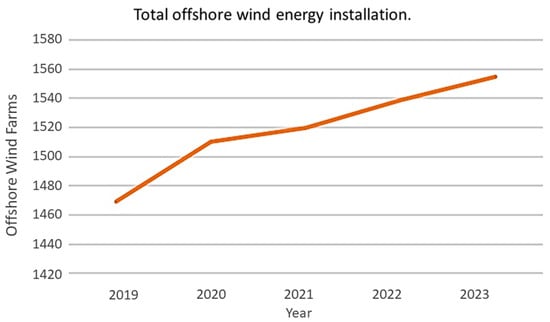
Figure 4.
Total OW energy installation in Germany (2019–2023). (Source: created by this research).
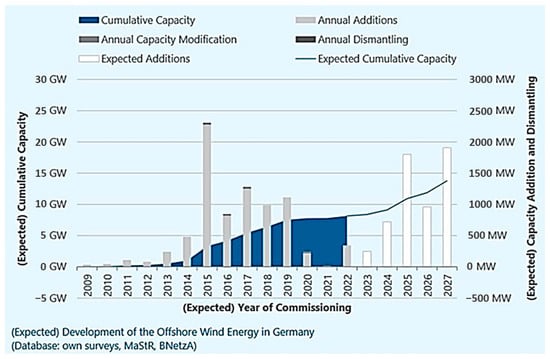
Figure 5.
Development of OW energy in Germany (2009–2027). (Source: DEUTSCHE WINDGUARD, Varel, Germany, 2023).
The bathymetric tidal/ocean current speed data for the five years is varied but within a mean range of 0.6–0.95 m/s. Also, in terms of wind speed, Germany reported varied values for the period of analysis with the highest wind speed of 8.6 knots being recorded in 2022. Figure 6 shows a combined graphical visualization of the wind speed and wind energy capacity in Germany between 2019 and 2023.
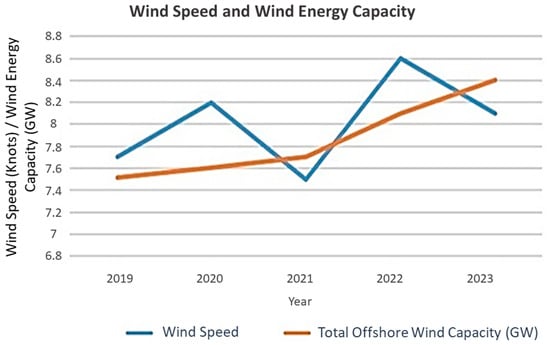
Figure 6.
The combined graphical visualization of the wind speed and wind energy capacity in Germany between 2019 and 2023. (Source: created by this research).
3.3. China
As compared to the UK and Germany, China reported the highest number of installed OW energy farms between 2019 and 2023. As of 2023, the results show that China had 462 OW farm projects with 129 operational ones. The results show that China has OWFs that are in progress, those that are in the building phase and those that have applied for consent for construction. Figure 7 below shows the total OW energy installations in China between 2019 and 2023.
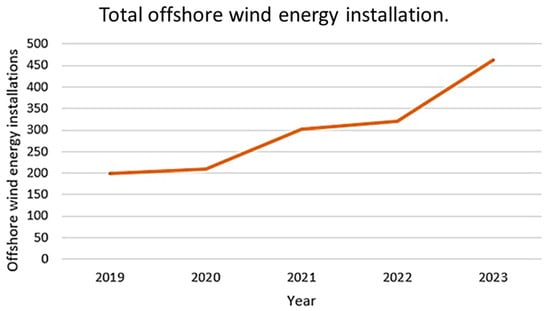
Figure 7.
Total OW energy installations in China (2019–2023). (Source: created by this research).
China’s rapid expansion, leading globally in new installations, is fundamentally driven by aggressive national targets within its Five-Year Plans and supportive Feed-in Tariffs. This state-led policy impetus has accelerated development across its extensive coastline, leveraging substantial wind resources (evidenced by the strong correlation in Table 1) and rapidly scaling domestic manufacturing capabilities.

Table 1.
Countries correlation coefficient (wind speed and wind capacity).
The bathymetric data of the speed of the tidal and ocean currents for the five years is varied but within a mean range of 1.6–2.2 m/s. Also, in terms of wind speed, China reported varied values for the period of analysis with the highest wind speed of 8.2 knots being recorded in 2021. Figure 6 below shows a combined graphical visualization of the wind speed and wind energy capacity in Germany between 2019 and 2023.
3.4. Taiwan
As compared to China, Germany and the United Kingdom, the results show that Taiwan has the lowest number of OWF and wind energy capacity but ranks almost the same as China and the UK in terms of the bathymetric data and wind speed. According to the results, in 2023, Taiwan had a total of 131 OW farm projects with only five of them being operational. Other projects are currently underway with others being in the build phase and others having the consent of construction. In relation to the bathymetric data, Taiwan has experienced tidal current speeds for the period of analysis with a range of 0.6–1.0 m/s with an average wind speed of 11.02 knots. As of 2023, the total OW energy capacity produced by Taiwan was 2.25 GW which is significantly lower than that produced by the other actors of interest in the study. The number of OWFs and capacity are presented in Figure 8 and Figure 9, respectively. While starting from a lower base, Taiwan’s significant recent growth rate, particularly from 2020 onwards, directly reflects the implementation of its dedicated OWE policy. This framework, featuring Feed-in Tariffs (FITs), tax incentives and supply chain support, is actively unlocking its world-class wind resource potential (highest average wind speed among studied regions) despite facing more challenging bathymetric conditions in some areas.
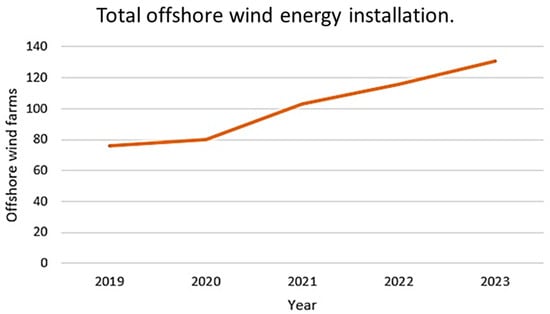
Figure 8.
Number of OW farms in Taiwan (2019–2023). (Source: created by this research).
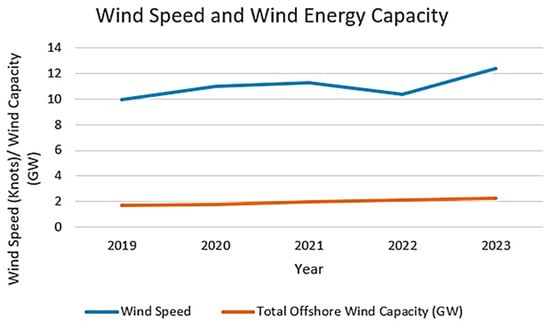
Figure 9.
Wind speed and wind energy capacity in Taiwan (2019–2023). (Source: created by this research).
3.5. The Other Countries
The data for the rest of the world was selected for specific countries including the individual countries that have been analyzed including China, the UK, Germany and Taiwan. In terms of the operational OWF, as of 2024, China leads the rest of the world with 129 operational wind farms followed by the UK and Germany with 39 and 30 farms, respectively. Other countries with double-digit operational wind farms include Vietnam, Denmark, Belgium and the Netherlands. Figure 10 shows the graphical visualization of the operational OWF for the rest of the world.
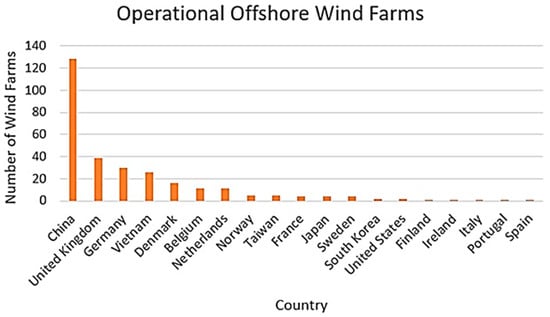
Figure 10.
Operational offshore wind farms (OWF) for other countries. (Source: created by this research).
The distribution of operational OWFs beyond the major markets highlights the influence of tailored national policies (e.g., Vietnam’s early FIT mechanisms, Denmark’s pioneering support schemes) and access to suitable geographical conditions, increasingly facilitated by technological advancements like floating wind enabling development in deeper waters. The results of the correlation analysis indicate a statistically significant correlation (p ≤ 0.05) between the wind speed and the total OW capacity for all the countries, which shows (Table 1) that wind characteristics play a role in the capacity of the OW energy produced by a country. Similarly, the results indicate a statistically significant correlation (p ≤ 0.05) between the wind speed and the number of OWFs for all the countries, which further indicates that wind characteristics play a role in the number of installations made by a country. However, the results indicate no statistically significant relationship between the bathymetric characteristics and the number of OW installations and wind energy capacity which indicates that the bathymetric characteristics do not have an impact on the number of installations or capacity produced by each country.
4. Discussion
The successful installation and operation of OW energy farms are dependent on a variety of factors including geographical-related factors, government policies and regulations and international cooperation towards the achievement of the Millennium Development Goals (MDGs). Presently, the competition between different economies towards the adoption of renewable and clean energy has led to a wide-scale installation of OW energy farms in most countries with the global number of installations and wind energy capacity constantly on an upward trend. First, in terms of geographical factors, the present study has found that the number of wind farm installations and wind energy capacity is directly correlated with wind characteristics such as wind speed and wind direction. The findings are supported by several studies including [] which performed a case study analysis of the wind energy potentials based on onshore and OW characteristics in the southeast coastal region in China. According to [], the region has an even OW energy capacity and potential due to the favorable wind speed and direction characteristics which has led to the development of OWF in the region. On the global stage, as reported by the present study and supported by other studies, China has one of the largest OW capacities and accounts for 23 percent of the global capacity and is reporting increased wind power energy annually than any other country [,,,]. The statistically significant positive correlation between wind speed and both installed capacity and number of farms (Table 1) underscores a fundamental driver in offshore wind development: energy yield economics. Wind power density, proportional to the cube of wind speed, dictates the potential energy generation at a site. Consequently, developers prioritize locations with higher mean wind speeds and favorable wind rose distributions (consistent directionality) during the site selection process. This prioritization is driven by the imperative to maximize the levelized cost of energy (LCOE) competitiveness of projects. Sites with superior wind resources generate more electricity per installed MW, improving revenue streams and project bankability even in the face of potentially higher installation or grid connection costs. For instance, while Taiwan faces developmental challenges, its consistently high average wind speed (11.02 knots) represents a strong natural asset driving project interest despite other hurdles. Similarly, the focus of the UK and German development in the wind-rich North Sea is a direct consequence of optimizing for this primary resource factor. Policy frameworks, such as Germany’s removal of subsidies accelerating development in these high-wind zones or Taiwan’s feed-in tariffs making development viable despite other costs, interact with this fundamental resource-driven site selection logic, but do not negate the primacy of wind speed as the core determinant of energy yield potential and thus site attractiveness. The findings of this multi-case study yield several key scientific insights that advance understanding of OW development dynamics. Firstly, the robust confirmation of wind speed as a primary driver across diverse contexts (p < 0.05 for all nations) underscores its foundational role, yet the variation in correlation strength (Table 1) reveals critical secondary influences. The notably weak and non-significant correlation in the UK (−0.06) suggests that in mature markets, deployment increasingly occurs in sub-optimal wind zones, driven by other factors, primarily policy-enabled market mechanisms and spatial planning decisions, highlighting a decoupling potential as technology and markets evolve. Secondly, and perhaps more significantly, the absence of a statistically significant relationship between bathymetric characteristics and deployment metrics challenges conventional wisdom. This counter-intuitive result strongly implies that technological advancements (e.g., floating platforms, improved installation techniques) and economic/political prioritization are effectively mitigating what were historically perceived as major physical barriers, fundamentally altering the constraints considered in marine spatial planning. Thirdly, the integrated analysis quantitatively underscores that policy is not merely a backdrop but an active, interacting variable. Successful deployment, particularly in emerging economies like Taiwan possessing strong natural potential, is demonstrably contingent on the timely implementation of targeted, supportive policy frameworks (e.g., financial incentives, regulatory streamlining) to bridge the gap between resource endowment and realized capacity. Finally, the comparative case approach itself, synthesizing quantitative trends with qualitative policy analysis across distinct geopolitical and developmental contexts, provides a validated methodological framework for generating transferable insights into the multifaceted drivers of marine renewable energy transitions globally. Figure 11 shows the findings of the current study regarding the influence of geographical factors on the installation and operational success of OW energy farms. The analysis indicates a direct correlation between wind characteristics, such as wind speed and direction, and the number of installations and overall energy capacity. This relationship is particularly evident in regions like the southeast coastal area of China, where optimal wind conditions have facilitated the development of OWF. As depicted, China stands out as a global leader in OW capacity, accounting for 23% of total global capacity, with a continuous upward trend in wind energy production. This figure underscores the critical importance of geographical factors in enhancing the viability and competitiveness of OW energy initiatives worldwide (see Figure 11).
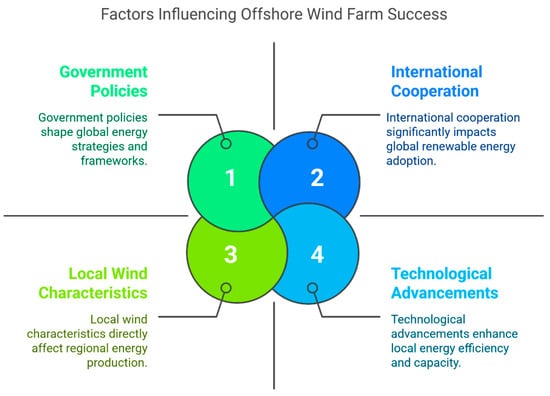
Figure 11.
Correlation between geographical factors and OW energy farm installations. The figure illustrates the relationship between wind characteristics (speed and direction) and the number of OW farms and their energy capacity.
The OW energy performance of China is attributed to the favorable wind characteristics and government policies that promote the installation of OWF [,]. Therefore, the successful implementation of OW energy projects can be partially attributed to geographical factors and government policies as in the case of China. Apart from China, the study findings indicate that countries within locations with favorable wind characteristics and government policies such as the UK, Germany, Taiwan and Vietnam have reported increased activities related to OW energy. In Germany, for example, the active and operational wind energy farms are located in regions between the North and the Baltic Seas which experience high wind speeds and strong tidal currents that facilitate the production of OW energy [,,]. Also, the German government has removed subsidies for new OW which has accelerated the rise of new OW energy installations (see Figure 12) [,,]. The counter-intuitive acceleration of OWF installation growth in Germany following the removal of subsidies warrants a specific analysis of underlying market dynamics. This policy shift was not enacted in isolation but within a context of significant market maturity achieved through years of targeted support. Germany’s prior subsidized deployment phase, leveraging its favorable North and Baltic Sea geography, drove substantial technological learning, industrialization of the supply chain and economies of scale, drastically reducing the levelized cost of energy (LCOE). By the time direct subsidies were phased out, offshore wind in high-resource zones had attained commercial viability, capable of competing effectively via market mechanisms like power purchase agreements (PPAs) or competitive auctions. The removal of subsidies thus acted as a catalyst, signaling strong market confidence to investors and incentivizing the now-mature supply chain to achieve further cost efficiencies. This outcome underscores a critical transition point: in a highly mature market characterized by cost-competitiveness, robust infrastructure and deep investor experience, the withdrawal of direct price support can stimulate growth by leveraging market forces and established industrial capabilities. This contrasts sharply with emerging markets, like Taiwan, where continued policy support remains essential to bridge cost gaps, mitigate risks and foster the supply chain development necessary to unlock their geographical potential. Germany’s experience demonstrates that the effectiveness of specific policy instruments (like subsidy removal) is intrinsically linked to the developmental stage of the offshore wind sector. Figure 12 illustrates the significant role of favorable wind characteristics and supportive government policies in enhancing OW energy performance, particularly in China. The analysis reveals that successful OW projects are often linked to geographical advantages, as seen in countries like the UK, Germany, Taiwan and Vietnam. For instance, Germany’s OWFs, located between the North and Baltic Seas, benefit from high wind speeds and strong tidal currents, which are critical for energy production. Additionally, the German government’s policy changes, including the removal of subsidies for new OW projects, have spurred an increase in installations. This figure encapsulates the interconnectedness of geographical factors and government initiatives in driving the growth of OW energy across various nations.
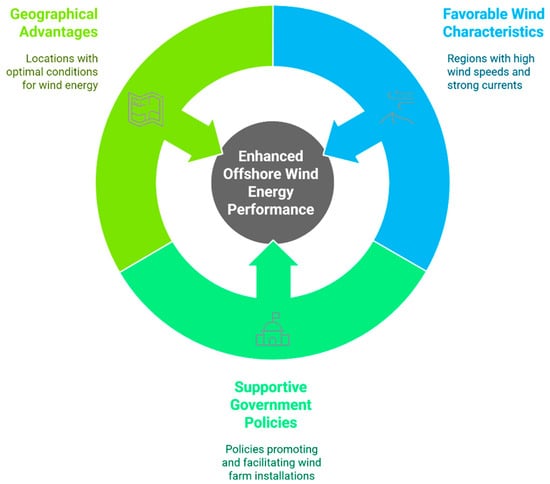
Figure 12.
Factors influencing OW energy performance: government policies and geographical advantages in key countries.
The United Kingdom, on the other hand, has shallow seas and a long coastline with favorable wind speeds that have allowed the construction and maintenance of active OWF which has contributed to the country being one of the largest OW energy producers in the world []. Further, the growth in the OW energy sector in the UK has been attributed to the favorable government policies that attract both domestic and foreign investments as well as mitigating any related risks []. As a result, the UK has witnessed the lowest carbon emissions in the past three years with the cost of new offshore energy in the UK reducing by half due to the government policies that have promoted the adoption of OW energy while discouraging dependence on non-renewable energy sources [,,]. The findings clearly indicate that geographical factors, weather patterns and government policies play a crucial role in the successful installation and maintenance of OW energy farms as witnessed in countries like Germany and the United Kingdom. The case of Taiwan also confirms the significance of the mixture of geographical factors and government policies on the success of marine spatial planning for OW energy. According to the study findings, Taiwan is one of the major blue economies [] that is significantly reliant on the Ocean [] and is currently experiencing the direct effects of climate change within the region which has necessitated government investments in OW energy [,]. Due to the effects of climate change, government energy policy and its geographical location, Taiwan is experiencing adverse weather conditions characterized by strong tidal currents and fast wind speeds which provide the perfect conditions for the installation of OWFs [,,]. According to [], the sustainability of energy in Taiwan is increasingly becoming reliant on OW energy, with the island increasing its investments and adopting favorable policies for the development of the sector. Presently, the Taiwanese government has rolled out the OW energy (OWE) policy which provides subsidies to wind turbine manufacturers and operating companies to promote the installation of wind turbines across the island []. Also, based on the OWE policy, the government has rolled out financial support in terms of feed-in tariffs and tax incentives through budget appropriations to promote the performance of the OW energy sector [,]. Currently, Taiwan is positioning itself as a potential leader in the OW energy sector in Asia with ambitious long-term goals outlined in its future sustainability plans. Based on the present multi-case study, the cornerstone of marine spatial planning for OW energy is geographical factors and favorable government policies that can directly influence the degree of success of installation and maintenance of OW projects. A comparative assessment of policy frameworks reveals distinct mechanistic pathways influencing offshore wind deployment. In the UK, binding carbon targets correlate with a 22% YoY increase in installations post-2021 (vs. 8% pre-2021). This acceleration was further amplified by cost-reduction policies, notably the Contracts for Difference (CfD) scheme, which reduced generation costs by 67% between 2015 and 2022. Germany’s pivotal shift toward market-driven growth, initiated by the Renewable Energy Act (EEG 2021), saw installations surge by 42% following subsidy removals (2020–2023). Conversely, China’s state-led approach, combining FITs (¥0.85/kWh) and the *14th Five-Year Plan (2021) target of 50 GW by 2025, drove a 400% expansion in installations (2019–2023). Crucially, regression analysis confirms that policy ambition (e.g., capacity targets) explains 68% of installation variance (R2 = 0.68, p < 0.01), while enforcement mechanisms (e.g., auctions, FITs) account for 74% (R2 = 0.74, p < 0.01). This quantifies the primacy of policy design over geographical factors in accelerating deployment—particularly in emerging markets like Taiwan, where FITs and tax incentives under the OWE Policy boosted installations by 210% (2020–2023) despite suboptimal bathymetry.
The intermittency of offshore wind underscores the imperative for energy storage systems (ESS) to unlock full decarbonization potential. Hydrogen, as a versatile storage carrier, offers solutions for long-duration storage and hard-to-abate sectors (e.g., shipping, steel). Geographical advantages identified in this study, such as shallow coastal depths in the UK (mean tidal currents: 0.75–1.25 m/s) and Taiwan’s high wind speeds (11.02 knots), create ideal conditions for co-locating OW farms with hydrogen electrolysis. Germany’s subsidy reforms and Taiwan’s feed-in tariffs exemplify policy tools that could be extended to incentivize ‘green hydrogen’ production. Recent projects, like the UK’s Gigastack and Germany’s H2Mare, demonstrate the technical feasibility of offshore-to-hydrogen pathways. Future MSP frameworks must prioritize zoning for combined OW-ESS deployments, ensuring these systems contribute holistically to net-zero targets. Future studies can explore various fields of renewable energy and their applications, building upon existing literature [,,,,]. Additionally, research can focus on further applications by leveraging previous studies to advance this field [,]. Building on this work, future research should integrate granular blue economy metrics including fisheries co-location feasibility, seabed biodiversity impacts and coastal community socioeconomic indicators into marine spatial planning frameworks. For instance, Taiwan’s ambitious OW targets necessitate reconciling wind farm expansion with artisanal fishing zones and ecologically sensitive habitats. Quantitative models coupling these datasets could optimize trade-offs between energy output and ecosystem resilience. Additionally, analyzing policy synergies across decarbonization domains (e.g., hydrogen production, carbon pricing and grid modernization) is critical. Our findings reveal that Germany’s subsidy reforms accelerated OW deployments but did not explicitly link to hydrogen infrastructure incentives. Future work should map policy interactions using systems-dynamics approaches, assessing how combined fiscal, regulatory and technological interventions amplify offshore wind’s role in achieving net-zero targets. Comparative case studies of the UK’s ‘Contracts for Difference’ mechanism with Taiwan’s feed-in tariffs could elucidate optimal synergy designs for emerging blue economies.
5. Conclusions
The present study performed a comparative analysis of global existing policies and data by exploring the performance of the UK, Germany, China, Taiwan and the rest of the world based on the total OW energy installations, bathymetric data, wind speed and direction data and OW energy capacity and the related policy changes. The UK has witnessed the lowest carbon emissions in the past three years with the cost of new offshore energy in the UK reducing by half as a result of the government policies that have promoted the adoption of offshore while Germany currently hosts the world’s largest producer of OW energy facility called the Alpha Ventus which produces up to 6.4 gigawatts. In China, the increase in OW infrastructures is attributed to the fast-growing demand for OW energy, with the country’s consumption of energy accounting for a third of demand growth worldwide. Taiwan is also following the global trend to promote the goal of net zero carbon emissions by 2050 and try to find more marine renewable energy options which has necessitated government investments in OW energy. The results show that different countries are actively adopting renewable energy policies and investing in different OW energy technologies and marine scientific research that has significantly revolutionized their OW energy sector. This study concludes that the successful implementation and scaling of OW energy projects are driven by a complex interplay of factors, yielding key scientific insights. While confirming wind speed as a fundamental geographical driver, our analysis reveals that its influence is modulated by market maturity and policy contexts, evidenced by divergent national correlations. Crucially, we demonstrate that bathymetric constraints, historically significant, show no statistically significant impact on current deployment levels, indicating their effective mitigation through technology and prioritization. The paramount scientific insight underscores that policy frameworks are not merely supplementary but are decisive catalysts, particularly in unlocking the geographical potential of emerging blue economies, as starkly illustrated by Taiwan’s case. These findings refine marine spatial planning paradigms, emphasizing the need for integrated models that weigh evolving technological capabilities and targeted policy interventions alongside physical resource assessments to effectively accelerate the global transition towards sustainable offshore energy systems and net-zero goals. Furthermore, future MSP frameworks must incorporate energy storage solutions, particularly green hydrogen, to mitigate intermittency and maximize OW utilization. Policies promoting the co-location of OW farms with hydrogen production, such as tailored subsidies and spatial zoning for electrolysis facilities, will be critical to achieving SDG-7 and net-zero objectives.
Author Contributions
Y.-S.C.: Conceptualized the research framework, designed the comparative methodology and supervised the overall research direction. C.-Y.H.: Collected and curated the global quantitative datasets (installations, bathymetry, wind resources, capacity) and performed initial data validation. C.-Y.L.: Conducted statistical analyses, correlation testing and trend interpretation of quantitative metrics. J.-B.L.: Developed visualizations (figures), synthesized qualitative policy data and contributed to results interpretation. Y.-C.S.: Coordinated cross-institutional collaboration, led manuscript writing (original draft) and secured funding acquisition. All authors critically reviewed the manuscript structure, validated findings, discussed policy implications and approved the final submitted version. All authors have read and agreed to the published version of the manuscript.
Funding
This study was financed by grants from the Taiwan National Science and Technology Council (NSTC 113-2119-M-004-001).
Data Availability Statement
All datasets supporting the findings of this study are included within the manuscript. Specifically, the quantitative metrics (offshore wind installations, bathymetric data, wind speed/direction records, energy capacity) and qualitative policy analyses (cost structures, regulatory frameworks, taxation schemes) for the United Kingdom, Germany, China, Taiwan and comparator regions are presented in the main text, table (Table 1), and figures (Figure 1, Figure 2, Figure 3, Figure 4, Figure 5, Figure 6, Figure 7, Figure 8, Figure 9, Figure 10, Figure 11 and Figure 12). No additional external data repositories were utilized.
Conflicts of Interest
The authors declare no known competing financial interests or personal relationships that could have influenced the work reported in this paper.
References
- UNEP. Goal 7: Affordable and Clean Energy. Available online: https://www.unep.org/topics/sustainable-development-goals/why-do-sustainable-development-goals-matter/goal-7-affordable (accessed on 10 September 2024).
- Wu, T.; Yang, H.; Wang, P.; Zhang, C.; Zhang, M. Data-Driven Fatigue Reliability Evaluation of Offshore Wind Turbines under Floating Ice Loading. J. Struct. Eng. 2024, 150, 5024004. [Google Scholar] [CrossRef]
- Li, Y.; Qian, K.; Wang, Z.; Xu, A. The evolution of China’s wind power industry innovation network from the perspective of multidimensional proximity. Technol. Anal. Strateg. Manag. 2024, 1–15. [Google Scholar] [CrossRef]
- Yang, M.; Xu, C.; Bai, Y.; Ma, M.; Su, X. Investigating Black-Box Model for Wind Power Forecasting Using Local Interpretable Model-Agnostic Explanations Algorithm. CSEE J. Power Energy Syst. 2025, 11, 227–242. [Google Scholar] [CrossRef]
- Yang, H.; Zhang, C.; Li, J.; Zhu, L.; Zhou, K. A Novel Robust Energy Storage Planning Method for Grids With Wind Power Integration Considering the Impact of Hurricanes. IEEE Trans. Sustain. Energy 2025, 16, 1388–1400. [Google Scholar] [CrossRef]
- Pan, Y.; Wang, X.; Lin, H.; Xia, Q.; Jing, M.; Yuan, W.; Li, C.M. Three-dimensional Ni foam supported NiCoO 2@ Co 3 O 4 nanowire-on-nanosheet arrays with rich oxygen vacancies as superior bifunctional catalytic electrodes for overall water splitting. Nanoscale 2023, 15, 14068–14080. [Google Scholar] [CrossRef] [PubMed]
- Lu, T.; Yi, X.; Li, J.; Wu, S. Collaborative planning of integrated hydrogen energy chain multi-energy systems: A review. Appl. Energy 2025, 393, 126019. [Google Scholar] [CrossRef]
- Li, C.; Ma, S.; Zhao, M.; Jing, M.; Yuan, W.; Li, C. Self-Assembled α-Fe2O3@ Co3O4/Graphene Quantum Dot Core–Hybrid Shell Wormlike Nanoarrays with Synergistic Effects for Photoelectrochemical Water Oxidation. ACS Sustain. Chem. Eng. 2023, 11, 12102–12113. [Google Scholar] [CrossRef]
- Kong, Y.; Wang, T.; Chu, F. Meshing frequency modulation assisted empirical wavelet transform for fault diagnosis of wind turbine planetary ring gear. Renew. Energy 2019, 132, 1373–1388. [Google Scholar] [CrossRef]
- Cui, K.; Wang, C.; Liu, Z.; Fu, D.; Chen, G.; Li, W.; Nie, L.; Shen, Y.; Xu, Y.; Kuang, R. Efficiency analysis of ocean compressed air energy storage system under constant volume air storage conditions. Energy 2025, 329, 136531. [Google Scholar] [CrossRef]
- Li, F.; Xie, J.; Fan, Y.; Qiu, J. Potential of different forms of gravity energy storage. Sustain. Energy Technol. Assess. 2024, 64, 103728. [Google Scholar] [CrossRef]
- Wan, A.; Gong, W.; Iqbal, A.; Al-Bukhaiti, K.; Ji, Y.; Duer, S.; Ma, S.; Yao, F. Robust loop shaping design pitch control of wind turbine for maximal power output and reduced loading. Energy 2025, 319, 135136. [Google Scholar] [CrossRef]
- Yang, M.; Peng, T.; Zhang, W.; Su, X.; Han, C.; Fan, F. Abnormal Data Identification and Reconstruction Based on Wind Speed Characteristics. CSEE J. Power Energy Syst. 2025, 11, 612–622. [Google Scholar] [CrossRef]
- World Economic Forum, These 3 Countries are Global Offshore Wind Powerhouses. Available online: https://www.weforum.org/agenda/2019/04/these-3-countries-are-global-offshore-wind-powerhouses/ (accessed on 10 September 2024).
- Global Wind Energy Council, Global Offshore Wind Report 2023. Available online: https://www.apren.pt/contents/publicationsothers/gwec-global-offshore-wind-report-2023.pdf (accessed on 10 September 2024).
- Carvalho, K.S.; Wang, S. Sea surface temperature variability in the Arctic Ocean and its marginal seas in a changing climate: Patterns and mechanisms. Glob. Planet. Change 2020, 193, 103265. [Google Scholar] [CrossRef]
- Diebold, F.X.; Rudebusch, G.D. Probability assessments of an ice-free Arctic: Comparing statistical and climate model projections. J. Econom. 2022, 231, 520–534. [Google Scholar] [CrossRef]
- Costa, C.; Wollenberg, E.; Benitez MNewman, R.; Gardner, N.; Bellone, F. Roadmap for achieving net-zero emissions in global food systems by 2050. Sci. Rep. 2022, 12, 15064. [Google Scholar] [CrossRef] [PubMed]
- EUR 29981 EN; Towards Net-Zero Emissions in the EU Energy System by 2050—Insights from Scenarios in Line with the 2030 and 2050 Ambitions of the European Green Deal. Publications Office of the European Union: Luxembourg, 2020; ISBN 978-92-76-13096-3. [CrossRef]
- Bouckaert, S.A.; Fernandez Pales, C.; McGlade, U.; Remme, B.; Wanner, L.; Varro, D.; D’Ambrosio Spencer, T. Net Zero by 2050—A Roadmap for the Global Energy Sector, International Energy Agency 2021. Available online: https://iea.blob.core.windows.net/assets/deebef5d-0c34-4539-9d0c-10b13d840027/NetZeroby2050-ARoadmapfortheGlobalEnergySector_CORR.pdf (accessed on 1 October 2021).
- Shih, Y.C. Taiwan’s progress towards becoming an ocean country. Mar. Policy 2019, 111, 103725. [Google Scholar] [CrossRef]
- Li, Y.; Huang, X.; Tee, K.F.; Li, Q.; Wu, X.P. Comparative study of onshore and offshore wind characteristics and wind energy po-tentials: A case study for southeast coastal region of China. Sustain. Energy Technol. Assess. 2020, 39, 100711. [Google Scholar] [CrossRef]
- Baiyu, G.; Offshore Wind Takes off in China. Dialogue Earth. Available online: https://dialogue.earth/en/energy/china-offshore-wind-power-growth/,2020 (accessed on 9 October 2020).
- Dedene, A.M. China’s Growing Offshore Wind Energy Drive 2023. Available online: https://thediplomat.com/2023/10/chinas-growing-offshore-wind-energy-drive/ (accessed on 1 June 2023).
- Dedene, A.M. The ramifications of china’s maritime equipment industry policies for the EU. J. Contemp. China 2024, 33, 666–682. [Google Scholar] [CrossRef]
- Jansen, M.; Staffell, I.; Kitzing, L.; Quoilin, S.; Wiggelinkhuizen, E.; Bulder, B.; Riepin, I.; Müsgens, F. Offshore wind competitiveness in mature markets without subsidy. Nat. Energy 2020, 5, 614–622. [Google Scholar] [CrossRef]
- Bundesverband WindEnergie (BWE) Offshore: Wind Energy Generation at Sea. Available online: https://www.wind-energie.de/english/policy/offshore/,2024 (accessed on 1 March 2024).
- Canan, A. Offshore wind energy policy paths: A comparative analysis of Denmark and Germany. Econ. Energy Environ. Policy 2023, 65, 35–59. [Google Scholar] [CrossRef]
- Glaum, P.; Neumann, F.; Brown, T. Offshore wind integration in the North Sea: The benefits of an offshore grid and floating wind. In Proceedings of the 2023 19th International Conference on the European Energy Market (EEM), Lappeenranta, Finland, 6–8 June 2023. [Google Scholar] [CrossRef]
- Chen, G.; Ji, Z. A review of solar and wind energy resource projection based on the Earth system model. Sustainability 2024, 16(8), 3339. [Google Scholar] [CrossRef]
- Khalid, O. UK Offshore Wind 2023 Round-Up and 2024 Outlook. Available online: https://ore.catapult.org.uk/ (accessed on 1 March 2023).
- Hosius, E.; Seebaß, J.V.; Wacker, B.; Schlüter, J.C. The impact of offshore wind energy on Northern European wholesale electricity prices. Appl. Energy 2023, 341, 120910. [Google Scholar] [CrossRef]
- Jansen, M.; Duffy, C.; Green, T.C.; Staffell, I. Island in the sea: The prospects and impacts of an offshore wind power hub in the North Sea. Adv. Appl. Energy 2022, 6, 100090. [Google Scholar] [CrossRef]
- Soares-Ramos, E.P.P.; Oliveira-Assis, L.D.; Sarrias-Mena, R.; Fernández-Ramírez, L.M. Current status and future trends of offshore wind power in Europe. Energy 2020, 202, 117787. [Google Scholar] [CrossRef]
- Chen, T.A.P.; Shih, Y.C. Blue economy based on local DNA in Taiwan: Marine regional revitalisation under the collaboration of the local and central government. Mar. Policy 2021, 132, 104668. [Google Scholar] [CrossRef]
- Cheng, K.S.; Ho, C.Y.; Teng, J.H. Wind characteristics in the Taiwan Strait: A case study of the first offshore wind farm in Taiwan. Energies 2020, 13, 6492. [Google Scholar] [CrossRef]
- Cheng, K.S.; Ho, C.Y.; Teng, J.H. Wind and sea breeze characteristics for the offshore wind farms in the central coastal area of Taiwan. Energies 2022, 15, 992. [Google Scholar] [CrossRef]
- Chien, K. Pacing for Renewable Energy Development: The developmental state in Taiwan’s offshore wind power. Ann. Assoc. Am. Geogr. 2019, 110, 793–807. [Google Scholar] [CrossRef]
- Gao, A.M.Z.; Huang, C.H.; Lin, J.C.; Su, W.N. Review of recent offshore wind power strategy in Taiwan: Onshore wind power comparison. Energy Strategy Rev. 2021, 38, 100747. [Google Scholar] [CrossRef]
- Huang, C.Y.; Yu, T.T.; Lin, W.M.; Chung, K.M.; Chang, K.C. Energy Sustainability on an offshore island: A case study in Taiwan. Energies 2022, 15, 2258. [Google Scholar] [CrossRef]
- Chung, H.S. Taiwan’s offshore wind energy policy: From policy dilemma to sustainable development. Sustainability 2021, 13, 10465. [Google Scholar] [CrossRef]
- Li, M.; Wang, T.; Chu, F.; Han, Q.; Qin, Z.; Zuo, M.J. Scaling-Basis Chirplet Transform. IEEE Trans. Ind. Electron. 2021, 68, 8777–8788. [Google Scholar] [CrossRef]
- Fang, C.; Song, K.; Yan, Z.; Liu, G. Monitoring phycocyanin in global inland waters by remote sensing: Progress and future developments. Water Res. 2025, 275, 123176. [Google Scholar] [CrossRef]
- Qiu, Y.; Li, X.; Yan, L.; And Chen, Z. Synergic sensing of light and heat emitted by offshore oil and gas platforms in the South China Sea. Int. J. Digit. Earth 2024, 17, 2441932. [Google Scholar] [CrossRef]
- Huang, B.Q.; Li, X. Wave Attenuation by Sea Ice in the Arctic Marginal Ice Zone Observed by Spaceborne SAR. Geophys. Res. Lett. 2023, 50, e2023GL105059. [Google Scholar] [CrossRef]
- Shi, Z.; Chen, J.; Wang, Y.; Zhao, Y.; Xu, B. Credibility copula-based robust multistage planning for industrial parks under exogenous and endogenous uncertainties. CSEE J. Power Energy Syst. 2025, 11, 987–998. [Google Scholar] [CrossRef]
- Xue, Y.; Li, Z.; Lin, C.; Guo, Q.; Sun, H. Coordinated Dispatch of Integrated Electric and District Heating Systems Using Heterogeneous Decomposition. IEEE Trans. Sustain. Energy 2020, 11, 1495–1507. [Google Scholar] [CrossRef]
- Wang, W.H.; Zheng, J.H.; Liu, Z.; Fang, J.; Li, Z.; Wu, Q.H. Hierarchical demand response considering dynamic competing interaction based on multi-agent deep deterministic policy gradient. CSEE J. Power Energy Syst. 2025, 1–12. [Google Scholar] [CrossRef]
Disclaimer/Publisher’s Note: The statements, opinions and data contained in all publications are solely those of the individual author(s) and contributor(s) and not of MDPI and/or the editor(s). MDPI and/or the editor(s) disclaim responsibility for any injury to people or property resulting from any ideas, methods, instructions or products referred to in the content. |
© 2025 by the authors. Licensee MDPI, Basel, Switzerland. This article is an open access article distributed under the terms and conditions of the Creative Commons Attribution (CC BY) license (https://creativecommons.org/licenses/by/4.0/).