Abstract
This study applies the TOPSIS (Technique for Order Preference by Similarity to Ideal Solution) method combined with entropy-based weighting to systematically rank Serbian municipalities regarding economic vitality, infrastructure quality, and socio-economic stability. By developing a composite municipal performance index, the research explores the extent to which stronger economic standings relate to public safety outcomes. Infrastructure factors—including road conditions, housing quality, and water supply—are assessed through correlation and t-tests to evaluate their influence on municipal economic rankings. An ordinary least squares (OLS) regression model also examines how education and health expenditures per capita contribute to broader socio-economic resilience. The findings reveal a moderately strong, though nonlinear, negative relationship between economic performance and crime rates, with road infrastructure emerging as a consistently significant driver of economic strength. Investments in education and health initially correlate with greater municipal stability but show signs of diminishing marginal impact over time. These insights contribute to understanding the complex interplay between governance, infrastructure, and safety in transitional economies, highlighting the value of integrated data-driven approaches for regional development planning.
1. Introduction
Economic vitality and public security represent two fundamental pillars of municipal development, directly influencing the quality of life and the long-term sustainability of local communities. Municipalities marked by high employment rates, competitive salaries, and substantial investment inflows typically exhibit greater social cohesion and lower crime levels. By contrast, economically stagnant regions with underdeveloped infrastructure often face heightened security challenges and widening socio-economic disparities. In Serbia, for example, the number of employed individuals per 1000 inhabitants was 479 in 2021, while some municipalities recorded as few as 134, underscoring significant regional disparities. The number of sentenced adults ranged from as high as 1003 in some regions to as low as 1 in others, further illustrating the uneven distribution of public safety concerns across municipalities. Additionally, Serbia’s road network covered 44,794 km in 2021 (excluding motorways from Class I national road lengths), yet road density and quality vary markedly between municipalities, with direct implications for accessibility and economic development. Public expenditures on education and health accounted for approximately 19% and 11% of local government budgets, respectively, highlighting their importance in social investment strategies and pointing to potential areas for increased efficiency and reprioritization.
This study focuses on the municipal level in Serbia, analyzing 172 administrative units (municipalities and city municipalities) based on the latest available data from the Statistical Office of the Republic of Serbia. The analysis covers three time periods—2019, 2021, and 2023—with all indicators calculated separately for each year to capture the dynamics of municipal performance over time. The years 2019, 2021, and 2023 were selected because they represented the most recent and complete data available from the Statistical Office of the Republic of Serbia at the time of analysis. Moreover, this selection allows us to capture pre-pandemic conditions (2019), the pandemic period (2021), and early post-pandemic recovery (2023), thereby enabling an assessment of municipal performance under distinct social and economic circumstances. In Serbia, large cities such as Belgrade are administratively divided into multiple municipalities, each treated as a separate unit of analysis in this research. As the largest and most influential country in the Western Balkans, Serbia is pivotal in regional stability and development. Positioned at the crossroads of European Union integration and competing geopolitical influences from the United States, China, and Russia, Serbia offers a unique environment to examine the interplay between economic development and public security at the local level.
Although the individual effects of economic conditions, infrastructure quality, and public spending on urban performance have been investigated, coherent frameworks integrating these at the municipal level are still lacking, at least in the Serbian setting. Traditional statistical approaches to municipal performance evaluations do not consider the multidimensional nature of the economic and security indicators. To fill this gap, this study employs the TOPSIS and entropy weight methods to rank Serbian municipalities based on economic vitality and public security indicators, incorporating correlation analysis and hypothesis testing, this work critically assesses the link between municipal economic development and safety outcomes.
This research asks the following questions: Do municipalities with higher economic vitality (measured through employment, salaries, and investment levels) exhibit lower crime rates and greater public safety? How does public infrastructure quality (housing, roads, and utilities) influence economic performance at the municipal level? Does higher public spending on education and health contribute to greater socio-economic stability in Serbian municipalities?
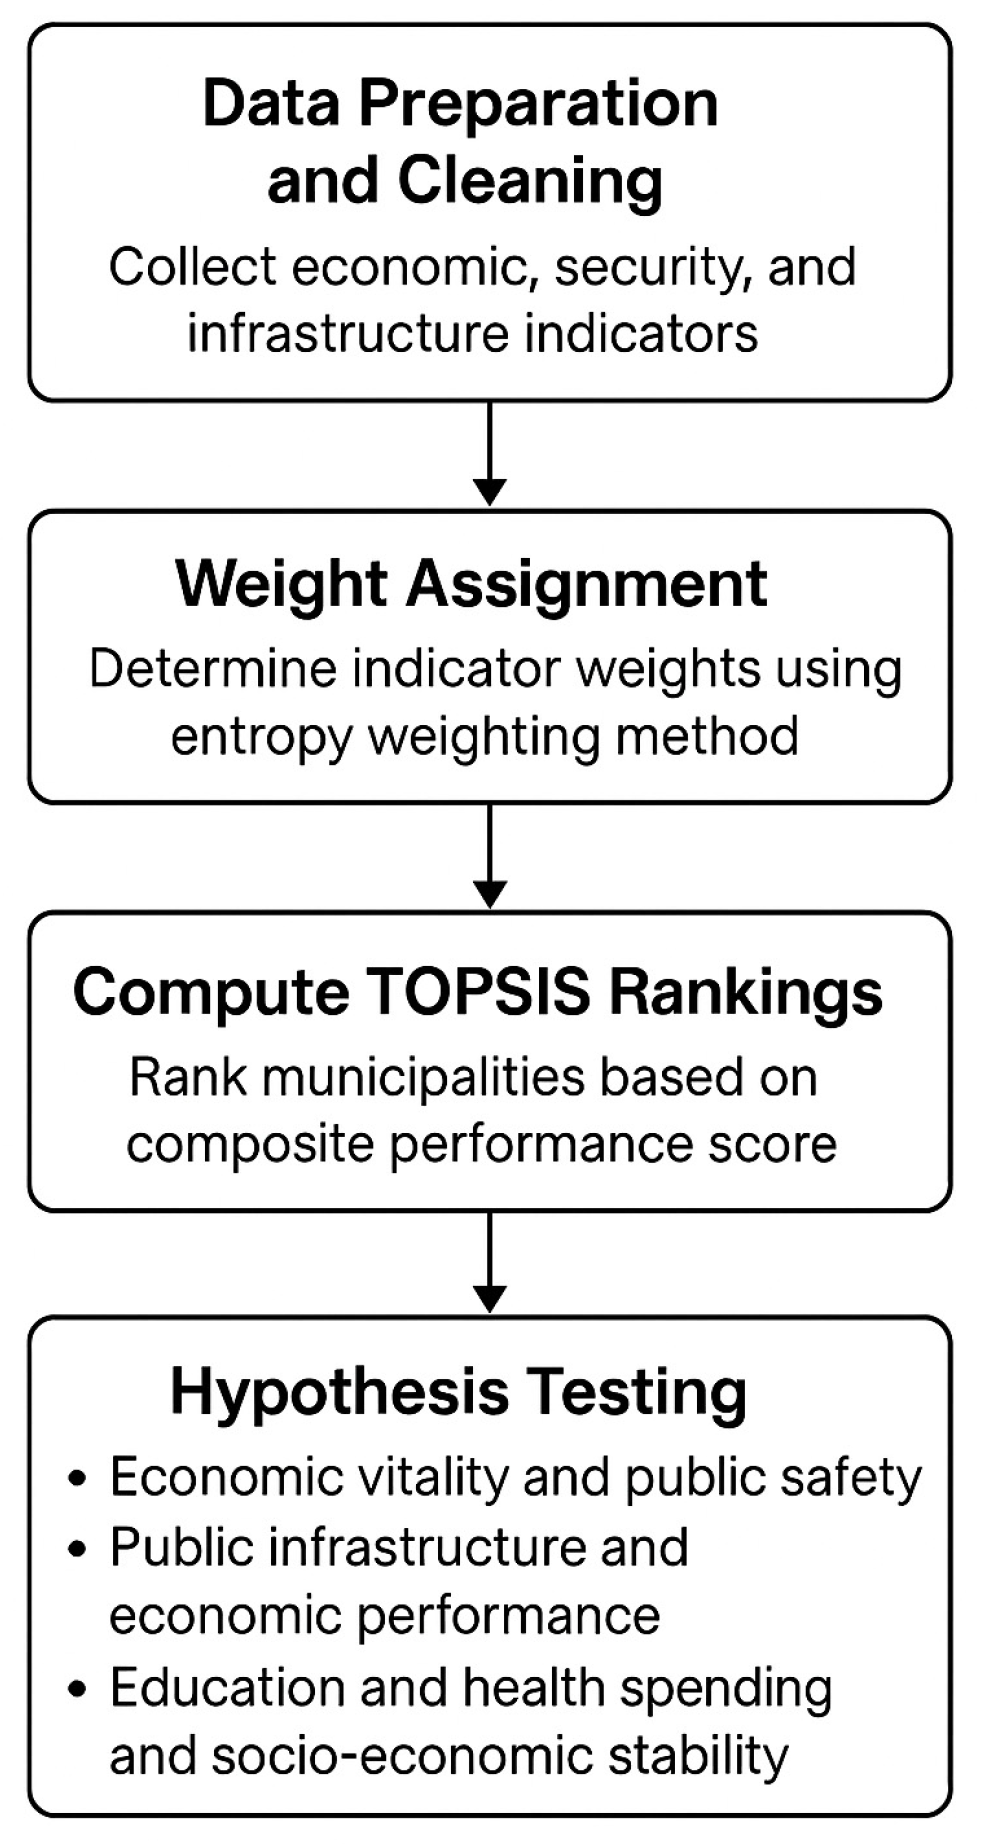
The research follows a structured methodology to systematically evaluate these relationships, as illustrated in Figure 1 below.

Figure 1.
Methodological framework for evaluating municipal performance in Serbia.
Step 1: Data preparation and cleaning—this phase involves collecting and refining municipal-level economic, security, and infrastructure indicators for 172 Serbian municipalities across three time points (2019, 2021, and 2023).
Step 2: Weight assignment—using the entropy weight method, this study determines the relative importance of each indicator in the performance ranking process. This approach reduces subjectivity by basing weights on the variability of the data.
Step 3: Compute TOPSIS rankings—the Technique for Order Preference by Similarity to Ideal Solution (TOPSIS) is applied to establish a composite performance score for each municipality, integrating economic and public safety dimensions.
Step 4: Hypothesis testing—employing statistical techniques to examine the interdependencies between economic vitality, public infrastructure, and public safety. For this research, we determined one central hypothesis and two additional ones: H1: municipalities exhibiting stronger economic vitality are associated with significantly lower crime rates and enhanced public safety outcomes at the municipal level in Serbia—testing the correlation between municipal economic rankings and crime indicators (X25, X26, X27) using the Pearson and Spearman correlation coefficients. H2: Serbian municipalities with higher quality public infrastructure (housing, roads, utilities) exhibit stronger economic performance indicators, suggesting the critical role of infrastructure in local economic development—analyzing the relationship between infrastructure indicators (X13, X14, X24) and economic vitality rankings using the Pearson correlation and t-test. H3: Higher per capita expenditures on education and health are positively associated with greater socio-economic stability among Serbian municipalities, emphasizing the role of social investments in regional development—using OLS regression analysis, assessing the impact of education and health expenditures per capita (X18, X19) on municipal socio-economic stability.
By integrating these analytical techniques, this study provides an evidence-based evaluation of municipal performance in Serbia, offering insights into the interconnected dynamics of economic development and public safety. The findings will contribute to the broader discourse on regional economic planning and crime prevention policies, supporting data-driven decision-making for sustainable municipal growth.
1.1. Defining the Research Problem
Economic vitality and public security are two key dimensions of municipal performance that affect residents’ quality of life. When municipalities have strong economic indicators, such as high employment, substantial investments, and robust infrastructure, they are typically associated with low crime rates and a stable socio-economic environment. Nonetheless, the relationship between economic strength and public safety remains a complex issue influenced by various interconnected factors, including governance efficiency, public expenditure, infrastructure quality, and demographics. In Serbia, where municipal disparity in economic development and security situation persists, such dynamics should be assessed through a structured, multicriteria decision-making process.
1.2. Importance of the Research
This research is significant for policymakers, urban planners, and local governments seeking data-driven insights into municipal performance. By identifying the key economic and infrastructural factors associated with public safety outcomes, this study provides evidence-based recommendations for fostering balanced regional development. The findings contribute to the broader discourse on sustainable urban planning and socio-economic stability, supporting targeted interventions in underperforming municipalities. Furthermore, applying TOPSIS and statistical validation enhances methodological rigor, offering a replicable framework for assessing municipal performance in other national contexts.
This study is structured as follows: first, data preparation and cleaning ensure the reliability of economic and security indicators. Second, the entropy weight method assigned objective importance to each variable. Third, TOPSIS rankings provide a composite performance measure for Serbian municipalities. Finally, hypothesis testing examines the relationships between economic vitality and crime rates, infrastructure and economic performance, and public spending and socio-economic stability.
1.3. Research Gap
While previous studies have examined individual aspects of economic performance, infrastructure quality, public spending, and public safety, few have integrated them into a comprehensive analytical framework that evaluates municipal performance holistically. The existing literature on economic development and crime often focuses on national or regional levels, lacking granularity in municipal-level assessments. Furthermore, the traditional statistical methods used in municipal performance evaluations frequently fail to capture the multidimensional and comparative nature of economic and security factors.
While there is ample evidence of the individual effects of economic conditions, infrastructure quality, and public spending on urban performance, a holistic approach integrating these factors through advanced multicriteria decision-making (MCDM) methods is still not explored, at least in the Serbian context. This study fills this gap by ranking Serbian municipalities for economic vitality, public safety, and socio-economic stability based on the TOPSIS method and correlation analyses. This approach gives a better account of the relationships among these key indicators to enable a more objective, data-driven municipal performance assessment.
1.4. Literature Review
Assessing municipal performance has emerged as a critical issue in urban economics and public policy, particularly as cities strive to balance economic growth with public safety. Researchers have increasingly employed multicriteria decision-making (MCDM) techniques to evaluate complex urban systems by integrating various socio-economic and infrastructural indicators [1,2,3,4,5]. These methods facilitate a holistic assessment, overcoming the limitations of single-dimensional analyses that fail to capture the interplay among economic vitality, public safety, infrastructure quality, and public spending. However, applications of the MCDM method for assessing municipal performance at the local level in Serbia remain extremely scarce.
The relationship between economic conditions and crime has long been debated in the literature. Studies have suggested that improved employment opportunities and higher incomes reduce the incentives for criminal behavior. For instance, Raphael and Winter-Ebmer [6] demonstrated that regions with lower unemployment rates tend to experience fewer crimes, corroborating the social disorganization framework. While Sampson and Wilson’s [7] foundational work highlighted the role of concentrated disadvantage and social capital in shaping crime rates in urban areas, more recent research continues to refine and expand this perspective. For example, Sharkey [8] examined how the persistent effects of neighborhood inequality, shaped by historical and ongoing racial segregation, contribute to contemporary patterns of violence, building upon the core tenets of social disorganization theory. However, the heterogeneity of infrastructure quality across municipalities, especially in transitional economies such as Serbia, creates discrepancies often not considered in traditional analyses. This variation can obscure the accurate relationship between economic factors and crime, making it difficult to draw consistent conclusions. Such complex integration of dimensions into a standardized assessment framework remains arduous, highlighting the need for methodologies to cope with such complexity. Nevertheless, empirical evidence linking municipal economic performance to public safety outcomes within the Serbian context is lacking.
Clements et al. [9] argued that public investment in education and health care is essential for building human capital, promoting long-term economic stability, fostering equity, and enhancing economic performance through a healthier and better-educated population. Yet, studies systematically examining these effects at the municipal level in Serbia are virtually absent. Despite this theoretical linkage, empirical studies focusing on the municipal level in Serbia are sparse. The research by Lojanica [10], and Masten and Grdović Gnip [11] has highlighted that inconsistent public spending patterns may contribute to the observed variability in municipal performance, particularly concerning public safety and social stability.
Advances in the MCDM techniques, particularly applying the TOPSIS method enhanced by using the entropy weight method, offer promising tools for municipal performance evaluation [1,12,13]. Tan et al. [14] demonstrated that integrating these methods can deliver objective and comprehensive rankings of municipalities based on diverse performance indicators. Although several studies have successfully applied TOPSIS and other MCDM frameworks in urban planning and infrastructure assessment [15,16], their application in simultaneously evaluating economic vitality and public safety at the municipal level is limited. Stanković et al. [17] provided preliminary insights into municipal performance. However, studies focusing on Serbian municipalities remain scarce, despite the significant socio-economic disparities and regional variations in public safety observed within the country. Their analysis did not fully incorporate the multidimensional nature of public safety dynamics or explore the potential correlations between economic and security indicators. Thus, this study fills a significant gap by applying an integrated MCDM framework to evaluate the intertwined dynamics of economic vitality, infrastructure development, and public safety at the Serbian municipal level.
Several techniques in the broader MCDM literature have gained prominence, including DEA, AHP, and SFA. DEA in particular has been heavily utilized for efficiency benchmarking in public-sector applications like urban transport. Lee et al. [18] demonstrated how DEA-derived performance scores can directly inform strategic decision-making in transportation planning. Their study employed DEA across six metrics to generate unified transportation scores at the census tract level, using Tobit regression to reveal strategic improvement areas. Similarly, in a previous study, Lee [19] proposed an explainable DEA (X-DEA) framework enhanced by integrating DEA with eXtreme Gradient Boosting (XGBoost) and SHapley Additive exPlanations (SHAP) to assess over 33,000 origin–destination pairs, with bus travel times emerging as a critical performance driver. Finally, Lee and Lee [20] developed an iterative data envelopment analysis (iDEA) model to address operational and structural challenges in analyzing elderly passengers’ transfer efficiency at 32 stations. This approach achieved sub-population benchmarking and leveraged XAI to guide transfer time and walking facility improvements. These studies demonstrate DEA’s adaptability—evolving from strategic score aggregation and XAI-enhanced interpretability to iterative methods tackling demographic-specific efficiency challenges.
While DEA and AHP are robust in assessing relative efficiencies and pairwise preferences, respectively, they come with certain limitations in the context of this study. AHP requires extensive expert input, which can introduce subjectivity and be less practical when handling large datasets with numerous criteria. DEA, although effective for benchmarking efficiency, typically lacks sensitivity to performance trade-offs between indicators and does not yield a composite performance score easily comparable across units. By contrast, TOPSIS offers a straightforward, objective, and scalable approach that ranks alternatives based on their geometric distance from an ideal solution, making it particularly well-suited for multi-dimensional evaluations involving economic and safety indicators. The entropy weight method further enhances TOPSIS by providing data-driven weightings that reduce the influence of subjective judgment. Thus, the selection of the entropy-weighted TOPSIS method in this study is driven by its computational simplicity, compatibility with the available data, and its capacity to handle multiple conflicting criteria within a transparent and replicable decision framework.
1.5. Dimensions of Municipal Performance and Economic–Security Dynamics
Municipal performance is a multidimensional construct encompassing economic vitality, public safety, infrastructure quality, and socio-economic stability [21,22,23]. The effectiveness of municipal governance and development strategies is often reflected in employment rates, income levels, crime rates, and investment flows. Understanding all these factors together is necessary for formulating policies promoting economic resilience while maintaining public safety.
Economic vitality is a dimension of municipal performance characterized by employment, income distribution, business, and investment in infrastructure. Generally, municipalities with solid economic foundations have higher job availability, steady income growth, and investment in public services and infrastructure. Together, these elements form a strong and competitive local economy. However, differences in economic performance between municipalities may lead to different quality of life, migration flows, and long-term regional development prospects.
Public safety is another critical facet of municipal performance, influenced by crime rates, social stability, and law enforcement effectiveness. Economic prosperity is typically associated with lower crime rates because higher employment and income levels decrease the criminal incentive to act. The relationship between economic conditions and crime is documented in criminology and urban economics, but localized, data-driven analyses of this dynamic are needed at the municipal level.
Infrastructure quality is critical to economic and social outcomes. Poor infrastructure increases business costs, makes investment less attractive, and limits access to markets and services. In addition, inadequate infrastructure may contribute to social unrest and increased crime rates, especially in economically disadvantaged areas. Understanding the relationship between infrastructure development and economic performance can provide valuable insights into municipal policy design.
Public spending on essential services, such as education and health care, is another determinant of municipal performance. However, the efficiency of resource allocation, governance structures, and local economic conditions significantly influence the effectiveness of public spending.
Traditional statistical approaches fail to capture the interdependent nature of economic and security factors. The TOPSIS analysis provides a structured method for ranking municipalities based on several criteria. By incorporating the entropy weight method for objective weight assignment, this study enhances the ranking process to ensure that municipal performance assessments accurately reflect real-world economic and security conditions.
This research integrates economic and public safety indicators within an analytical framework to address the gap in evaluating municipal performance. This study uses TOPSIS and correlation analyses to explore potential interactions between economic vitality, infrastructure development, public safety, and social stability in Serbian municipalities, areas that have received limited empirical attention despite their critical importance for regional development.
2. Materials and Methods
This study applies a multicriteria evaluation to assess municipal performance. First, a broad set of economic, infrastructural, fiscal, and socio-demographic variables was collected, then refined to the key indicators for measuring economic vitality and public safety in Serbian municipalities. These variables were standardized into a dimensionless decision matrix for analysis.
Weights were objectively assigned using the entropy weight method, leveraging information theory as introduced by Shannon [24] to quantify data variability. This reduces subjective bias by giving more weight to indicators with higher variability, strengthening the reliability of the multicriteria decision-making process.
Synthetic variables were then calculated to combine all criteria into a single metric, enabling municipalities to be ranked by their relative proximity to an ideal performance model and adjusting for economic and infrastructural disparities.
To assess economic vitality and public safety, the TOPSIS method was used, as it fits a multidimensional analysis of 37 carefully selected indicators. Highly correlated variables were removed to retain only the most representative indicators.
The construction phases of the synthetic indicator, as defined by Hwang and Yoon [25], are as follows:
- creation of a normalized decision matrix, standardizing variables to eliminate unit discrepancies and bring them onto a comparable scale;
- construction of a weight matrix, followed by the generation of a weighted normalized decision matrix, should variable weighting be requisite, which reflects the relative importance of each criterion in the evaluation process;
- a determination of the coordinates for the ‘ideal’ (A+) and ‘anti-ideal’ (A−) solutions, based on the normalized characteristics as follows:
- 4.
- a calculation of the Euclidean distance for each entity from both the ideal and anti-ideal solutions as follows:
- 5.
- a calculation of the synthetic value, which encapsulates the multidimensional assessment into a singular score, facilitating a straightforward ranking of countries based on their renewable energy development prospects as follows:
This study uses TOPSIS to systematically assess municipal economic conditions and their correlation with public safety indicators, revealing how economic vitality, infrastructure, and public spending impact stability and crime reduction, and offering evidence-based policy guidance for Serbian municipal development.
Variable selection considered variability and correlations using the inverse correlation matrix, capturing broad performance dimensions while preserving variable interdependencies for a holistic municipal assessment. Including all variables, the synthetic indicator gives a comprehensive measure of municipal performance, enhancing the reliability and validity of the findings, and providing stakeholders with a detailed view of regional development in Serbia.
While alternative multicriteria decision-making methods such as DEA, PCA, or regression-based scoring exist, the entropy-weighted TOPSIS approach was selected for this study because it provides a straightforward, objective, and interpretable ranking across numerous municipalities and criteria. Unlike DEA, which focuses on relative efficiency rather than composite performance, or AHP, which requires subjective expert judgment, TOPSIS enables transparent benchmarking based on data dispersion. However, we also recognize that TOPSIS can be sensitive to the normalization method, the choice of reference points, and assumes compensatory trade-offs across criteria. Future studies could directly compare the performance of TOPSIS with DEA, PCA, or other advanced scoring methods to further validate the robustness and policy relevance of composite municipal performance indices.
In this study, we analyze each period separately to enable comparisons across municipalities at specific time points. However, we acknowledge that utilizing the full panel structure of the data to examine trends and dynamics over time within municipalities represents an important direction for future research.
2.1. Hypothesis Testing Methods
The analysis examined the relationships between economic vitality, public safety, infrastructure quality, and socio-economic stability of the Serbian municipalities, using the following methods:
H1:
To test if higher economic vitality relates to lower crime rates (public safety), both the Pearson and the Spearman correlation coefficients were used. Pearson assesses linear association under normality, while Spearman’s tests monotonic relationships without assuming linearity or normal distribution. Both were applied to TOPSIS rankings and crime indicators (X25, X26, X27), providing complementary insights, capturing linear and non-linear associations, and enhancing result robustness [26,27]. While the Pearson showed modest or non-significant correlations (e.g., −0.1268 for X25 in 2019, p = 0.0965), Spearman’s consistently found stronger, significant associations, suggesting rank-order relationships to better capture the link between economic vitality and crime. Using both offers cross-validation and a nuanced view of economic–public safety interactions.
H2:
To examine if infrastructure quality relates to economic performance in Serbian municipalities (as found in the literature), the Pearson correlation and independent samples t-tests were applied. Pearson measured linear relationships between infrastructure indicators (X13, X14, X24) and TOPSIS economic rankings. T-tests compared the mean infrastructure quality between high- and low-performance groups. Using both methods ensures that the findings are not artefacts of method limitations, capturing overall trends and distinct group differences, thus strengthening the conclusion’s validity, as recommended in the literature [28,29].
H3:
To test if public spending on services supports socio-economic stability, ordinary least squares (OLS) regression was used, with per capita education (X18) and health (X19) expenditures as predictors and the TOPSIS score as the outcome. OLS quantifies the effect of public spending on performance, with linear relationships supported by the previous studies [30,31]. Regression outputs (t-values, p-values, R-squared) establish the significance and explanatory power of spending on municipal stability, supporting data-driven policy interventions.
2.2. Characteristics of the Accepted Factors
This research uses a structured, multidimensional framework to evaluate Serbian municipalities’ economic vitality and public safety by integrating socio-economic, infrastructural, and security indicators, organized into distinct groups (Table 1). Each variable is classified as a stimulant (promoting development and security) or a destimulant (indicating risks or constraints), permitting detailed assessment via the TOPSIS method.

Table 1.
List of factors accepted for testing.
This comprehensive TOPSIS-based framework enables a holistic, data-driven analysis of regional disparities, economic vitality, public service provision, and security dynamics, supporting policymakers in fostering sustainable municipal development and public safety.
2.3. Weight Assignment
Weights were assigned using the entropy weight method, an objective approach that determines indicator importance based on data variability and informational content [24,32,33]. This method reduces subjective bias, giving higher weights to more variable indicators, thus ensuring that the composite TOPSIS rankings accurately represent the differences among Serbian municipalities.
The methodology follows a straightforward, step-by-step process. First, the original data for each indicator is normalized to eliminate the effects of differing scales. For a given indicator j and municipality , the normalized value is computed as follows:
where represents the indicator value for municipality , and is the total number of municipalities. Next, the entropy for each indicator is calculated using the following formula:
ensuring that is bounded between 0 and 1. A lower entropy value indicates greater dispersion in the data, which translates into a higher potential for differentiation among the alternatives. Finally, the weight for each indicator is determined by computing the degree of divergence and then normalizing these values to obtain the following:
where is the number of indicators. These weights are subsequently used in the TOPSIS method to compute the composite performance scores for each municipality.
Entropy-based weighting is widely recognized as a robust, objective method for criterion weighting in MCDM, grounded in Shannon’s foundational work [24] and supported across domains for handling uncertainty and variability [32,33,34,35]. This systematic approach enhances analytical rigor and provides more accurate, defensible insights into economic vitality, infrastructure quality, and public safety in Serbian municipalities.
3. Results
According to the TOPSIS-based rankings for 2019, 2021, and 2023, municipalities at the top consistently share notable features regarding economic and security indicators. Many leading municipalities—Vrnjačka Banja, Novi Sad, and Savski Venac (Table 2)—have relatively robust economic structures with high employment rates, active investment flows, and diversified service sectors. These findings align with the broader research on local economic development, which indicates that concentrated investments in tourism, commercial activities, and administration stimulate regional growth and enhance public services [36,37]. For instance, municipalities such as Vrnjačka Banja and Sokobanja rely on their status as spa and health tourism destinations to generate revenue and maintain relatively low crime rates, thanks to the interplay between tourism-driven economic vitality and local safety.
Table 2.
Synthetic meter of top-20 municipal performance in Serbia.
A second common thread among top-ranked municipalities is a clear focus on infrastructure quality and public services. Roads are well-maintained, water supply is reliable, and educational and health facilities are varied to ensure socio-economic stability, as seen in Novi Sad or Barajevo. This aligns with studies indicating that municipalities investing in physical and social infrastructure are more likely to hire and retain skilled workers, boost business activities, and maintain safer neighborhoods [38,39,40,41]. The pattern suggests that synergy among the economic sectors, adequate infrastructure, and proactive governance contribute to higher TOPSIS scores.
The lowest-ranked municipalities in the TOPSIS analysis (Table 3) consistently face economic and infrastructural weaknesses, often relying on outdated or undiversified industries that limit investment, employment, and tax revenue. This reduces spending on essential services and poor connectivity (roads, transport, digital infrastructure), further hindering development [42,43].
Table 3.
Synthetic meter of bottom-20 municipal performance in Serbia.
These areas also struggle with population decline or aging, shrinking the workforce and local market demand, perpetuating low investment and job opportunities. Causes vary—rural municipalities may lack market access, while former industrial centers face modernization challenges—but all have trouble attracting new capital and skilled labor. As a result, these places score lower in economic vitality, public services, and sometimes public safety. These shared vulnerabilities highlight the need for targeted interventions, such as economic diversification, better infrastructure, and more substantial human capital and governance policies.
Hypothesis H1 testing
The results of testing H1 reveal a consistent pattern (Table 4) whereby municipalities with higher economic vitality tend to exhibit lower crime rates, though the nature of the relationship is more clearly captured by non-parametric measures. For instance, in 2019, the Spearman correlation coefficients between the TOPSIS-derived economic rankings and the crime indicators were strongly negative (X25: r = −0.4907; X26: r = −0.6462; X27: r = −0.5732; all p < 0.001), indicating that, as economic performance improves, crime rates tend to decrease. By contrast, the Pearson correlations for the same year were weaker, with only X26 achieving statistical significance (r = −0.1641, p = 0.0310), while X25 (r = −0.1268, p = 0.0965) and X27 (r = −0.1228, p = 0.1076) did not reach significance. A similar pattern was observed in 2021, where the Spearman coefficients remained significantly negative (X25: r = −0.2783; X26: r = −0.6250; X27: r = −0.4169; all p < 0.001) despite the Pearson correlations showing a significant negative association only for X26 (r = −0.3281, p < 0.001), while those for X25 (r = 0.0053, p = 0.9442) and X27 (r = −0.1348, p = 0.0762) were weak or non-significant. In 2023, the Spearman correlations continued to indicate a robust inverse association between economic vitality and crime (X25: r = −0.4869; X26: r = −0.5869; X27: r = −0.5557; all p < 0.001), whereas the Pearson correlations remained statistically insignificant (X25: r = 0.0423, p = 0.5795; X26: r = −0.0963, p = 0.2061; X27: r = −0.0386, p = 0.6128). These findings suggest that, while the relationship between economic vitality and public safety is not strictly linear, a strong monotonic association exists, which is better captured by Spearman’s rank correlation. These results align with the established economic–crime research showing non-linear associations best captured by non-parametric methods [44]. The persistent superiority of the Spearman correlations in our analysis mirrors the findings by Chalfin and McCrary [45], who demonstrated that linear models frequently underestimate economic–crime relationships in municipal data. The results provide empirical support for H1, affirming that higher economic performance is associated with lower crime levels and enhanced public safety across Serbian municipalities.
Table 4.
Correlation analysis of crime indicators (2019–2023).
Hypothesis H2
The analysis for H2 indicates that the relationship between public infrastructure quality and economic performance is nuanced and varies across different indicators and years. In 2019, the Pearson correlation analysis revealed (Table 5) that, while road length (X13) and water supply access (X14) were not significantly associated with the TOPSIS-derived economic rankings (r = −0.060, p = 0.432; r = −0.051, p = 0.506, respectively), the housing quality score (X24) demonstrated a moderate and statistically significant positive association (r = 0.267, p = 0.000). Complementing these results, independent samples t-tests indicated that the mean values for road length (X13; t = −2.905, p = 0.004) and housing quality (X24; t = 4.186, p = 0.000) differed significantly between groups of municipalities with high and low economic performance, suggesting that these aspects of infrastructure may play a role in differentiating economic outcomes. In 2021, while the Pearson correlations for X13 (r = 0.136, p = 0.074), X14 (r = −0.051, p = 0.508), and X24 (r = 0.030, p = 0.698) did not reach conventional levels of significance, the t-test results for road length (X13; t = 1.995, p = 0.048) and housing quality (X24; t = 2.333, p = 0.021) remained statistically significant, reinforcing the observation that municipalities with better infrastructure tend to exhibit stronger economic performance. By 2023, the Pearson correlation analysis showed a modest but statistically significant positive relationship between road length (X13; r = 0.185, p = 0.014) and water supply access (X14; r = 0.151, p = 0.047) with economic performance, although the correlation for housing quality (X24; r = 0.100, p = 0.189) was not significant. Furthermore, the t-test for road length (X13; t = 2.428, p = 0.016) confirmed significant differences between high and low-performing municipalities, while those for X14 and X24 were insignificant in 2023. Overall, these results suggest that specific dimensions of public infrastructure, particularly road development and housing quality, are linked to better economic outcomes, although the strength and significance of these relationships vary over time. This dual-method approach, combining Pearson correlation and t-test analyses, provides a comprehensive picture of the infrastructure–economic performance nexus, and aligns with the previous findings emphasizing the critical role of infrastructure in economic development [46,47,48].
Table 5.
Correlation and t-test results for economic performance and public infrastructure.
Hypothesis H3: Public spending and social stability
In testing H3, which posits that municipalities with higher per capita expenditures on education and health rank higher in overall socio-economic stability, our analysis employed both correlation and ordinary least squares (OLS) regression models. In 2019, the analysis revealed (Table 6) robust positive correlations between education expenditures (X18) and health expenditures (X19) with the TOPSIS-derived municipal performance score (r = 0.572, p < 1 × 10⁻¹⁰ and r = 0.545, p < 1 × 10⁻¹⁰, respectively), indicating that increased public spending in these areas is associated with enhanced socio-economic stability.
Table 6.
Correlation and regression analysis of education/health expenditures and TOPSIS scores.
The corresponding regression model for 2019, which explained 32.9% of the variance (R2 = 0.329), confirmed that education expenditures had a statistically significant positive effect on municipal performance (Table 7) (coef = 0.0055, p = 0.005), while the effect of health expenditures was not significant (coef = 0.0159, p = 0.476). These findings align with the literature emphasizing the critical role of education in fostering human capital and long-term economic growth [49,50,51]. By contrast, the 2021 results showed moderate positive correlations for both education (r = 0.259, p = 0.00056) and health expenditures (r = 0.335, p = 0.000006) with the TOPSIS score. However, the 2021 regression outcomes indicated that only health expenditures exerted a statistically significant impact (coef = 0.0467, p = 0.003), whereas education expenditures did not (coef = 0.0296, p = 0.408), suggesting a shift in the relative importance of these spending areas over time. By 2023, the correlation between education expenditures and municipal performance became weak and non-significant (r = 0.052, p = 0.495), while the correlation for health expenditures remained modest but significant (r = 0.163, p = 0.0319). The regression model for 2023, despite explaining only 3.1% of the variance (R2 = 0.031), confirmed a statistically significant positive effect of health expenditures (coef = 0.0310, p = 0.027), with education expenditures again showing no significant impact (coef = −0.0332, p = 0.369). Overall, these results suggest that, although higher public spending on education and health is generally associated with better socio-economic stability, the influence of these components varies over time, with health expenditures emerging as a more consistent predictor in recent years. The decline in the model’s explanatory power by 2023 also indicates that additional factors may have increasingly contributed to municipal socio-economic stability, warranting further investigation.
Table 7.
OLS regression results.
4. Discussion
The empirical evidence supports hypothesis H1, extending the previous findings by demonstrating that municipalities with higher economic vitality—characterized by elevated employment levels, salaries, and investment inflows—consistently exhibit significant associations with lower crime rates. Importantly, our analysis reveals that non-parametric correlation measures capture this inverse relationship more effectively than their parametric counterparts, underscoring the potential for complex, non-linear dynamics in the economic–crime nexus. This is particularly relevant in transitional economies, such as Serbia, where rapid economic changes can produce threshold effects or tipping points that linear models may overlook [26,27].
The observed persistence of strong negative Spearman’s coefficients across multiple years (e.g., −0.6462 in 2019, −0.6250 in 2021, and −0.5869 in 2023) for violent crime (X26) suggests that, as municipalities progress economically, there is a substantial and consistent reduction in severe criminal offenses, as indicated by these. This stability, despite potential confounding factors, like legislative changes or demographic shifts, underscores the robustness of the economic–crime relationship when examined through a non-linear lens. This also highlights that non-parametric approaches can effectively capture the complexity of these associations, which more restrictive, linear methodologies may mask.
Furthermore, our findings extend the prior research by demonstrating that the associated pattern between economic growth and public safety is not merely a linear function but likely involves more complex, context-specific mechanisms that non-parametric approaches can better capture [52,53]. This highlights the need for more nuanced policy responses that account for these dynamics, particularly in rapidly evolving regional economies. The Serbian case, characterized by its unique socio-economic structure and ongoing transition, provides a valuable testing ground for these more sophisticated analytical approaches, potentially informing broader regional policy debates.
Earlier research in criminology and urban economics has documented the protective association of economic growth with public safety, often citing enhanced employment, social cohesion, and investment in supportive social services as mediating factors [54], particularly in transitional economies where development disproportionately deters crime [55]. The current findings from Serbian municipalities align with these arguments and expand them, suggesting that robust local economies are associated with lower overall crime rates in a way that requires non-parametric modeling to capture fully. Indeed, similar patterns have been observed in other transitional economies, where local socio-economic development is associated with reduced violent and property crimes, reinforcing the broader applicability of our findings.
The results underscore that policies that foster economic growth, such as promoting local business investment, raising wage levels, or implementing targeted employment programs, may have beneficial associations for public safety. However, the observed weakening of the Pearson correlations in 2023 suggests that purely economic interventions may be insufficient to sustain long-term crime reductions. This highlights the need for a more comprehensive approach considering non-economic factors, such as community engagement, local governance, and demographic dynamics. Such findings reinforce the importance of non-linear analytical frameworks in capturing the complex, context-dependent interactions between economic development and public safety, which are often missing in traditional, linear models.
Subsequent studies should refine the measurement of municipal economic vitality and integrate additional control variables (e.g., educational attainment, policing strategies, or social welfare allocation) to discern the direction of the association more clearly. Longitudinal or panel-data analyses with lagged variables could further clarify whether rising economic performance is consistently associated with lower crime or whether the inverse, falling crime attracts local investment, is at play. Such expansions would deepen theoretical insights and provide actionable guidance for policymakers striving to strengthen socio-economic well-being and public safety in local jurisdictions. In addition, we note that the associations reported in this study should not be interpreted as evidence of direct causal effects; future research employing causal inference methods will be critical to understand the direction and mechanisms underlying these relationships.
The empirical results for hypothesis H2 highlight the nuanced role of public infrastructure in shaping municipal economic performance. Consistent with the prior research [56,57], the findings demonstrate that roads (X13) exert a growing and statistically significant association on local economic vitality over time. While the 2019 correlations revealed an insignificant relationship (r = −0.060, p = 0.432), the 2023 analysis showed a positive and significant coefficient (r = 0.185, p = 0.014), supported by t-tests indicating that municipalities with greater road density achieve markedly higher economic rankings (t = 2.428, p = 0.016). This temporal shift suggests that improvements in transportation infrastructure, such as extended road networks and better connectivity, may become associated with substantial economic benefits, likely by reducing transaction costs and expanding market access.
Water supply access (X14) reveals a more complex pattern, showing no significant link before 2023, with only a weak yet considerable correlation emerging in that year (r = 0.151, p = 0.047). Given that t-tests have largely yielded non-significant results for this indicator, it appears that the impact of water infrastructure on local economic performance may be more gradual, or contingent upon complementary investments such as sanitation or industrial facilities [58,59]. Over time, incremental enhancements in water supply systems may become more evident; however, during the study period, these improvements do not clearly distinguish high-performing municipalities from low-performing ones.
Housing quality (X24) initially exhibited a moderate positive correlation with economic vitality in 2019 (r = 0.267, p < 0.001), reinforced by strong t-test results. However, this effect diminished in subsequent years, possibly indicating a convergence in housing conditions across municipalities or a declining marginal return on housing improvements. As policymakers address fundamental housing deficiencies, other infrastructural aspects—particularly roads—may become more critical in shaping local economic prospects.
Overall, the dual approach of correlation analysis and t-tests confirms that infrastructure conditions are significantly associated with economic outcomes, although their effects differ by type and may change as regions develop. These findings emphasize the importance of sustained, targeted infrastructure strategies—especially in transportation—to promote lasting economic gains across Serbian municipalities.
The results for hypothesis H3 generally support the proposition that higher per capita expenditures on education and health are positively associated with municipal socio-economic performance. However, the strength of these relationships diminishes throughout this study. In 2019, education spending showed a strongly significant positive correlation with TOPSIS scores (r = 0.572, p < 1 × 10⁻¹⁰), and the OLS regression (R2 = 0.329) indicated that, holding other factors constant, an increase in education outlays was associated with substantial gains in overall municipal performance (β = 0.0055, p = 0.005). Health spending also exhibited a positive correlation (r = 0.545, p < 1 × 10⁻¹⁰), but its marginal effect in the regression was not statistically significant (β = 0.0159, p = 0.476). These findings align with the broader literature emphasizing the importance of human capital investment for stimulating economic growth and stability [51,60,61]. By 2021, while education spending maintained a positive correlation with municipal performance (r = 0.259, p = 0.0006), its effect in the OLS regression became statistically insignificant (β = 0.0296, p = 0.408). By contrast, health spending emerged as a significant predictor (β = 0.0467, p = 0.003), although in a model (R2 = 0.116) with lower explanatory power. These shifting dynamics may reflect changing policy priorities or the possibility that initial returns from investments in education had already plateaued, while additional health allocations continued to yield incremental benefits.
Most notably, by 2023, education expenditures had lost their positive impact (β = −0.0332, p = 0.369), while health spending maintained a modest but significant association (β = 0.0310, p = 0.027). The overall explanatory power of regression decreased to R2 = 0.031, indicating that neither education nor health spending alone was a powerful indicator of municipal performance. This loss of explanatory power may be due to the maturing of core public services, lower returns on some expenditures, or changes in local governance effectiveness. In summary, while initial investments in health and education may be critical to municipal stability in the short term, other complementary factors, such as infrastructure, institutional quality, and targeted economic policies, become more necessary over longer time frames.
5. Conclusions
This study assessed the connections between economic vitality and public safety, the role of public infrastructure in shaping municipal economic performance, and the impact of public spending on socio-economic stability in Serbian municipalities. Using a TOPSIS-based approach to rank municipal performance, along with various correlation and regression analyses, the findings provide nuanced support for each of the three hypotheses.
First, municipalities with higher economic vitality—measured through employment rates, average salaries, and investment levels—consistently reported lower crime rates, particularly in violent crimes. However, this study goes beyond confirming a general economic–crime link by demonstrating that this relationship is best captured through non-parametric methods, such as Spearman’s rank correlation coefficient. This approach reveals not just a monotonic model, but potentially non-linear, dynamic conventional parametric models may mask that. For instance, the persistently negative Spearman coefficients, even in the face of shifting economic conditions (e.g., post-pandemic recovery), indicate a more complex, threshold-driven interaction where the protective effects of economic growth on public safety only become significant once certain levels of employment and investment are achieved. These findings extend the earlier research by emphasizing the importance of regional context and local economic dynamics, suggesting that effective crime reduction strategies must be tailored to the specific economic conditions of each municipality.
The assessment of public infrastructure in Serbian regions found that improved road networks strongly correlate with better municipal economic performance, especially later in the study period. Roads boost growth by enhancing market access, lowering transport costs, and attracting investment—factors that increase employment and economic vitality, potentially creating a self-reinforcing development cycle. Further research could examine this link using traffic data, logistics efficiency, or spatial economic models.
By contrast, access to water showed mixed economic effects, possibly requiring complementary investments or longer timelines to yield benefits. Housing quality initially influenced economic outcomes but declined in significance, likely due to converging standards, policy changes, and demographic shifts, such as population decline, urban migration, and workforce aging. These trends reduce housing demand in smaller towns and shift economic growth toward infrastructure-reliant sectors, like logistics and services. Future studies might explore this further using demographic projections and migration data.
Initially, higher public spending on health and education improved socio-economic stability, with education spending being a strong predictor in 2019. Over time, however, the returns diminished—health spending maintained a steady link to municipal performance, while education’s impact declined. This likely reflects the COVID-19 pandemic’s influence, which heightened the importance of health care, and disrupted education through school closures, remote learning, and budget constraints. Pandemic-related shifts—like changes in labor participation, digitalization, and mental health—may have altered the roles of health and education spending in long-term development. Future research should examine these dynamics using data on health infrastructure, employment recovery, and demographics. The findings suggest that, while initial investments in health and education are beneficial, their lasting impact depends on factors like labor market conditions, workforce mobility, and human capital retention. In Serbia, where population decline and outmigration are significant issues, such spending may fall short unless paired with broader socio-economic strategies.
The results show that strong economic conditions boost public safety, while better infrastructure, especially transport, drives economic growth. These effects are evident even in a transitional economy like Serbia, where structural reforms, demographic shifts, and evolving institutions make public investment outcomes more variable. This highlights the need for policies tailored to such contexts, where infrastructure may have a more substantial economic impact than in developed economies. This study underscores the importance of non-linear, context-sensitive evaluations of public spending, given the complex, path-dependent nature of development in transitional settings. Future research should use detailed data to explore causal links, assess governance and institutional quality, and apply advanced econometric methods to understand better how municipalities can align economic growth, infrastructure, and public services for lasting socio-economic resilience.
Policy Recommendations for Government Bodies
Based on the findings of this study, the following recommendations are proposed for policymakers and local government representatives:
- Tailor economic development strategies to local conditions.
The evidence confirms that economic growth is associated with lower crime rates, but the relationship is non-linear and context-dependent. Governments should analyze local employment, salary, and investment data to target interventions where the potential for crime reduction is highest, especially in municipalities near critical thresholds in economic vitality.
- 2.
- Invest in transport infrastructure as a priority for regional growth.
Improved road networks are strongly linked to higher economic performance. Local and national authorities should prioritize transportation projects that enhance connectivity, market access, and logistics, especially in underdeveloped or geographically isolated municipalities.
- 3.
- Adopt a multi-sectoral approach for public service spending.
While health and education expenditures contribute to short-term socio-economic stability, their long-term impact may depend on labor market trends, mobility, and population structure. Governments should integrate spending on health, education, and economic initiatives with demographic and workforce development strategies to maximize sustained benefits.
- 4.
- Monitor and address regional disparities.
Given significant variation in municipalities’ economic outcomes, government bodies should regularly monitor key performance indicators across regions and align resources to municipalities displaying the most essential need or opportunity for improvement.
- 5.
- Use data-driven, non-linear analysis for policy design.
Consider implementing advanced, non-parametric, and panel-data techniques to understand local dynamics better and to assess policy impacts over time, improving the effectiveness of future programs.
These recommendations are designed to support municipal and national policymakers in formulating targeted, effective, and data-driven strategies for enhancing economic vitality, infrastructure, and public safety across Serbian municipalities.
6. Limitations/Future Work
- A key methodological limitation is the exclusive use of the entropy weight method, which, as a variance-based approach, may overemphasize highly dispersed indicators and under weigh more stable, policy-critical factors. While the entropy weight method offers objectivity and ease of replication, future research could benefit from combining data-driven and expert-based approaches to strengthen indicator relevance and analytical robustness further.
- This study employed the conventional TOPSIS method, using fixed ideal and anti-ideal reference points derived from the observed range of each indicator. While this enables consistent and objective comparisons across all municipalities in our dataset, it does not fully account for municipality-specific priorities, constraints, or policy contexts. Future work could enhance the contextual relevance of benchmarking by incorporating expert-informed or stakeholder-weighted reference values or by adapting “aspirational” targets tailored to the different typologies of the municipalities.
- A limitation of the TOPSIS method as applied in this study is the use of linear (Euclidean) distance and the implicit assumption of additivity among performance variables. This approach does not account for potential nonlinear interactions or conditional dependencies between economic, infrastructure, and security indicators. While we address some relationships through correlation and regression analysis, future research could improve upon this by applying nonlinear aggregation techniques or explicitly modeling indicator interactions, for example, through machine learning or advanced multicriteria integration frameworks.
- A limitation of our analysis is its reliance on correlational and cross-sectional methods, which do not support causal inference. The observed relationships between economic vitality, public safety, and municipal spending may be influenced by unobserved confounders or reciprocal causation (e.g., crime may affect economic vitality, not only the reverse). Future studies should apply causal inference approaches—such as fixed-effects panel models, instrumental variables, or natural experiments—to address endogeneity issues and omitted variable bias, thereby providing more substantial evidence for policy interventions.
- Although this study justifies the selection of entropy-weighted TOPSIS based on data structure and practical considerations, the potential benefits of alternative multicriteria assessment methods (e.g., DEA, PCA, regression-based scoring) deserve further investigation in future research.
- Using the entropy-weighted TOPSIS, while objective and transparent, may overemphasize indicators with high dispersion, and may not capture interactions or nonlinearities between variables. Although multi-year data were available, the analysis was conducted cross-sectionally for each year, and did not exploit the whole dynamic structure of the panel data to examine the changes within municipalities over time. Third, the reliance on correlation and regression techniques means that the relationships identified are associative and not necessarily causal; issues such as endogeneity and omitted variable bias may affect the interpretation of results.
Author Contributions
Conceptualization, A.W. and T.S.; methodology, A.W. and T.S.; software, A.W.; validation, A.W.; formal analysis, A.W. and T.S.; investigation, A.W. and T.S.; resources, A.W. and T.S.; data curation, A.W.; writing—original draft preparation, A.W. and T.S.; writing—review and editing, A.W. and T.S.; visualization, A.W. and T.S.; supervision, A.W. and T.S.; project administration, A.W. and T.S.; funding acquisition, A.W. and T.S. All authors have read and agreed to the published version of the manuscript.
Funding
This publication was co-financed: (1) 50% by the Faculty of Economics of the Poznan University of Life Sciences; (2) 50% from funds allocated for the scientific activities of the University of the National Education Commission in Krakow.
Institutional Review Board Statement
Not applicable.
Informed Consent Statement
Not applicable.
Data Availability Statement
The raw data supporting the conclusions of this article will be made available by the authors upon request.
Conflicts of Interest
The authors declare no conflicts of interest.
References
- Chen, S.; Hwang, C. Fuzzy Multiple Attribute Decision Making: Methods and Applications; Lecture Notes in Economics and Mathematical Systems; Springer: Berlin/Heidelberg, Germany, 1992; ISBN 978-0-387-54998-9. [Google Scholar]
- Hajduk, S.; Jelonek, D. A Decision-Making Approach Based on TOPSIS Method for Ranking Smart Cities in the Context of Urban Energy. Energies 2021, 14, 2691. [Google Scholar] [CrossRef]
- Pathan, A.I.; Girish Agnihotri, P.; Said, S.; Patel, D. AHP and TOPSIS Based Flood Risk Assessment—A Case Study of the Navsari City, Gujarat, India. Environ. Monit. Assess 2022, 194, 509. [Google Scholar] [CrossRef] [PubMed]
- Wątróbski, J.; Bączkiewicz, A.; Ziemba, E.; Sałabun, W. Sustainable Cities and Communities Assessment Using the DARIA-TOPSIS Method. Sustain. Cities Soc. 2022, 83, 103926. [Google Scholar] [CrossRef]
- Xun, X.; Yuan, Y. Research on the Urban Resilience Evaluation with Hybrid Multiple Attribute TOPSIS Method: An Example in China. Nat. Hazards 2020, 103, 557–577. [Google Scholar] [CrossRef]
- Raphael, S.; Winter-Ebmer, R. Identifying the Effect of Unemployment on Crime. J. Law Econ. 2001, 44, 259–283. [Google Scholar] [CrossRef]
- Sampson, R.J.; Wilson, W.J. Toward a Theory of Race, Crime, and Urban Inequality. In Crime and Inequality; Hagan, J., Peterson, R., Eds.; Stanford University Press: Stanford, UK, 1995; pp. 37–54. ISBN 978-1-5036-1555-7. [Google Scholar]
- Sharkey, P. Uneasy Peace: The Great Crime Decline, the Renewal of City Life, and the Next War on Violence, 1st ed.; W. W. Norton & Company, Incorporated: New York, NY, USA, 2018; ISBN 978-0-393-60960-8. [Google Scholar]
- Clemens, B.J.; de Ruud, M.; Gupta, S.; Keen, M. Inequality and Fiscal Policy; International Monetary Fund: Washington, DC, USA, 2015; ISBN 978-1-5135-6775-4. [Google Scholar]
- Lojanica, N. Government Expenditure and Government Revenue—The Causality on the Example of the Republic of Serbia; University of Primorska: Portoroz, Slovenia, 2015; pp. 79–90. [Google Scholar]
- Masten, I.; Grdović Gnip, A. Macroeconomic Effects of Public Investment in South-East Europe. J. Policy Model. 2019, 41, 1179–1194. [Google Scholar] [CrossRef]
- Zhao, D.-Y.; Ma, Y.-Y.; Lin, H.-L. Using the Entropy and TOPSIS Models to Evaluate Sustainable Development of Islands: A Case in China. Sustainability 2022, 14, 3707. [Google Scholar] [CrossRef]
- Mercado, C.; Li, H. Budget Performance Evaluation of Public Hospitals Based on Entropy-Weighted TOPSIS Model. Indones. J. Bus. Account. Manag. 2024, 7, 33–46. [Google Scholar] [CrossRef]
- Tan, Y.; Duan, X.; Zhou, Z. Research on the Evaluation of Municipal Infrastructure Level by Entropy Weight TOPSIS Method-Taking Hubei Province as an Example. In Proceedings of the 12th International Symposium on Project Management (ISPM2024), Beijing, China, 28–30 June 2024; Aussino Academic Publishing House (AAPH): Beijing, China, 2024; pp. 739–747. [Google Scholar]
- Zhang, X.; Zhang, Q.; Sun, T.; Zou, Y.; Chen, H. Evaluation of Urban Public Transport Priority Performance Based on the Improved TOPSIS Method: A Case Study of Wuhan. Sustain. Cities Soc. 2018, 43, 357–365. [Google Scholar] [CrossRef]
- Ozkaya, G.; Erdin, C. Evaluation of Smart and Sustainable Cities through a Hybrid MCDM Approach Based on ANP and TOPSIS Technique. Heliyon 2020, 6, e05052. [Google Scholar] [CrossRef]
- Stanković, J.; Džunić, M.; Džunić, Ž.; Marinković, S. A Multi-Criteria Evaluation of the European Cities’ Smart Performance: Eco-Nomic, Social and Environmental Aspects. Zb. Rad. Ekon. Fak. Rij. 2017, 35, 519–550. [Google Scholar] [CrossRef]
- Lee, E.H.; Prozzi, J.; Lewis, P.G.T.; Draper, M.; Kim, B. From Scores to Strategy: Performance-Based Transportation Planning in Texas. Eval. Program Plan. 2025, 111, 102611. [Google Scholar] [CrossRef] [PubMed]
- Lee, E.H. eXplainable DEA Approach for Evaluating Performance of Public Transport Origin-Destination Pairs. Res. Transp. Econ. 2024, 108, 101491. [Google Scholar] [CrossRef]
- Lee, E.H.; Lee, E. Iterative DEA for Public Transport Transfer Efficiency in a Super-Aging Society. Cities 2025, 162, 105957. [Google Scholar] [CrossRef]
- Andrews, R.; Boyne, G.A.; Walker, R.M. Subjective and Objective Measures of Organizational Performance: An Empirical Exploration. In Public Service Performance; Boyne, G.A., Meier, K.J., O’Toole., L.J., Jr., Walker, R.M., Eds.; Cambridge University Press: Cambridge, UK, 2006; pp. 14–34. ISBN 978-0-521-85991-2. [Google Scholar]
- Boyne, G.A. Sources of Public Service Improvement: A Critical Review and Research Agenda. J. Public Adm. Res. Theory 2003, 13, 367–394. [Google Scholar] [CrossRef]
- Glaeser, E.L.; Gottlieb, J.D. The Wealth of Cities: Agglomeration Economies and Spatial Equilibrium in the United States. J. Econ. Lit. 2009, 47, 983–1028. [Google Scholar] [CrossRef]
- Shannon, C.E. A Mathematical Theory of Communication. Bell Syst. Tech. J. 1948, 27, 379–423. [Google Scholar] [CrossRef]
- Hwang, C.-L.; Yoon, K. Multiple Attribute Decision Making; Lecture Notes in Economics and Mathematical Systems; Springer: Berlin/Heidelberg, Germany, 1981; Volume 186, ISBN 978-3-540-10558-9. [Google Scholar]
- Mukaka, M. A Guide to Appropriate Use of Correlation Coefficient in Medical Research. Malawi Med. J. 2012, 24, 69–71. [Google Scholar]
- Hauke, J.; Kossowski, T. Comparison of Values of Pearson’s and Spearman’s Correlation Coefficients on the Same Sets of Data. Quaest. Geogr. 2011, 30, 87–93. [Google Scholar] [CrossRef]
- Gravetter, F.J.; Wallnau, L.B. Statistics for the Behavioral Sciences, 10th ed.; Cengage Learning: Boston, MA, USA, 2017; ISBN 978-1-305-50491-2. [Google Scholar]
- Field, A. Discovering Statistics Using IBM SPSS Statistics, 5th ed.; SAGE Publications: Thousand Oaks, CA, USA, 2017; ISBN 978-1-5264-1952-1. [Google Scholar]
- Birinci, N.; Telatar, O.M. The Effect of Socio-Economic Variables on Public Sector Performance: An Empirical Analysis on Public Expenditure in Turkey. Marmara Üniversi-Tesi İktisadi İdari Bilim. Derg. 2020, 42, 202–222. [Google Scholar] [CrossRef]
- Onofrei, M.; Vatamanu, A.-F.; Vintilă, G.; Cigu, E. Government Health Expenditure and Public Health Outcomes: A Comparative Study among EU Developing Countries. Int. J. Environ. Res. Public Health 2021, 18, 10725. [Google Scholar] [CrossRef] [PubMed]
- Li, Z.; Luo, Z.; Wang, Y.; Fan, G.; Zhang, J. Suitability Evaluation System for the Shal-low Geothermal Energy Implementation in Region by Entropy Weight Method and TOPSIS Method. Renew. Energy 2022, 184, 564–576. [Google Scholar] [CrossRef]
- Zare Banadkouki, M.R. Selection of Strategies to Improve Energy Efficiency in Indus-try: A Hybrid Approach Using Entropy Weight Method and Fuzzy TOPSIS. Energy 2023, 279, 128070. [Google Scholar] [CrossRef]
- Govindan, K.; Rajendran, S.; Sarkis, J.; Murugesan, P. Multi Criteria Decision Making Approaches for Green Supplier Evaluation and Selection: A Literature Review. J. Clean. Prod. 2015, 98, 66–83. [Google Scholar] [CrossRef]
- Zhang, Y.; Zhang, Y.; Zhang, H.; Zhang, Y. Evaluation on New First-Tier Smart Cities in China Based on Entropy Method and TOPSIS. Ecol. Indic. 2022, 145, 109616. [Google Scholar] [CrossRef]
- Glaeser, E.L. Triumph of the City: How Our Greatest Invention Makes Us Richer, Smarter, Greener, Healthier, and Happier; Penguin Books: New York, NY, USA, 2012; ISBN 978-0-14-312054-4. [Google Scholar]
- Pike, A. Local and Regional Development, 2nd ed.; Routledge: Oxfordshire, UK, 2017; ISBN 978-1-138-78571-7. [Google Scholar]
- Florida, R.L. The Rise of the Creative Class, Paperback of the rev. ed.; Basic Books: New York, NY, USA, 2014; ISBN 978-0-465-04248-7. [Google Scholar]
- What Makes Cities More Productive? Evidence on the Role of Urban Governance from Five OECD Countries; OECD Regional Development Working Papers; OECD: Paris, France, 2014; Volume 2014/05.
- Glaeser, E.L.; Gottlieb, J.D. The Economics of Place-Making Policies. Brook. Pap. Econ. Act. 2008, 39, 155–253. [Google Scholar] [CrossRef]
- Duranton, G.; Turner, M.A. Urban Growth and Transportation. Rev. Econ. Stud. 2012, 79, 1407–1440. [Google Scholar] [CrossRef]
- Glaeser, E.; Ponzetto, G.A.M. Did the Death of Distance Hurt Detroit and Help New York? National Bureau of Economic Research: Cambridge, MA, USA, 2007; p. w13710. [Google Scholar]
- Rodríguez-Pose, A. The Revenge of the Places That Don’t Matter (and What to Do about It). Camb. J. Reg. Econ. Soc. 2018, 11, 189–209. [Google Scholar] [CrossRef]
- Kelly, M. Inequality and Crime. Rev. Econ. Stat. 2000, 82, 530–539. [Google Scholar] [CrossRef]
- Chalfin, A.; McCrary, J. Are U.S. Cities Underpoliced? Theory and Evidence. Rev. Econ. Stat. 2018, 100, 167–186. [Google Scholar] [CrossRef]
- Aschauer, D.A. Is Public Expenditure Productive? J. Monet. Econ. 1989, 23, 177–200. [Google Scholar] [CrossRef]
- Donaldson, D. Railroads of the Raj: Estimating the Impact of Transportation Infrastructure. Am. Econ. Rev. 2018, 108, 899–934. [Google Scholar] [CrossRef]
- Ivanová, E.; Masárová, J. Importance of Road Infrastructure in the Economic Development and Competitiveness. Ecoman 2013, 18, 263–274. [Google Scholar] [CrossRef]
- Grant, C. The Contribution of Education to Economic Growth; UK Department for International Development: London, UK, 2017.
- Hanushek, E.A. Economic Growth in Developing Countries: The Role of Human Capital. Econ. Educ. Rev. 2013, 37, 204–212. [Google Scholar] [CrossRef]
- Teixeira, A.A.C.; Queirós, A.S.S. Economic Growth, Human Capital and Structural Change: A Dynamic Panel Data Analysis. Res. Policy 2016, 45, 1636–1648. [Google Scholar] [CrossRef]
- Choe, J. Income Inequality and Crime in the United States. Econ. Lett. 2008, 101, 31–33. [Google Scholar] [CrossRef]
- Jędrzejczak-Gas, J.; Wyrwa, J.; Barska, A. Sustainable Energy Development and Sustainable Economic Development in EU Countries. Energies 2024, 17, 1775. [Google Scholar] [CrossRef]
- Fajnzylber, P.; Lederman, D.; Loayza, N. Inequality and Violent Crime. J. Law Econ. 2002, 45, 1–39. [Google Scholar] [CrossRef]
- Buonanno, P.; Drago, F.; Galbiati, R.; Zanella, G. Crime in Europe and the United States: Dissecting the ‘Reversal of Misfortunes’: CRIME. Econ. Policy 2011, 26, 347–385. [Google Scholar] [CrossRef]
- Chanda, C.R.; Hakim, M.M.; Ahmed, F. Transportation Infrastructure and Economic Growth: Empirical Insights from Bangladesh. J. Bus. 2023, 8, 1–15. [Google Scholar]
- Li, H.; Hu, T.; Ma, X.; Cheng, B. The Impact of Transportation Infrastructure on the Regional Economic Integration in China: A CGE Analysis. Int. Rev. Econ. Financ. 2025, 99, 104045. [Google Scholar] [CrossRef]
- Frone, S.; Frone, D.F. Challenges in Analyzing Correlation between Water Infrastructure and Economic Development. Procedia Econ. Financ. 2014, 10, 197–206. [Google Scholar] [CrossRef]
- Meeks, R.C. Water Works: The Economic Impact of Water Infrastructure. J. Human Resour. 2017, 52, 1119–1153. [Google Scholar] [CrossRef]
- Almutairi, N.T. Does Investment in Human Capital via Education Stimulate Economic Growth in an Oil-Rich Country? A Case Study of Saudi Arabia. J. Knowl. Econ. 2024, 15, 2933–2955. [Google Scholar] [CrossRef]
- Jaiyeoba, S. Human Capital Investment and Economic Growth in Nigeria. Afr. Res. Rev. 2015, 9, 30. [Google Scholar] [CrossRef]
Disclaimer/Publisher’s Note: The statements, opinions and data contained in all publications are solely those of the individual author(s) and contributor(s) and not of MDPI and/or the editor(s). MDPI and/or the editor(s) disclaim responsibility for any injury to people or property resulting from any ideas, methods, instructions or products referred to in the content. |
© 2025 by the authors. Licensee MDPI, Basel, Switzerland. This article is an open access article distributed under the terms and conditions of the Creative Commons Attribution (CC BY) license (https://creativecommons.org/licenses/by/4.0/).