Abstract
This study investigated carbon dynamics in a peach orchard subjected to three treatments with a mixed compost amendment (MCA, 35% organic content): a control with no amendment (A0), a full dose (A1, 10 t ha−1), and a half dose (A2, 5 t ha−1). The sustainability of MCA was assessed in terms of (i) potential and (ii) actual soil respiration, (iii) soil carbon and physical properties and (iv) fruit quality and yield. Carbon dioxide (CO2) emissions were measured both in the laboratory, by incubating soil samples without root removal, and in the field using static chambers. Observations spanned three growing seasons (2021–2023). A correlation was found between actual and potential soil respiration, with emission peaks occurring near the time of MCA application. Cumulative actual CO2 emissions amounted to 5.6, 12.0 and 9.4 t CO2 ha−1 for A0, A1 and A2, respectively. MCA application (i) increased microbial respiration, (ii) reduced soil physical characteristics, such as bulk density and water-filled pore space, and (iii) slightly improved fruit quality, although the yield was not significantly affected. Furthermore, the MCA enhanced soil organic carbon and total nitrogen content compared to the control. These results suggest that high organic content amendments, such as MCA, could represent a strategy to maintain or increase soil organic matter in a sustainable way, although MCA does not improve carbon emission efficiency.
1. Introduction
Soil management practices influence soil characteristics and play a crucial role in greenhouse gas (GHG) exchanges between agricultural soils and the atmosphere [,].
Among recommended sustainable soil practices, organic amendments (OAs) have a long-lasting impact on soil properties, with effects that may persist for centuries. These practices increase the levels of carbon (C), nitrogen (N), and phosphorus (P) more than natural systems, reduce soil bulk density, improve water-holding capacity, enhance aggregate stability, and promote nutrient availability for plants []. In addition, continuous OA inputs help maintain soil structure, support the physical stabilization of soil organic matter (SOM), increase microbial biomass and aggregate formation, and enhance the microbial community’s capacity to utilize various C sources, resulting in greater soil C storage [,].
OA application significantly affects soil porosity in the short term, as indicated by the water-filled pore space (WFPS) indicator [,]. Moreover, amended soils may contribute to improved weed and pest control due to enhanced nutrient competition and increased microbial activity []. While OA use, including mixed compost amendment (MCA), generally enhances soil health and functioning, it may also consistently influence soil respiration (SR) [], thereby affecting the seasonal carbon balance of crops. However, the capacity of OAs to enhance soil organic carbon sequestration remains a topic of debate. While some studies, such as that by Fontaine et al. [], reported that fresh C inputs can stimulate soil C decomposition, potentially resulting in a negative C balance [], other studies have found an increase in soil C sequestration following OA application [,].
The review by Thangarajan et al. [] showed that OAs influence the priming effect, nitrification and denitrification processes, and also increase SR (i) directly through CO2 released from the carbon in the amendment material, and (ii) indirectly by modifying soil properties. SR includes both autotrophic respiration (from plant roots) and heterotrophic respiration (from microbial biomass, labile organic matter, and anaerobic pathways) [,,]. The proportion of C respired by the root system is generally low, especially in tree crops, such as peach and apple, ranging from 1% to 15% of total fixed C [,]. Therefore, heterotrophic respiration in OA- or MCA-treated soils is partly driven by WFPS; as WFPS increases, soil aeration decreases, which in turn reduces the microbial respiration rate [], as reflected in measurements of potential basal respiration (PA) [,]. It is, thus, important to analyze the soil–atmosphere interface in amended soils in terms of both SR and PA [,,] and to investigate the relationships between these respiration variables and measurable soil properties [].
CO2 emissions from soils are typically assessed both in the field, using non-stationary gas exchange chambers [], which minimize flux estimation errors [], and in the laboratory, where microbial basal respiration is measured via incubation to (i) predict soil C mineralization rates [,], (ii) assess microbial biomass and activity, and (iii) quantify readily decomposable soil organic matter [].
OAs have been extensively studied in herbaceous cropping systems for several decades (see Aguilera et al. []; Thangarajan et al. []), while their effects in orchards have only recently been analyzed, with limited results, particularly under arid and semi-arid conditions []. Mediterranean regions characterized by dry climates are among the most vulnerable to the negative effects of increased CO2 emissions from agricultural soils to the atmosphere [,,]. Moreover, ongoing climate change, which alters precipitation patterns and heat accumulation in plants, requires a continual updating of knowledge on gas-exchange dynamics within the soil–canopy–atmosphere system [,,].
Peach (Prunus persica L.) is a major crop, cultivated on over 1,700,000 hectares worldwide, with Italy being the second-largest producer in Europe [], as the semi-arid Mediterranean climate is particularly favorable for late-ripening cultivars [].
This study investigated the application of mixed composted amendments at two different dosages, without the addition of other organic or inorganic fertilizers, in a peach orchard under Mediterranean conditions in southern Italy. We measured both potential and actual soil respiration, as well as carbon dynamics, to assess the effects of different compost amendment dosages on C storage in the orchard. In addition, we evaluated the impact of MCA on fruit yield and quality. To better understand the underlying soil processes and the sustainability potential of amendment-based practices, we also examined the influence of meteorological conditions and water balance.
2. Materials and Methods
2.1. Study Site and Experimental Design
The investigation was conducted over the 2021, 2022 and 2023 peach growing seasons (April to November) in southern Italy (Rutigliano, latitude: 40°59′, longitude: 17°02′) at the experimental farm managed by the Council for Agricultural Research and Economics (CREA). The experimental site is subject to a Mediterranean climate zone, characterized by hot, dry summers, with an average annual temperature of 15.7 °C and total annual precipitation of 535 mm, most of which occurs in autumn and late winter. The soil at the experimental site, prior to amendment application, is classified as fine, mixed, superactive, thermic Typic Haploxeralfs, with a clay loam texture. Its main characteristics are reported in Campi et al. []. Over the past 30 years, rainfall has been primarily concentrated during autumn and late winter, with a negligible amount during spring and summer []. Ongoing climate change is progressively altering local weather patterns during recent growing seasons, especially affecting precipitation distribution and increasing the frequency of extreme heat and rainfall events [,,].
The trial was carried out on an 8-year-old late-ripening peach orchard (cv. Red call), with trees spaced at 5.0 m × 5.0 m and irrigated using a drip irrigation system. Standard agricultural practices were applied throughout the study, and irrigation scheduling was optimized following FAO56 guidelines [].
A standard meteorological station (Tecno.el srl, Rome, Italy) located within the orchard continuously recorded precipitation, air temperature and humidity, global radiation, and wind speed and direction.
A mixed composted amendment was applied to the soil at two different dosages: 10 t ha−1 (A1) and 5 t ha−1 (A2). These treatments were compared to an unamended control (A0). The MCA product Evainfruit (Fertileva srl, Laterza, Italy) was applied at the beginning of the vegetative season and manually incorporated in the upper 5–10 cm of soil around the trees. The characteristics of the amendment are reported in Cappelluti et al. [].
The MCA was applied according to product availability, specifically on 12 April 2021, 26 April 2022, and 25 May 2023. In 2023, frequent rainfall occurred during April, delaying the application beyond the recommended period. Treatments were arranged in a randomized complete block design (RCBD) with three replicates. The quantities of C and N supplied were 2448.4 kg C ha−1 and 177.3 kg N ha−1 for A1, and 1224.2 kg C ha−1 and 88.6 kg N ha−1 for A2, respectively.
2.2. Soil Physics and Chemistry
Soil water content (SWC) in the surface layer was measured using the gravimetric method []. Soil samples were collected from three points for each treatment within a 1 m radius around the location of the soil collars used for measuring actual soil respiration via the chamber method.
Bulk density (BD) was determined as indicated by Castellini et al. [], at the same sampling locations used for SWC measurements.
The WFPS (%) was calculated according to the methodology described by Linn and Doran [] as follows:
where 2.65 g cm−3 was assumed as the particle density of mineral soil.
Given that soil respiration is a highly spatially localized process [,,], to correlate CO2 efflux with soil physical properties, BD and WFPS were measured concurrently with soil CO2 flux measurements. Soil samples were collected adjacent to the monitored chambers [].
Soil total nitrogen (N, g kg−1), total organic carbon (TOC, g kg−1) and water-extractable organic carbon (WEOC, mg kg−1) were measured following the standard procedures described in Ferrara et al. []. Samples were collected at depths of 0–15 cm, 15–30 cm and 30–45 cm, with three replicates per treatment. Complete profile sampling was performed around the MCA application dates and again in November each year. Additionally, samples from the uppermost soil layer (0–15 cm), the most affected by MCA, were collected bi-monthly throughout the three experimental seasons.
2.3. The Potential and Actual Respiration
Potential respiration (FCO2_p, gCO2 m−2), also referred to as the “mineralization rate of SOM”, was measured using the methodology suggested by Lagomarsino et al. []. Based on MCA application schedules, soil cores were collected during April, May, July, September, and November of 2021; in April, June, September, and November of 2022; and May, July, September, and November of 2023. A total of 9 undisturbed soil cores (each measuring 5 cm in diameter and height) were extracted using a sample ring kit (Eijkelkamp), with three replicates per treatment. The number and timing of sampling events varied slightly among the years mainly due to limitations and adverse weather conditions. However, sampling consistently covered the period between amendment application and the end of the growing season (typically in November), ensuring data comparability across seasons. Litter was removed to a depth of approximately 1 cm. Soil cores were analyzed immediately after collection to minimize decomposition of dead roots and to reduce the amount of root-derived CO2. This approach was adopted to preserve the roots–microbes–soil continuum in the short term to maintain the continuum plant–microbes–soil system. The undisturbed soil cores were incubated without root removal and placed in 1 L glass jars containing a vial with 4 mL of NaOH 1 M (FLUKA purity ≥ 98%). To maintain humidity and prevent soil desiccation, 4 mL of water acidified to pH 4.0 with HCl was added to the base of each jar.
Each jar was tightly sealed and placed in darkness in an incubation chamber at a constant temperature of 28 °C. Three jars containing NaOH (1 M) without soil samples served as controls. During incubation, the CO2 produced by the soil was absorbed by the NaOH solution, forming Na2CO3. The unreacted NaOH was later titrated using 0.1 M HCl 37% (CARLO ERBA, Milan, Italy). Soil respiration was measured after 1, 3, 7, 10, 14, 21, 28 and 35 days of incubation. At each measurement, the glass jar was opened, and the reaction between hydroxide and carbon dioxide was immediately halted by adding 8 mL of 0.75-N BaCl2 (FLUKA purity ≥ 99%, St. Gallen, Switzerland). The NaOH vial was then removed from the jar, and the excess NaOH was titrated with 0.1 M HCl using an automatic titrator system (CRISON Titro Matic 2S, Barcelona, Spain), with a target pH of 8.8. The C mineralization kinetics were determined following a first-order time model []:
where Cm represents the cumulative mineralized C over 35 days, C0 is the potentially mineralizable C, and k is the rate constant. The hourly CO2 evolution rate was used to estimate basal respiration once a steady-state condition was achieved, and the soil reached a relatively constant hourly CO2 production rate. Microbial C mineralization, referring to the microbial decomposition of SOM in bulk soil, was measured according to the definitions proposed by Kuzyakov [].
Actual CO2 respiration fluxes (FCO2_a, gCO2 m−2 d−1) were measured on a weekly to monthly basis, depending on the growing season and pedo-climatic conditions. Nine soil collars were installed in the experimental field, with three replicates per treatment. These measurements were carried out during the 2022 and 2023 growing seasons, as the temporary unavailability of measurement equipment under maintenance prevented the collection of field data in 2021.
The enclosure method developed by Parkinson [] was used to measure FCO2_a, following the protocol described by Ferrara et al. []. Briefly, FCO2_a was determined measuring the rate of increase in CO2 concentration within a chamber of known volume placed on the soil surface, using a portable analyser (ADC LCPro+, Bioscientific Ltd., Hoddesdon, UK). The chamber consisted of a PVC enclosure with a volume of 995 cm3. The collars were installed a few days before starting the CO2 flux measurements. Measurements were conducted between 10:00 a.m. and 12:00 p.m., when soil temperatures were expected to approximate daily average values. Soil temperature (Tsoil) was measured near each collar by using the sensor provided by the LCpro+ analyser.
Respiration measurements were evaluated in conjunction with soil physical parameters (bulk density, WFPS and temperature) recorded simultaneously, to explore environmental controls on CO2 fluxes.
2.4. Yield, Quality of Fruits and Carbon Emission Efficiency
For all growing seasons, harvesting was carried out during the first 10 days of September. At harvest, the following fruit quality parameters were evaluated: mean fruit weight (FW, g), total soluble solids (TSS, °Brix), flesh firmness (FF, kg cm−2), and percentage of red overcolour on the fruit skin (OC, %). Six fruits per tree were sampled from three replicates per treatment.
Yield (Y, t ha−1) was measured directly in the field. For 2021 and 2023, average yields for treatments A0, A1, and A2 were calculated from the total fruit weight harvested in the three plots per treatment. In 2022, a hailstorm near harvest time caused substantial fruit loss, necessitating a different approach to yield determination compared to 2021 and 2023. To estimate the 2022 yield, the weight of the limited harvested fruits was added to the weight of fallen fruits. The latter was calculated by multiplying the number of fallen fruits by the average fruit weight for the corresponding treatment.
Individual fruit weights were measured using a precision balance (±0.01 g). TSS was determined using a PAL-1 Digital Handheld Refractometer (Atago Co., Ltd., Tokyo, Japan), and values were expressed in °Brix. Flesh firmness was assessed using the FR-5120 Digital Fruit Firmness Tester (Lutron Electronics Co., Inc., Hyderabad, India) equipped with an 8 mm tip. The red overcolour percentage was visually assessed by the same operator, using a reference scale ranging from 0% to 100% red surface coverage [].
Given concerns that increased crop productivity may result in higher carbon emission during the growth cycle, the environmental performance of the adopted MCA treatments was quantified using “carbon emission efficiency” (CEE, kg biomass kg C-CO2−1), an indicator first introduced by Qin et al. [] and Hu et al. [] and further explored in subsequent studies [,]. CEE is expressed as follows:
2.5. Statistical Analysis
Statistical differences between treatments A0, A1 and A2 among all variables were calculated via one-way ANOVA and Tukey’s post hoc Test, when requirements were fulfilled. In cases where these assumptions were not fulfilled, the Kruskal–Wallis test and Wilcoxon rank sum test were employed. A correlation analysis was conducted among variables, utilizing both linear and exponential regression and calculating Pearson, Spearman and Kendall indexes. The Kendall index was chosen due to the presence of ties, non-Gaussian distributions, and non-linear relationships between variables.
A two-way ANOVA was conducted to evaluate the combined effects of treatment and year on the FCO2_p parameters, including cumulative microbial respiration (gCO2 m−2), hourly microbial respiration (µmol CO2 m−2 s−1), 24 h soil respiration (Resp 24h, gC CO2 m−2), C0 and k.
For the FCO2_a variable, a natural logarithmic transformation was applied to investigate and reach normality.
The statistical analyses were performed using the R statistical software, version 4.3.1 (R Development Core Team, http://www.r-project.org. Last accessed 15 September 2024).
3. Results
3.1. Meteorological Conditions
Meteorological conditions on a daily scale over the three-year study period are reported in Figure 1, depicting air temperature (Ta, °C) and precipitation (P, mm). The paths of these variables followed the standard trends for the region. Mean annual air temperatures were similar across the three years (16 °C in 2021 and 2022, 17 °C in 2023). However, cumulative precipitation varied significantly; the 2022 growing season was notably dry, while 2021 and 2023 showed precipitation levels broadly in line with the 20-year historical average. In 2023, two extreme precipitation events were recorded, with over 33 mm and 26 mm of rainfall falling in short periods on May 15th and August 5th, respectively. Additionally, a severe hailstorm on 19 August 2022, severely reduced the yield of marketable fruits during the second growing season.
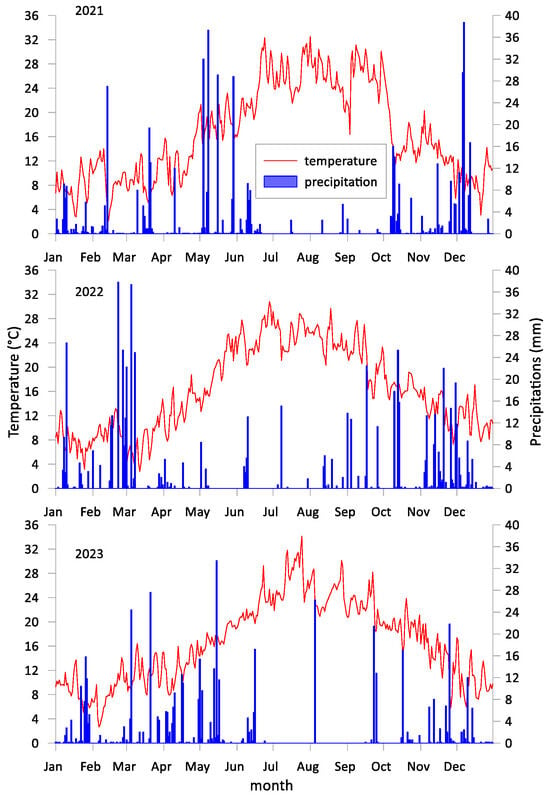
Figure 1.
Meteorological conditions, including daily air temperature and precipitation, for the years 2021, 2022, and 2023.
3.2. Soil Physics and Chemistry
The differences among the mean SWC in the surface layer across the three treatments were not significant during any of the seasons.
The amendment’s effect on the peach orchard, particularly in terms of improving soil carbon dynamics, was evaluated by analyzing TOC and WEOC patterns over time and at various soil depths. In particular, total N, TOC and WEOC along the soil profiles are illustrated in Figure 2a, 2b and 2c, respectively, for all available measurements and treatments.
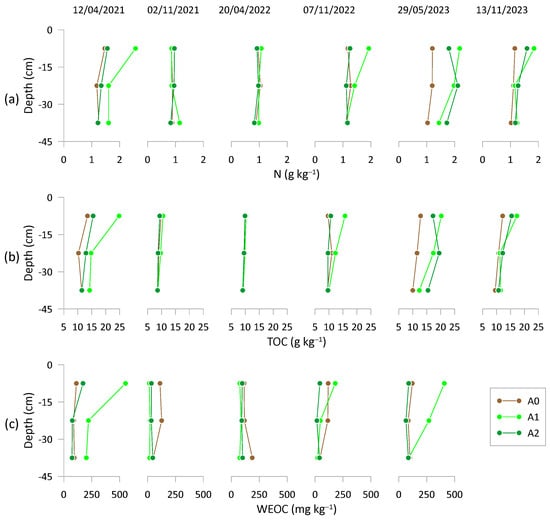
Figure 2.
(a) Nitrogen (N), (b) total organic content (TOC) and (c) water-extractable organic carbon (WEOC) content at three depts (0–15 cm; 15–30 cm; 30–45 cm) across the three treatments: A0 = control; A1 = full dosage of soil amendment; A2 = half dosage of soil amendment. The sampling dates are reported at the top of the Figure (dd/mm/yyyy).
Significant differences in total N across soil depths were observed only in treatment A1 (p < 0.05), with a decrease from the uppermost to the lower soil layer.
By the end of the experimental trial, total soil N exhibited an average increase across the entire profile in treatments A1 and A2, by 28.9% and 17.7%, respectively, in comparison to the control A0. This suggests a cumulative increase in N content due to the addition of MCA over the three consecutive years.
The TOC along soil depths was significantly different (p < 0.05) for treatments A1 and A2, with concentrations decreasing from surface to deeper layers. By the end of the trial, treatments A1 and A2 recorded average increases of 15.7% and 17.2%, respectively, across the entire profile, compared to A0.
Measurements of WEOC along the soil profile (Figure 2c) did not show any significant differences among treatments, with the exception of the first (12 April 2021) and last (29 May 2023) sampling events. In these cases, substantial differences were observed in the surface layer, likely due to the proximity of the sample points to the MCA incorporation sites []. On these dates, the coefficient of variation was highest in treatment A1 (92%), followed by A2 (73%) and A0 (3%). In 2021, the highest mean value across the entire profile was recorded for treatment A1 (325.1 mg kg−1) compared to A2 (107.4 mg kg−1) and A0 (98.1 mg kg−1). This feature remained evident during the third MCA application in May 2023. The mean WEOC values across the entire profile for the three treatments were 255.5, 535.5, and 101.5 mg kg−1 for A1, A2, and A0, respectively.
The time evolution of TOC and WEOC in the surface layer (0–15 cm) is reported in Figure 3, with TOC in the upper panel and WEOC in the bottom panel. MCA application dates are also indicated for each season. The TOC content in A1 was significantly higher than in A2 and A0. The TOC pattern for A2 displayed intermediate values between A1 and the control A0, with both treatments showing constant and similar patterns. In all three seasons, TOC trends in A1 and A2 followed a similar pattern, increasing from the day of application and peaking several weeks later. Notably, during the first season, the effect of MCA diminished after the summer, while in the second year, the effect remained pronounced. In particular, the TOC level in A0 remained nearly constant throughout the seasons (11.4 ± 1.3, 10.3 ± 0.7, 11.8 ± 1.2 g kg−1, for 2021, 2022, 2023, respectively), while in the treatments with MCA, it exhibited a bell-shaped trend, with increases during the warmer months followed by a decrease towards A0 levels in early autumn. Starting from the second season, TOC levels in both A1 (21.3 ± 6.5, 14.7 ± 3.2, 22.5 ± 5.4 g kg−1) and A2 (14.5 ± 3.2, 11.7 ± 1.7, 17.6 ± 2.3 g kg−1) remained above A0.
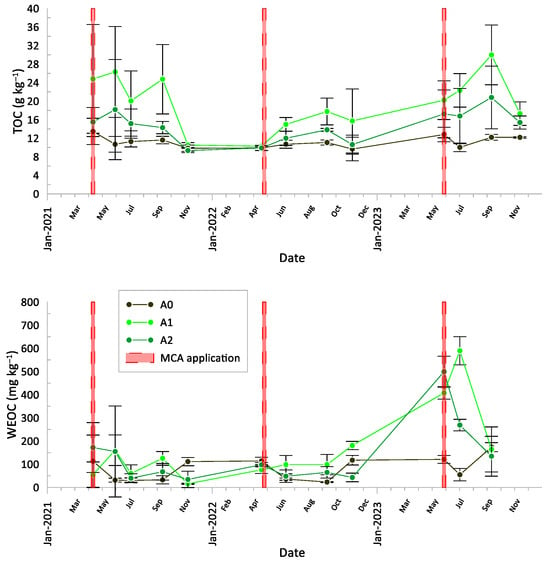
Figure 3.
Total organic carbon (TOC) and water-extractable organic carbon (WEOC) content in the surface layer (0–15 cm) throughout the experimental period. The dates of MCA application are also reported. A0 = control; A1 = full dosage of soil amendment; A2 = half dosage of soil amendment.
Although WEOC values did not show significant differences among treatments (p < 0.05) during the first year of the experiment and showed partial differences during the second year, the third season showed marked differences among treatments. In particular, WEOC values for A1 were significantly higher than those for A2 and A0, with A2 showing intermediate values between A1 and A0.
3.3. The Potential and the Actual Respiration Dynamics
Figure 4 illustrates the patterns of cumulative FCO2_p, along with MCA application dates, precipitations, and irrigation events. Over the years, an increase in FCO2_p was observed in the amended treatments, while the control A0 showed almost constant values. The maximum values for the amended treatments (A1, A2) were recorded in June of the first year, several weeks after the MCA application. In contrast, during the second and third years, peaks were reached on the first sampling day following the application. In the first year, the MCA effect diminished rapidly after June, when potential respiration followed a plateau with values close to zero until the next MCA application. Across the three years, the minimum FCO2_p values for A1 and A2 were recorded in September. Conversely, the control (A0) shows substantially low constant values of potential CO2 fluxes throughout all years, with the highest cumulative C value registered in November, except for 2021, when the peak occurred in September.
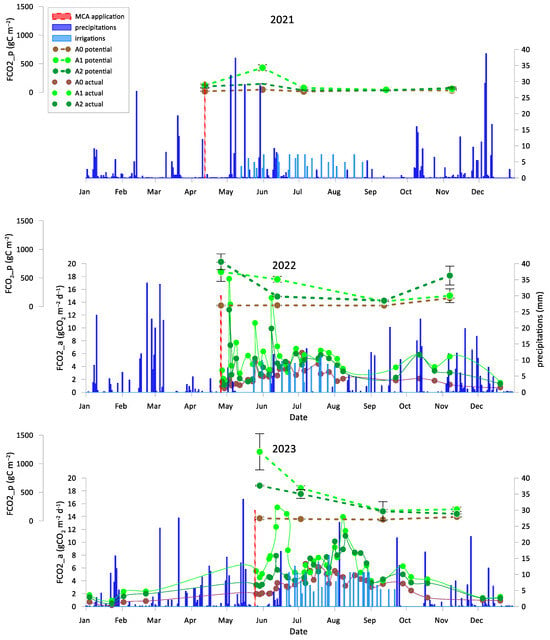
Figure 4.
Cumulative potential CO2 (FCO2_p), actual CO2 fluxes (FCO2_a), precipitation, and irrigation events across the three experimental seasons. FCO2_a was measured only during 2022 and 2023. A0 = control; A1 = full dosage of soil amendment; A2 = half dosage of soil amendment.
All intermediate values of cumulative microbial soil respiration between the first and last measurements (from April to November) are illustrated in Appendix A (Figure A1, Figure A2, Figure A3 for 2021, 2022 and 2023, respectively) indicating the coherent increase in microbial respiration for A1 and A2, while the control exhibited a relatively constant pattern for FCO2_p throughout the incubation period. The 2022 hail event affected production and introduced a significant amount of fresh organic matter (fallen fruit) to the soil surface. This sudden influx of labile carbon may have stimulated microbial activity, temporarily affecting soil respiration and carbon mineralization. As shown in Figure A2, the cumulative microbial soil respiration recorded in November is the highest of the three-year period. Similarly, Figure A4, Figure A5 and Figure A6 in the Appendix A illustrate all available patterns of hourly values during the different steps of microbial respiration measurements (from April to November) (µmolCO2 m−2 s−1) for each year. Table A1 in Appendix B summarizes the statistical data for (i) the means of cumulative microbial respiration (gCO2 m−2), (ii) hourly microbial respiration (µmol CO2 m−2 s−1), (iii) respiration during the first 24 h (Resp 24h, gC CO2 m−2), (iv) potentially mineralizable carbon (C0), and (v) the carbon mineralization rate constant (k). Results showed that amended treatments (A1 and A2) tended to have statistically greater values than A0 across all variables, with more pronounced differences observed around the amendment period and in November. As reported by Franzluebbers et al. [], the size and activity of the labile soil carbon vary seasonally, and agricultural practices and residues can modify the pool of active soil carbon. Significant differences in all microbial respiration variables were observed among treatments (A0, A1, A2), while annual differences were significant for Resp 24h and C0. The interaction between treatment and year was significant only for C0. These results suggest that microbial activity and soil carbon mineralization are influenced by both treatment type and annual pedo-climatic conditions.
The patterns of actual CO2 fluxes on a daily scale are also reported in Figure 4. A comparison with potential respiration patterns is available only for the second and third seasons. Amendment application increased CO2 emissions in both years, with a greater effect observed in the full-dose treatment (A1). The overall trend of the phenomenon is characterized by a peak of CO2 fluxes shortly after the amendment application, followed by a gradual decline as the amendment’s efficacy diminishes over time. This trend was occasionally interrupted by small peaks caused by precipitation and irrigation events.
Regarding the relationships between the soil chemical properties (TOC and WEOC) and soil carbon dynamics expressed in terms of potential soil respiration, significant linear relationships (p < 0.05) were found among all available data; in particular, the total seasonal potential respiration was correlated to the seasonal mean TOC (r2 = 0.35) and WEOC (r2 = 0.47).
As soil respiration is influenced by environmental physical characteristics, such as soil water content and temperature [,,,], these relationships were further explored. The relationships between FCO2_p and Tsoil are reported in Figure 5 for all treatments, using all available measurements and including standard deviations. In all cases, soil respiration increased with rising soil temperature, and the best-fitting model was an exponential function, which was highly significant for both the initial value and the exponent. At equal soil temperature, amended soils emitted more CO2, with emission levels increasing with the amount of amendment applied (A1 > A2 > A0). Notably, spring soil temperature data for 2023 were unavailable due to the amendment being used in early summer. The lower r2 value for treatments A1 and A2, compared to A0, showed greater variability in the processes occurring in amended soils.
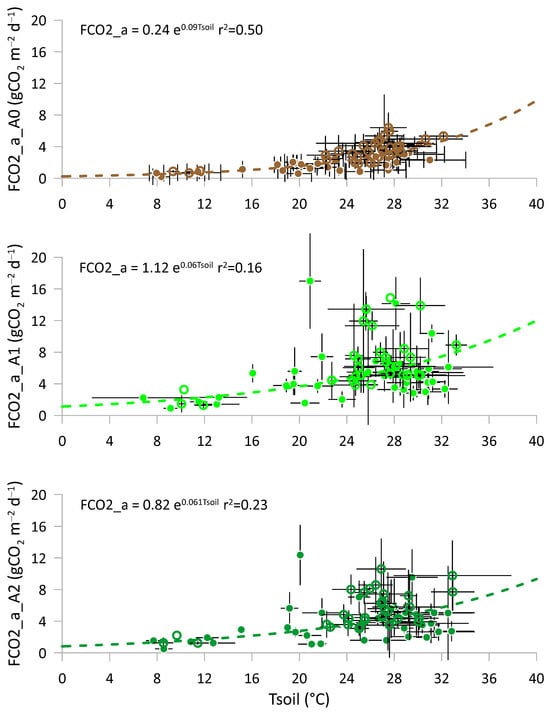
Figure 5.
Relationships between the actual CO2 fluxes (FCO2_a) and soil temperature (Tsoil) for the three treatments: full symbols represent 2022, and empty symbols represent 2023. A0 = control; A1 = full dosage of soil amendment; A2 = half dosage of soil amendment.
The relationships between CO2 emissions and the WFPS are illustrated in Figure 6 for all treatments and available data. Standard deviations were omitted for clarity. Soil respiration and WFPS values ranged between 0.032 and 6.625 gCO2 m−2 d−1, and between 0.4% and 24.0%, respectively. For treatments A1 and A2, CO2 fluxes increased to a threshold of approximately 20%, followed by a brief plateau and subsequent decrease. The relationships between CO2 fluxes and WFPS followed a Gaussian-like shape; however, the best-fitting function was a second-degree polynomial. In the control treatment A0, the increase in CO2 emissions with WFPS was less evident, while the A1 amended soils emitted more CO2 than A2 for the same WFPS value, demonstrating that MCA addition promotes microbial activity. The Gaussian response observed in amended soils, compared to the nearly flat response in the control, suggests that soil amendments not only increase the availability of degradable carbon but also modify the soil’s moisture response, promoting peak carbon mineralization at intermediate WFPS levels. Zhang [] reported that higher WFPS positively correlates with increased mineralization rates attributable to the combined effect of enhanced solute movement, increased microbial activity, and improved nutrient availability.
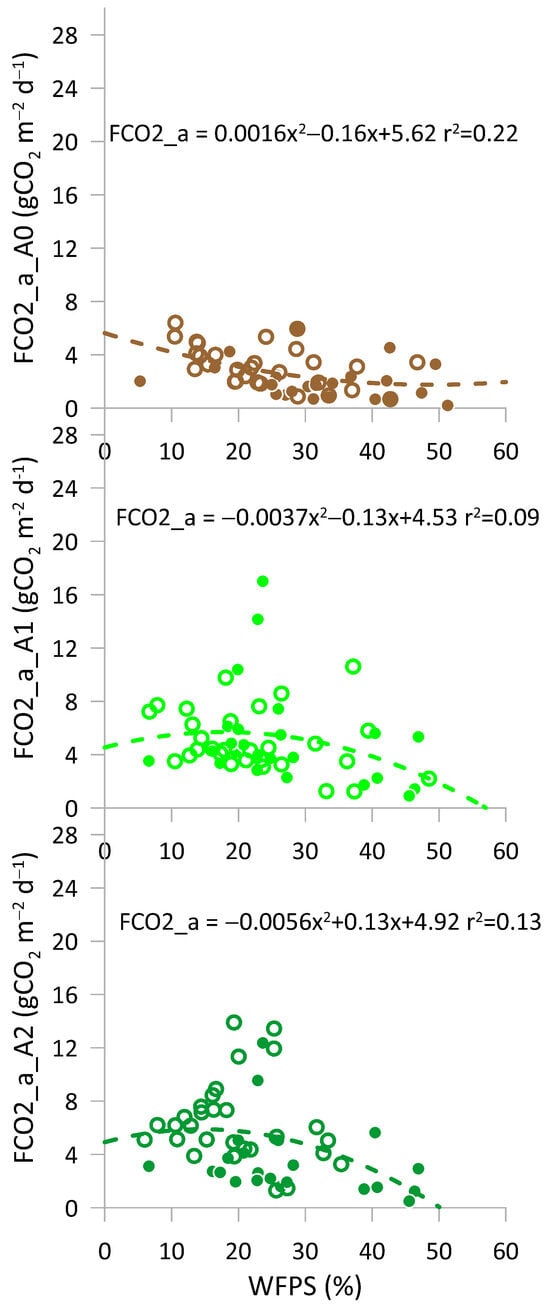
Figure 6.
Relationships between the actual CO2 fluxes (FCO2_a) and WFPS for the three treatments: full symbols represent 2022, and empty symbols represent 2023. A0 = control; A1 = full dosage of soil amendment; A2 = half dosage of soil amendment.
Significant differences (p < 0.05) were observed in bulk density, showing the effect of amendments (Figure 7). Specifically, BD values were lower with a higher amount of applied MCA. This reduction in BD also affects WFPS values in the same direction (see Equation (1)); hence, given that SWC did not change following MCA application, WFPS decreased as the amount of MCA increased.
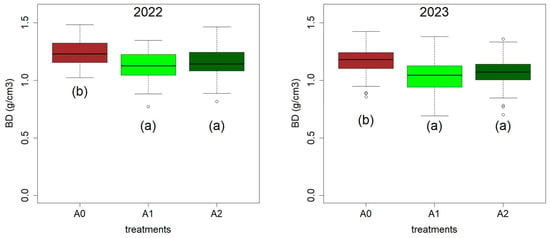
Figure 7.
Bulk density (BD) during 2022 and 2023 for the three treatments: A0 = control; A1 = full dosage of soil amendment; A2 = half dosage of soil amendment. Different letters indicate a significant difference (p-value < 0.05).
3.4. Yield and Quality of Fruits and Carbon Emission Efficiency
Table 1 presents the yields detected during the three-year analysis period for the three treatments. In 2021, although treatment A1 demonstrated a lower yield compared to A0 and A2, this difference was not statistically significant. Similarly, in 2022 and 2023, no significant differences in yield were observed among treatments, although the amended treatments exhibited higher yields in both years. In 2022, treatments A1 and A2 led to yield increases of approximately 11% and 14%, respectively, compared to the control (A0). By 2023, the yield increases for A1 rose to 31%, while A2 showed a slightly lower increase of 18% relative to the control. These results highlight the positive cumulative impact of the amendments on yield, although the magnitude of this effect varied between the two years. There was a highly significant effect of year on yield, suggesting that environmental conditions or other annual factors strongly influenced yields across all treatments.

Table 1.
Cumulated actual CO2 emission, yield and carbon emission efficiency (CEE) during all experimental years for the three treatments: A0 = control; A1 = full dosage of soil amendment; A2 = half dosage of soil amendment. Different letters show a significant difference (p-value < 0.05).
In general, treatments with amendments exhibited better qualitative performance. This improvement could be attributed to the qualitative responses being related to the applied amendment dose, suggesting that increasing the dosage or using the amendment in synergy with other orchard management practices might further enhance the qualitative outcomes [,,]. A summary of the three-year means of quality parameters is illustrated in Table 2. Treatments (Trt) significantly affected the average values of quality parameters (FW, FF, TSS), except for OC, suggesting that MCA application mainly influenced fruit quality traits rather than soil organic carbon content in the short term. Year had a highly significant effect (p < 0.001) on all measured variables, including fruit fresh weight, flesh firmness, total soluble solids, and organic carbon, indicating strong climatic or seasonal influences. The interaction between year and treatment (Year × Trt) was significant only for OC, indicating that the effect of the amendment on organic carbon varied significantly between years, possibly due to differences in weather conditions or amendment dynamics.

Table 2.
Three-year average of the effects of amendment treatments on yield (t ha−1) and quality: Treatment (Trt), overcolour (OC %), fresh weight (FW, g), firmness (FF, kg cm−2), and total soluble solids (TSS, °Brix). Different letters indicate a significant difference (p-value < 0.05).
As shown in Table 1 and Table 2, CO2 emissions were higher for treatment A1, followed by A2, and lowest in the control A0. A2 produced the highest yield, followed by A1. This yield increase was not sufficient to improve carbon emission efficiency. The lowest carbon emission efficiency was recorded for A1, followed by A2, while the control A0 demonstrated the best environmental performance.
4. Discussion
Soil chemical analyses revealed that treatment A1 was the most effective in enhancing N, TOC, and WEOC contents throughout the soil profile and over time, with a particularly pronounced effect in the surface layer (0–15 cm). As described by Franzluebbers [], this pattern reflects high soil quality, associated with strong vertical stratification of carbon and nitrogen, indicative of a relatively undisturbed and organically enriched system with stable organic matter. In our data, the effect of MCA was progressive and became more evident after the first year, with increasing accumulation of organic matter in the topsoil layer. According to Srinivasan et al. [], such stratification is typical of organically amended and minimally disturbed soils, where stable forms of total C and N dominate. The high initial decomposition rate of MCA (Figure 4) likely reflects the presence of readily available C from easily decomposable C compounds in the mixed amendment [,], further amplified by a cumulative effect relative to the first year. In general, the low-moderate increase observed in FCO2_p throughout the experimental period (see Figure 4) was likely due to a resurgence of microbial activity, which can be attributed to multiple factors, including precipitation events that affect soil moisture content [] and the incorporation of crop residues, which may stimulate C mineralization [,]. This increase was also likely linked to the fresh biomass from fallen leaves and fruit residues [], a factor that was particularly prominent in 2022, when a significant hailstorm on August 19th caused almost all the fruits to fall, leading to their subsequent decomposition on the soil surface. Zhang et al. [] and Liyanage et. al. [] observed that the addition of fresh organic inputs or nutrient-enriched amendments significantly increased microbial activity and CO2 fluxes, highlighting their role in stimulating short-term carbon mineralization and improving soil health indicators.
Amended treatments exhibited in all cases transpiration peaks followed by latency periods, sometimes followed by additional peaks, supporting the findings of Bernal et al. [], Fernández et al. [] and Zhang et al. [].
Differences in microbial activity and soil carbon mineralization among control and treatments, especially in the months of amendment application and in November, can be attributed to a phenomenon known as the “priming effect”. This phenomenon refers to the increased soil mineralization rate following the addition of organic matter. In the first instance, the increased mineralization rate can be directly attributable to the application of the amendment, whereas the increase in November is due to the decomposition of crop residues, such as leaves and fruits, present in the soil [,].
The water supplied by irrigation and precipitation seemed to have a triggering effect on FCO2_a (see Figure 4), suggesting a higher microorganism growth due to increased soil moisture, which, in combination with high temperatures, creates optimal conditions for microbial development [,,]. This phenomenon is particularly evident in 2023, where significant precipitation on August 5th led to a second peak in actual CO2 emissions. A rapid increase in carbon mineralization was observed immediately after soil rewetting, validating the Birch effect [].
The comparison between FCO2_a and FCO2_p (see Figure 4) reveals a clear correlation between these two variables: one directly measured in the field, accounting for the actual SWC and temperature conditions, and the other obtained under controlled SWC and temperature conditions, with emission peaks occurring around the MCA application.
MCA application enhances microbial activity and carbon mineralization by modifying the soil’s moisture response, as evidenced by a Gaussian-like relationship between CO2 fluxes and WFPS in amended treatments. Peak respiration occurred at intermediate WFPS levels, highlighting improved carbon availability and biological activity. Additionally, bulk density significantly decreased with increasing MCA rates, indirectly reducing WFPS due to unchanged SWC, thus confirming the structural improvement of the soil []. These findings demonstrate the synergistic effect of organic amendments on both physical and biological soil functions []. Cumulated CO2 emissions (Table 2) were significantly higher in amended treatments, particularly in A1, indicating enhanced microbial activity. However, despite increased yields, CEE decreased, suggesting lower carbon use efficiency due to disproportionate CO2 losses relative to biomass production. Mdlambuzi et al. [] and Lamptey et al. [] observed that while organic amendments can stimulate CO2 emissions through increased microbial activity, this does not always result in proportional yield increases, thereby reducing CEE in the short term.
Regarding crop performance, our findings demonstrate that multiple years of amendment application are needed to observe significant differences in yield and quality. This supports previous results by Montanaro et al. [] and Baldi et al. [], who reported greater yield stability and quality improvements in amended soils over time.
5. Conclusions
The study showed that the use of an amendment with high organic content (35%) could represent a sustainable strategy to maintain or even increase soil organic content, thereby contributing to improved soil quality and offering potential for climate change mitigation. The observed increase in TOC and WEOC, particularly in the surface layer, confirms the amendment’s role in promoting carbon accumulation and microbial activity. Furthermore, amended soils subjected to drying and rewetting cycles may experience both the priming effect and the Birch effect simultaneously, potentially leading to a greater increase in carbon mineralization and CO2 release than if these effects occurred in isolation. This could have implications for soil management and the carbon cycle, particularly in arid climates or agricultural systems where organic amendments are employed.
Increasing the number of application cycles and implementing targeted irrigation management may be necessary to fully assess the effects of amendments. Additionally, the minimal differences observed between the two amendment dosages suggest that a lower quantity can still yield satisfactory performance, which could enhance the cost effectiveness and environmental sustainability of amendment practices.
From an environmental point of view, the application of MCA does not support an improvement of carbon emission efficiency, which remains the highest for the non-amended soil. This underlines the need for further long-term studies to evaluate the trade-offs between agroecosystem sustainability, soil fertility enhancement and greenhouse gas emissions.
Author Contributions
Conceptualization: R.M.F. and G.R.; Methodology: R.M.F., G.R., M.R.B. and M.P.; Investigation: R.M.F., G.R., M.R.B., M.P., C.V., M.M., A.A. and A.C.; Formal analysis: R.M.F., G.R., M.R.B. and M.P.; Writing—original draft preparation: M.R.B., G.R. and R.M.F.; Writing—review and editing: R.M.F., M.R.B., G.R. and A.A. All authors have read and agreed to the published version of the manuscript.
Funding
This study was funded and carried out within the Italian project “Water4AgriFood, Miglioramento delle produzioni agroalimentari mediterranee in condizioni di carenza di risorse idriche”, PNR 2015–2020, Area Agrifood, funded by MIUR, PON ARS01_00825-DD n. 1619 del 9 agosto 2019 “Ricerca e Innovazione” 2014–2020.
Institutional Review Board Statement
Not applicable.
Informed Consent Statement
Not applicable.
Data Availability Statement
Data are available upon request to the authors. Pictures and descriptions of the equipment used are also available upon request.
Acknowledgments
The authors are grateful to Nicola Sanitate for managing all the agricultural field operations, and Gabriele De Carolis for the supervision of the study. Funding acquisition by Marcello Mastrorilli and Pasquale Campi.
Conflicts of Interest
The authors have no competing interests to declare that are relevant to the content of this article.
Abbreviations
The following abbreviations are used in this manuscript:
| BD | Bulk Density |
| C | Carbon |
| C0 | Potentially Mineralizable C |
| CEE | Carbon Emission Efficiency |
| Cm | Cumulative Mineralized C |
| CO2 | Carbon Dioxide |
| EC | Electrical Conductivity |
| FCO2_a | Actual Respiration Fluxes |
| FCO2_p | Potential Respiration Fluxes |
| GHG | Greenhouse Gas |
| FF | Flesh Firmness |
| FW | Fruit Weight |
| k | Rate Constant |
| MCA | Mixed Compost Amendment |
| N | Nitrogen |
| OA | Organic Amendments |
| OC | Overcolour |
| P | Phosphorus |
| PA | Potential Basal Respiration |
| Resp 24h | Soil Respiration during the first 24 h |
| SOC | Soil Organic Carbon |
| SOM | Soil Organic Matter |
| SR | Soil Respiration |
| SWC | Soil Water Content |
| TOC | Total Organic Carbon |
| Trt | Treatment |
| TSS | Total Soluble Solids |
| WEOC | Water-Extractable Organic Carbon |
| WFPS | Water- Filled Pore Space |
| Y | Yield |
Appendix A
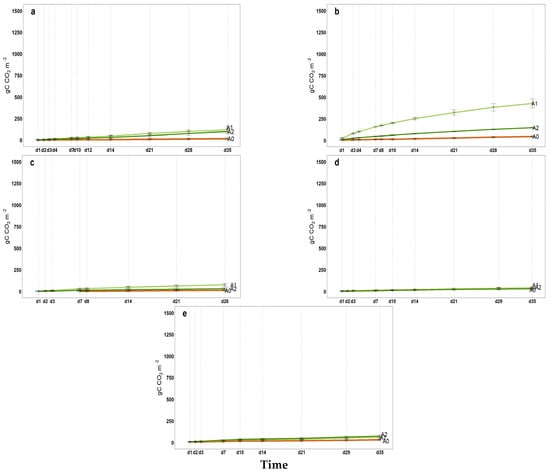
Figure A1.
2021 Cumulated microbial soil respiration (gC CO2 m−2) in 35 incubation days; (a) April, (b) May, (c) July, (d) September, (e) November, A0 = control; A1 = full dosage of soil amendment; A2 = half dosage of soil amendment.
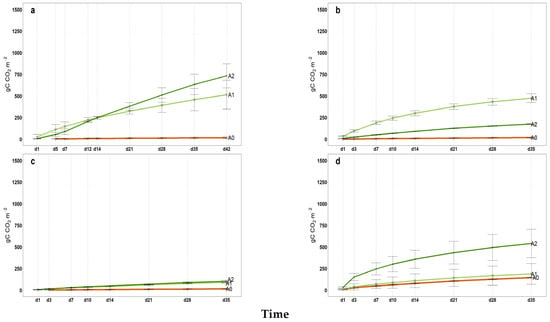
Figure A2.
2022 Cumulated microbial soil respiration (gC CO2 m−2) in 35 incubation days (42d for April); (a) April, (b) June, (c) September, (d) November, A0 = control; A1 = full dosage of soil amendment; A2 = half dosage of soil amendment.
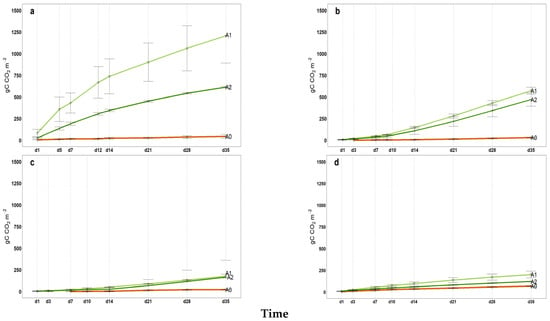
Figure A3.
2023 Cumulated microbial soil respiration (gC CO2 m−2) in 35 incubation days; (a) May, (b) July, (c) September, (d) November, A0 = control; A1 = full dosage of soil amendment; A2 = half dosage of soil amendment.
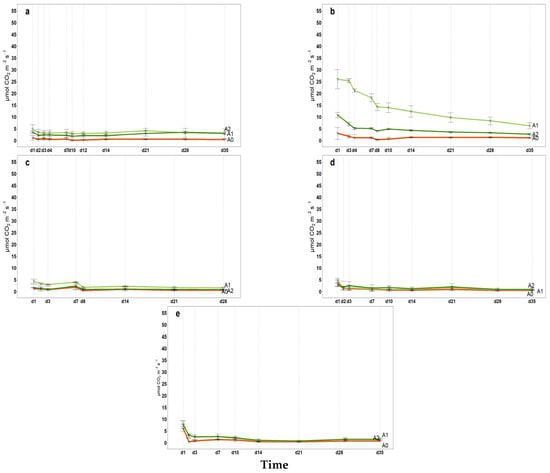
Figure A4.
2021 Hourly microbial soil respiration (µmol CO2 m−2 s−1) in 35 incubation days; (a) April, (b) May, (c) July, (d) September, (e) November, A0 = control; A1 = full dosage of soil amendment; A2 = half dosage of soil amendment.
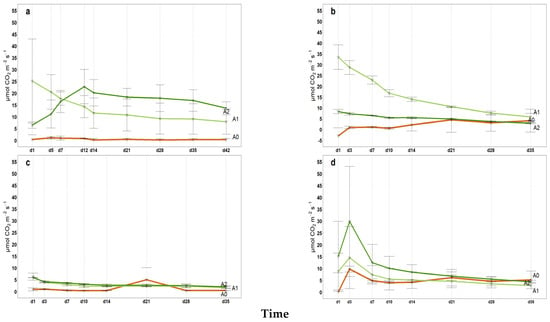
Figure A5.
2022 Hourly microbial soil respiration (µmol CO2 m−2 s−1) in 35 incubation days (42d for April); (a) April, (b) June, (c) September, (d) November, A0 = control; A1 = full dosage of soil amendment; A2 = half dosage of soil amendment.
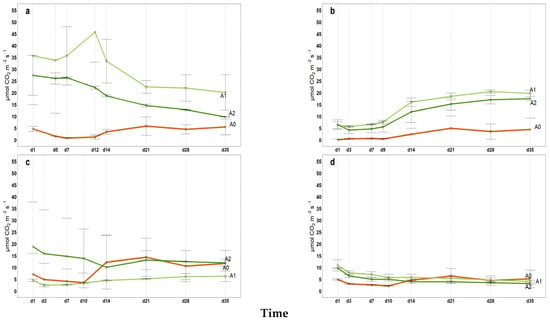
Figure A6.
2023 Hourly microbial soil respiration (µmol CO2 m−2 s−1) in 35 incubation days; (a) May, (b) July, (c) September, (d) November, A0 = control; A1 = full dosage of soil amendment; A2 = half dosage of soil amendment.
Appendix B

Table A1.
Statistics for: (i) the means of cumulative microbial respiration (gCO2 m−2), (ii) hourly microbial respiration (µmol CO2 m−2 s−1), (iii) respiration during the first 24 h (Resp 24h, gC CO2 m−2), (iv) potentially mineralizable carbon (C0), and (v) the carbon mineralization rate constant (k).
| Year | Month | Treatment | Mean Cumulated Microbial SR | Mean Hourly Microbial SR | Resp 24h | C0 | k |
|---|---|---|---|---|---|---|---|
| 2021 | April | A0 | 6.39 b | 0.48 c | 1.18 c | 54.39 c | 0.01 c |
| A1 | 43.24 a | 3.35 a | 5.15 a | 160.60 a | 0.02 b | ||
| A2 | 32.10 ab | 2.53 b | 3.66 b | 88.41 b | 0.03 a | ||
| May | A0 | 18.36 b | 1.30 b | 3.11 c | 173.20 c | 0.008 c | |
| A1 | 212.85 a | 15.55 a | 27 a | 505.70 a | 0.05 a | ||
| A2 | 68.51 b | 5.05 b | 11.21 b | 199 b | 0.03 b | ||
| July | A0 | 4.24 b | 0.93 b | nd | nd | nd | |
| A1 | 34.56 a | 2.72 a | 4.90 a | 102.7 a | 0.05 a | ||
| A2 | 14.49 ab | 1.20 b | 1.67 b | 46.3 b | 0.04 b | ||
| September | A0 | 20.04 c | 1.11 | 3.85 b | 42.90 c | 0.04 a | |
| A1 | 160.28 a | 1.55 | 4.95 a | 66.26 a | 0.03 b | ||
| A2 | 106.39 b | 1.68 | 2.83 c | 54.70 b | 0.02 c | ||
| November | A0 | 16.49 | 1.33 | 6.42 c | 31.19 c | 0.07 a | |
| A1 | 30.66 | 2.53 | 8.40 b | 61.83 b | 0.06 b | ||
| A2 | 36.36 | 2.48 | 8.79 a | 82.90 a | 0.05 c | ||
| 2022 | April | A0 | 8.37 b | 0.85 b | 0.37 b | 25.65 b | 0.02 b |
| A1 | 323.98 a | 16.96 a | 25.20 a | 750.80 a | 0.03 a | ||
| A2 | 330.55 a | 16.90 a | nd | nd | nd | ||
| June | A0 | 11.39 b | 10.93 ab | 1.64 c | 41.57 c | 0.02 c | |
| A1 | 260.33 a | 17.01 a | 33.47 a | 518.70 a | 0.06 a | ||
| A2 | 81.46 b | 5.23 b | 8.41 b | 257.80 b | 0.03 b | ||
| September | A0 | 26.57 | 2.07 | 0.95 c | 142.3 c | 0.01 c | |
| A1 | 43.42 | 2.97 | 5.95 b | 144.2 b | 0.3 a | ||
| A2 | 47.15 | 3.13 | 6.33 a | 160.9 a | 0.02 b | ||
| November | A0 | 83.76 b | 5.12 b | 8.54 c | 208 c | 0.04 c | |
| A1 | 117.93 ab | 18.11 ab | 8.79 b | 260 b | 0.05 b | ||
| A2 | 190.03 a | 22.07 a | 15.12 a | 374 a | 0.06 a | ||
| 2023 | May | A0 | 23.08 b | 7.17 c | 4.68 c | 66.16 c | 0.03 c |
| A1 | 681.85 a | 31.13 a | 35.63 a | 1393.00 a | 0.05 a | ||
| A2 | 327.79 b | 19.77 b | 27.41 b | 852.50 b | 0.03 b | ||
| July | A0 | 10.01 | 2.08 b | −0.55 c | nd | nd | |
| A1 | 155.71 | 12.86 a | 8.05 a | nd | nd | ||
| A2 | 196.51 | 10.35 a | 6.51 b | nd | nd | ||
| September | A0 | 7.78 | 8.60 b | 7.19 a | nd | nd | |
| A1 | 64.46 | 4.40 c | 4.61 c | nd | nd | ||
| A2 | 53.6 | 13.90 a | 5.47 b | nd | nd | ||
| November | A0 | 34.16 b | 4.18 | 4.87 c | 100.90 c | 0.03 a | |
| A1 | 97.81 a | 6.45 | 10.90 a | 359.80 a | 0.02 b | ||
| A2 | 60.47 ab | 5.1 | 9.73 | 189.20 b | 0.03 b | ||
| Trt | p-value | 2.57 × 10⁻¹¹ *** | 5.51 × 10⁻¹¹ *** | 3.02 × 10⁻⁸ *** | 4.49 × 10⁻⁷ *** | 0.0101 * | |
| Year | p-value | 4.17 × 10⁻⁸ *** | 1.15 × 10⁻¹⁴ *** | 1.23 × 10⁻⁵ *** | 2.30 × 10⁻⁹ *** | 0.2529 | |
| Trt × Year | p-value | 0.000483 *** | 0.0567 | 0.0183 * | 5.69 × 10⁻⁵ *** | 0.9775 |
Different letters indicate a significant difference (p-value < 0.05); nd. Not detected; statistically significant difference codes: 0 ‘***’, 0.01 ‘*’.
References
- Paustian, K.; Six, J.; Elliott, E.; Hunt, H. Management options for reducing CO2 emissions from agricultural soils. Biogeochemistry 2000, 48, 147–163. [Google Scholar] [CrossRef]
- Ussiri, D.A.; Lal, R. Long-term tillage effects on soil carbon storage and carbon dioxide emissions in continuous corn cropping system from an alfisol in Ohio. Soil Tillage Res. 2009, 104, 39–47. [Google Scholar] [CrossRef]
- Coyne, M.; Zhai, Q.; Mackown, C.; Barnhisel, R.J.S.b. Gross nitrogen transformation rates in soil at a surface coal mine site reclaimed for prime farmland use. Soil Biol. Biochem. 1998, 30, 1099–1106. [Google Scholar] [CrossRef]
- Guo, Z.; Han, J.; Li, J.; Xu, Y.; Wang, X.J.P.O. Effects of long-term fertilization on soil organic carbon mineralization and microbial community structure. PLoS ONE 2019, 14, e0211163. [Google Scholar]
- Liu, Z.; Rong, Q.; Zhou, W.; Liang, G. Effects of inorganic and organic amendment on soil chemical properties, enzyme activities, microbial community and soil quality in yellow clayey soil. PLoS ONE 2017, 12, e0172767. [Google Scholar] [CrossRef]
- Linn, D.M.; Doran, J.W. Effect of water-filled pore space on carbon dioxide and nitrous oxide production in tilled and nontilled soils. Soil Sci. Soc. Am. J. 1984, 48, 1267–1272. [Google Scholar] [CrossRef]
- Grave, R.A.; da Silveira Nicoloso, R.; Cassol, P.C.; Aita, C.; Corrêa, J.C.; Dalla Costa, M.; Fritz, D.D. Short-term carbon dioxide emission under contrasting soil disturbance levels and organic amendments. Soil Tillage Res. 2015, 146, 184–192. [Google Scholar] [CrossRef][Green Version]
- Briceño, G.; Palma, G.; Durán, N. Influence of organic amendment on the biodegradation and movement of pesticides. Crit. Rev. Environ. Sci. Technol. 2007, 37, 233–271. [Google Scholar] [CrossRef]
- Aguilera, E.; Lassaletta, L.; Gattinger, A.; Gimeno, B.S. Managing soil carbon for climate change mitigation and adaptation in Mediterranean cropping systems: A meta-analysis. Agric. Ecosyst. Environ. 2013, 168, 25–36. [Google Scholar] [CrossRef]
- Fontaine, S.; Bardoux, G.; Abbadie, L.; Mariotti, A. Carbon input to soil may decrease soil carbon content. Ecol. Lett. 2004, 7, 314–320. [Google Scholar] [CrossRef]
- Adani, F.; Tambone, F.; Genevini, P. Effect of compost application rate on carbon degradation and retention in soils. Waste Manag. 2009, 29, 174–179. [Google Scholar]
- Ryals, R.; Silver, W.L. Effects of organic matter amendments on net primary productivity and greenhouse gas emissions in annual grasslands. Ecol. Appl. 2013, 23, 46–59. [Google Scholar] [CrossRef] [PubMed]
- Thangarajan, R.; Bolan, N.S.; Tian, G.; Naidu, R.; Kunhikrishnan, A. Role of organic amendment application on greenhouse gas emission from soil. Sci. Total Environ. 2013, 465, 72–96. [Google Scholar] [CrossRef] [PubMed]
- Mäkiranta, P.; Minkkinen, K.; Hytönen, J.; Laine, J. Factors causing temporal and spatial variation in heterotrophic and rhizospheric components of soil respiration in afforested organic soil croplands in Finland. Soil Biol. Biochem. 2008, 40, 1592–1600. [Google Scholar] [CrossRef]
- Suleau, M.; Moureaux, C.; Dufranne, D.; Buysse, P.; Bodson, B.; Destain, J.-P.; Heinesch, B.; Debacq, A.; Aubinet, M. Respiration of three Belgian crops: Partitioning of total ecosystem respiration in its heterotrophic, above- and below-ground autotrophic components. Agric. For. Meteorol. 2011, 151, 633–643. [Google Scholar] [CrossRef]
- Rana, G.; Palatella, L.; Scanlon, T.M.; Martinelli, N.; Ferrara, R.M. CO2 and H2O flux partitioning in a Mediterranean cropping system. Agric. For. Meteorol. 2018, 260, 118–130. [Google Scholar] [CrossRef]
- Bravo, K.; Toselli, M.; Baldi, E.; Marcolini, G.; Sorrenti, G.; Quartieri, M.; Marangoni, B. Effect of organic fertilization on carbon assimilation and partitioning in bearing nectarine trees. Sci. Hortic. 2012, 137, 100–106. [Google Scholar] [CrossRef]
- Tomè, E.; Ventura, M.; Folegot, S.; Zanotelli, D.; Montagnani, L.; Mimmo, T.; Tonon, G.; Tagliavini, M.; Scandellari, F. Mycorrhizal contribution to soil respiration in an apple orchard. Appl. Soil Ecol. 2016, 101, 165–173. [Google Scholar] [CrossRef]
- Badia, D.; Alcañiz, J. Basal and specific microbial respiration in semiarid agricultural soils: Organic amendment and irrigation management effects. Geomicrobiol. J. 1993, 11, 261–274. [Google Scholar] [CrossRef]
- Boonman, J.; Hefting, M.M.; van Huissteden, C.J.; van den Berg, M.; van Huissteden, J.; Erkens, G.; Melman, R.; van der Velde, Y. Cutting peatland CO2 emissions with water management practices. Biogeosciences 2022, 19, 5707–5727. [Google Scholar] [CrossRef]
- Ferrara, R.M.; Mazza, G.; Muschitiello, C.; Castellini, M.; Stellacci, A.M.; Navarro, A.; Lagomarsino, A.; Vitti, C.; Rossi, R.; Rana, G. Short-term effects of conversion to no-tillage on respiration and chemical-physical properties of the soil: A case study in a wheat cropping system in semi-dry environment. Ital. J. Agrometeorol. 2017, 1, 47–58. [Google Scholar]
- Memoli, V.; De Marco, A.; Baldantoni, D.; De Nicola, F.; Maisto, G. Short-and long-term effects of a single application of two organic amendments. Ecosphere 2017, 8, e02009. [Google Scholar] [CrossRef]
- Livingston, G. Enclosure-based measurement of trace gas exchange: Applications and sources of error. In Biogenic Trace Gases: Measuring Emissions from Soil and Water; Blackwell Science Ltd.: Oxford, UK, 1994; pp. 14–17. [Google Scholar]
- Healy, R.W.; Striegl, R.G.; Russell, T.F.; Hutchinson, G.L.; Livingston, G.P. Numerical Evaluation of Static-Chamber Measurements of Soil—Atmosphere Gas Exchange: Identification of Physical Processes. Soil Sci. Soc. Am. J. 1996, 60, 740–747. [Google Scholar] [CrossRef]
- Davidson, E.; Galloway, L.; Strand, M. Assessing available carbon: Comparison of techniques across selected forest soils. Commun. Soil Sci. Plant Anal. 1987, 18, 45–64. [Google Scholar] [CrossRef]
- Sikora, E.; Gupta, S.; Kossowski, J. Soil temperature predictions from a numerical heat-flow model using variable and constant thermal diffusivities. Soil Tillage Res. 1990, 18, 27–36. [Google Scholar] [CrossRef]
- Józefowska, A.; Pietrzykowski, M.; Woś, B.; Cajthaml, T.; Frouz, J. Relationships between respiration, chemical and microbial properties of afforested mine soils with different soil texture and tree species: Does the time of incubation matter. Eur. J. Soil Biol. 2017, 80, 102–109. [Google Scholar] [CrossRef]
- Baldi, E.; Cavani, L.; Margon, A.; Quartieri, M.; Sorrenti, G.; Marzadori, C.; Toselli, M. Effect of compost application on the dynamics of carbon in a nectarine orchard ecosystem. Sci. Total Environ. 2018, 637, 918–925. [Google Scholar] [CrossRef]
- Bregaglio, S.; Mongiano, G.; Ferrara, R.M.; Ginaldi, F.; Lagomarsino, A.; Rana, G. Which are the most favourable conditions for reducing soil CO2 emissions with no-tillage? Results from a meta-analysis. Int. Soil Water Conserv. Res. 2022, 10, 497–506. [Google Scholar] [CrossRef]
- Ferrara, R.M.; Campi, P.; Muschitiello, C.; Leogrande, R.; Vittorio Vonella, A.; Ventrella, D.; Rana, G. Soil respiration during three cropping cycles of durum wheat under different tillage conditions in a Mediterranean environment. Soil Use Manag. 2022, 38, 1547–1563. [Google Scholar] [CrossRef]
- Katerji, N.; Rana, G.; Ferrara, R.M. Actual evapotranspiration for a reference crop within measured and future changing climate periods in the Mediterranean region. Theor. Appl. Climatol. 2017, 129, 923–938. [Google Scholar] [CrossRef]
- Rana, G.; Muschitiello, C.; Ferrara, R.M. Analysis of a precipitation time series at monthly scale recorded in Molfetta (south Italy) in the XVIII century (1784–1803) and comparisons with present pluviometric regime. Ital. J. Agrometeorol. 2016, 21, 23–30. [Google Scholar]
- Shelia, V.; Hansen, J.; Sharda, V.; Porter, C.; Aggarwal, P.; Wilkerson, C.J.; Hoogenboom, G. A multi-scale and multi-model gridded framework for forecasting crop production, risk analysis, and climate change impact studies. Environ. Model. Softw. 2019, 115, 144–154. [Google Scholar] [CrossRef]
- FAOSTAT. FAO. 2020. World Food and Agriculture—Statistical Yearbook 2020; Food and Agriculture Organization of the United Nations: Rome, Italy, 2020. [Google Scholar]
- Morandi, B.; Manfrini, L.; Losciale, P.; Zibordi, M.; Corelli-Grappadelli, L. The positive effect of skin transpiration in peach fruit growth. J. Plant Physiol. 2010, 167, 1033–1037. [Google Scholar] [CrossRef] [PubMed]
- Campi, P.; Mastrorilli, M.; Stellacci, A.M.; Modugno, F.; Palumbo, A.D. Increasing the effective use of water in green asparagus through deficit irrigation strategies. Agric. Water Manag. 2019, 217, 119–130. [Google Scholar] [CrossRef]
- Katerji, N.; Mastrorilli, M.; Rana, G. Water use efficiency of crops cultivated in the Mediterranean region: Review and analysis. Eur. J. Agron. 2008, 28, 493–507. [Google Scholar] [CrossRef]
- Ferrara, R.M.; Bruno, M.R.; Campi, P.; Camposeo, S.; De Carolis, G.; Gaeta, L.; Martinelli, N.; Mastrorilli, M.; Modugno, A.F.; Mongelli, T. Water use of a super high-density olive orchard submitted to regulated deficit irrigation in Mediterranean environment over three contrasted years. Irrig. Sci. 2024, 42, 57–73. [Google Scholar] [CrossRef]
- Rana, G.; De Carolis, G.; Gaeta, L.; Ruggieri, S.; Ferrara, R.M. Decoupling factor, aerodynamic and canopy conductances of a hedgerow olive orchard under Mediterranean climate. Theor. Appl. Climatol. 2023, 153, 349–365. [Google Scholar] [CrossRef]
- Allen, R.G.; Pereira, L.S.; Raes, D.; Smith, M. Crop Evapotranspiration-Guidelines for Computing Crop Water Requirements—FAO Irrigation and Drainage Paper 56; FAO: Rome, Italy, 1998; Volume 300, p. D05109. [Google Scholar]
- Cappelluti, O.; Bruno, M.R.; Modugno, A.F.; Ferrara, R.M.; Gaeta, L.; De Carolis, G.; Campi, P. The Use of Mixed Composed Amendments to Improve Soil Water Content and Peach Growth (Prunus persica (L.) Batsch) in a Mediterranean Environment. Water 2023, 15, 1708. [Google Scholar] [CrossRef]
- Mastrorilli, M.; Katerji, N.; Rana, G.; Nouna, B.B. Daily actual evapotranspiration measured with TDR technique in Mediterranean conditions. Agric. For. Meteorol. 1998, 90, 81–89. [Google Scholar] [CrossRef]
- Castellini, M.; Fornaro, F.; Garofalo, P.; Giglio, L.; Rinaldi, M.; Ventrella, D.; Vitti, C.; Vonella, A.V. Effects of no-tillage and conventional tillage on physical and hydraulic properties of fine textured soils under winter wheat. Water 2019, 11, 484. [Google Scholar] [CrossRef]
- Reichstein, M.; Bednorz, F.; Broll, G.; Kätterer, T. Temperature dependence of carbon mineralisation: Conclusions from a long-term incubation of subalpine soil samples. Soil Biol. Biochem. 2000, 32, 947–958. [Google Scholar] [CrossRef]
- Reichstein, M.; Beer, C. Soil respiration across scales: The importance of a model–data integration framework for data interpretation. J. Plant Nutr. Soil Sci. 2008, 171, 344–354. [Google Scholar] [CrossRef]
- Reichstein, M.; Rey, A.; Freibauer, A.; Tenhunen, J.; Valentini, R.; Banza, J.; Casals, P.; Cheng, Y.; Grünzweig, J.M.; Irvine, J. Modeling temporal and large-scale spatial variability of soil respiration from soil water availability, temperature and vegetation productivity indices. Glob. Biogeochem. Cycles 2003, 17, 1104. [Google Scholar] [CrossRef]
- Lagomarsino, A.; De Angelis, P.; Moscatelli, M.C.; Grego, S. The influence of temperature and labile C substrates on heterotrophic respiration in response to elevated CO2 and nitrogen fertilization. Plant Soil 2009, 317, 223–234. [Google Scholar] [CrossRef]
- Riffaldi, R.; Saviozzi, A.; Levi-Minzi, R. Carbon mineralization kinetics as influenced by soil properties. Biol. Fertil. Soils 1996, 22, 293–298. [Google Scholar] [CrossRef]
- Kuzyakov, Y. Sources of CO2 efflux from soil and review of partitioning methods. Soil Biol. Biochem. 2006, 38, 425–448. [Google Scholar] [CrossRef]
- Parkinson, K. An improved method for measuring soil respiration in the field. J. Appl. Ecol. 1981, 18, 221–228. [Google Scholar] [CrossRef]
- Layne, D.R.; Jiang, Z.; Rushing, J.W. Tree fruit reflective film improves red skin coloration and advances maturity in peach. HortTechnology 2001, 11, 234–242. [Google Scholar] [CrossRef]
- Qin, B.; Han, S.S. Planning parameters and household carbon emission: Evidence from high-and low-carbon neighborhoods in Beijing. Habitat Int. 2013, 37, 52–60. [Google Scholar] [CrossRef]
- Hu, F.; Zheng, X. Carbon emission of energy efficient residential building. Procedia Eng. 2015, 121, 1096–1102. [Google Scholar] [CrossRef]
- Wu, M.; Zhang, Y.; Ji, Y.; Liu, G.; Liu, C.; She, W.; Sun, W. Reducing environmental impacts and carbon emissions: Study of effects of superfine cement particles on blended cement containing high volume mineral admixtures. J. Clean. Prod. 2018, 196, 358–369. [Google Scholar] [CrossRef]
- Yang, X.; Liu, Y.; Bezama, A.; Thrän, D. Agricultural carbon emission efficiency and agricultural practices: Implications for balancing carbon emissions reduction and agricultural productivity increment. Environ. Dev. 2024, 50, 101004. [Google Scholar] [CrossRef]
- Brown, S.; Cotton, M. Changes in soil properties and carbon content following compost application: Results of on-farm sampling. Compost. Sci. Util. 2011, 19, 87–96. [Google Scholar] [CrossRef]
- Franzluebbers, A.; Hons, F.; Zuberer, D. Tillage and crop effects on seasonal soil carbon and nitrogen dynamics. Soil Sci. Soc. Am. J. 1995, 59, 1618–1624. [Google Scholar] [CrossRef]
- Reth, S.; Reichstein, M.; Falge, E. The effect of soil water content, soil temperature, soil pH-value and the root mass on soil CO2 efflux—A modified model. Plant Soil 2005, 268, 21–33. [Google Scholar] [CrossRef]
- Tang, J.; Baldocchi, D.D.; Qi, Y.; Xu, L. Assessing soil CO2 efflux using continuous measurements of CO2 profiles in soils with small solid-state sensors. Agric. For. Meteorol. 2003, 118, 207–220. [Google Scholar] [CrossRef]
- Zhang, X. Effect of Soil Organic Matter Quality on the Soil Moisture–Heterotrophic Respiration Relationship. Master’s Thesis, Ghent University, Ghent, Belgium, 2023. [Google Scholar]
- Al-Kahtani, S.; Ahmed, M.; Al-Selwey, W.; Abdel-Razzak, H. Evaluation of composted agricultural crop wastes application on growth, mineral content, yield, and fruit quality of tomato. J. Exp. Biol. Agric. Sci. 2018, 6, 159–167. [Google Scholar]
- Aminifard, M.; Aroiee, H.; Azizi, M.; Nemati, H.; Jaafar, H. Effect of compost on antioxidant components and fruit quality of sweet pepper (Capsicum annuum L.). J. Cent. Eur. Agric. 2013, 14, 525–534. [Google Scholar] [CrossRef]
- Tripathi, P.; Kashyap; Shah, S. Effect of organic amendments on growth and yield attributes of medicinal and aromatic plants under peach-based agroforestry system in the mid-hills of the Western Himalayas. For. Trees Livelihoods 2020, 29, 222–237. [Google Scholar] [CrossRef]
- Franzluebbers, A.; Stuedemann, J. Particulate and non-particulate fractions of soil organic carbon under pastures in the Southern Piedmont USA. Environ. Pollut. 2002, 116, S53–S62. [Google Scholar] [CrossRef] [PubMed]
- Srinivasan, V.; Maheswarappa, H.; Lal, R. Long term effects of topsoil depth and amendments on particulate and non particulate carbon fractions in a Miamian soil of Central Ohio. Soil Tillage Res. 2012, 121, 10–17. [Google Scholar] [CrossRef]
- Bernal, M.; Sanchez-Monedero, M.; Paredes, C.; Roig, A. Carbon mineralization from organic wastes at different composting stages during their incubation with soil. Agric. Ecosyst. Environ. 1998, 69, 175–189. [Google Scholar] [CrossRef]
- Jorge-Mardomingo, I.; Soler-Rovira, P.; Casermeiro, M.Á.; de la Cruz, M.T.; Polo, A. Seasonal changes in microbial activity in a semiarid soil after application of a high dose of different organic amendments. Geoderma 2013, 206, 40–48. [Google Scholar] [CrossRef]
- Castellini, M.; Niedda, M.; Pirastru, M.; Ventrella, D. Temporal changes of soil physical quality under two residue management systems. Soil Use Manag. 2014, 30, 423–434. [Google Scholar] [CrossRef]
- Rakesh, S.; Sarkar, D.; Sinha, A.K.; Mukhopadhyay, P.; Danish, S.; Fahad, S.; Datta, R. Carbon Mineralization Rates and Kinetics of Surface-Applied and Incorporated Rice and Maize Residues in Entisol and Inceptisol Soil Types. Sustainability 2021, 13, 7212. [Google Scholar] [CrossRef]
- Liang, C.-H.; Yan, Y.; Qian, C. Dynamics of soil organic carbon fractions and aggregates in vegetable cropping systems. Pedosphere 2014, 24, 605–612. [Google Scholar] [CrossRef]
- Zhang, M.; Dong, L.-G.; Fei, S.-X.; Zhang, J.-W.; Jiang, X.-M.; Wang, Y.; Yu, X. Responses of soil organic carbon mineralization and microbial communities to leaf litter addition under different soil layers. Forests 2021, 12, 170. [Google Scholar] [CrossRef]
- Liyanage, L.R.M.C.; Sulaiman, M.F.; Ismail, R.; Gunaratne, G.P.; Dharmakeerthi, R.S.; Rupasinghe, M.G.N.; Mayakaduwa, A.P.; Hanafi, M.M. Carbon mineralization dynamics of organic materials and their usage in the restoration of degraded tropical tea-growing soil. Agronomy 2021, 11, 1191. [Google Scholar] [CrossRef]
- Fernández, J.M.; Plaza, C.; Hernández, D.; Polo, A. Carbon mineralization in an arid soil amended with thermally-dried and composted sewage sludges. Geoderma 2007, 137, 497–503. [Google Scholar] [CrossRef]
- Zhang, X.; Zhao, Y.; Zhu, L.; Cui, H.; Jia, L.; Xie, X.; Li, J.; Wei, Z. Assessing the use of composts from multiple sources based on the characteristics of carbon mineralization in soil. Waste Manag. 2017, 70, 30–36. [Google Scholar] [CrossRef] [PubMed]
- Xiao, C.; Guenet, B.; Zhou, Y.; Su, J.; Janssens, I.A. Priming of soil organic matter decomposition scales linearly with microbial biomass response to litter input in steppe vegetation. Oikos 2015, 124, 649–657. [Google Scholar] [CrossRef]
- Sheppard, M.I.; Ewing, L.; Hawkins, J. Soil Degassing of Carbon-14 Dioxide: Rates and Factors. J. Environ. Qual. 1994, 23, 461–468. [Google Scholar] [CrossRef]
- Van Gestel, N.C.; Reischke, S.; Bååth, E. Temperature sensitivity of bacterial growth in a hot desert soil with large temperature fluctuations. Soil Biol. Biochem. 2013, 65, 180–185. [Google Scholar] [CrossRef]
- Van Gestel, N.C.; Schwilk, D.W.; Tissue, D.T.; Zak, J.C. Reductions in daily soil temperature variability increase soil microbial biomass C and decrease soil N availability in the C hihuahuan Desert: Potential implications for ecosystem C and N fluxes. Glob. Change Biol. 2011, 17, 3564–3576. [Google Scholar] [CrossRef]
- Carmeis Filho, A.C.; Crusciol, C.A.; Guimarães, T.M.; Calonego, J.C.; Mooney, S.J. Impact of amendments on the physical properties of soil under tropical long-term no till conditions. PLoS ONE 2016, 11, e0167564. [Google Scholar] [CrossRef]
- Bouajila, K.; Sanaa, M. Effects of organic amendments on soil physico-chemical and biological properties. J. Mater. Environ. Sci 2011, 2, 485–490. [Google Scholar]
- Mdlambuzi, T.; Tsubo, M.; Muchaonyerwa, P. Short-term effects of selected organic fertilizer sources on carbon dioxide fluxes and soil quality. J. Environ. Qual. 2021, 50, 312–323. [Google Scholar] [CrossRef]
- Lamptey, S.; Xie, J.; Li, L.; Coulter, J.A.; Jagadabhi, P.S. Influence of organic amendment on soil respiration and maize productivity in a semi-arid environment. Agronomy 2019, 9, 611. [Google Scholar] [CrossRef]
- Montanaro, G.; Dichio, B.; Bati, C.B.; Xiloyannis, C. Soil management affects carbon dynamics and yield in a Mediterranean peach orchard. Agric. Ecosyst. Environ. 2012, 161, 46–54. [Google Scholar] [CrossRef]
Disclaimer/Publisher’s Note: The statements, opinions and data contained in all publications are solely those of the individual author(s) and contributor(s) and not of MDPI and/or the editor(s). MDPI and/or the editor(s) disclaim responsibility for any injury to people or property resulting from any ideas, methods, instructions or products referred to in the content. |
© 2025 by the authors. Licensee MDPI, Basel, Switzerland. This article is an open access article distributed under the terms and conditions of the Creative Commons Attribution (CC BY) license (https://creativecommons.org/licenses/by/4.0/).