Abstract
This research investigates the challenges and opportunities of flood-prone buyback land in the context of intensifying climate change and urban intensification, taking the suburbs of Brisbane City in Australia as a case study. While the floodable land buyback strategy has gained global interest, there has been limited focus on the future of this acquired land in cities. Approaching the design of flood-prone buyback land requires an understanding of the impacts and the specific manifestations of buyback land while embracing the increasing presence of water in these areas. Buyback land represents spaces to rethink the design of cities, going beyond flood resilience and addressing other climate change-related urban challenges. By combining adaptation and regenerative measures, design disciplines can contribute to generating site-specific buyback land strategies, establishing a stronger connection between these newly acquired lands, hydrological systems, urban intensification, and ecological balance to address the current and future needs of the city. The methodology involves a design-led investigation, combining analytical and speculative–exploratory methods, grounded on a site-specific approach, working at multidisciplinary and multi-scalar levels at city, suburb and site scale. This study identifies five typologies of buyback land: isolated, isolated clusters, block-clusters, park-fronted and water-fronted. Understanding these typologies should shape how we rethink buyback land in the context of climate change and urban intensification. When reconceptualized, the buyback land can redefine the flood-prone cities, by applying strategies that reimagine these areas through local climate adaptation, land repair, regeneration and resource recovery. Current and future buyback land offers opportunities for future design practices and policymakers to rethink the city’s long-term development in a changing climate.
1. Introduction
As part of a broader discourse of land acquisition as a tool for building flood resilience in cities, this research investigates the potential of ‘buyback’ land in rethinking flood-prone suburbs in the context of climate change. More specifically, this research focuses on Brisbane City, Australia, and explores the past, recent and ongoing flood-prone land buybacks in selected suburbs. Given the predicted increase in severe floods due to more frequent and intense rainfall exacerbated by climate change, as per Australia’s 2022 State of Environment Report [1], cities will continue to buyback flood-prone private land to move communities out of vulnerable areas. In Australia, flood-prone land buybacks are currently limited to areas susceptible to fluvial and pluvial floods but will likely spread to the foreshore given the threat of rising sea levels to inundate coastal land. While foreshore land buyback is equally critical, it is beyond the scope of this paper.
Land acquisition is not a new phenomenon. Governments worldwide have acquired private or community land through compulsory or voluntary acquisition for public purposes such as infrastructure or city expansion. Private or community land acquisition has been utilized as a strategy to relocate people out of areas affected or susceptible to recurrent disasters. Examples can be found in Japan as a result of an earthquake and tsunami in 2011 [2], the Netherlands due to reoccurring river flooding from 2006 [3] and the Room for Rivers Programme [4], the United States due to floods in 1993 [5], and hurricane in 2012 [6], Sri Lanka due to a tsunami in 2004 [7], Samoa due to a tsunami in 2009 [8] and Guatemala due to an earthquake in 1976 [9].
The terms buyback or buyout have been used interchangeably for forms of land acquisition. Buyout is used in the USA to refer to the public purchase of existing development or to prevent future development in vulnerable areas. It includes the public purchase of flood-prone homes and properties to remove residents from harm’s way while compensating them financially [10]. In Australia, the term buyback is used instead to mean the voluntary land acquisition of flood-prone areas by the government to reduce the impact of floods on the community [11,12]. Given the context, we use the term ‘buyback’ in this research. Some suburbs in major Australian cities are built on low-lying lands vulnerable to recurrent and future floods. As a result, voluntary flood-prone land buyback has been employed in different Australian States, including Victoria [13,14], New South Wales [15] and Queensland [11]. This study focuses on the voluntary home buyback in Brisbane suburbs as a case study, exploring and reflecting on the rationale of the past and recent buybacks after the 2022 floods in South-East Queensland (SEQ).
1.1. Voluntary Home Buyback in Brisbane
Brisbane City in Queensland has a complex and evolving relationship with water, framed by its undulating topography, meandering Brisbane River, its tributaries and Moreton Bay. The city has experienced significant flooding events, including the 1983, 1974, 2011 and recently the 2022 floods, with devastating loss to properties and impacts on infrastructures [16,17]. In the aftermath of the 2022 floods in South-East Queensland, the Queensland State Government through the Queensland Reconstruction Authority (QRA) initiated a Voluntary Home Buyback (VHBB) [11], funded through the Resilient Home Fund to the tune of AUD 741 [18], through the Commonwealth-State Disaster Recovery Funding Arrangements (DRFA), established in May 2022 [19]. The program targets properties severely impacted by the 2021–2022 floods or susceptible to future inundation exacerbated by climate change.
The homeowners in flood-risk zones are offered the option of selling their properties to the government rather than face the prospects of rebuilding or enduring further damage in future floods and associated financial and emotional tolls. For property owners not wanting to relinquish their homes, the program offers funding schemes through ‘Resilient Retrofit’—for home retrofit and repair to build resilience, ‘Home Raise’—raising homes above local flood levels and “Demolish, Rebuild or Relocate’ programs [20]. The VHBB funding is provided by the State Government to the Councils to buy back homes. The buyback approach is fronted as a long-term recovery and prevention strategy, allowing a gradual and systematic reduction in the number of homes in flood zones. The program helps reduce the strain on State and Federal Government resources in the perpetual lopsided cycles of recovery and reconstruction expenditure (Figure 1) and move towards disaster resilience. Although lauded as a proactive approach to preventing flood damage rather than investing in constant repair and reconstruction after floods, its timing or increased intensity in South-East Queensland after the major flood events, suggests a reactionary measure dictated by cycles of floods, with the funding often initiated after a disaster [12] and can be a lengthy process for communities still recovering, which hamper public participation.
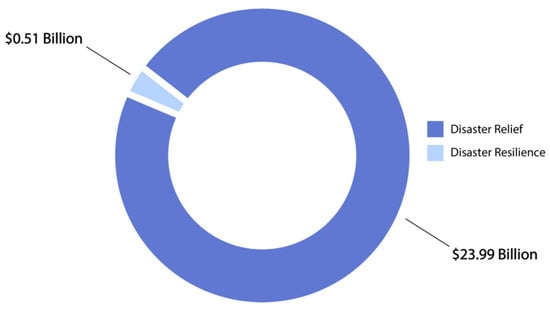
Figure 1.
Between 2005–2022, the Australian Federal Government spent AUD 24.5 Billion on disaster, of which 98% was for recovery and relief and 2% spent on futureproofing and disaster resilience (Prevention), adapted from The Cost of Extreme Weather: Building resilience in the Face of Disaster, by M. Lefebvre, J. Reinhard, 2022, The McKell Institute, p. 12. [21].
1.2. The Problem
Despite the growing interest in measures such as home retrofitting, home and floodable land voluntary buyback in Australia and internationally [12], there has been little attention on what to do with these acquired lands. In Queensland, for instance, the buyback land is declared ‘never to be built on’ [22]. They are rezoned to non-habitable use, soil remediated, and grass planted, resulting in monocultured open grass spaces demarcated by short timber posts across suburbs (Figure 2). These grassed buybacks are high maintenance and after a short while look abandoned, neglected and weed infested. Beyond retreating from floods, the resulting spaces have no other defined function to the local communities, and the city at large. They are spaces for water to flow unabated. In demolition and relocation cases, the buyback program employs the indiscriminate cutting down of trees and other vegetation types, resulting in biodiversity loss and destruction of habitats.
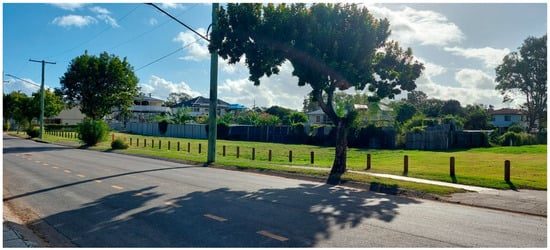
Figure 2.
Buyback lots in Oxley Suburb, planted with grass and demarcated using short timber posts.
This study argues that in addition to building flood resilience, the buyback lands can address other pressing climate-related urban challenges, effectively reshaping cities into the future. Given the extent of buyback in SEQ, this study is limited to voluntary home buyback in Brisbane suburbs as a case study, and it explores the rationale of the past and recent buybacks after the 2022 floods in SEQ. It then speculates on the potential of the buyback areas in the context of climate change and urban intensification. This study explores the following pertinent questions:
- What are the impacts of voluntary land buybacks on suburbs?
- What typologies of buyback land exist in the suburbs?
- What role can the buyback land play in addressing pressing climate-related challenges in the context of climate change and urban intensification?
2. Materials and Methods
This research was undertaken as a design-led research [23,24,25] method of enquiry. Design is utilized as a driver of knowledge production, involving descriptive research methods (identification, analysis and communication) and speculative methods (design testing, strategies and spatial design). “Speculation provides a language and conceptualisation” that can be leveraged to generate knowledge, notions and abstractions than can “shape our individual and collective futures” [26]. In this research, the speculative method is employed to ask bold questions, reframe and provoke thought about possible futures of buyback land. It employs a theoretical research agenda and site-specific investigation to define research questions and scenarios. It is anticipated that the outcome of this research may inform future decision making, policies, guidelines and design practices in the context of increasing flood-prone land buyback in Australia.
This study begins with a review of the existing literature on flood-prone land buyback, archival studies and a desktop analysis of the major flood events in Brisbane and SEQ in 1983, 1974, 2011 and 2022. While there have been land buybacks in other Councils in Queensland, the geographic scope of this research was limited to Brisbane City Council (BCC) Local Government Authority, given that most buybacks in SEQ have been in BCC. To understand the scale, we began by identifying and mapping all the suburbs where buybacks have been undertaken across BCC. This included the historical buybacks and based on the 2022 VHBB scheme. Buyback suburbs and sites were defined using the BCC City Plan 2014 [27] mapping due to the rezoning of sites being up to date.
The major floods were mapped using ArcGIS (version 3.3) and data from Queensland Globe(v.2.15) [28] and correlated with the mapping of all suburbs where buyback schemes were employed in the past or are currently being employed based on the Queensland Reconstruction Authority and BCC. We identified at least 16 suburbs in BCC where buyback schemes have been employed since the 1974 floods to date, namely, Rocklea, Oxley, Fairfield, Windsor, Milton, Sherwood, Clayfield, Herston, Yeerongpilly, Archerfield, Carina, Boondall, Woolloongabba, Tennyson, Murarrie and Nundah. From these suburbs, we narrowed down to four representative suburbs for detailed mapping and research: Windsor, Rocklea, Oxley and Fairfield, having the most buybacks and being most affected by floods, with hundreds of houses inundated in each major flood [29,30] and based on their similarities and differences.
Windsor represents a historical, industrial and residential suburb. Rocklea has small residential patches and a large portion of parkland zoning defined by Oxley Creek. Similarly, Oxley is a residential suburb with a large portion of parkland and defined Oxley Creek, while Fairfield is residential and adjacent to the Brisbane River (Figure 3). The differences also suggest differences in the communities. Windsor, Rocklea and Oxley have a long history of buybacks due to flooding, while Fairfield has very little, allowing for an analysis of buyback presentation and effect over time. Windsor, Rocklea and Oxley are impacted by creek flooding, but Fairfield is impacted by Brisbane River flooding, collectively allowing for potential variations between creek and river flooding to be noted. Imagery of the suburb over time was sourced through QImagery [31] and Nearmap [32] to identify the lot scale buybacks over time. These suburbs presented a range of data that produced a firm foundation of buyback typologies and character.
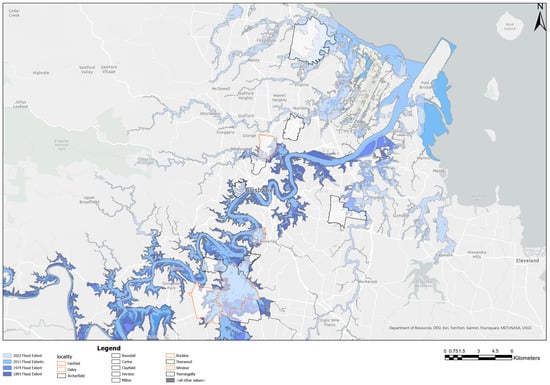
Figure 3.
All the buyback suburbs within Brisbane City Council (BCC) and the selected suburbs highlighted (in orange), namely Windsor, Fairfield, Rocklea and Oxley. Queensland Globe [28].
The suburbs were analyzed over multiple decades depending on when each suburb transitioned to residential. Consistencies were noted, including post-type fencing (Figure 1), vegetation characteristics including a cleared open lot with open lawn and other vegetation (trees and shrubs) occurring along the perimeter of the site and evidence of maintenance (routine mowing over all connected lots). The sample size consisted of 559 lots in total: 119 as part of the VHBB scheme, and 440 historical. Extensive fieldwork of the buyback lots occurred over 2 months with 9 site visits for ground truthing and photography to record their current conditions, use and abutting properties.
The photographs were analyzed across all the suburbs to draw similarities and differences in character.
The criteria for identifying the typologies of buyback land were based on the following: Firstly, if a buyback parcel consisted of a single property surrounded by existing dwellings, it was classified as isolated. Secondly, if two or more buyback properties were adjacent to one another but not connected to other buyback areas, they were classified as clustered. Thirdly, if three or more buyback lots were aligned side by side or connected back-to-back, forming a narrow strip of land linking two roads, they were classified as a block, due to their larger combined size. Finally, consideration was also given to the type of landscape feature (e.g., river or creek) or land use (e.g., parklands) located in front of the buyback land—hence park-fronted and water-fronted typologies. This was then cross-referenced by the information ascertained from suburb analyses, including land use, existing building footprints and suburb-wide flood impacts. The typologies of buyback spaces were further assessed on other relevant particulars, including hydrology (pluvial flood risk, and fluvial inundation levels), vegetation character/quality/cover and overall access and connectivity for humans and nonhumans. Once the typologies were identified, a design-led exploration was carried out, employing site-scale design as a reflective practice to develop and test design strategies for redefining the buyback land.
3. Results: Rationalizing Flood-Prone Land Buyback
3.1. Flood-Prone Land Buyback in Brisbane, Australia
Home buyback has been a significant tool for reducing flood risk in Brisbane and has evolved over time. The concept of home buyback dates back to the 1974 floods. Following the events of the 1974 major floods, a buyback scheme was administered by the Brisbane City Council, which ran until 1991 and resulted in an estimated 50 properties being purchased in Windsor [33]. At the time, buybacks were carried out on a small scale. In 2005, a report by the “Lord Mayor’s Taskforce on Suburban Flooding” was released describing strategies to reduce the impact of flooding. This resulted in what was regarded as a non-structural measure, the Voluntary Home Purchase Scheme, being introduced in 2006 that offered buybacks for properties subject to a 50% chance of flooding annually [33]. After the 2011 floods, the Queensland Government launched the first significant buyback program. While the 2013 and 2015 floods were not as severe as the 2011 floods, they still had substantial effects in West End, Rocklea and Woolloongabba, prompting the continuation and expansion of the buyback program [33]. The Voluntary Home Purchase scheme ran until 2017, resulting in the buyback of 112 properties [34].
Following the 2022 floods, calls were made to establish a buyback scheme for Queensland, culminating in the introducing of the Voluntary Home Buyback program as part of the Resilient Homes Fund Initiative. The buyback program was significantly expanded as part of a broader flood management and recovery strategies. It became the largest voluntary home buyback in the city’s history. The program includes the Brisbane, Ipswich, Logan City Councils, Moreton Bay, Gympie, Lockyer Valley, Fraser Coast Regional Councils and Noosa Shire Council [11]. The home buyback has continued post-2022, and as of May 2024, the number of properties settled totaled 628. As noted earlier, within Brisbane City Council, land buyback has occurred in at least 16 suburbs over the years, with major buyback occurring in Windsor, Rocklea, Oxley and Fairfield.
3.2. Floods and Buybacks in Suburbs
Windsor, Fairfield, Rocklea and Oxley suburbs, which are the focus of this study, were significantly inundated by the 2011 and 2022 floods [16], with Brisbane River peak height being at 3.85 in 2022 and 4.46 in 2011. For Fairfield (Figure 4), Rocklea (Figure 5) Oxley (Figure 6), the flooding from 2022 was within the flood extents of the 2011 floods. In Windsor, however, the flood extent for 2022 was significantly worse than in 2011 (Figure 7), impacting housing that was previously considered flood safe. This was due to intense rainfall causing significant flash flooding in Enoggera Creek, and localized rainfall within Windsor [35]. The number of houses inundated in the 2011 and 2022 floods in Windsor were 288 and 511 out of a total of 3709 houses, Fairfield 662 and 567 out of 1300, Rocklea 706 and 638 out of 757 and Oxley 689 and 388 out of 3267 [36]. These numbers do not include properties repurchased by the BCC before the Voluntary Home Buyback Scheme of 2022. All these houses are within a 1% chance of flooding annually, except Windsor, with all being within a 5% chance [37].
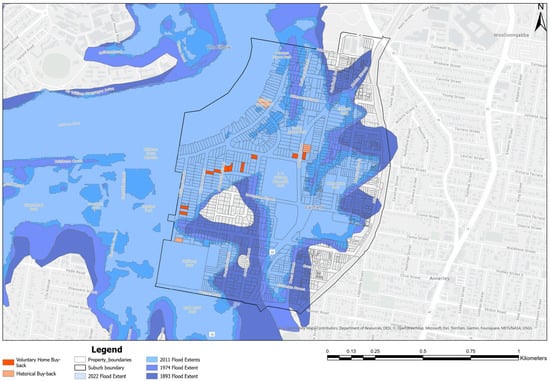
Figure 4.
Buyback lots in Fairfield, historical and buybacks based on the 2022 Voluntary Home Buyback. Data source: Queensland Globe [28].
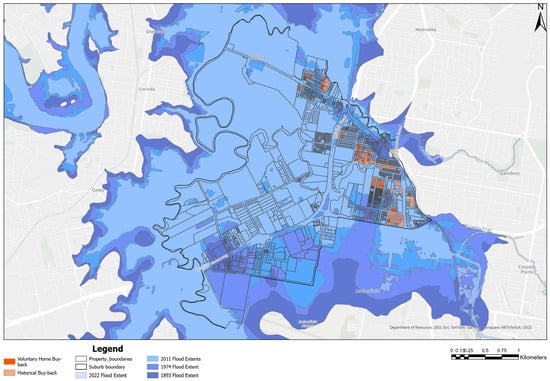
Figure 5.
Buyback lots in Rocklea, historical and buybacks based on the 2022 Voluntary Home Buyback. Data source: Queensland Globe [28].
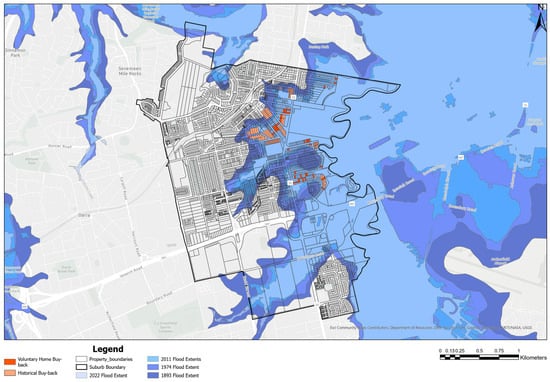
Figure 6.
Buyback lots in Oxley, historical and buybacks based on the 2022 Voluntary Home Buyback. Flood height in 2022 floods was 7.8 m. Data source: Queensland Globe [28].
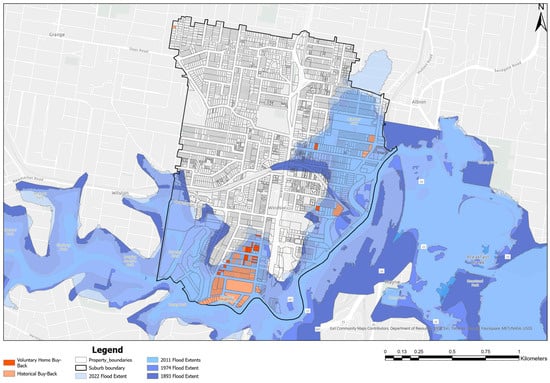
Figure 7.
Buyback lots in Windsor, historical and buybacks based on the 2022 Voluntary Home Buyback. Data source: Queensland Globe [28].
Land buyback is not new in the four suburbs. They had historical buybacks before the 2022 scheme. Windsor accrued an estimated 121 houses, Fairfield had 7, Rocklea had 213 and Oxley had 99. The resulting lands have been transformed into parks, sports grounds, minimal-use open space and revegetated habitat. Buybacks occurring over time are absorbed into these open spaces, most clearly visible in the southeast section of Rocklea. The Voluntary Home Buyback Scheme (VHBB), in effect since 2022, has 23 houses bought back in Windsor, 7 in Fairfield, 53 in Rocklea and 36 in Oxley by the time of this research. This equals a total of 144 in Windsor (Figure 7), 17 in Fairfield (Figure 4), 266 in Rocklea (Figure 5) and 135 in Oxley (Figure 6) of houses bought back overall. These numbers for the VHBB are subject to change since the program is ongoing. The numbers presented were based on publicly available data as of July 2024 [38]. On all the four suburbs, only a smaller section of residential properties susceptible to inundation has been bought back. This suggests possible future land buyback to continue the retreat from floods. This is increased in Rocklea where the whole suburb is susceptible to inundation (Figure 5). Properties bought back through the VHBB after the 2022 were within inundation depth risks ranging from 1 to 6 m inundations across the suburbs (Figure 8, Figure 9, Figure 10 and Figure 11).
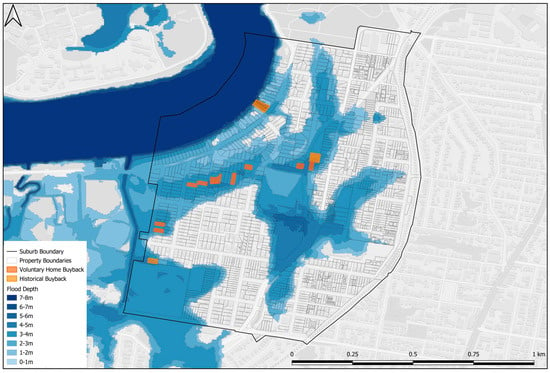
Figure 8.
The 2022 floods inundation depths in Fairfield Suburb. Buyback properties were within 2–5 m inundation depths.
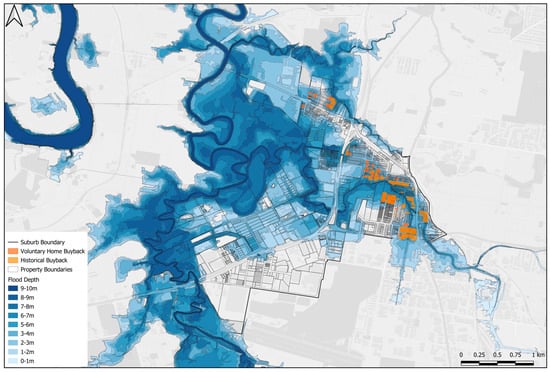
Figure 9.
The 2022 floods inundation depths in Rocklea Suburb. Buyback properties were within 1–5 m inundation depths. Data source: Queensland Globe [28].
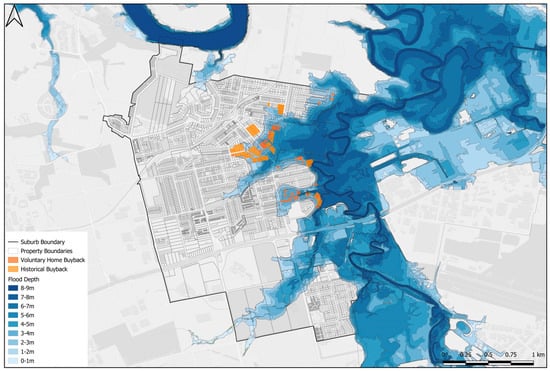
Figure 10.
The 2022 floods inundation depths in Oxley Suburb. Buyback properties were within 1–4 m inundation depths. Data source: Queensland Globe [28].
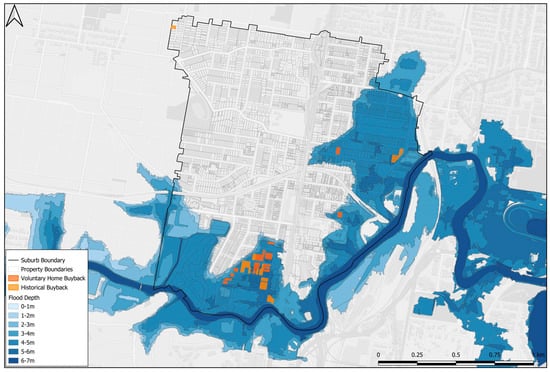
Figure 11.
The 2022 flood events inundation depths in Windsor Suburb. Most buyback properties sit within inundation levels of 2–4 m with several properties still in deep inundation areas. Data source: Queensland Globe [28].
3.3. Impact of Buyback
While outside the scope of this research, we acknowledge the impact of land buyback on communities of humans and nonhuman animals in the cities discussed extensively elsewhere by Manda et al. [39]; Barile et al. [40]; Fothergill and Peek [41]; Greer et al. [42]; Hori and Schafer [43] and Patch B. [12]. The residual communities were found to view smaller cleared properties as an “empty lot” and unusable. However, this impression occurred less with households moving into the area after homes had been cleared [39]. Larger areas of land cleared were sometimes seen more favorably as an extension of neighboring backyards encouraging recreation [39]. The intentional use of buyback land has been found to support residual communities and reduce feelings of loss, thereby improving quality of life [42]. The implications of buyback on vegetation cover across the suburbs are equally severe. Analysis of vegetation cover during the Voluntary Home Buyback (VHBB) scheme based on mapping two representative sites shows a massive vegetation loss irrespective of the buyback land typology. The massive devegetation could be linked to terms of reference of demolition tenders in packages of approximately 10 houses, with each home forming a separate contract [44].
In Windsor, 17 lots were cleared before 2009 and another 13 were cleared from 2009 to 2021 (Figure 12). Of those 13 lots, an estimated 48 trees of varying species were cleared, and an indeterminant number of shrubs, grass and other groundcovers. Of the previously cleared lots, 15 trees had been retained; however, they had all been cleared by 2020. No trees were retained in any lot except one to the east. The land was redeveloped to serve as a sports oval which involved laying turf grass and an estimated 52 trees planted along the perimeter of the oval and on street verges. This was one of the few indications of non-lawn vegetation being planted in buyback sites following clearing, with two other examples in Rocklea.
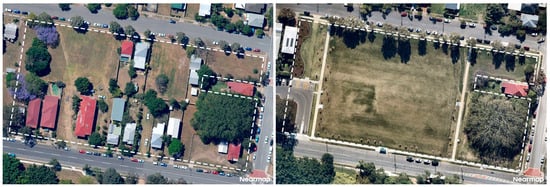
Figure 12.
Vegetation clearing in Windsor between Northey St and Cullen St. Left figure: 2009, right: 2021. The dashed borderline highlights the boundary of buyback sites. Aerial images source [45,46].
In Nicholas St and Taylor St in Windsor, there were three lots in total cleared before 2009 with only four trees retained. From 2022 to 2024, seven lots were bought back, with four added to the original lots and three others forming a new larger parcel (Figure 13). An estimated 26 and 10 trees were cleared, respectively, and an unspecified number of shrubs, grass and groundcovers. There were seven trees retained culminating in eleven trees and three shrubs retained in total.
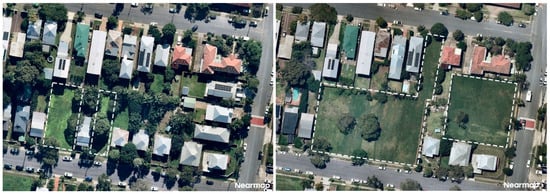
Figure 13.
Vegetation clearing within Nicholas St and Taylor St, in Windsor. Left figure show 2022, right show 2024. The dashed borderline highlights the boundary of buyback sites. Aerial image source [47,48].
In Fairfield, six lots were cleared between 2023 and 24 (Figure 14). An estimated 41 trees were cleared, and there was an indeterminant number of lower plantings. A total of five trees were retained in the front or back of a property and none within the lot interior. No vegetation was added to any of the lots except lawn grass, resulting in monocultured irrigation dependent vegetation. All six lots are currently visually present as empty lots, with indications of invasive weeds growing.

Figure 14.
Vegetation clearing within Fairfield. Left image: 2022, right image: 2024. Figure source: Nearmap 2024. Aerial images source: [49,50].
Tree canopy coverage in Brisbane is estimated to be 49% and of this, 55% is found within private residential land [51,52]. Vegetation clearing through the buyback process reduces this coverage and negatively affects urban ecological systems. Vegetation clearing through the buyback process in what was private residential land further reduces this coverage and negatively affects the urban biodiversity. Vegetation clearing exposes the suburbs to increased localized temperatures due to greater exposure to direct sunlight and lowered evapotranspiration [53]. Furthermore, habitats significant to many urban nonhuman species are lost [54,55] and water infiltration and filtration potential is lowered [56]. The removal of original vegetation also releases carbon due to decomposition, while grass lawn laid by the Council has reduced carbon sequestration and storage ability compared to shrubs and trees [57]. Indiscriminate clearance within a single property, or at a neighborhood block scale, is an act of erasure, causing feelings of loss of personal and communal history and sense of place. These losses are visually and physically sensed and felt in daily lives by the residual community and households that have moved away from the area.
Buyback land programs involving demolitions produces construction demolition waste. Materials such as asbestos and heavy metals are released into the soil leading to contamination. These contaminants can be harmful to plants, animals and humans who come into contact with them. These lands require rehabilitation before they can be put into any safe use for humans and urban biodiversity. There are ongoing initiatives to recycle building materials from the demolition, including structural timber, roof sheeting, doors, windows, weather boards, garage roller doors and whirlybirds in household roofs [58]. The recycling of these materials can be seen in the works of architects such as 5-Mile Radius [59] who work with materials from buyback in their designs. In cases where buyback buildings are relocated, some Queenslander buildings in good condition are repurposed and put on sale in Brisbane. Although a good initiative, transporting the buyback buildings on public roads often leads to significant traffic congestion and inefficient resource use to transport large buildings.
4. Typologies of Buyback Sites
From the mapping, fieldwork and analysis of the buyback lots individually and collectively over time, it became evident that there were five main typologies with varying characteristics. The five typologies of buyback sites were identified based on the relationship with other buyback sites and the abutting land uses. The typologies consist of isolated, clustered isolated, block, clustered block, park-fronted and water-fronted buybacks (Figure 15), all with varying inundation risks (Figure 8, Figure 9, Figure 10 and Figure 11).
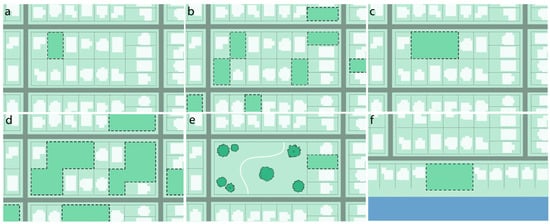
Figure 15.
Buyback land typologies: (a) isolated, (b) clustered isolated, (c) block, (d) clustered block, (e) park-fronted, and (f) water-fronted typologies. Images are a representation of a residential neighborhood. White shapes signify housing; thick grey lines are roads, and thin dashed grey lines are boundaries of private land. The dark green shapes with dashed black lines signify buyback sites in the form of each typology.
4.1. Isolated Typology
The isolated types are singular buyback lots removed from the other buyback lots. They are surrounded by residential properties, mostly with single dwellings either on the ground or raised on stilts. These buyback sites are narrow strips of land, giving an impression of abandoned spaces that are desolate and, in many cases, uninviting to the local communities because they are fenced on two or three sides with a single access from the adjacent roads (Figure 16). Some isolated buybacks are in transition phase, awaiting buyback of the adjacent properties to transform to other typologies. The isolated typology was found in all suburbs, with eight each in Windsor and Fairfield, ten in Rocklea, and sixteen in Oxley at the time of this research. The size and ratio of each lot varied based on property boundaries originally defined for each suburb. Isolated buybacks manifest in a range of ways and configurations (Figure 17) and are affected mostly by pluvial and, in some cases, fluvial floods if near a creek.
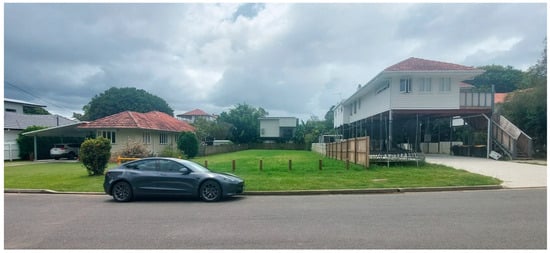
Figure 16.
Isolated buyback land between two residential properties in Fairfield in November 2024.
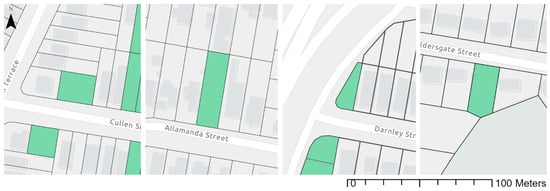
Figure 17.
Example of isolated typology manifestations found in Windsor, Fairfield, Rocklea and Oxley suburbs from left to right.
4.2. Isolated Cluster Typology
These are a cluster of isolated buybacks within proximity (defined suburban block) but which are not abutting each other or connected by property boundaries (Figure 18). This typology was evident in all suburbs analyzed, with one in Windsor, and Fairfield, three in Rocklea and two in Oxley at the time of this research.
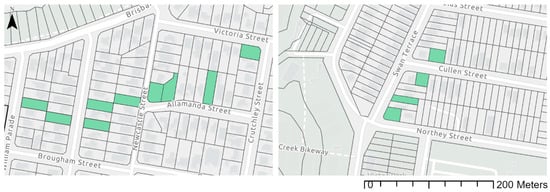
Figure 18.
Examples of isolated cluster typology manifestations in Fairfield (left) and Windsor (right).
4.3. Block Typology
These are buyback lots adjacent to each other through the original lot boundaries and consolidated into one space with the property boundaries erased. They are formed by a range from three or more buyback lots side-by-side or back-to-back to create a narrow strip of land linking two roads (Figure 19). This type occurred in all suburbs with six in Windsor, one in Fairfield, seventeen in Rocklea and seven in Oxley by the time of this research. Block typology may differ dramatically due to lot size, shape, proportion and plot layout variations in each suburb (Figure 20). This typology is affected mainly by pluvial floods and occasionally by fluvial floods during major events.
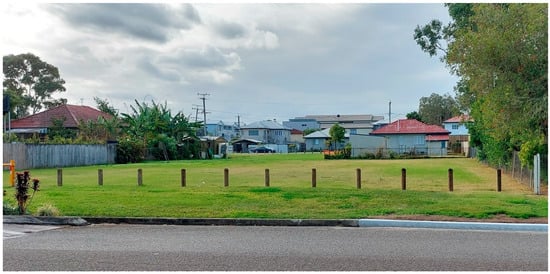
Figure 19.
Block buyback lot in Rocklea formed by consolidating more than two buyback lots, in November 2024.
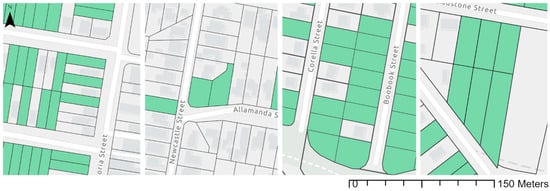
Figure 20.
Example of block typology manifestations Windsor, Fairfield, Rocklea and Oxley suburbs, in November 2024.
4.4. Block-Cluster Typology
A block-cluster occurs where block typologies are near each other but separated by roads or residential buildings (Figure 21). In this case, the buyback lots are consolidated and may occur within a suburban block or within adjacent urban blocks. This type was not evident in Fairfield but occurred in all other suburbs, one in Windsor, three in Rocklea and one in Oxley (Figure 22).
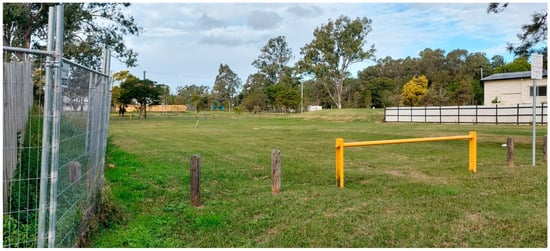
Figure 21.
Block cluster typology in Rocklea separated by roads, in November 2024.
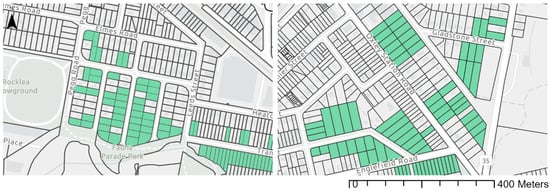
Figure 22.
Example of block-cluster typology manifestations in Rocklea (left) and Oxley (right).
4.5. Park-Fronted Typology
The park frontage type may present as an isolated or block type but borders either a public park or other types of open space (Figure 23). It is likely to be enfolded into neighboring open-space systems utilized for parks or habitats. This type was found in all suburbs, with Windsor and Fairfield only connecting to parks (Figure 24), and Rocklea and Oxley connecting to both parks and natural open spaces. These are buyback spaces fronting an existing public park. Some are single lots or clustered fronting a public park.
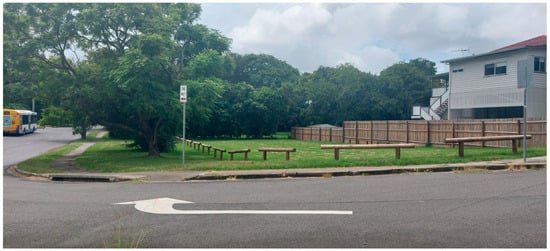
Figure 23.
Example of park-frontage typology in Fairfield, Home Street Park, from Victoria Street, in November 2024.
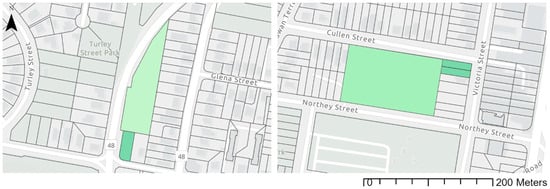
Figure 24.
Example of park frontage typology manifestations in Fairfield (left) and Windsor (right).
4.6. Water Fronted Typology
These are buyback lots fronting a creek or river and susceptible to fluvial floods (Figure 25). Within the suburbs analyzed, this typology only occurred in Windsor and Fairfield as historical buybacks. In all cases, the buyback sites were transitioned to densely vegetated riparian habitats.
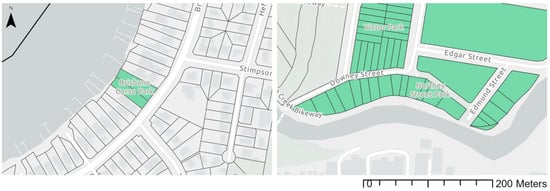
Figure 25.
Example of water-fronted typology manifestations in Fairfield and Windsor.
From the mapping, the buyback typologies evolve over time into other types depending on the acquisition and adjacent properties beginning as an isolated lot and then converting to isolated clusters or blocks. Isolated clusters transition into blocks or block-clusters, and blocks into block-clusters. Defining these types over time can allow for planning in the event of future buybacks in the area affecting type form and, therefore, design options. For all typologies, there were other patterns of details noted from analyzing urban character, hydrology and vegetation that add to the complexity of the buyback sites and proposed design speculations.
4.7. Buyback Typology and Inundation Risks
When assessing for pluvial flood risk, it was found that out of 39 isolated sites, 8 had a medium-risk, 5 medium-low, 2 low, 1 low-nil and 23 had nil-risk. The seven isolated cluster sites amounted to one medium-risk, three medium-nil and three nil. Of the 33 block sites, 2 were medium-risk, 10 medium-low, 1 medium-nil, 3 low, 2 low-nil and 15 with nil-risk. The six block-cluster sites found one medium-low-risk, three medium-nil and two nil-risk. The three park-fronted sites amassed one medium-risk, one medium-low and one nil-risk, and the two water-fronted sites were all nil-risk [60].
In relation to the suburbs, Rocklea and Oxley had the greatest number of sites with either 100% nil-risk with 23 and 14, respectively, or partial nil-risk of 28 and 18, respectively. Windsor, however, only had eight nil-risk sites, and Fairfield only one nil-risk site [60]. This is likely due to the number of isolated block types and larger block sizes in those suburbs, which create access to a more permeable ground surface. In contrast, Fairfield had nine of ten other sites with full medium-risk [60]. Based on the slope gradients of buyback sites, the overland flow will be much slower in Windsor and Fairfield, while Rocklea and Oxley will be moderate.
Of the fluvial inundation levels, all typologies found in Fairfield, Rocklea and Oxley were 100% inundated during the 2011 and 2022 floods. However, Windsor was noticeably different, with all 18 typology manifestations 100% inundated in 2022, but only three isolated, six block, one block-cluster and one park-fronted and one water-fronted typology 100% inundated in 2011. Windsor’s fluvial inundation results suggest a possible variability in flood conditions considering ongoing climate change. Due to this fluvial inundation change occurring from greater rainfall entering Enoggera Creek, Rocklea and Oxley may see these variations in the future due to Oxley Creek/Benarrawa running between the suburbs. However, Fairfield is likely to see a similar flood extent due to only being affected by the Brisbane River/Maiwar.
5. Approaches and Strategies for Buyback Land
This section discusses the approaches and strategies in response to the research findings, the extent and impacts of flood-prone land buyback (Section 3) and buyback land typologies (Section 4). It begins by outlining the approaches to flood-prone land buyback, then presents strategies for expanded climate resilience and suggests ways to repair, recover and repurpose buyback land and properties, balancing pragmatic with forward-looking aspirations.
5.1. Approach to Flood-Prone Land Buyback
Flood-prone land buyback is an evolving strategy and likely to intensify in response to the ongoing effects of climate change, particularly the increasing frequency and severity of floods, in both riverine and coastal environments. Buyback schemes are increasingly being implemented as a reactive, non-structural measure aimed at reducing the impacts of flood on communities. In many instances, such initiatives are undertaken through a top-down approach, led by federal, state or local government due to the substantial financial cost involved. For greater effectiveness, flood-prone land buyback should be treated as a multi-stakeholder initiative, involving affected communities, First Nations People, all levels of governments and multidisciplinary professionals. This approach should account for both direct and indirect impacts, including climatic, social, cultural, environmental and economic. Importantly, land buyback programs should evolve from being primarily reactive to integrated ongoing long-term strategies that extend beyond flood resilience. They should identify additional opportunities such as initiatives that enhance urban biodiversity, promote urban cooling, support urban intensification and cultural reconnection working with the First Nations People.
Learnings can be drawn from other contexts that have successfully considered pre-buyback and post-buyback planning and design to rethink the buyback land. Buyback programs should consider broader community goals that extend beyond relocation. For example, in Charlotte/Mecklenburg in North Carolina, the community developed their own buyback program [12]. The program was linked to broader activities, including water quality, economic development and future flood mapping. In another study in Princeville in North Carolina, in the aftermath of Hurricane Mathew in 2016, community members adopted alternative ways to maintain their pre-disaster community bonds once their houses were moved uphill [12]. Pre-disaster planning plays a critical role in resilience building. In Kinston community, North Carolina, pre- and post-disaster planning was employed for Hurricane Floyd in 1999. Before Hurricane Fran in 1996, Kinston had dilapidated housing, lacked affordable housing and was exposed to extreme floods. Pre- and post-disaster planning ensured tools allowed for a temporary prohibition of new construction on floodplains, no rebuilding of substantially damaged structures on floodplains, increased elevation standards and the development of floodplain easements. When Hurricane Floyd hit Kinston in 1999, the community had a comprehensive buyout application ready for rapid implementation and was effectively approved within 2 weeks after the storm [12,61].
5.2. Buyback Land for Expanded Climate Adaptation
Brisbane’s buyback program combines retreat and adaptation strategies, such as house raising, retrofitting and relocation to reduce flood impact and enable quick recovery. While effective, these interventions are limited to individual or small group of buildings and should be complemented by broader, long-term land-use strategies that enhance flood resilience. With only portions of flood-prone properties acquired in each suburb (Figure 4, Figure 5, Figure 6 and Figure 7), and future buyback likely to be costly and restrictive to urban growth, repurposing land already bought back offers a strategic alternative. Doing so can reduce the scale and need for future buybacks, bolster resilience and address broader urban challenges such as heat and biodiversity loss. These lands now form part of Brisbane’s suburban fabric and manifest in varied typologies that present distinct opportunities for innovative reuse. Rather than conventional parks or monocultured landscapes (Figure 1), buyback land should become multifunctional spaces supporting flood adaptation, soil regeneration and adaptive reuse with a resilient urban framework. The strategies outlined are based on site-specific design testing and 2011 and 2022 flood data and post-buyback landscapes (Section 3 and Section 4).
5.2.1. Buyback Land Topology-Based Spaces for Water
Inundation of residential properties in Brisbane suggests water reclaiming its past territory defined by the low-lying topography. With the 2022 flood inundation depths (Figure 8, Figure 9, Figure 10 and Figure 11), these areas are inevitable ephemeral spaces for water and can play a greater role as the first line of suburb flood adaptation. They have the capacity to accommodate more volumes of water in extreme scenarios and adapt to the increasing ubiquity of water. This requires strategic topographic operations based on site-specific past inundation depths (Figure 8, Figure 9, Figure 10 and Figure 11) and projected future extreme flood levels as per the BCC FloodWise report [62], that combine adaptation with soft defense strategies tailored to buyback land typology and flood type, fluvial or pluvial flows. For this, buyback land will be fitted with a blue–green infrastructure system such as swales, detention-basins, and sunken gardens, which capture, retain and infiltrate water and recharge groundwater [63,64,65,66] while simultaneously providing community spaces.
The block and block-cluster typologies can be smaller (Figure 19) or larger in size (Figure 21 and Figure 22) depending on the number of buyback lots. These typologies can be topographically modified to create extended linear, sunken gardens designed to increase space for overland water and direct it away from essential areas. For the larger block and block-cluster typologies, topographic modification can be carried out strategically in lower areas and spoils from the excavations redeployed on adjacent buyback areas to create raised ground above the established site-specific inundation levels based on the BCC FloodWise report [62], a technical report giving lot-scale flood data. Any raised ground should be established above the 1% annual exceedance probability(AEP) level and above the historic flood levels of 2011 and 2022 floods, 3.85 m and 4.46m Australian Height Datum (AHD), respectively, [67,68] and fitted with subterranean water tanks as part of a decentralized water infrastructure system [69] for capturing, retaining and purifying water and resupplying it to the community (Figure 26) and suitable for the Rocklea and Oxley suburbs.
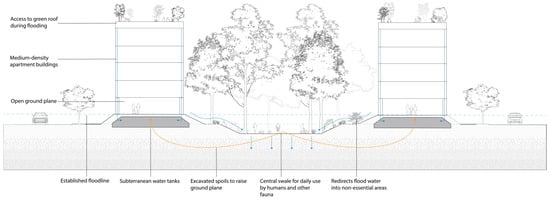
Figure 26.
Block and block-cluster buyback land typologies reimagined as spaces for water while increasing suburb intensity through low-medium density apartment blocks on raised ground and freeing ground for open ended communal programs and ground water recharge. Blue arrows indicate flow of water either as overland flow or infiltration and orange arrows indicate redistribution of earth.
From an aspirational position, raised ground above the 1% AEP flood level are safer from fluvial flows and suitable for urban intensification based on a new housing typology, water-sensitive medium-density residential typologies that foster a co-existence with water. For example, courtyard terrace houses, stacked cluster, walk-up apartments, or mid-rise apartment building typologies developed by London and Bertram et al. [70]. These new typologies should be on an equal or less footprint to the demolished or relocated buyback houses and freeing the ground level to ensure increased ground permeability, allowing the controlled flow of water during floods, reduce overland flow and to host communal functions across seasons. The water-sensitive building typologies consider roofs, facades and the ground level as spaces for water, rainwater falling on the roof and facades are collected, stored in the subterranean tank for community use and reduce overland flow. This strategy will create a soak suburb, a new suburban typology that emphasizes seasonal coexistence with water and which would be suitable for the block and block-cluster typologies in Windsor, Oxley and Rocklea.
Block and block-cluster typologies located on sloping or valley terrain, for instance, those in Rocklea and Oxley, shallow channels or multiple sunken basins and mounds are designed to be connected to existing stormwater inlets, thereby managing localized stormwater run-off, reducing the impact to waterways. A highly vegetated meandering channel improves infiltration and reduces contaminant levels (Figure 27). The basin and mounds increase the surface area for infiltration and disperse water across the site, capturing water from multiple sources (Figure 28).

Figure 27.
Meandering channel to slow overland flow velocity and filter water before it enters natural waterways. The strategy suits water frontage, park frontage and block-cluster typologies in Rocklea and Oxley.

Figure 28.
Basin and mound strategy with varying sized basins and mounds to slow and capture stormwater for groundwater recharge and filter any water before it enters the waterways. Applicable to all suburbs.
Isolated and isolated-cluster typologies can be converted into decentralized water infrastructure at individual lot scale for capturing, retaining and purifying water, and recharging groundwater. The infrastructure involving a two-basin system or terraced singular basin (Figure 29) can be applied based on the average level of stormwater flows for the location. Earthwork spoils from the bio-basins and swales excavations are redeployed on the site to create strategically located higher grounds, earth mounds of varied sizes and ridges at higher levels (Figure 30). These strategic higher grounds would be vegetated to act as protected refuges for nonhumans during high water levels and across seasons. For water-fronted buyback typology, this can be adapted to create highly vegetated riparian buffers developed through new riparian vegetation regeneration to dissipate fluvial energies while offering space for endemic biodiversity. The water-fronted spaces can be developed into excavated breathing fingers and riparian buffers to dissipate the fluvial energy from the waterways and vegetated to reduce erosion during floods [71].
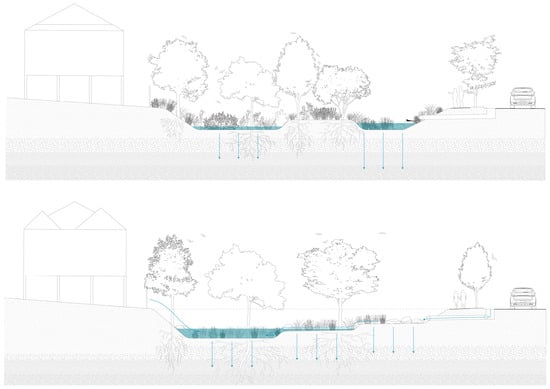
Figure 29.
Roadside isolated buybacks are designed as bio-basins to facilitate water retention and infiltration, with some designs also offering refuge islands (top image). These buybacks would be highly vegetated with tree, herbaceous and native grass species.
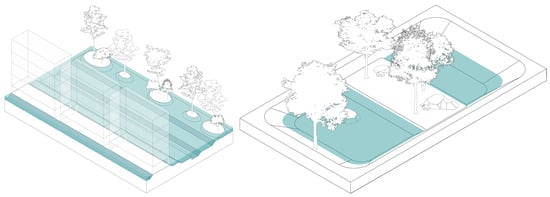
Figure 30.
Raised grounds (mounds) above high water levels to offer refuge during floods (left) and isolated buybacks converted into a moist or wet basin-type refuge (right).
The hydrological strategies applied to buyback land can be collectively extended to other public land to form a suburb scale water infrastructure system (Figure 31) to support the community with flooding and drought while ensuring safe refuge for the other species [66].
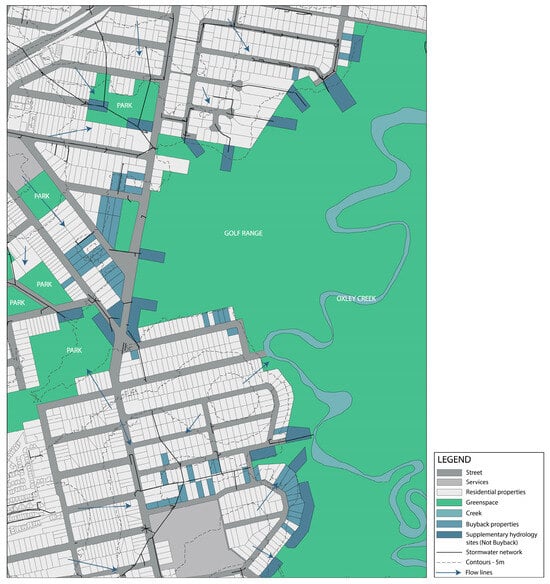
Figure 31.
Possible hydrological system applied to the Oxley suburb, linking the buyback land with the existing parkland to form a larger hydrological system.
5.2.2. Buyback Land for Urban Cooling
In the face of the ongoing climate change, the effects of urban heat, humidity and heatwaves in SEQ will continue to have intensifying effects. Mean annual temperatures in Queensland are projected to increase by 3.8 degrees Celsius, and extreme days to increase by 22 degrees by 2090 [72], with dire health implications associated with extreme heat. From 1990 to 2015 in Australia, extreme heat was responsible for more than 4500 fatalities, compared to 1900 deaths from floods and 970 from bushfires [73]. As noted in Section 3.3, the extensive vegetation loss through the buyback program, irrespective of buyback land typology, has resulted in a highly modified micro-climate and increased sun exposure, exacerbating the effects of urban heat in the suburbs. While the buyback schemes have contributed to the heat problem, buyback land still presents opportunities to mitigate heat effects. This requires a shift in design approach, with designers working with air, light, heat and humidity as materials [74]. The other non-vegetal material selection, such as paving, walling and play surfaces, in these areas should be based on how they behave and respond to thermodynamic processes occurring in a specific space and time, integrating weather as a design substance [75]. The conductive and convective qualities of the materials, their thermal inertia, emissivity, effusivity and ability to absorb heat should take precedence over the traditional design principles of alignment, symmetry, and symbolism. Area-specific climate forces and weather patterns should become the new means of redesigning these spaces to incrementally readjust the micro-climate of the suburbs.
The strategic manipulation of topography can help capture rainwater to help in evaporative cooling for conducive air humidity, combined with revegetation to reduce sun exposure, guide wind flow for convective cooling and offer shading during hot summers (Figure 32). Landscape architects working on these spaces should carefully consider plant species palettes, planting densities and massing to form a mini-suburban forest. Choose varying trees with abundant foliage that create dense shade, such as Harpullia pendula, Elaeocarpus angustifolius and Cupaniopsis anacardioides, and apply special soil treatment to facilitate plant growth and strengthen a new and cool micro-climate quality (Figure 33) [53]. Tree selection should also be based on the tree species which existed before the buyback land clearing. The spatial structures of these spaces should complement the plant selection and planting strategy, allowing for wind flow to facilitate convective cooling. A new approach to future land buyback can help mitigate increasing heat exposure by retaining existing trees, making it easier to enhance cooling through additional planting in the areas where the houses and driveways were located. Vegetation-led cooling should be based on the buyback land typology to maximize their character and size. For instance, isolated buybacks are best for mini-forest and block and block-cluster typologies have potential for medium-size suburban forests, park-fronted as densely planted park extensions and water-fronted typologies into riparian forests forming part of an extended green corridor for cooling and biodiversity.
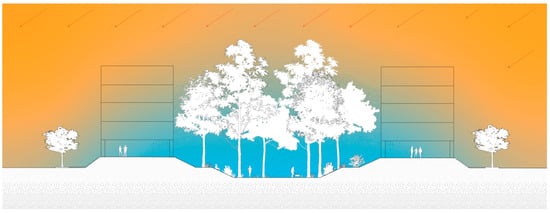
Figure 32.
Isolated cluster buyback, converted into land sunken to capture and retain water for evaporative cooling and highly revegetated to create a cool microclimate (in blue) for human and nonhuman thermal comfort. The increased cooling allows for densification of the lots abutting the buyback land without exacerbating heating effects.
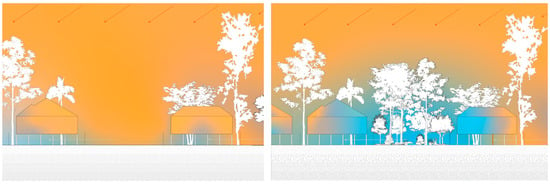
Figure 33.
Air temperature increases (orange) after cutting down trees from an isolated buyback land (left). Air temperature reduction (blue) and cooling of an isolated buyback land after dense revegetation (right).
5.3. Repairing, Recovering and Repurposing Buyback Land
Materials and components from demolished severely flood impacted buyback buildings, along with selected, retained buyback buildings and the buyback land itself and soil, should be considered valuable resources to be recovered, repaired and repurposed on site or offsite. Non-putrescible (non-rotting) materials arising from the demolition, including bricks, stones, timber, concrete and steel can be repurposed on site or offsite. This approach supports urban circularity, reducing waste while addressing the evolving needs of both human and nonhuman communities within buyback suburbs. Such practices can contribute to broader objectives, including repairing contaminated soil, habitat creation and ecological regeneration.
5.3.1. Repairing Soil on Buyback Land
The land acquired from buyback often contains considerable soil contamination, given the intensity of past use and the building demolition process, as discussed in Section 3.3. Before these lands can be put into new use, a process of soil remediation is critical for safe use. Instead of the typical soil remediation process, mycoremediation methods [76] can be employed as a more ecological clearing process to degrade hydrocarbons, pesticides, herbicides and heavy metals. Mulch inoculated with fungi is applied to land post-demolition of the structures (Figure 34). This can be supplemented by bioremediation and phytoremediation methods to create a visually and functionally appealing site during this phase. This transitional phase will decontaminate soil and improve plant tolerance to contamination, thus improving decontamination results and laying down nutrients to support future soil use [77].
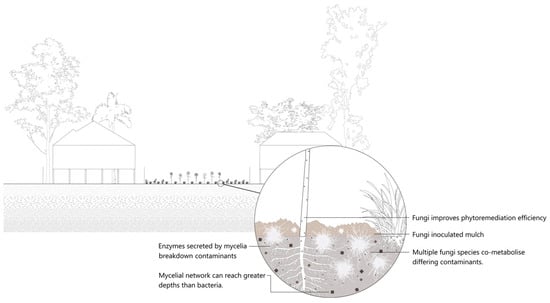
Figure 34.
Mycoremediation and phytoremediation strategy applied to cleared isolated buyback land to decontaminate soil before transitioning the land to a new use.
For all buyback land typologies employing space for water strategy, the mycoforestry approach (Figure 35) would be the most suitable. In this approach, fungi, particularly mycorrhizal and decomposer fungi, are used to support the health of new and established vegetation in urban locations to be more resilient to negative urban effects and ecological shifts due to climate change [78,79]. The buyback land will have enhanced biodiversity and make it suitable for a productive landscape. Mycoforestry can be applied in all buyback land typologies and the positive results from this process can be upscaled and applied to local non-buyback private properties to improve vegetation resilience to climate change effects in the wider suburbs.
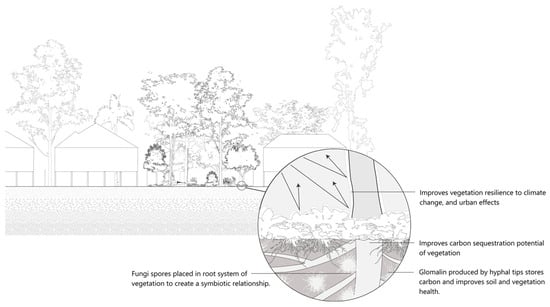
Figure 35.
Mycoforestry approach applied to isolated buyback land for a constructed habitat to improve the resilience of urban vegetation.
For buyback land that have not yet been cleared, the buildings can be selectively left free standing, and biodeterioration [80,81] through fungi can be used to break down and decontaminate the structural materials that cannot be recycled or reused elsewhere, such as contaminated timber, plasterboard or plant-based insulation. This can be achieved by removing reusable materials and components (roofing, windows, pipes, metal framing) and inserting soil inoculated with fungi into the wall and floor cavities (Figure 36). Although considered a slow process, biodeterioration can mitigate impacts of sudden change associated with demolition and gradually transition the retained buildings into a base for habitat repair, creation and regeneration.
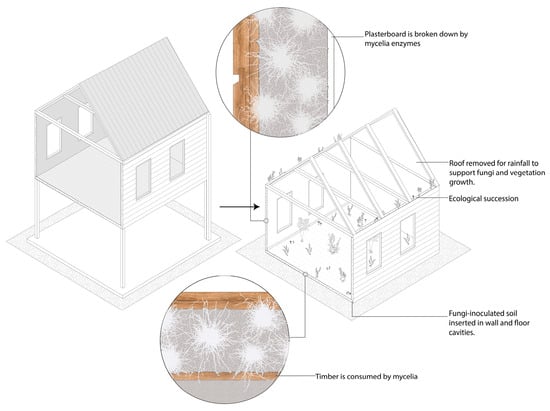
Figure 36.
Biodeterioration tactic applied to a retained building. Any building materials that can be recycled or reused in other projects are disassembled and removed.
5.3.2. Recover and Repurpose—Materials, Buildings and Land
Instead of complete demolition or relocation as currently undertaken, selected buyback buildings, irrespective of the buyback typology, can be left free-standing and repurposed as a habitat or refuge for nonhumans, especially endemic mammals, birds, reptiles, amphibians and invertebrates (Figure 37). Building roofs are transformed to house varying sized hollows in the cavity and roost-supporting materials along the trusses for rodents, bats, possums and birds. Building walls are repurposed to house insect habitats, hollows, shelves and troughs, offering movements and refuge [82]. These should be designed to interact with the surrounding vegetation, creating extended and dynamic habitat conditions and ease of movements especially for lizards and frogs. Where structurally viable, flooring can be removed to open the building to the ground below, allowing selected vegetation to be planted or emerge naturally and the soil inoculated with fungi for remediation. Pipes and gutters can be reused to facilitate small-scale movements offer refuge spots for rodents, possums and lizards, and provide other dynamic structures linked to the abutting highly vegetated habitats [83]. Repurposing the buildings is both critical for reducing buildings waste through circularity and for enhancing biodiversity within the buyback land, the suburb and the city in general [84].
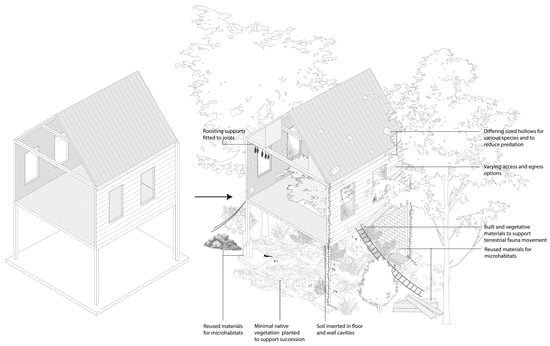
Figure 37.
Buyback Queenslander building left free standing (left image), selectively dismantled and retrofitted, transitioning it to nonhuman inhabitancy with pockets of micro-habitats (right image).
Repurposing buyback buildings into nonhuman habitats and new refuge opportunities will protect nonhuman animals from wildfire, heatwaves, floods, droughts, noise, predators, humans and urban activities (Figure 38). The retained roof with hollows and movement paths from ground level provides refuge from inclement weather. Earth-filled walls protect from noise, heat waves, wind and light. Materials and building components from the houses, concrete, timber planks or plumbing pipes can be stacked on the ground to create sheltered spaces with openings and channels for animals to escape into [82,83]. Trees placed prudently would later grow to create additional cover to manage temperatures and screen artificial lighting from the surroundings. This approach can help foster community empathy for the nonhuman animals through making the spaces partially accessible, allowing the public to engage and learn about these ‘post-human’ structures as habitats. In many ways, this approach also preserves the memory associated with the buildings, albeit in a transformed context where human inhabitation is relinquished for nonhuman habitation.
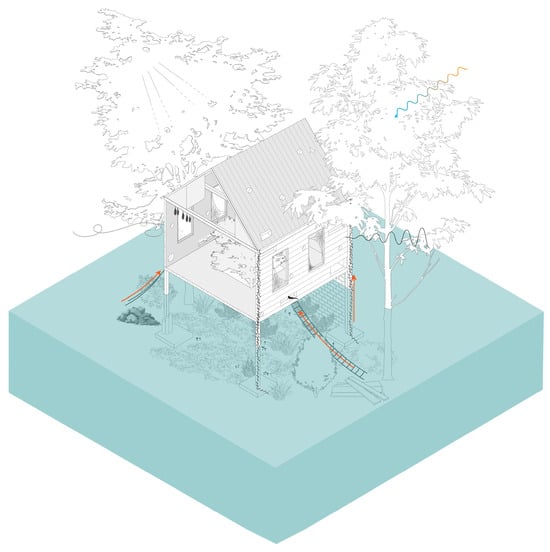
Figure 38.
Adaptive reuse of buyback building for animal refuge. With retrofits for artificial light, noise and temperature reductions while ensuring safe movement paths and flood management.
For direct community benefit, there are opportunities for the adaptive reuse of retained structures for production purposes employed differently based on buyback land typology (Figure 39). The interior of these structures can be retrofitted for hydroponic-based farming, open-air rooftop farming and the ground level beneath the buildings as a space for fungiculture to grow mushrooms with minimal requirements for set up [85,86]. Retained backyard swimming pools can be repurposed for aquaculture, employing modular blocks of aquatic plants to support habitat functions and fish health. This would create a system of diversified food sources utilizing a series of differing productions and leveraging multiple stories, improving yield and reducing impact in the event of a failure from flooding. This enables the community to bounce back faster after flood events. Repurposing land and building into productive spaces can be scaled depending on the buyback land type, for example, the water-fronted type into a floodable urban agriculture.
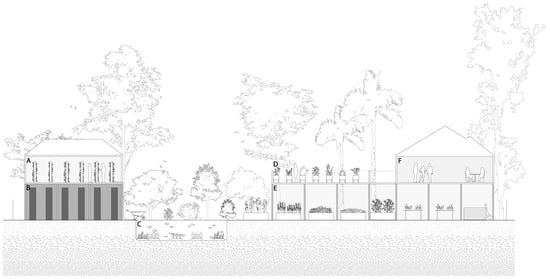
Figure 39.
Adaptive reuse of retained buildings for diverse food production. (A) Hydroponics; (B) fungiculture; (C) aquaculture; (D) open-air rooftop; (E) standard farming; (F) community spaces.
Limitations and Future Research Direction
The flood-prone land buyback program in Brisbane is an ongoing process. It is considered highly sensitive and imbued with politics, which presented limitations to the data we could access from the Brisbane City Council and other stakeholders for this research. The results presented here, in part, are based on data that are evolving. For example, data on all planned buybacks would have a significant influence on the number of each buyback land typology across the suburbs. With increased land buyback, the number of isolated buybacks could significantly reduce due to them transitioning to block typology. Access to community members who went through with the buyback would have shed light on their perception of the land buyback. We have mitigated the impact of these limitations by suggesting strategies which are adaptable across different buyback land typologies. We also did not have data relating to the micro-climatic condition of the buyback lands before the buyback, making it difficult to quantify the impacts of tree clearing on buyback land. We mitigated this by using the available data on the impact of tree clearing across Brisbane. Future research should explore a deeper understanding of the short- and long-term implications of flood-prone land buyback to the relocated and remaining communities. It should also work with First Nations People to examine how the buyback land can offer opportunities to reconnect with the Country and develop a framework for rethinking flood-prone buyback land from an Indigenous Australians’ perspective.
6. Conclusions
This study set out to explore the impacts and opportunities of flood-prone buyback land in the context of ongoing climate change and urban growth. The findings suggest that flood-prone land buyback offers a pathway for affected and vulnerable residents to be safe from recurrent floods and rebuild their lives. How buyback is carried out significantly affects the local communities and the suburban ecosystem, including biodiversity and vegetation loss exacerbating vulnerabilities to other climate-related challenges such as heat and sun exposure. Land acquired through buyback offers opportunities to reshape cities when undertaken alongside measures to address broader environmental, urban planning and design concerns in the face of climate change. The increasing severity and frequency of floods points to more land buyback, a costly and unsustainable process in the light of budgetary constraints at different level of governments. Rather than continuous buyback, cities must reconsider how to maximize the potential of already acquired buyback land and make these lands work harder. By rethinking these areas at multiple scales—city, suburb and site—cities can better protect and adapt the remaining vulnerable properties, reduce the scale or even the need for future buyback and minimize community disruption. Where flood-prone land buyback is inevitable, it should be transitioned from a reactive post-disaster intervention implemented with increased intensity following major floods to an ongoing long-term measure to harness its potential in reimagining cities on the context of climate change and urban growth.
Flood-prone buyback land manifests in different typologies, which although they evolve overtime with more buyback, are critical in understanding the potential of these lands. A deeper understanding of the buyback land typologies, site-specific flood risks and specific impacts of land buyback on communities and ecosystems at different scales is crucial for developing buyback-specific responses. Cities require a comprehensive flood-prone buyback land design framework that outlines the strategies for approaching flood-prone buyback land, including pre- and post-flood planning and community engagements, transition to post-flood community engagements and design of the buyback land for them to add more value to the city beyond flood resilience.
A pre- and post-buyback planning framework underpinned by a multidisciplinary approach is essential to address the environmental, economic, social and cultural dimensions of land buyback. Buyback land strategies must be informed by an understanding of typologies, their hydrological and ecological characteristics and their cultural value to ensure their redesign as resilient landscapes. This approach could reduce reliance on costly disaster relief by redirecting funds to building long-term resilience and adaptation. Engaging both relocated and remaining communities as key stakeholders is critical to fostering greater acceptance, while preserving critical pre-buyback memories can strengthen the continuity of connection to place and enhances community empathy.
Buyback land should be seen as the catalyst for broader urban transformation, addressing not only flood resilience but also challenges such as urban heat, habitat and biodiversity loss and intensification. Involving the First Nations People in healing and reconnection to Country on buyback land is vital. While this research focused on the impacts and opportunities of buyback land resulting from fluvial and pluvial floods, the results have a wider relevance for the design, planning and policy framework for low-lying urban areas including foreshore areas susceptible to coastal floods and sea level rise.
Author Contributions
Conceptualization, D.N. and L.W.; methodology, D.N. and L.W.; software, L.W.; validation, L.W. and D.N.; formal analysis, D.N. and L.W.; investigation, D.N. and L.W.; resources, D.N.; data curation, L.W.; writing—original draft preparation, D.N. and L.W.; writing—review and editing, D.N. and L.W.; visualization, L.W.; supervision, D.N. All authors have read and agreed to the published version of the manuscript.
Funding
This research received no external funding.
Institutional Review Board Statement
Not applicable.
Informed Consent Statement
Not applicable.
Data Availability Statement
Data for this research are available through the corresponding author.
Acknowledgments
We acknowledge support from REALMstudios and Brisbane City Council in running a design studio which inspired this research.
Conflicts of Interest
The authors declare no conflicts of interest.
Abbreviations
The following abbreviations are used in this manuscript:
| VHBB | Voluntary Home Buyback |
| BCC | Brisbane City Council |
| SEQ | South-East Queensland |
| DRFA | Disaster Recovery Funding Arrangements |
References
- Department of Climate Change, Energy, the Environment and Water, Australia State of Environment 2021, Australian Government, Canberra. 2022. Available online: https://soe.dcceew.gov.au/ (accessed on 20 January 2025).
- Otsuyama, K.; Mashiko, T.; Tsukuda, H. Comparative study for underlying concepts of land acquisition during post-disaster recovery in Italy, the United States and Japan. Disaster Prev. Manag. Int. J. 2024, 33, 561–579. [Google Scholar] [CrossRef]
- Stańczuk-Gałwiaczek, M.; Sobolewska-Mikulska, K.; Ritzema, H.; van Loon-Steensma, J.M. Integration of water management and land consolidation in rural areas to adapt to climate change: Experiences from Poland and the Netherlands. Land Use Policy 2018, 77, 498–511. [Google Scholar] [CrossRef]
- Dutch Water Sector, Room for River Programme. 2019. Available online: https://www.dutchwatersector.com/news/room-for-the-river-programme (accessed on 1 February 2025).
- Zavar, E.; Hagelman, R.R., III. Land use change on US floodplain buyout sites, 1990–2000. Disaster Prev. Manag. 2016, 25, 360–374. [Google Scholar] [CrossRef]
- Binder, S.B.; Ritchie, L.A.; Bender, R.; Thiel, A.; Baker, C.K.; Badillo, E.; Goodfellow, S.; Kulp, B.; Weir, P. Limbo: The unintended consequences of home buyout programmes on peripheral communities. Environ. Hazards 2020, 19, 488–507. [Google Scholar] [CrossRef]
- Mannakkara, S.; Wilkinson, S. ‘Build back better’ principles for land-use planning. Proc. Inst. Civ. Eng.-Urban Des. Plan. 2013, 166, 288–295. [Google Scholar] [CrossRef]
- Mitchell, D.; Des Combes, H.J.; Myers, M.; McEvoy, D. Addressing land issues in disaster risk management in the Pacific Island countries. Land Tenure Journal. 2014, 1. Available online: https://eprints.leedsbeckett.ac.uk/id/eprint/5052/ (accessed on 20 January 2025).
- Bates, F.L.; Killian, C.D.; Peacock, W.G. Recovery, change and development: A longitudinal study of the 1976 Guatemalan earthquake. Ekistics 1984, 51, 439–445. [Google Scholar]
- Kousky, C.; Fleming, B.; Berger, A. A Blueprint for Coastal Adaptation: Uniting Design, Economics, and Policy; Island Press: Washington, DC, USA, 2021; pp. 12–14. [Google Scholar]
- Queensland Government. 2024. Available online: https://www.qra.qld.gov.au/resilient-homes-fund/resilient-homes-fund-voluntary-home-buy-back-program (accessed on 18 December 2024).
- Patch, B. Rising to the challenge of post-disaster buybacks and rebuilding. Aust. J. Emerg. Manag. 2023, 38, 15–17. Available online: https://knowledge.aidr.org.au/resources/ajem-april-2023-rising-to-the-challenge-of-post-disaster-buybacks-and-rebuilding/ (accessed on 1 February 2025).
- Comrie, N. Review of the 2010-11 Flood Warnings & Response. Victorian Government. 2011. Available online: http://floodsreview.archive.vic.gov.au/images/stories/documents/review_20101011_flood_warnings_and_response.pdf (accessed on 21 January 2025).
- Flooded Farmers Offered $21m Land Buyback. ABC News. 2011. Available online: https://www.abc.net.au/news/2011-04-27/flooded-farmers-offered-21m-land-buyback/2666692 (accessed on 18 January 2025).
- New South Wales Government. Home Buyback Process—Resilient Home Program. 2024. Available online: https://www.nsw.gov.au/departments-and-agencies/nsw-reconstruction-authority/our-work/resilient-homes-program/home-buybacks/home-buyback-process (accessed on 18 January 2025).
- Cook, M. A River with a City Problem: A History of Brisbane Floods, 2nd ed.; University of Queensland Press: Brisbane, Australia, 2023; pp. 191–208. [Google Scholar]
- Brisbane City Council. 2022 Flood Review. 2022. Available online: https://www.brisbane.qld.gov.au/content/dam/brisbanecitycouncil/corpwebsite/about-council/documents/brisbane-city-council-2022-flood-review.pdf.coredownload.pdf (accessed on 7 January 2025).
- Queensland Government, Resilient Homes Fund Voluntary Home Buy-Back. Available online: https://www.qra.qld.gov.au/sites/default/files/2022-08/fact_sheet_for_the_voluntary_home_buy_back_program_0.pdf (accessed on 19 December 2024).
- Queensland Government. More Queensland Homes to Benefit from Voluntary Home Buybacks, Joint Media Release, The Queensland Cabinet and Ministerial Directory. Available online: https://statements.qld.gov.au/statements/97972 (accessed on 16 December 2024).
- Queensland Government. An overview of the Resilient Home Fund. Available online: https://www.qld.gov.au/housing/buying-owning-home/financial-help-concessions/resilient-homes-fund/overview (accessed on 10 February 2025).
- Lefebvre, M.; Reinhard, J. The Cost of Extreme Weather: Building Resilience in the Face of Disaster. The McKell Institute. 2022. Available online: https://insurancecouncil.com.au/wp-content/uploads/2022/09/McKell_Cost-of-Natural-Disasters_SINGLES_WEB.pdf (accessed on 20 February 2025).
- Jack McKay, Queensland flood buyback program created parks, green spaces in Brisbane, Ipswich, ABC News. Available online: https://www.abc.net.au/news/2024-04-29/qld-flood-buyback-program-parks-green-space-brisbane-ipswich/103772204 (accessed on 14 January 2025).
- Verbeke, J. Design Research in Architecture: An Overview; Fraser, M., Ed.; Ashgate Publishing, Ltd.: Aldershot, UK, 2013; pp. 141–159. [Google Scholar]
- Glanville, R. Researching design and designing research. Des. Issues 1999, 15, 80–91. [Google Scholar] [CrossRef]
- Deming, M.E.; Swaffield, S. Landscape Architectural Research: Inquiry, Strategy, Design; John Wiley & Sons: Hoboken, NJ, USA, 2011. [Google Scholar]
- Rogers, G. Speculation: A Cultural History from Aristotle to AI; Columbia University Press: New York, NY, USA, 2021; p. 3. [Google Scholar]
- Brisbane City Council. Brisbane City Plan 2014. Available online: https://www.brisbane.qld.gov.au/planning-and-building/planning-guidelines-and-tools/brisbane-city-plan-2014 (accessed on 9 January 2025).
- Queensland Government. Queensland Globe. Available online: https://qldglobe.information.qld.gov.au/ (accessed on 19 December 2024).
- Cook, M. A River with a City Problem: A History of Brisbane Floods; University of Queensland Press: Brisbane, Australia, 2023; pp. vi–xiv. [Google Scholar]
- Brisbane City Council. Brisbane River Catchment Flood Study. 2017. Available online: https://www.qra.qld.gov.au/brcfs/brisbane-river-catchment-flood-studies (accessed on 19 December 2024).
- Queensland Government. QImagery. Available online: https://qimagery.information.qld.gov.au/ (accessed on 20 December 2024).
- Nearmap. Available online: https://apps.nearmap.com/maps/#/oygvwkTSQUq2Lyj-5T5emA/@-27.4758406,152.9951691,15.41z,0d/V/20240721 (accessed on 20 December 2024).
- Brisbane City Council. Lord Mayors Taskforce on Suburban Flooding: Strategies to Reduce the Effect of Significant Rain Events on Areas of Brisbane Prone to Flooding. 2005. Available online: http://www.floodcommission.qld.gov.au/__data/assets/file/0017/6425/BCC_Attachment_03_-_Lord_Mayors_Suburban_Taskforce_on_Flooding_Report_Aug_2005.pdf (accessed on 15 January 2025).
- Maruda, D. “9. Answers to Questions of Which Due Notice has been Given: A4”, the 4675 Meeting of the Brisbane City Council Held in the Council Chamber, City Hall, Brisbane, 15/03/2022. Brisbane City Council. Available online: https://docs.brisbane.qld.gov.au/Council%20and%20Committees/2022/03-Mar/15%20Mar/Council/Council%20-%20Agenda%20-%20Ordinary%20-%2015%20Mar%202022%20v2.docx (accessed on 18 January 2025).
- Hutchins, C. Why was Brisbane’s 2022 Flood Different? Griffith University News. 2023. Available online: https://news.griffith.edu.au/2023/05/23/why-was-brisbanes-2022-flood-different/ (accessed on 16 January 2025).
- Department of Resources. Locality Boundaries—Queensland. Version 6.13. Department of Resources, Queensland Government. Queensland Spatial Catalogue. 2024. Available online: https://qldspatial.information.qld.gov.au/catalogue/custom/detail.page?fid={8F24D271-EE3B-491C-915C-E7DD617F95DC} (accessed on 5 July 2024).
- Brisbane City Council. Flood—Awareness—Historic—Brisbane River Floods—Jan–1974. Version 1. Brisbane City Council. 2021. Available online: https://hub.arcgis.com/datasets/56ac9296b23442a4b129ade9ebcfe392_0/about (accessed on 10 July 2024).
- Brisbane City Council. City Plan Mapping 2014. City Plan 2014, Brisbane City Council. Available online: https://cityplan.brisbane.qld.gov.au/eplan (accessed on 15 July 2024).
- Manda, S.; Jerolleman, A.; Marino, E. Assumptions and understanding of success in home buyout programs. Int. J. Disaster Risk reduction 2023, 95, 103863. [Google Scholar] [CrossRef]
- Barile, J.P.; Binder, S.B.; Baker, C.K. Recovering after a natural disaster: Differences in quality of life across three communities after Hurricane Sandy. Appl. Res. Qual. Life 2019, 15, 1151–1159. [Google Scholar] [CrossRef]
- Fothergill, A.; Peek, L. Permanent temporariness: Displaced children in Louisiana. In Displaced: Life in the Katrina Diaspora; Weber, L., Peek, L., Eds.; University of Texas Press: Austin, TX, USA, 2012; pp. 119–143. [Google Scholar]
- Greer, A.; Binder, S.B.; Zavar, E. From Hazard Mitigation to Climate Adaptation: A Review of Home Buyout Program Literature. Hous. Policy Debate 2022, 32, 152–170. [Google Scholar] [CrossRef]
- Hori, M.; Schafer, M.J. Social costs of displacement in Louisiana after Hurricanes Katrina and Rita. Popul. Environ. 2009, 31, 64–86. [Google Scholar] [CrossRef]
- Brisbane City Council. Current Tenders. Available online: https://www.brisbane.qld.gov.au/business-in-brisbane/business-opportunities/selling-to-council/tender-opportunities/current-tenders (accessed on 23 February 2025).
- Nearmap. Map of Housing Bordered by Northey St. and Cullen St., Windsor, Brisbane in 2009. Available online: https://apps.nearmap.com/maps/#/T-VAKlz2R_uelgqENQa5Ew/@-27.4418017,153.0287631,19.00z,0d/V/20091015 (accessed on 16 November 2024).
- Nearmap. Map of Housing Bordered by Northey St. and Cullen St., Windsor, Brisbane in 2020. Available online: https://apps.nearmap.com/maps/#/T-VAKlz2R_uelgqENQa5Ew/@-27.4418017,153.0287631,19.00z,0d/V/20210722 (accessed on 16 November 2024).
- Nearmap. Map of Housing Bordered by Nicholas St. and Taylor St., Windsor, Brisbane in 2022. Available online: https://apps.nearmap.com/maps/#/T-VAKlz2R_uelgqENQa5Ew/@-27.4401074,153.0289169,19.00z,0d/V/20220529 (accessed on 16 November 2024).
- Nearmap. Map of Housing Bordered by Nicholas St. and Taylor St., Windsor, Brisbane in 2024. Available online: https://apps.nearmap.com/maps/#/T-VAKlz2R_uelgqENQa5Ew/@-27.4401074,153.0289169,19.00z,0d/V/20241106 (accessed on 16 November 2024).
- Nearmap. Map of Housing Bordered by Turner Ave., Victoria St., and Crutchley St., Windsor, Brisbane in 2021. Available online: https://apps.nearmap.com/maps/#/T-VAKlz2R_uelgqENQa5Ew/@-27.5060941,153.0207707,18.00z,0d/V/20211120 (accessed on 6 October 2024).
- Nearmap. Map of Housing Bordered by Turner Ave., Victoria St., and Crutchley St., Windsor, Brisbane in 2024. Available online: https://apps.nearmap.com/maps/#/T-VAKlz2R_uelgqENQa5Ew/@-27.5060941,153.0207707,18.00z,0d/V/20240411 (accessed on 6 October 2024).
- Newman, R. Urban Forests: Brisbane Tops Ranking of Australia’s Leafiest Cities. Eco Voice. 2022. Available online: https://www.ecovoice.com.au/urban-forests-brisbane-tops-ranking-of-australias-leafiest-cities-2/ (accessed on 20 April 2025).
- Daniel, C.; Morrison, T.H.; Phinn, S. The governance of private residential land in cities and spatial effects on tree cover. Environ. Sci. Policy 2016, 62, 79–89. [Google Scholar] [CrossRef]
- Chapman, S.; Thatcher, M.; Salazar, A.; Watson, J.E.; McAlpine, C.A. The effect of urban density and vegetation cover on the heat island of a subtropical city. J. Appl. Meteorol. Climatol. 2018, 57, 2531–2550. [Google Scholar] [CrossRef]
- Lerman, S.B.; Larson, K.L.; Narango, D.L.; Goddard, M.A.; Marra, P.P. Humanity for habitat: Residential yards as an opportunity for biodiversity conservation. BioScience 2023, 73, 671–689. [Google Scholar] [CrossRef]
- Rogers, A.M.; Yong, R.Q.; Holden, M.H. The house of a thousand species: The untapped potential of comprehensive biodiversity censuses of urban properties. Ecology 2023, 105, e4225. [Google Scholar] [CrossRef]
- Bergeson, C.B.; Martin, K.L.; Doll, B.; Cutts, B.B. Soil infiltration rates are underestimated by models in an urban watershed in central North Carolina, USA. J. Environ. Manag. 2022, 313, 115004. [Google Scholar] [CrossRef]
- Gillman, L.N.; Bollard, B.; Leuzinger, S. Calling time on the imperial lawn and the imperative for greenhouse gas mitigation. Glob. Sustain. 2023, 6, e3. [Google Scholar] [CrossRef]
- Queensladn Government. Home Buy-Back Demolitions Giving a New Lease of Life to Building Materials. Available online: https://www.qra.qld.gov.au/news-case-studies/case-studies/home-buy-back-demolitions-giving-new-lease-life-building-materials (accessed on 15 May 2025).
- Five Mile Radius. Available online: https://www.fivemileradius.org/?srsltid=AfmBOopXG5k3oZCarueqm2nuQ0aNvLsTlFgU9ZTa5codm7xXoqH24Nk3 (accessed on 12 May 2025).
- Brisbane City Council. Flood—Awareness—Overland Flow. Version 4. Brisbane City Council, 26/10/2021. Available online: https://hub.arcgis.com/datasets/aafd9ba82f704038a31332067039fa28_0/about (accessed on 11 July 2024).
- Smith, G.; Fox, A.; Klondike, T.; Black, A.; Henkel, C.; Vaughn, B.; Biswas, C.; Bhattarai, S.; Gyawali, S. Open Space Management Guide Building Community Capacity to Program FEMA-Funded Housing Buyout Land. 2023. Available online: https://www.researchgate.net/publication/368713687_OPEN_SPACE_MANAGEMENT_GUIDE_Building_Community_Capacity_to_Program_FEMA-Funded_Housing_Buyout_Land (accessed on 18 November 2024).
- Brisbane City Council. Brisbane Floodwise Report. Available online: https://fam.brisbane.qld.gov.au/?page=Map---Standard (accessed on 12 May 2025).
- Tanner, B. Hanlon Park (Bur’uda) Waterway Rejuvenation. Bligh Tanner. 2023. Available online: https://blightanner.com.au/project/hanlon-park-redevelopment/ (accessed on 20 April 2025).
- Tanner, B. Small Creek. Bligh Tanner. 2020. Available online: https://blightanner.com.au/project/small-creek/ (accessed on 19 April 2025).
- Knights, D. Wetland dreaming: Water in high-density developments. Landsc. Archit. Aust. 2025, 185, 60–63. [Google Scholar]
- Zhang, L.; Ye, Z.; Shibata, S. Assessment of rain garden effects for the management of urban storm runoff in Japan. Sustainability 2020, 12, 9982. [Google Scholar] [CrossRef]
- Bureau of Meteorology (BOM). Flood Warning System for the Brisbane River Below Wivenhoe Dam to Brisbane City. BOM, Australian Government. 2019. Available online: http://www.bom.gov.au/qld/flood/brochures/brisbane_lower/brisbane_lower.pdf (accessed on 10 May 2025).
- Hydrology and Risk Consulting (HARC). February 2022 Flood Event: Report on the Operation of Somerset Dam and Wivenhoe Dam. Seqwater. 2022. Available online: https://www.seqwater.com.au/sites/default/files/2023-01/Somerset%20Dam%20and%20Wivenhoe%20Dam%20-%2025%20February%20-%209%20March%202022%20flood%20event%20report_0.pdf (accessed on 19 April 2025).
- Cooperative Research Centre for Water Sensitive Cities. White Gum Valley: A Waterwise Way of Living (Case Study). CRC for Water Sensitive Cities. 2017. Available online: https://watersensitivecities.org.au/wp-content/uploads/2017/06/Case_Study_White_Gum_Valley.pdf (accessed on 18 April 2025).
- London, G.; Bertram, N.; Sainsbury, O.; Todorovic, T. Infill Typologies Catalogue; CRC For Water Sensitive Cities: Melbourne, Australia, 2020. [Google Scholar]
- Mathur, A.; Cunha, D.P. Fingers of High Ground. In Structures for Coastal Resilience; Seavitt, C., Nordenson, G., Chapman, J., Eds.; Island Press: Washington, DC, USA, 2018; pp. 111–115. [Google Scholar]
- Queensland Future Climate Heatwaves. Available online: https://www.longpaddock.qld.gov.au/qld-future-climate/adapting/heatwaves/ (accessed on 21 January 2025).
- Risk Frontiers. Heatwave Fatalities in Australia: A New Analysis. Available online: https://riskfrontiers.com/insights/heatwave-fatalities-in-australia-a-new-analysis/#:~:text=At%20least%20473%20heat%2Drelated,occurred%20within%20or%20near%20buildings (accessed on 21 January 2025).
- Phillippe, R. Climatic Architecture; Actar Publishers: New York, NY, USA, 2023; pp. 14–15. [Google Scholar]
- Silvia, B. Atmospheres Anatomies: On Design, Weather and Sensation; Lars Mullar Publishers: Zurich, Switzerland, 2021; pp. 13–16. [Google Scholar]
- Dinakarkumar, Y.; Ramakrishnan, G.; Gujjula, K.R.; Vasu, V.; Balamurugan, P.; Murali, G. Fungal bioremediation: An overview of the mechanisms, applications and future perspectives. Environ. Chem. Ecotoxicol. 2024, 6, 293–302. [Google Scholar] [CrossRef]
- Wang, F.; Fang, L.; Shi, Z. Bioremediation of Contaminated Soil by Fungi: A Call for Research. J. Fungi 2024, 10, 684. [Google Scholar] [CrossRef] [PubMed]
- Nikota, K. Mycology Applications for Landscape Architecture. Master’s Thesis, Guelph University, Guelph, ON, Canada, 2018. [Google Scholar]
- Chang, S.T.; Wasser, A.P. The Cultivation and Environmental Impact of Mushrooms; Oxford Research Encyclopedia of Environmental Science: Oxford, UK, 2017. [Google Scholar] [CrossRef]
- Kazemian, N.; Pakpour, S.; Milani, A.S.; Klironomos, J. Environmental factors influencing fungal growth on gypsum boards and their structural biodeterioration: A university campus case study. PLoS ONE 2019, 14, e0220556. [Google Scholar] [CrossRef]
- Tatum, G.; Brenkus, N. Hurricane-Induced Biodeterioration of Wood Structures: A State-of-the-Art Review. Nat. Hazards Rev. 2023, 24. [Google Scholar] [CrossRef]
- Dobraszczyk, P. Animal Architecture: Beasts, Buildings and Us; Reaktion Books: London, UK, 2023; pp. 113–150. [Google Scholar]
- Watchorn, D.J.; Cowan, M.A.; Driscoll, D.A.; Nimmo, D.G.; Ashman, K.R.; Garkaklis, M.J.; Wilson, B.A.; Doherty, T.S. Artificial habitat structures for animal conservation: Design and implementation, risks and opportunities. Front. Ecol. Environ. 2022, 20, 301–309. [Google Scholar] [CrossRef]
- Ruoso, L.E.; Retamal, M.; Talwar, S.; McLean, L. Integrating Circular Economy, Climate Change and Biodiversity. Current Practices and Future Directions. Prepared by the Institute for Sustainable Futures, University of Technology Sydney and Circular Australia. 2025. Available online: https://circularaustralia.com.au/wp-content/uploads/2025/03/Integrating-Circular-Economy-Climate-Biodiversity.pdf (accessed on 19 April 2025).
- City of Victoria. Growing Food and Gardening in Mixed-Use, Multi-Unit Residential Developments. City of Victoria. 2019. Available online: https://www.victoria.ca/media/file/growing-food-and-gardening (accessed on 20 April 2025).
- Szopińska-Mularz, M. Adaptive Reuse for Urban Food Provision; Cities and Nature Springer International Publishing: Cham, Switzerland, 2022. [Google Scholar]
Disclaimer/Publisher’s Note: The statements, opinions and data contained in all publications are solely those of the individual author(s) and contributor(s) and not of MDPI and/or the editor(s). MDPI and/or the editor(s) disclaim responsibility for any injury to people or property resulting from any ideas, methods, instructions or products referred to in the content. |
© 2025 by the authors. Licensee MDPI, Basel, Switzerland. This article is an open access article distributed under the terms and conditions of the Creative Commons Attribution (CC BY) license (https://creativecommons.org/licenses/by/4.0/).