Article

Methodology for Increasing Urban Greenery According to the 3-30-300 Concept: A Warsaw Case Study

by
Katarzyna Siok
and
Bartłomiej Wyrzykowski
*
Institute of Geospatial Engineering and Geodesy, Faculty of Civil Engineering and Geodesy, Military University of Technology, 00-908 Warsaw, Poland
*
Author to whom correspondence should be addressed.
Sustainability 2025, 17(12), 5563; https://doi.org/10.3390/su17125563
Submission received: 7 May 2025 / Revised: 7 June 2025 / Accepted: 13 June 2025 / Published: 17 June 2025
(This article belongs to the Special Issue Spatial Analysis and GIS for Sustainable Land Change Management)

Abstract

:
The article presents an innovative methodology supporting sustainable urban development through the strategic expansion of green infrastructure in Warsaw, based on the 3-30-300 concept. The proposed approach integrates a multi-criteria Fuzzy Analytic Hierarchy Process (F-AHP) with Geographic Information System (GIS) tools, enabling objective and precise identification of suitable locations for new parks of at least 1 hectare in size. The analysis considers five key factors: distance from populated areas, land cover and use, surface temperature, proximity to nuisance facilities, and an NDVI index value. The study results demonstrated a significant increase in green space accessibility across the city. In all districts of Warsaw, the number of residential buildings meeting the criterion of a maximum 300 m distance to a park or forest increased—from 2% in Rembertów to 32% in Wilanów. The districts of Ursynów and Wilanów exceeded the 30% green space coverage threshold, while Białołęka reached 29%. These results indicate the real potential to achieve the goals of the 3-30-300 concept, contributing simultaneously to sustainable urban development, improved quality of life, mitigation of the urban heat island effect, increased biodiversity, and enhanced climate change adaptation. Spatial limitations related to high-density development were also identified—many districts lack available space for large parks. A viable solution supporting balanced development may lie in implementing smaller green forms, such as green squares or micro-parks, particularly in areas of planned development. The proposed methodology serves as a practical tool to support land-use management and sustainable spatial planning, addressing contemporary environmental, social, and urban challenges.

1. Introduction

The presence of green spaces is one of the fundamental pillars of high quality of life in both urban and suburban areas. The proximity and broad accessibility of such areas enhance the residents’ living comfort, contribute to climate improvement, and support the psychophysical well-being of the local community. It is also worth noting that, in addition to these obvious advantages, the presence of green spaces reflects the level of sustainable urban development. Research conducted by Maas, J. et al. [1] confirmed a strong correlation between the absence of green spaces and the occurrence of anxiety and depressive disorders. Moreover, the greatest benefits from the proximity of greenery were observed among children and individuals with a low socio-economic status. This relationship has also been noted by Zhang, Y. et al. [2], who observed that green spaces have a significant impact on mood enhancement and increased feelings of happiness, which in turn contribute to stress reduction and may have a meaningful effect on overall health.
Although it is widely accepted that green spaces have a significant impact on residents’ health and quality of life, assessing whether a city can be considered “green” remains highly subjective and dependent on individual perspectives. The perception of greenery in urban spaces is not based solely on objective data, such as the total area or accessibility of green spaces, but also on the personal preferences, needs, and experiences of the inhabitants. For some, a “green city” means having a park just a few steps away from their house; for others, it is characterized by streets immersed in lush vegetation and densely planted trees. The difficulty in providing a clear definition of a “green city” also stems from cultural and geographical differences, as well as the specifics of local urban planning. This notion is supported by the results of a survey conducted among a group of 142 individuals [3]. The survey results show that over 65% of respondents consider their district to be rich in diverse forms of greenery, while only 26% hold an opposite view, and the remaining participants have no clear opinion. These findings are surprising when compared to earlier studies [4], indicating that the availability of green spaces in the surveyed area is not particularly high. An interesting aspect of the survey is the hierarchy of preferences regarding types of greenery. Parks and standalone trees emerged as the most valued ones (25% of respondents), followed by an equal preference for squares, lawns, and shrubs (11.48%), while the remaining categories received less than 10% of responses. These results illustrate how diverse expectations toward urban greenery can be, and how subjective its perception truly is. The selection of respondents was deliberately diverse and included students as well as academic and administrative staff, which allowed for the collection of a broad spectrum of opinions and perspectives.

1.1. The 3-30-300 Green City Concept

The discrepancy between the actual state of urban greenery and its social perception has prompted researchers and urban planners to seek new, standardized tools for objectively assessing the quality of the urban environment. One of the more well-known proposals in this area is the 3-30-300 rule, developed by Professor Cecil Konijnendijk from the University of British Columbia [5]. According to this concept, every residence should have a view of at least three trees, 30 percent of each neighborhood’s surface area should be covered with vegetation, and a park or forest should be accessible within a distance of no more than 300 m. These principles are detailed in the publication titled “Evidence-based guidelines for greener, healthier, more resilient neighbourhoods: Introducing the 3-30-300 rule” [5], and an attempt to empirically verify them was made by a research team who conducted a survey among 1716 residents of Florida [6]. Although the results showed that access to green spaces significantly influences perceived quality of life in urban areas, the methodology used—based solely on respondents’ subjective opinions—did not allow for a clear assessment of how well the studied locations aligned with the 3-30-300 criteria. The absence of spatial data and measurable indicators limited the ability to validate the concept under real-world conditions.
The 3-30-300 concept has become the foundation for a range of studies focused on modeling urban space and analyzing the accessibility of green areas. One such example is the study entitled “Using the 3-30-300 Indicator to Evaluate Green Space Accessibility and Inequalities: A Case Study of Montreal, Canada” [7]. This research revealed significant disparities in access to green spaces in Montreal, where only 19.4% of the surface area of city districts meets all three criteria of the 3-30-300 concept. The greatest deficits in green space accessibility were found in the central and peripheral districts of the city. Moreover, the results indicated a strong correlation between green space availability and socio-economic factors such as economic dependency and housing instability. Other researchers [8] explored the applicability of the 3-30-300 concept in managing urban greenery in smaller towns, using airborne laser scanning (ALS) and OpenStreetMap (OSM) data. The study was conducted in five medium-sized Polish towns: Świdnik, Wyszków, Czempiń, Jasień, and Mrocza. The findings showed that tree visibility was the most variable parameter depending on the adopted assumptions and their strictness. The results indicated that the average percentage of buildings that met the tree visibility criterion (assuming at least one observer sees three or more trees) exceeds 80%. When the criterion is met by half of all observers, the average drops to approximately 50%. However, when as many as 90% of observers must see three or more trees, the share of buildings meeting this requirement falls to just around 25%. Tree canopy cover was low in most of the analyzed towns, with the exception of Jasień. Meanwhile, the availability of green spaces within 300 m varied depending on the size of the study areas.

1.2. Importance of Multi-Criteria Analysis

In addition to the analyses presenting the current state of green areas, the development of new, methodical approaches to planning future green spaces is crucial for increasing their presence. One such example is a study that focused on the application of multi-criteria analysis (MCA) based on a GIS system to identify suitable locations for green spaces in the rapidly developing city of Sululta, Ethiopia [9]. The suitability criteria adopted in the study included: high population density, proximity to residential areas, land slope, distance from roads, elevation, type of vegetation cover, proximity to water sources, land visibility, and the presence of flood-prone areas. The analysis showed that as much as 47% of the city’s area is suitable for development as urban green space. The results highlight how modern spatial analysis techniques can significantly support urban planning processes, contributing to the creation of greener and more sustainable cities. Multi-criteria analysis was also applied in a study that identified the most suitable locations for green space development in Lilongwe [10], with the aim of improving the well-being of residents and mitigate the effects of rapid urbanization, such as air pollution and biodiversity loss. This study also highlighted the lack of effective green space planning models in developing countries. The issue is of key importance, as it not only allows for assessing the potential to increase greenery within city limits but also for accurately pinpointing the areas where such changes may be effectively implemented. Innovative methods of green space planning enable better alignment of urban environments with the expectations and needs of residents, contributing to improved quality of life. As a result, cities can not only protect their existing green assets but also strategically expand green coverage in a thoughtful, efficient, and ecologically aligned manner.
Unfortunately, there is a lack of comprehensive studies that would consistently integrate existing green city concepts, such as the 3-30-300 principle, with practical methods that indicate specific directions and locations for the changes required to implement these assumptions. Such research is essential to translate the theoretical model into actionable urban planning strategies. In response to this research gap, efforts have been initiated to apply multi-criteria analysis (MCA) to determine potential directions for change that will support the development of a green city in line with the 3-30-300 concept. These studies aim to increase the degree to which individual components of the concept are fulfilled by designating new green areas. What distinguishes this approach is its consideration of a wide range of factors, such as the availability of vacant land, the condition of existing green infrastructure, and residents’ priorities. This enables more precise, multidimensional, and sustainable urban planning that will harmonize human needs with environmental protection requirements and contribute to the creation of cities that will be more livable for both current and future generations.

1.3. Study Objectives

Accordingly, the aim of this study was to assess the impact of increasing the area of green spaces through the designation of new urban park locations on meeting the requirements of the 3-30-300 concept. The research builds upon previous works focused on implementing the principles of the 3-30-300 framework and identifying pilot areas that fulfill its individual criteria [4], as well as studies on determining the locations of new urban parks using the F-AHP multi-criteria analysis method [11]. In this study, the authors adapted the previously proposed multi-criteria analysis method to the conditions of a large city, with particular emphasis on the required 300 m proximity to a park. Additionally, the extent to which potential new urban parks would increase the areas meeting the 30% tree canopy cover requirement was examined.
The study was guided by two main research questions:
  • Where in the city can new parks be established?
  • What impact would the new parks have on fulfilling 30% tree canopy cover and 300 m proximity criteria of the green city concept proposed by Cecil Konijnendijk?
The research presented here focused on the city of Warsaw, which is commonly perceived as relatively green. However, previous analyses indicated that the distribution of greenery in the capital is highly uneven. While densely built-up central districts offer few opportunities for spatial changes, newly developing areas are dominated by modern real estate expansion, often neglecting the issue of providing residents with adequate green spaces. As a result, the areas that meet the assumptions of the 3-30-300 concept are mainly concentrated in older residential neighborhoods built in previous decades and in districts with single-family housing.
This spatial pattern highlights the need for a more conscious approach to urban planning in order to balance the city’s development with the preservation and expansion of green spaces, especially in newly urbanized zones.

2. Methodology

The research consisted of four main stages. The first step involved identifying the criteria that determine the location of new urban parks. This was a key stage, having the greatest impact on the accuracy of the final result. The second step focused on determining the importance of the selected criteria and assigning appropriate weights to them. In the next step, a suitability map for the location of urban parks was developed. The final task involved assessing the impact of increasing green areas on meeting the conditions of the 3-30-300 concept, which defines the status of a green city. The study was conducted for the area of Warsaw, the capital of Poland.

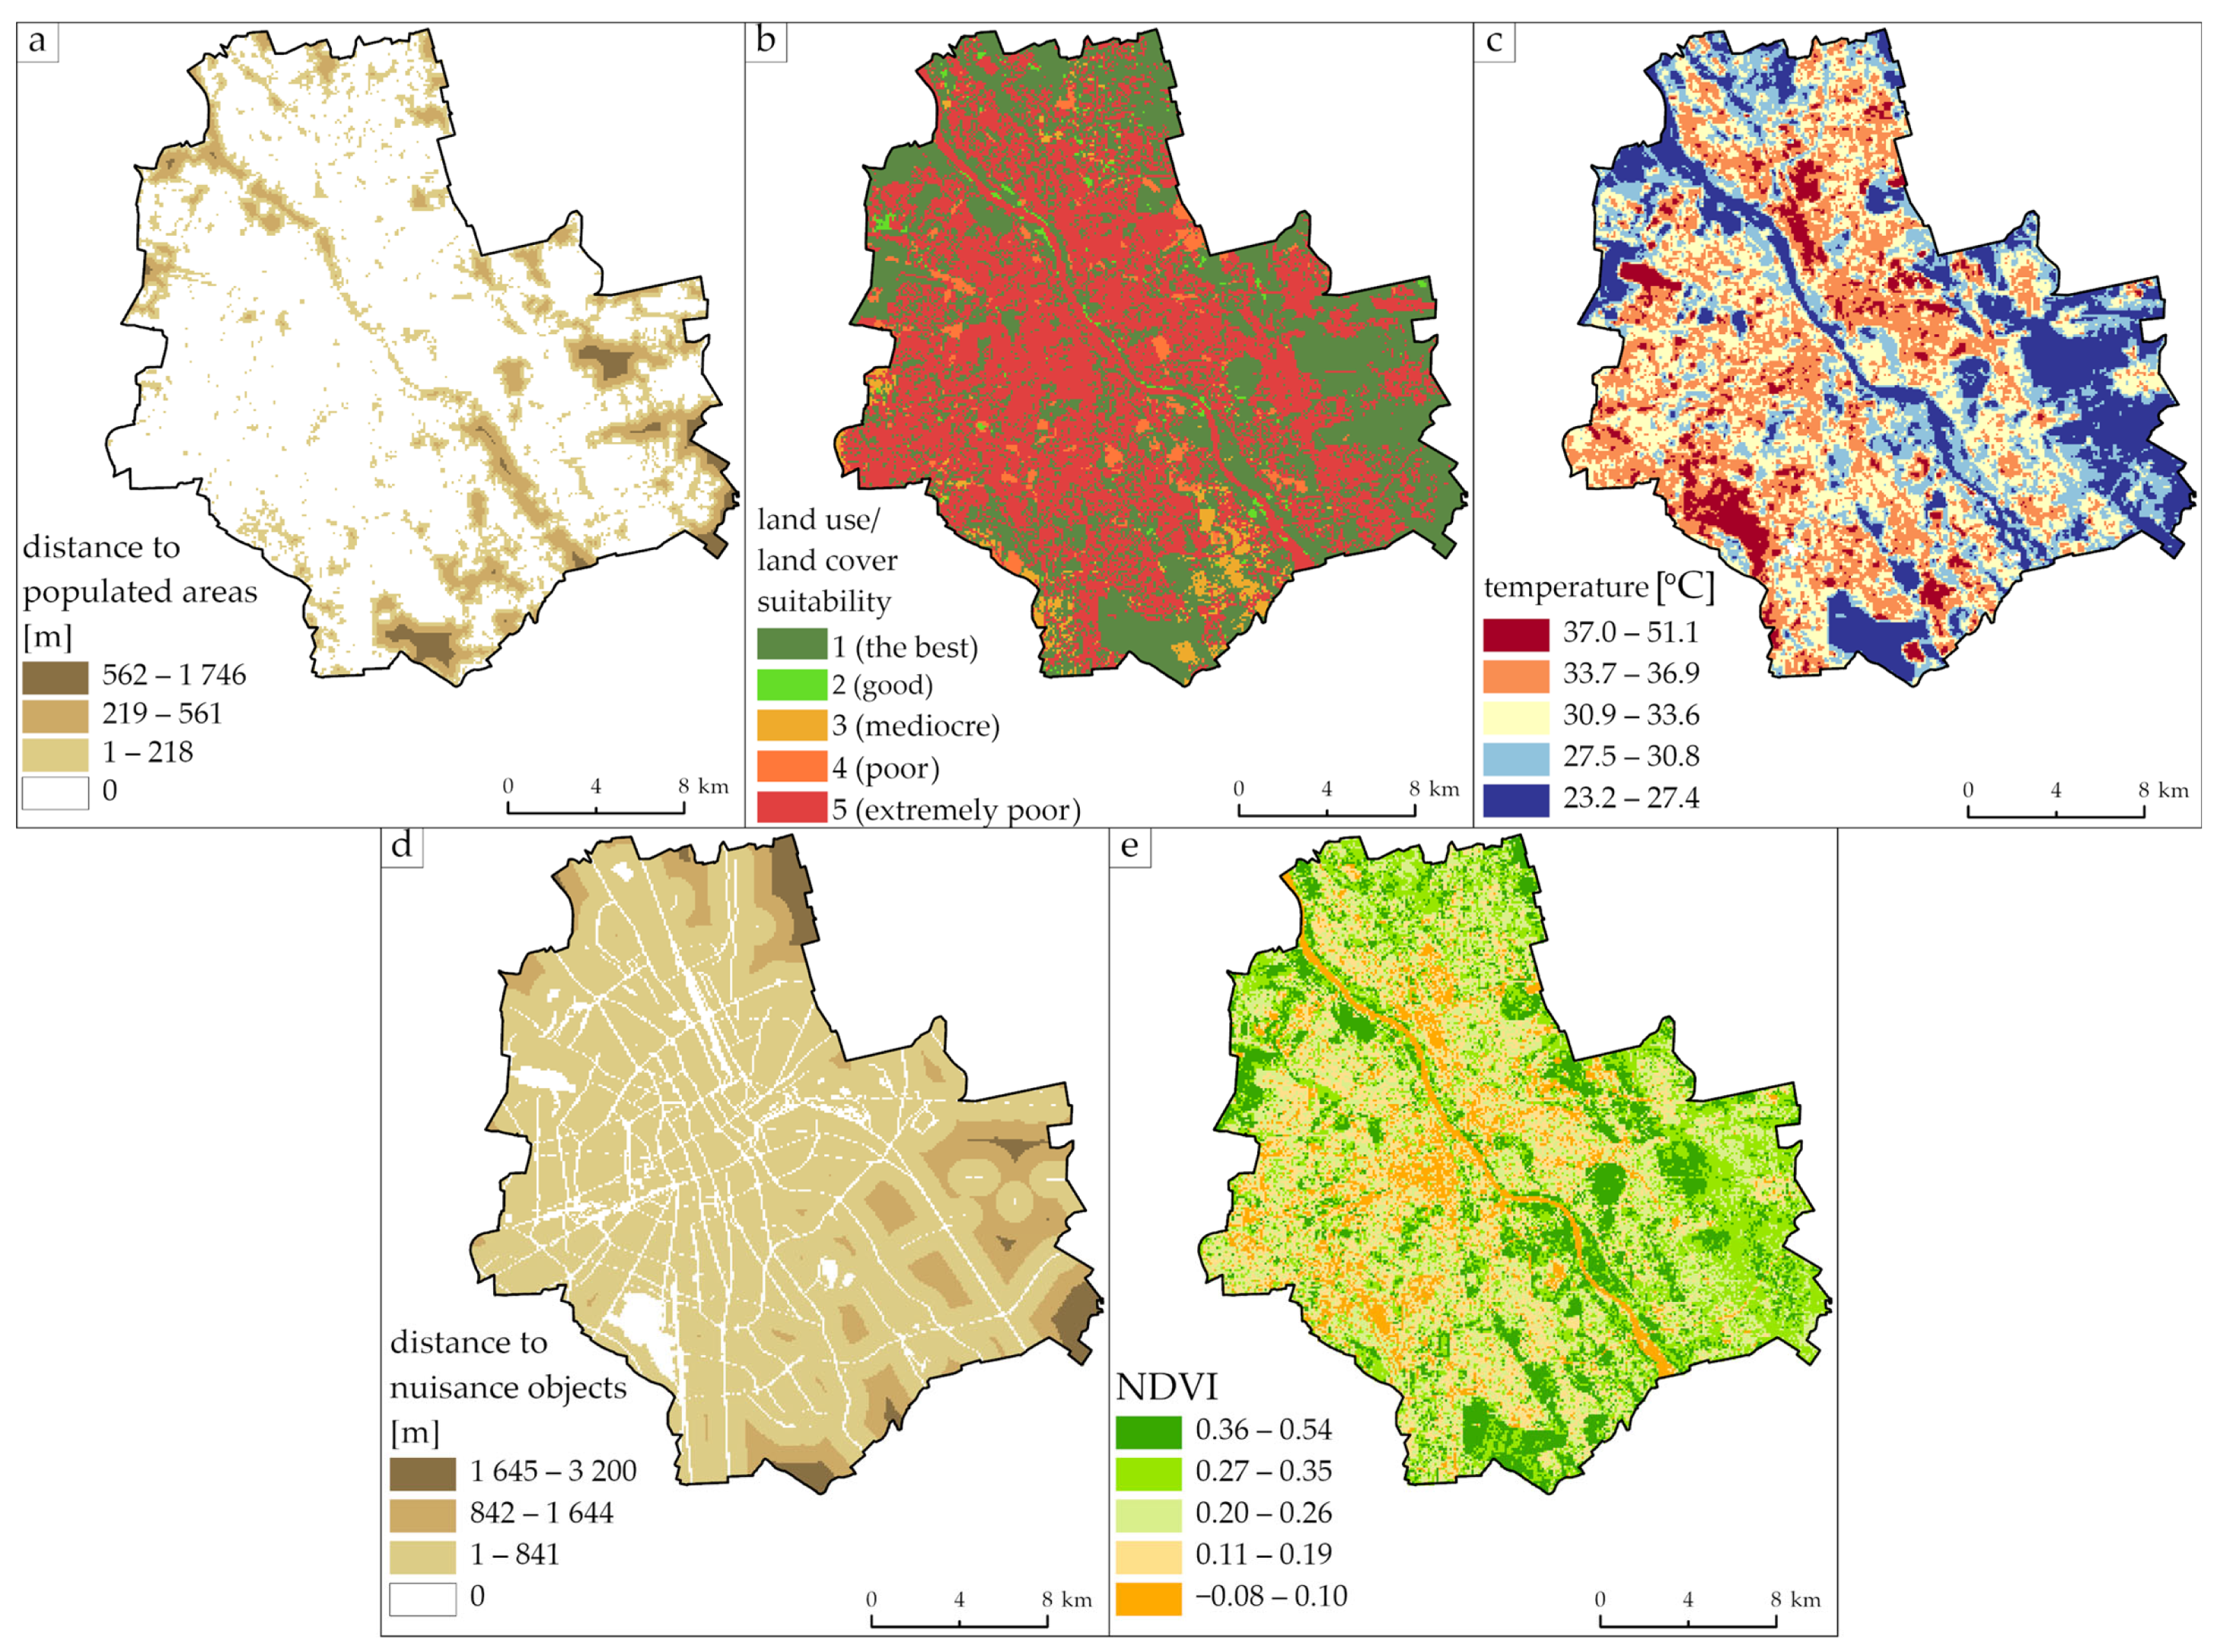
2.1. Determination of Criteria

The identification of the criteria that determine the location of new urban parks and the assessment of their level of importance were based on a literature review, analysis of the study area and available spatial data, as well as on the opinions of a representative group of respondents, including specialists in geoinformatics and spatial planning, and residents of the study area. The expert group included employees (55% of respondents) and students (13% of respondents) from the Faculty of Civil Engineering and Transport at the Military University of Technology. Residents from various districts of Warsaw comprised the remaining 33% of respondents. The goal was to identify a set of factors that would have the relatively greatest impact on the location of new urban greenery, while also ensuring the universality of the proposed methodology.
Ultimately, five environmental and social criteria listed below were adopted:
  • Distance to populated areas
  • Land cover/land use
  • Surface temperature
  • Distance to nuisance facilities
  • NDVI (Normalized Difference Vegetation Index)
The distance to populated areas was an important factor due to the assumptions of the green city concept under consideration, which emphasize the proximity of parks to residential buildings. According to the assessment, the areas located closest to populated areas are the most suitable for locating urban parks. Another criterion was land cover/land use. This factor allows for taking into account the physical possibilities of building a new city park. An assessment of the suitability of land cover/land use types was conducted. The results of the applied hierarchy are presented in Table 1.
The third important criterion was surface temperature. The choice of this factor is related to the need to include in the study areas of soils that are bare or sparsely covered with vegetation as potential sites for park development. These areas require greater investment, but they offer physical possibilities for the establishment of a city park. Therefore, it was assumed that the higher the surface temperature, the more suitable the area will be for creating a new park.
Another criterion is the distance to nuisance facilities. Objects that generate excessive noise, unpleasant odors, or noticeable vibrations were considered nuisances, in particular expressways, railway tracks, excavations, waste disposal sites, heat and power plants, power plants, gasworks, sewage treatment plants, waste disposal plants, and airports. It was assessed that areas located farther from such nuisance objects are more suitable for locating a city park. The last important factor was the NDVI value, which is an effective indicator of the developmental state and condition of vegetation. It ranges from −1 to 1, where negative values mean no vegetation [12,13]. Taking the NDVI value into account allows for the categorization of areas with physical possibilities for building a park (i.e., areas with exposed soils and covered with vegetation). It was assumed that the higher the Normalized Difference Vegetation Index, the more suitable the area is for creating a park.

2.2. Determination of Criteria Weights

The key factors for the location of new city parks were quantified. The weight values of the criteria were determined using one of the Multi-Criteria Analysis (MCA) methods—the Fuzzy Analytic Hierarchy Process (F-AHP). The F-AHP method was developed by integrating the Analytic Hierarchy Process (AHP) method [14,15] with fuzzy sets theory [16]. The classical AHP is a powerful tool for solving complex decision-making problems [17,18]. It stands out from other multi-criteria evaluation methods through its problem structuring and simplicity of implementation [19]. However, pure AHP also has some shortcomings. One of them is the lack of consideration of the uncertainty related to expressing the opinion of decision-makers with precise numerical values, which has a significant impact on the result of using the AHP method [18,20,21]. The solution that enables the elimination of the subjective nature of the assessment consists in using fuzzy expert opinions [11,19,22,23]. As a result, F-AHP has emerged as a widely adopted method for multi-criteria decision-making. It has been applied in various fields, including agriculture [24,25], logistics [26,27], sustainable development management [28,29], risk analysis [30], and determining the location of green infrastructure [11,31,32,33].
The first step of the F-AHP method involves pairwise comparison of the adopted criteria and determining the relative importance of one factor with respect to another using integers from 1 to 9. The value 1 means that the compared criteria are equivalent, while the value 9 signifies that the first factor is strongly preferred over the second one. If the second factor is more important, the following fractions are used: 1 2 ,   1 3 ,   1 4 ,   1 5 ,   1 6 ,   1 7 ,   1 8 ,   a n d   1 9 [15]. The values of the assessments provided by the respondents are recorded in a square matrix A = [ a i j ] (Table 2). When constructing the comparison matrix A, the following rules are applied: each criterion is equivalent to itself a i i = 1 and the value of criterion “j” in relation to “i” is the inverse of the value of criterion “i” in relation to “j” a j i = 1 a i j .
Then, matrix A is transformed into its fuzzy form, A ~ = a i j ~   (Table 3), by assigning the values of matrix A the corresponding triangular fuzzy numbers, as defined in Table 4. Replacing the crisp values with fuzzy sets constitutes the fundamental difference between F-AHP and AHP [19].
The middle value of triangular fuzzy numbers is equal to the comparative value from the traditional AHP matrix. The upper (uij)and the lower (lij) values are determined using the fuzzification factor Δ = 1 [34]. In the case when criterion “j” has preference over “i”, the inverse of the fuzzy numbers listed in Table 2 should be applied analogously. For example, if in the classical AHP approach the value “ 1 2 ” is used, its fuzzy equivalent is 1 2 ~ = ( 1 3 , 1 2 , 1 1 ) .
Successively, r i ~ (1) is determined—the geometric mean of fuzzy comparison values of criterion “i”, thus obtaining a third-order matrix and w i ~ (2)—fuzzy weights of each criterion [18,36].
r i ~ = ( a i 1 ~ a i j ~ a i n ~ ) 1 / n
w i ~ = r i ~ ( r 1 ~ r i ~ r n ~ ) 1
where each term is defined as follows:
a i j ~ = ( l i j , a i j , u i j ) ;
w i ~ = ( l w i , a w i , u w i ) , w i , a w i   a n d   u w i denote the lower, middle, and upper value of the fuzzy weights for criterion “i” respectively;
operation of multiplication of the fuzzy number is equal a i 1 ~ a i 2 ~ = l i 1 , a i 1 , u i 1 l i 2 , a i 2 , u i 2 = ( l i 1 l i 2 , a i 1 a i 2 , u i 1 u i 2 ) for l i 1 , l i 2 , a i 1 , a i 2 , u i 1 , u i 2 > 0 ;
operation of addition of the fuzzy number is equal a i 1 ~ a i 2 ~ = l i 1 , a i 1 , u i 1 l i 2 , a i 2 , u i 2 = ( l i 1 + l i 2 , a i 1 + a i 2 , u i 1 + u i 2 ) [18,34].
The final weights N i are obtained by calculating the arithmetic mean of the fuzzy weights for each criterion “i” (3) and normalizing the arithmetic mean value (4) [35].
M i = l w i + a w i + u w i 3
N i = M i i = 1 n M i
In order to verify the reliability and consistency of the respondents’ assessments, two indices were calculated: the Consistency Index—CI (5) and the Consistency Ratio—CR (6) The CR and CI indices were proposed by the developer of the AHP method, Thomas Saaty. They are the standard for assessing the consistency of pairwise comparison matrices and are simple to calculate and interpret [19,34,37].
C I = λ m a x n n 1
C R = C I R I
where each term is defined as follows:
λ m a x denotes the largest eigenvalue of the preference matrix;
n is the dimension of the preference matrix;
RI is the random index proposed by Saaty for decision-making problems with number of alternatives “n” not exceeding 15 (Table 5).
The first step to determine the value of λ m a x was the defuzzification of the fuzzy preference matrix. For this purpose, the mean with dominance was calculated according to Formula (7) [38,39].
d e f ( a i j ~ ) = ( l i j + 4 ×   a i j + u i j ) / 6
Then, the columns of the resulting matrix B = [ b i j ] were normalized (the sum of the values of each column = 1) and the priority vector W = [ w i ] was computed. The priority vector is the arithmetic mean of the rows of the normalized matrix B. Next, the weighted sum criteria X = [ x i ] was calculated (8).
X = B W
The maximum eigenvalue λ m a x was determined from Formula (9) [35,40].
λ m a x = i = 1 n x i w i n
The lower the value of the calculated Consistency Index (CI), the greater the consistency in the assessments of the relative importance of the criteria. A result of CI = 0 and CR = 0 indicates perfect consistency of the respondents’ evaluations. The acceptable threshold for CI is 0.1. If this value is exceeded, the preference information provided by the respondents should be verified [34,35,41].
During the study, ten respondents assessed the degree of importance of pairwise compared factors. Then, each resulting preference matrix was transformed into a fuzzy matrix and averaged. The consistency of the obtained results was subsequently checked. The defuzzification of the fuzzy preference matrix yielded values that were consistent with those presented in Table 6.
The Consistency Index (CI) and Consistency Ratio (CR) values calculated based on the above matrix are 0.04 (<0.10) and 0.03, respectively. These values indicate that the data provided by the respondents are consistent.
Subsequently, based on the fuzzy preference matrix, the geometric mean matrix of the fuzzy comparison values, the fuzzy weight matrix, and the normalized weight values (with the sum equal to 1) for each criterion were determined. The results are presented in Table 7.
As a result of the significance analysis of the identified criteria for the location of urban parks using the F-AHP method, it was found that the most important factor is the distance from densely populated areas (weight = 0.46). Land cover/land use was also identified as a significant factor, with a weight of 0.34. Surface temperature was assigned a weight of 0.10. The least important criteria were the distance to nuisance facilities and NDVI values. In this context, “significance” refers to the relative importance assigned by stakeholders during the pairwise comparison process.

2.3. Development of a Land Suitability Map for Urban Park Locations

To generate the final land suitability map, the Weighted Linear Combination (WLC) method was employed within a GIS environment. All input factors, represented as raster layers, were first standardized to a common scale ranging from 0 to 1. Each standardized layer was then multiplied by the corresponding weight (Table 7: Normalized Weights) and summed according to Formula (10) [42,43].
S = i = 1 n N i r i
where:
N i is the weight of the criterion;
r i denotes the criterion value (value of pixel).
The output is a raster map representing the land suitability for locating urban parks, based on the five selected factors.

2.4. Assessment of the Impact of Increasing Green Space Area on Meeting the Requirements of the 3-30-300 Concept

The final stage of the study focused on assessing the increase in green space by identifying areas suitable for the development of urban parks in accordance with the 3-30-300 green city concept. The areas with the highest suitability, as determined using the proposed methodology, were compared with the results obtained in [4]. The conditions of the 3-30-300 concept were verified [5]. The first condition requires that 30% of a city’s district area be covered by vegetation, while the second one stipulates that every residential building should be located no farther than 300 m from the nearest park or forest.
Previous studies [4] included the verification of the 3-30-300 concept both for all green areas in the city (including, for example, lawns) and exclusively for parks (tree-covered areas). Since, according to the assumptions of the 3-30-300 concept, this condition applies specifically to parks, only these areas were considered in the present analysis. Moreover, in line with the guidelines [44], only areas with a minimum size of 1 hectare were taken into account. The analysis examined the extent to which the share of residential buildings meeting the 3-30-300 criteria increased in individual districts of Warsaw after including the newly designated areas for urban parks.

3. Case Study

3.1. Test Area

Warsaw, as the capital and largest city of Poland, serves as a significant point of reference for research on urban green space planning in major metropolitan areas of Central and Eastern Europe. Located in the center of the country, within the Mazowieckie Voivodeship, the city covers an area of 512 km2 and has a population of nearly 1.86 million (as of 2023) [45]. Its administrative structure consists of 18 districts with diverse types of development and population density—from the highly urbanized Mokotów district (with over 225,000 residents) to the less intensively used Rembertów (with around 24,000). The high average population density of 3600 people per km2 [46] places considerable pressure on public spaces, necessitating effective management of access to green areas.
Despite challenging urban conditions, Warsaw has a relatively extensive network of green spaces, including both large urban parks and smaller natural enclaves and forests. Among the most important recreational areas are parks such as Łazienki Królewskie, Pole Mokotowskie, and Park Skaryszewski, which serve as key reference points for residents across many districts. However, the distribution of green spaces is uneven—central districts are better equipped with well-maintained parks, while peripheral areas often rely on more scattered and less structured forms of greenery.
This spatial variation, along with the city’s historical background, plays a crucial role in understanding its current natural landscape. It is important to recall that Warsaw was almost completely destroyed during World War II, and its post-war reconstruction followed modernist principles focused primarily on functionality and rapid urbanization, with limited attention given to ecological needs. As a result, many public spaces were developed in an environmentally unfriendly manner, dominated by concrete and a lack of greenery.
A turning point in the city’s approach to urban greenery came only after 1989. Although the early years of the transformation focused mainly on the development of technical and commercial infrastructure, the past decade has seen a clear shift toward sustainable development and ecological urban planning. Increasing emphasis is being placed on improving the quality of the urban environment, which is reflected in specific programs implemented by the city authorities.
One of the most recognizable recent initiatives is the “Million Trees” project [47], which involves a large-scale tree-planting campaign across Warsaw. The project actively engages the local community—residents can suggest locations for new plantings via the dedicated “Warszawa 19115” mobile app. As a result, greenery is introduced precisely where it is most needed. In parallel, the “Green Streets” program [48] represents a more comprehensive approach to greening public spaces. Its goal is not only to increase the number of plantings but also to transform the structure and function of greenery along the city’s main thoroughfares.

3.2. Data and Pre-Processing

This part of the study involved preparing raster data as a spatial representation of the adopted criteria.
Data on land cover/land use and nuisance facilities were downloaded in the vector “shapefile” format from the Topographic Objects Database, BDOT10k, made available through the central access point to the Polish Spatial Data Infrastructure via the www.geoportal.gov.pl platform. This database provides the spatial location of topographic objects along with their basic descriptive attributes. The content and level of detail of the BDOT10k generally correspond to those of a traditional 1:10,000 scale topographic map [49]. Vector data on land cover/land use were classified according to Table 1 and converted into raster format. The resulting raster contained values from 1 to 5, representing areas from most to least suitable, respectively. Nuisance facilities, distributed across several BDOT10k layers, were merged into one vector layer, and Euclidean distances from these features were then calculated.
Population density data were obtained from the Global Human Settlement Layer (GHSL) project. The data were downloaded in raster form in the epoch 2020, with a spatial resolution of 100 m [50]. The raster was transformed into the current Polish national coordinate system (PL-1992, EPSG 2180), which is also used for BDOT10k data. Subsequently, after classifying the raster into populated and unpopulated areas and converting it to vector format, Euclidean distances from populated areas were determined.
Surface temperature and NDVI values were obtained based on Landsat-9 imagery from 13 August 2024, available on the EarthExplorer portal [51]. Surface temperature data in degrees Celsius were derived by converting the Surface Temperature Band (ST_B10) of the Landsat Collection 2 Level-2 Surface Temperature product [52,53]. NDVI values were calculated using the red (Band 4) and near-infrared (Band 5) channels from the Collection 2 Level-2 Surface Reflectance product.
With the use of the above data, five rasters were generated (Figure 1), representing: grouped land cover/land use classes, distance from nuisance facilities, distances from populated areas, surface temperature values, and NDVI values. The data were normalized to a range from 0 to 1 using a linear fuzzy membership function (Table 8).
The concept of the fuzzy set, introduced in 1965 by L.A. Zadeh [16], was applied here. It allows for intermediate values within the [0, 1] range, where 0 in this case represents areas unsuitable for the development of an urban park, and 1 represents areas with very high suitability [32]. The results are presented in Figure 2.

4. Results

4.1. Current State of Greenery in Warsaw

The results show that in most districts of Warsaw, buildings rarely meet all three criteria of the 3-30-300 concept [4]—their share usually does not exceed 15% (Figure 3). The exceptions are Bielany, Rembertów, Wesoła, and Wawer, where this percentage is significantly higher than 15%. Rembertów, Wesoła, and Wawer are particularly noteworthy, as more than half of the buildings in these districts meet the 3-30-300 standards. Wawer achieves the best results—in this district, over 70% of buildings fulfill all three requirements. Interestingly, the best-performing districts are located on the outskirts of the city. These areas are characterized by a predominance of single-family houses, a large number of gardens, and the presence of forested areas.
Failure to meet all three of the concept’s criteria is largely due to the insufficient number of parks located close to apartments, and their uneven distribution across the city. Figure 4 shows the spatial distribution of buildings that are within 300 m from the nearest park or forest larger than 1 ha. The map shows that the best situation (over 50% of buildings) is in districts located in the north (Bielany, Białołeka) and the east of the city (Rembertów, Wawer, and Wesoła). This group of districts also includes central districts—Ochota and Śródmieście, due to the fact that these districts have several large parks, such as Łazienkowski Park, Saski Garden, and Szczęśliwicki Park. Only in the Wesoła district, more than 70% of the buildings meet the 300 m condition in the 3-30-300 concept.

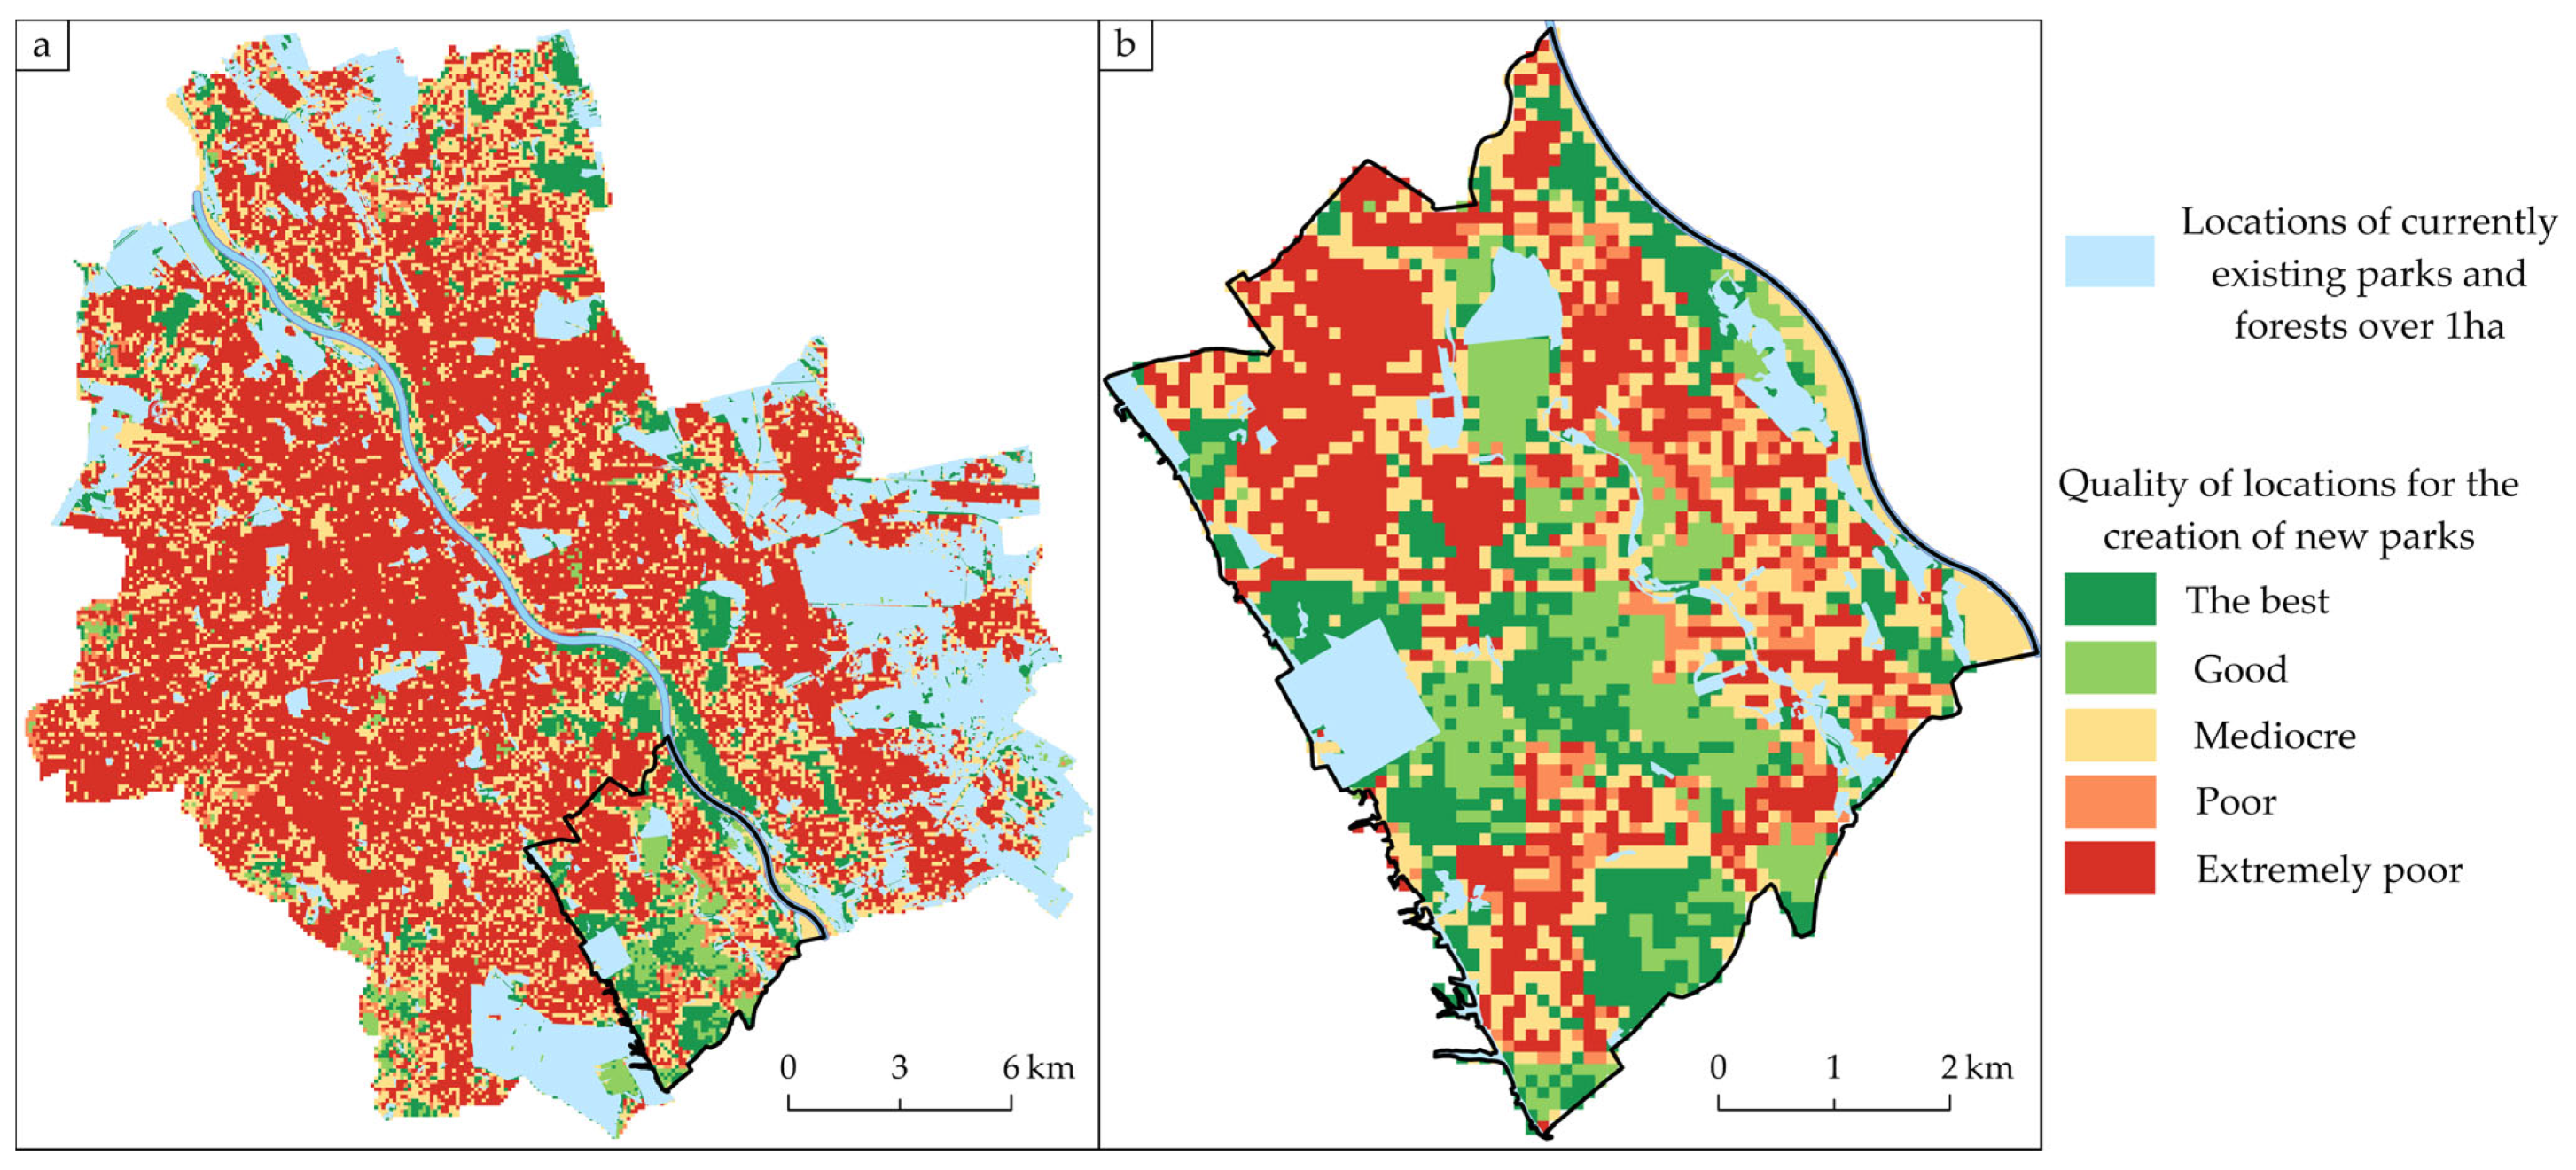
4.2. Areas Suitable for the Creation of Parks or Forests Larger than 1 Hectare

The designated areas for potential new urban park locations in Warsaw are presented in Figure 5. The map uses a division into qualitative categories illustrating the suitability of each area for park creation. Five levels of quality were distinguished: from the best locations, through average ones, to areas that are unsuitable for establishing new green spaces. Additionally, existing parks larger than 1 hectare are marked on the map (in blue), making it easier to compare green space availability across different parts of the city. Most of Warsaw’s parks and forests are situated on the outskirts of the city, with a noticeable concentration in the eastern part of the city.
The total area of existing parks and forests within the territory of Warsaw is 9918 hectares, while the area of the highest-suitability zones located outside the currently analyzed green spaces amounts to 3210 hectares. By including areas classified as “good”, the potential area for new parks increases by 1106 hectares. “The best” and “good” areas are primarily found near the Vistula River, on the outskirts of northern districts, and, most notably, in the southern part of the capital.
Although it may seem that there is little room left for new parks, the analysis shows that there are still relatively many potential locations available, with the highest number identified in the Wilanów district (Figure 5b).

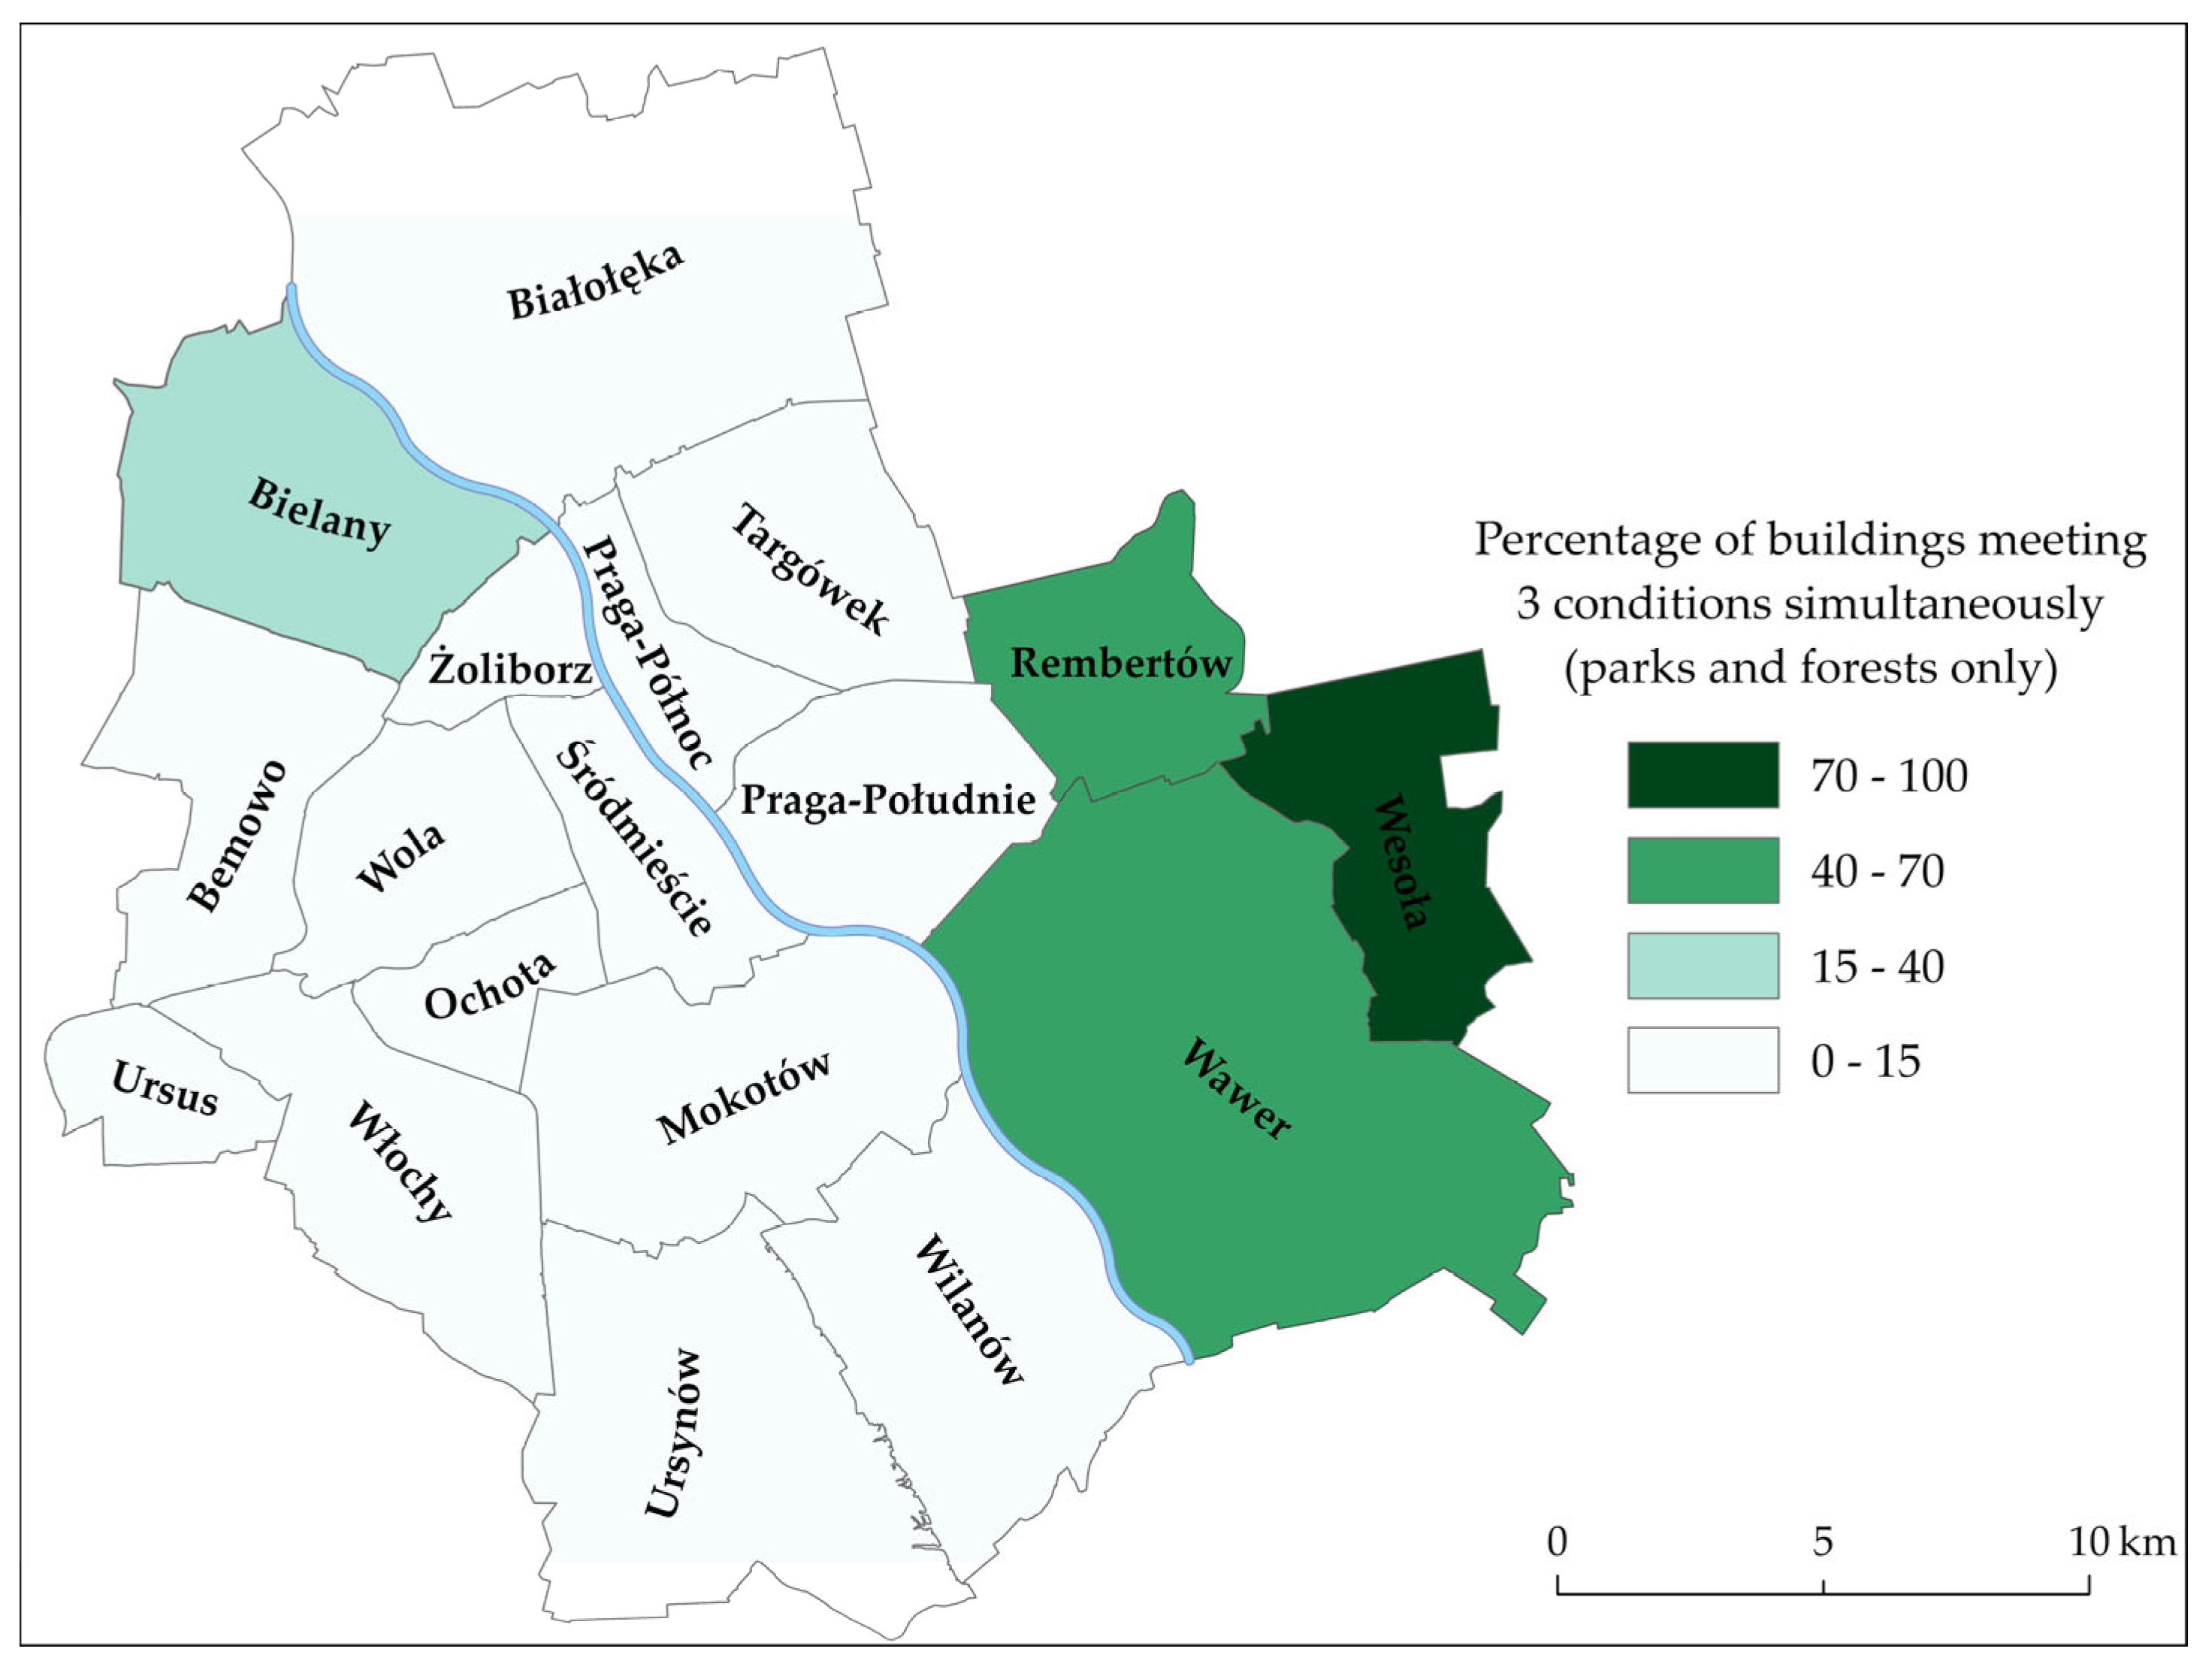
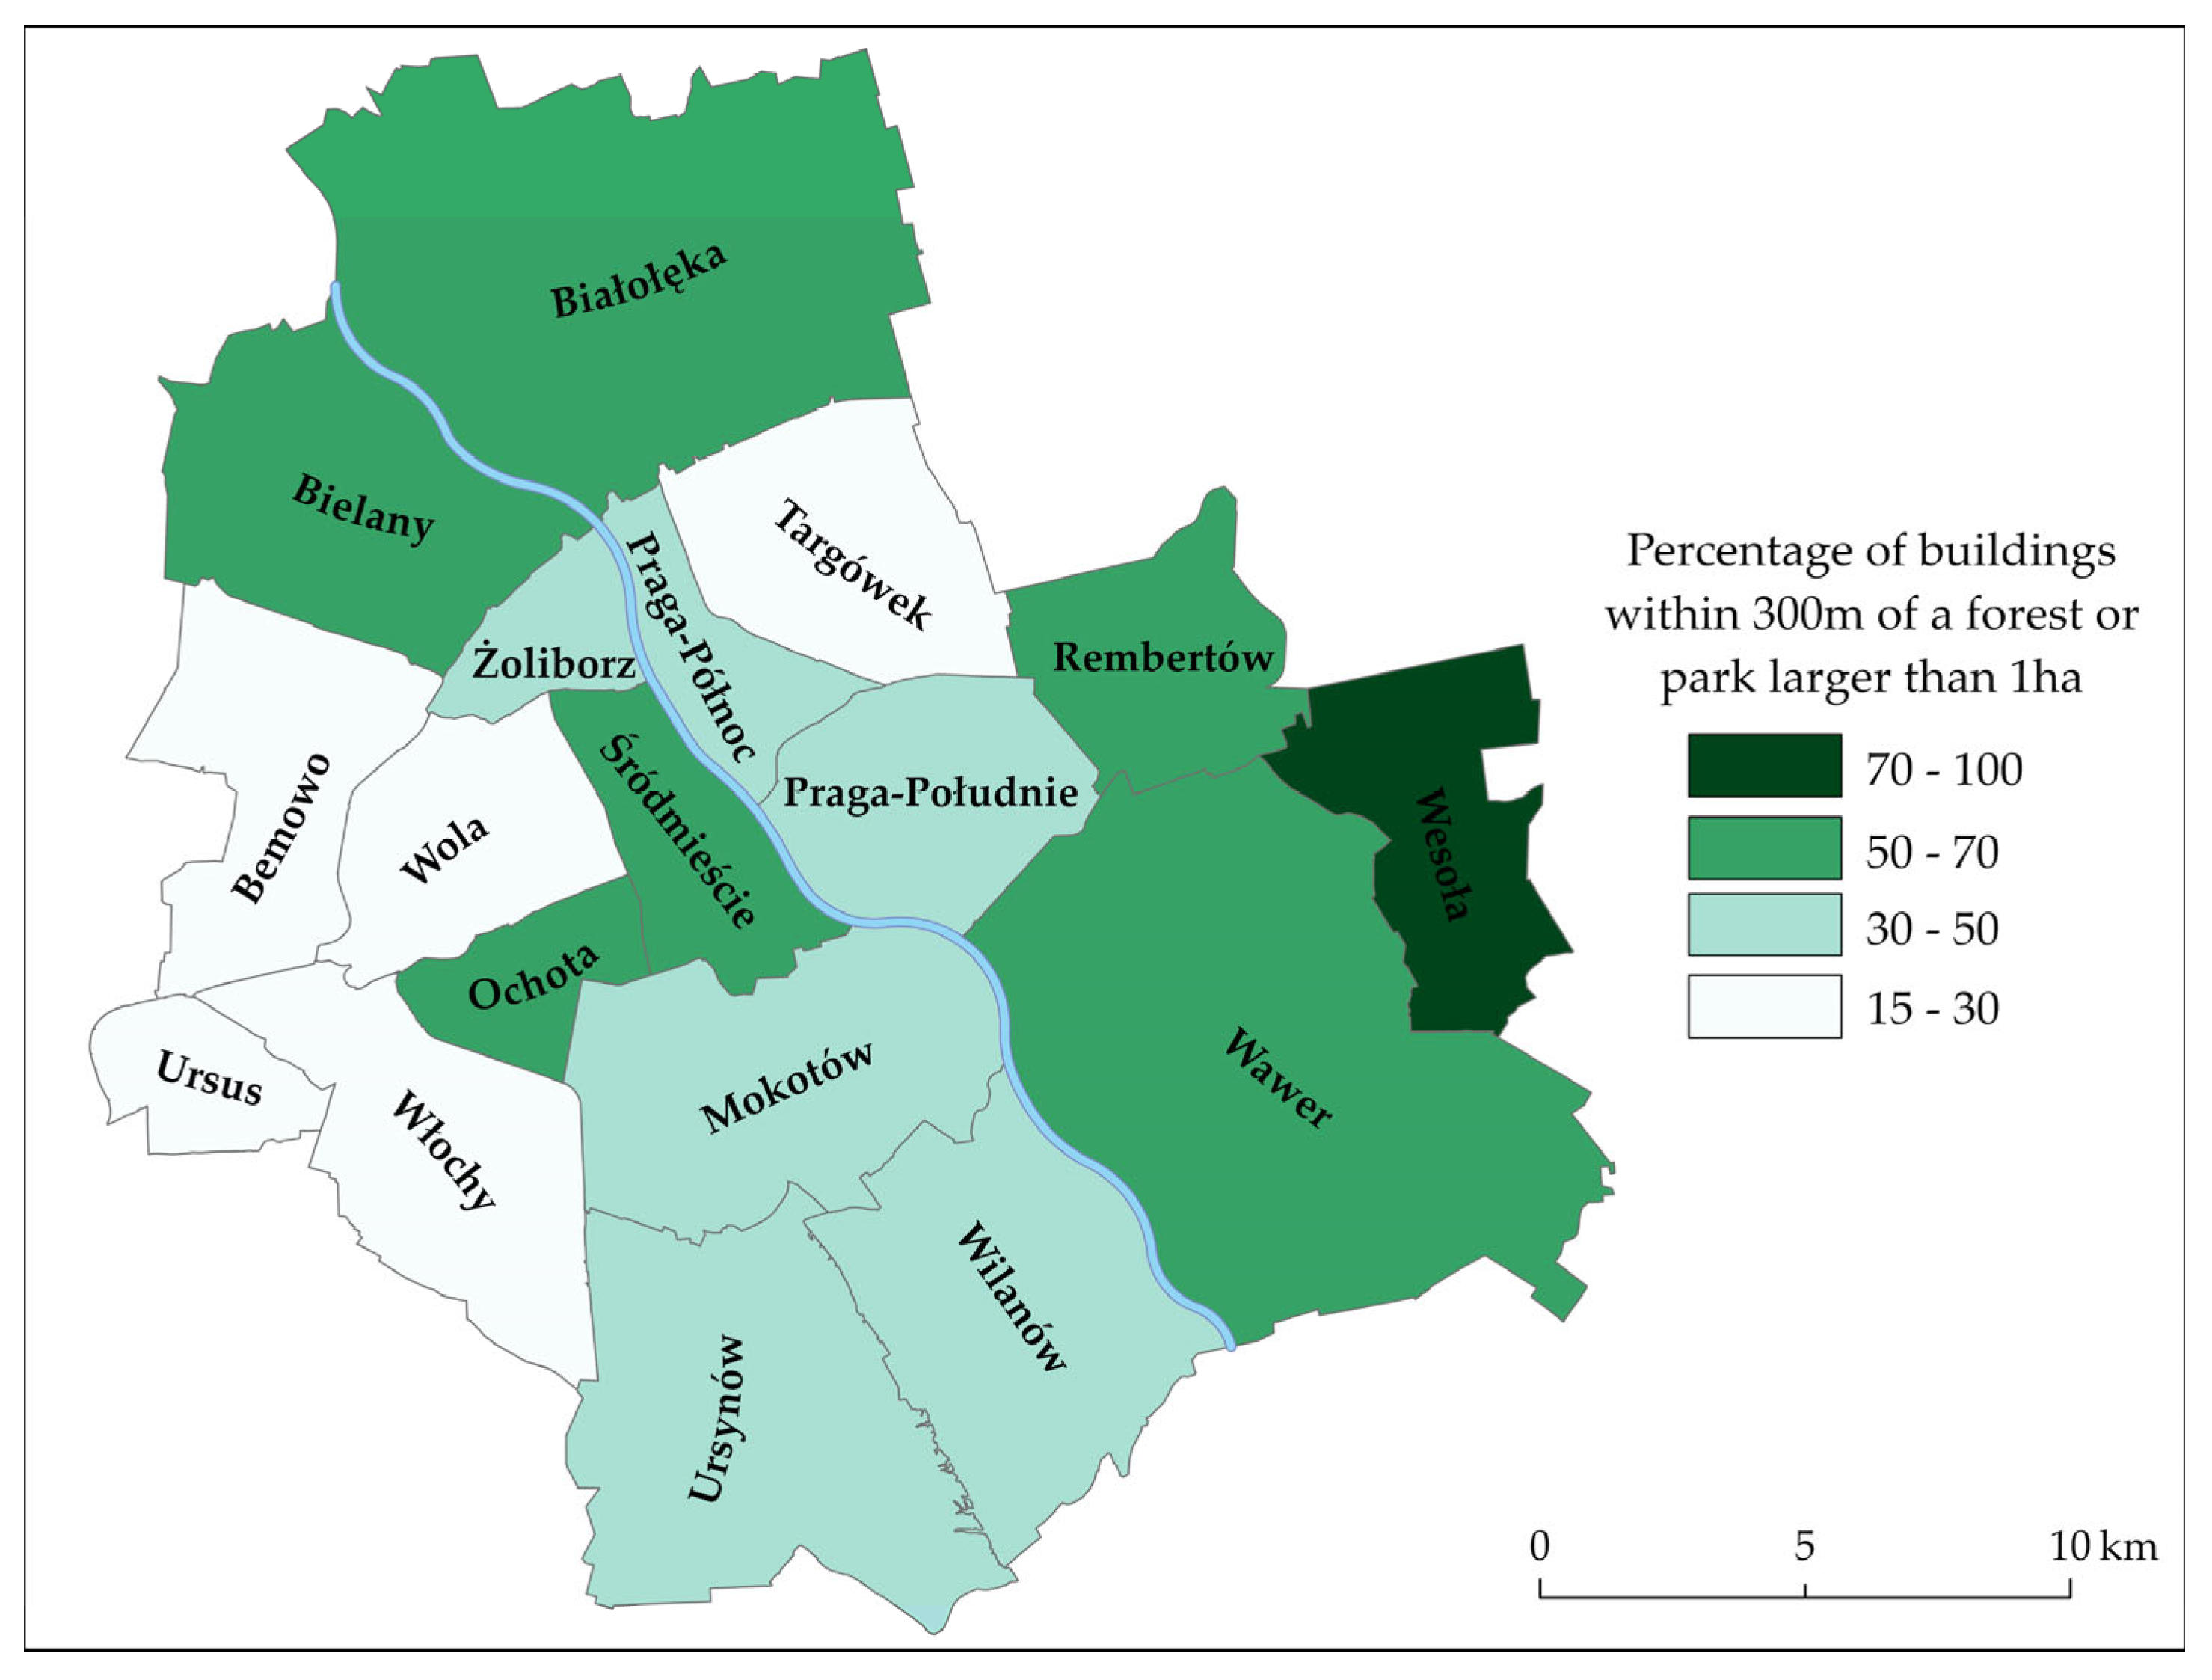
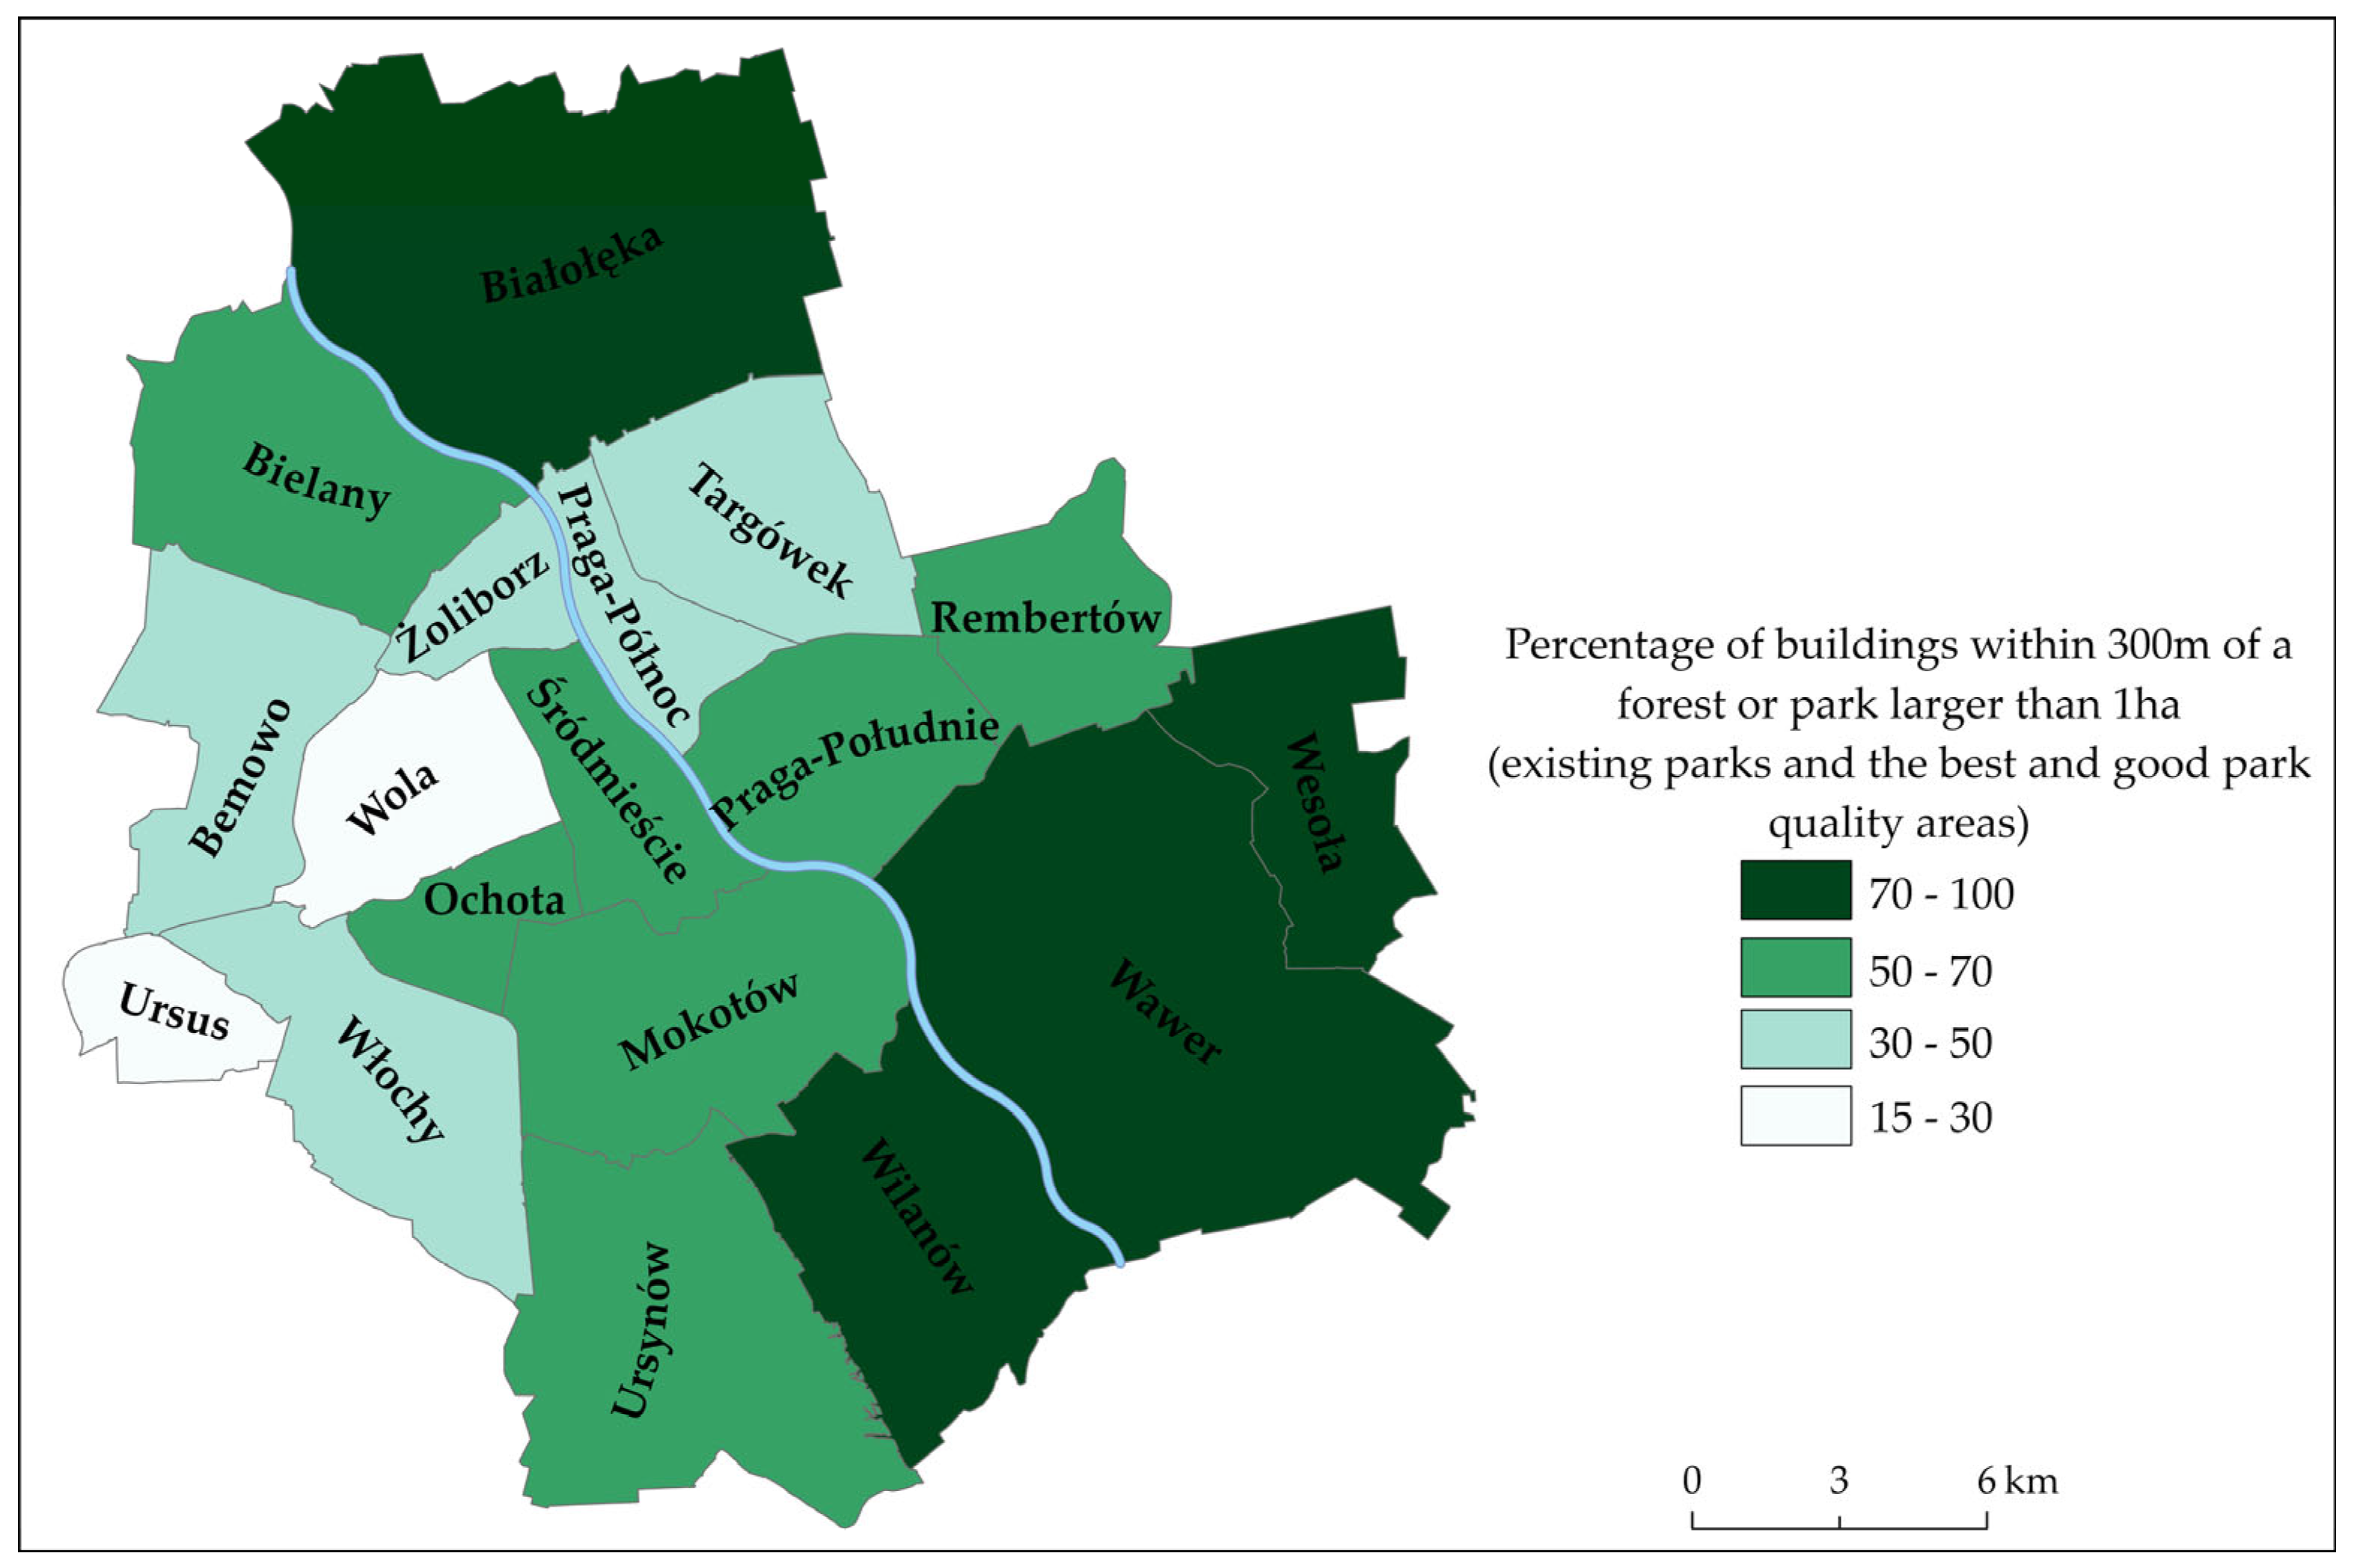
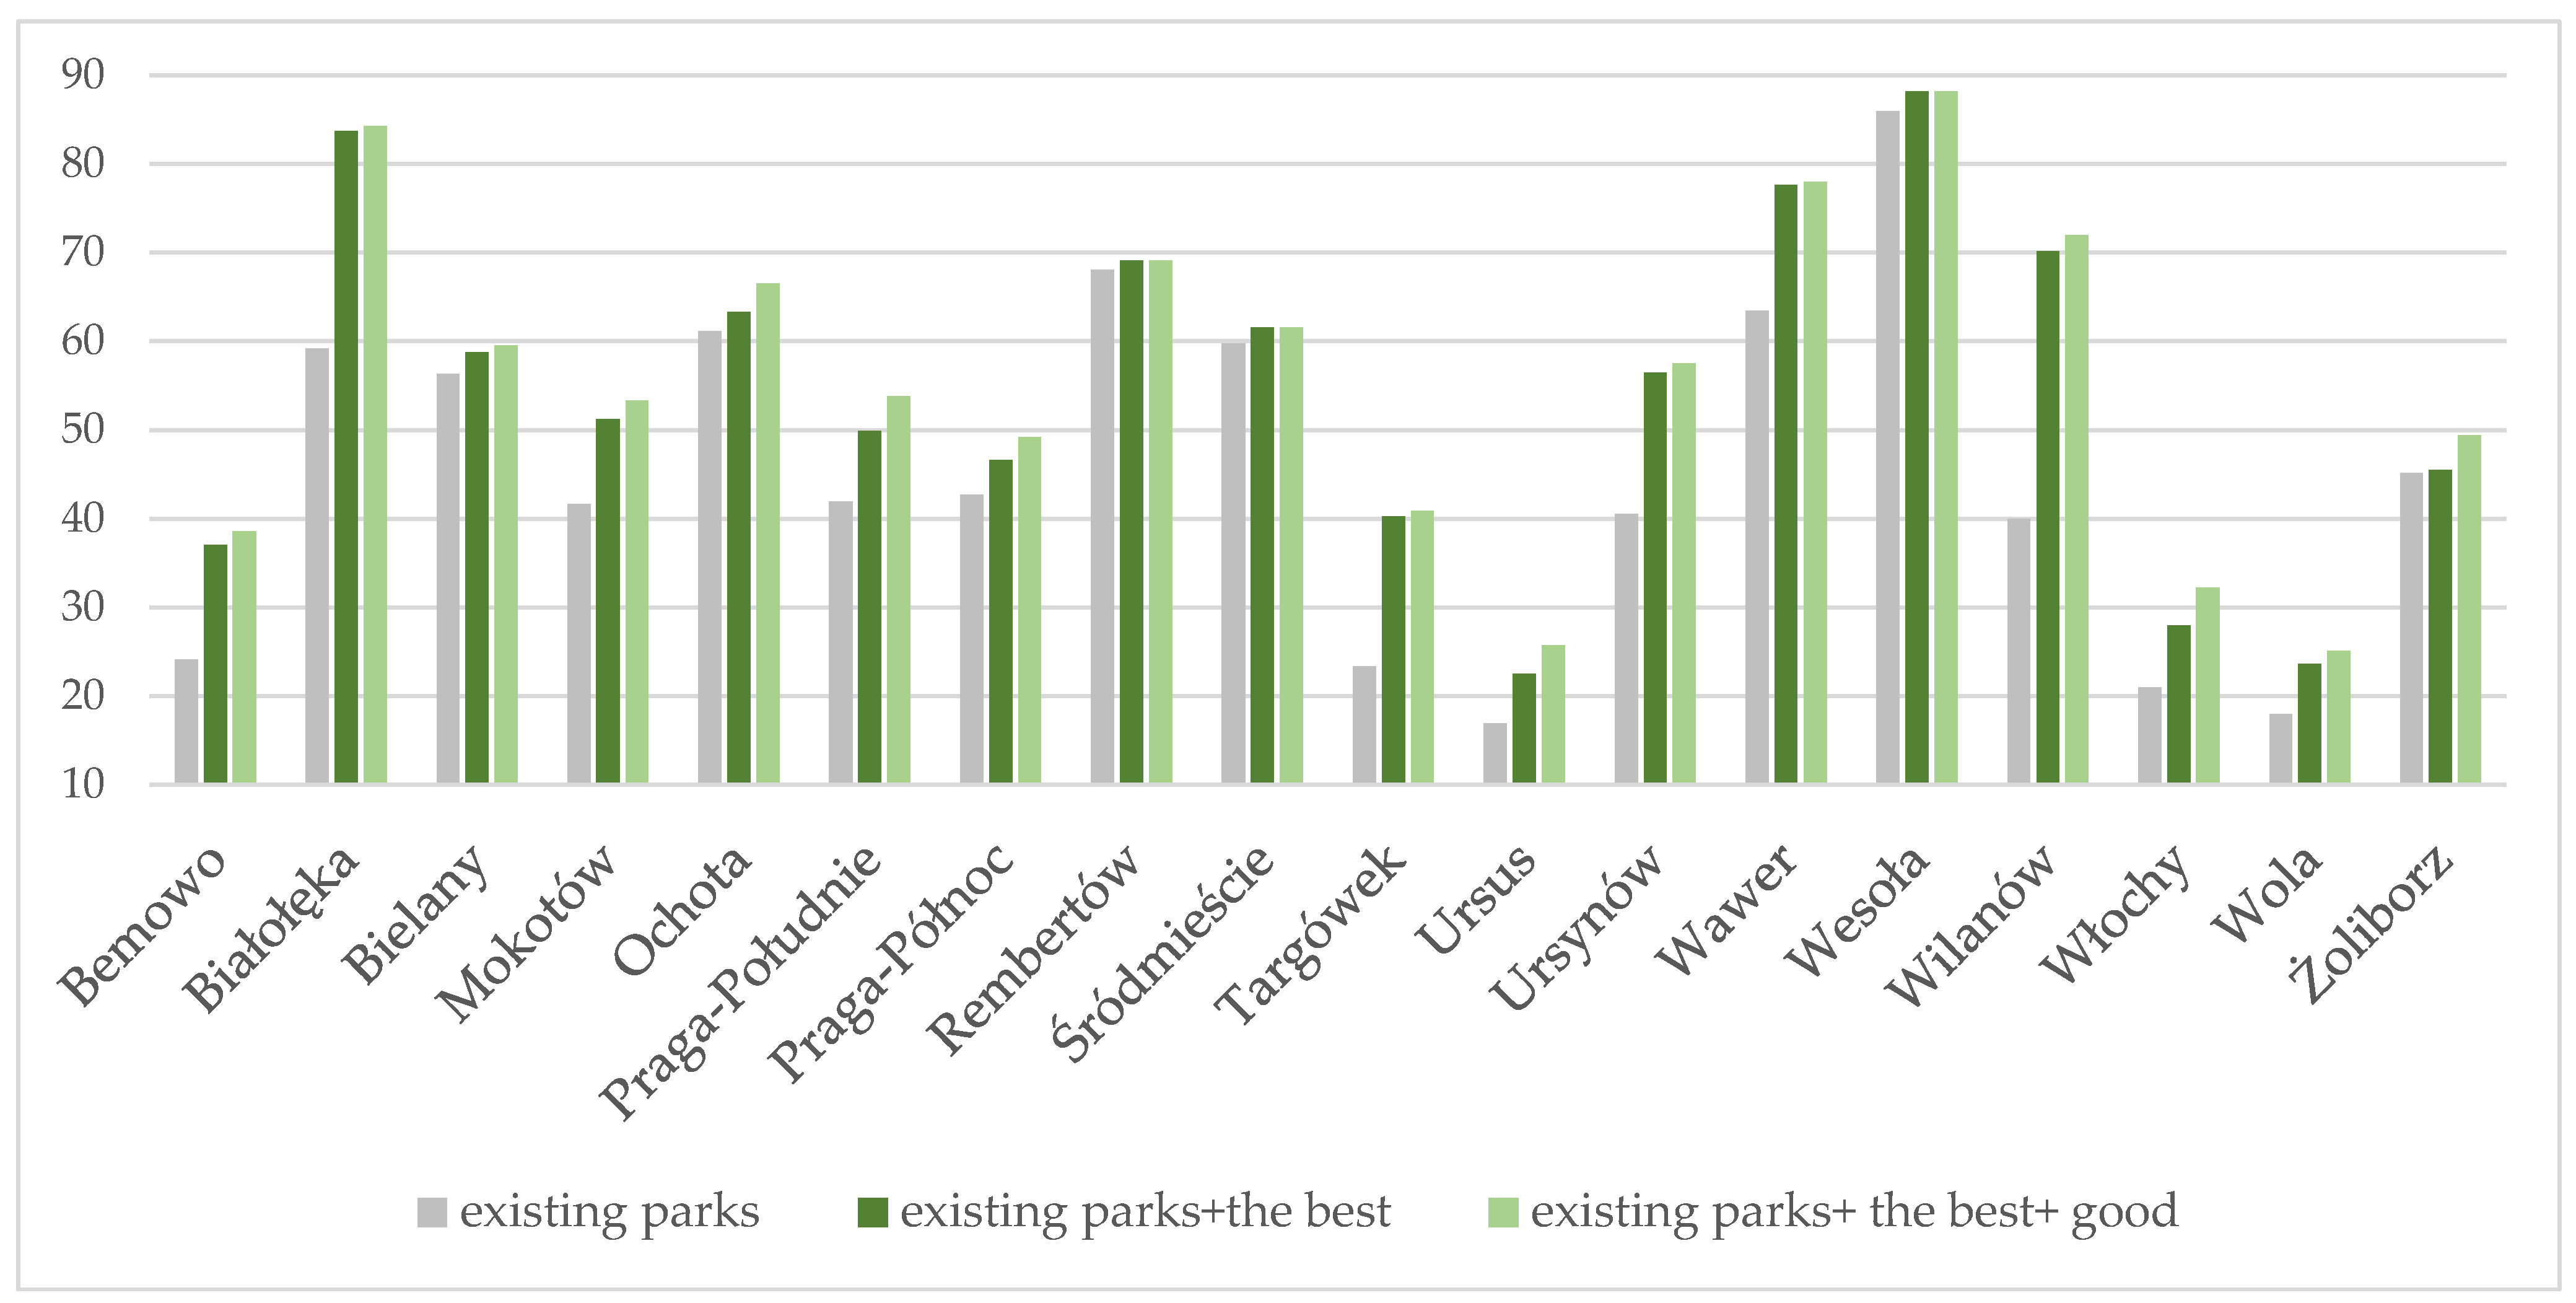
4.3. The Impact of Newly Designated Areas on Meeting the 300 m Condition

The results presented in Figure 6 show the percentage of buildings in individual districts that are located within 300 m of a park larger than 1 hectare. The map on the left illustrates the current state with existing parks, while the map on the right includes both existing parks and potential new green spaces in the best locations. Map b shows that the highest percentage of buildings meeting this condition was found in districts located in the outskirts of the city, such as Wesoła, Wawer, Wilanów, and Białołęka (above 70%). Interestingly, the districts of Mokotów, Ursynów, Ochota, Śródmieście, Rembertów, and Bielany are characterized by a relatively high percentage of buildings with access to green areas, in the range of 50–70%. A slightly lower rate (30–50%) was recorded in districts such as Praga Południe, Praga Północ, Targówek, Żoliborz, and Bemowo, which nevertheless still offer good access to green spaces. The lowest percentage of buildings meeting the criterion (15–30%) was found in the districts of Wola and Ursus, indicating limited access to parks and forests in these areas. While Wola is a relatively old, central district, Ursus, for example, is currently undergoing intensive development of large post-industrial areas, although, unfortunately, no new parks have been planned.
The percentage of buildings in different districts located within a 300 m radius of a park larger than 1 hectare, taking into account both the newly created green areas in the best and good locations, is presented in Figure 7.
After including additional areas (from locations classified as “good” and “the best”), a percentage increase in the number of buildings meeting the proximity criterion to green spaces can be observed compared to the results shown in Figure 6. For example, in the Włochy district, this percentage increased from 15–30% to 30–50%, while, in Praga Południe, it rose from 30–50% to 50–70%.
The chart (Figure 8) illustrates the percentage of buildings meeting the 300 m proximity requirement to green spaces after taking into account new potential park locations. The results from previous studies are marked in grey (existing parks), while the values obtained in the current analysis are shown in shades of green.
Figure 8 shows that the inclusion of new park locations in each district would increase the percentage of buildings meeting the 300 m requirement of the concept. In many districts, the impact of new green areas is relatively small, only a few percentage points. Interestingly, this applies both to central districts (Śródmieście, Ochota, Żoliborz), where the availability of new spaces is quite limited, and to peripheral districts (Wesoła, Rembertów) where there is already a relatively large number of existing parks.
The largest increase in the number of buildings meeting the 300 m requirement occurred in the Wilanów district, where green space accessibility improved by more than 30%. Significant improvements were also recorded in Białołęka (an increase of approximately 25%), Targówek (17%), and Ursynów (16%).

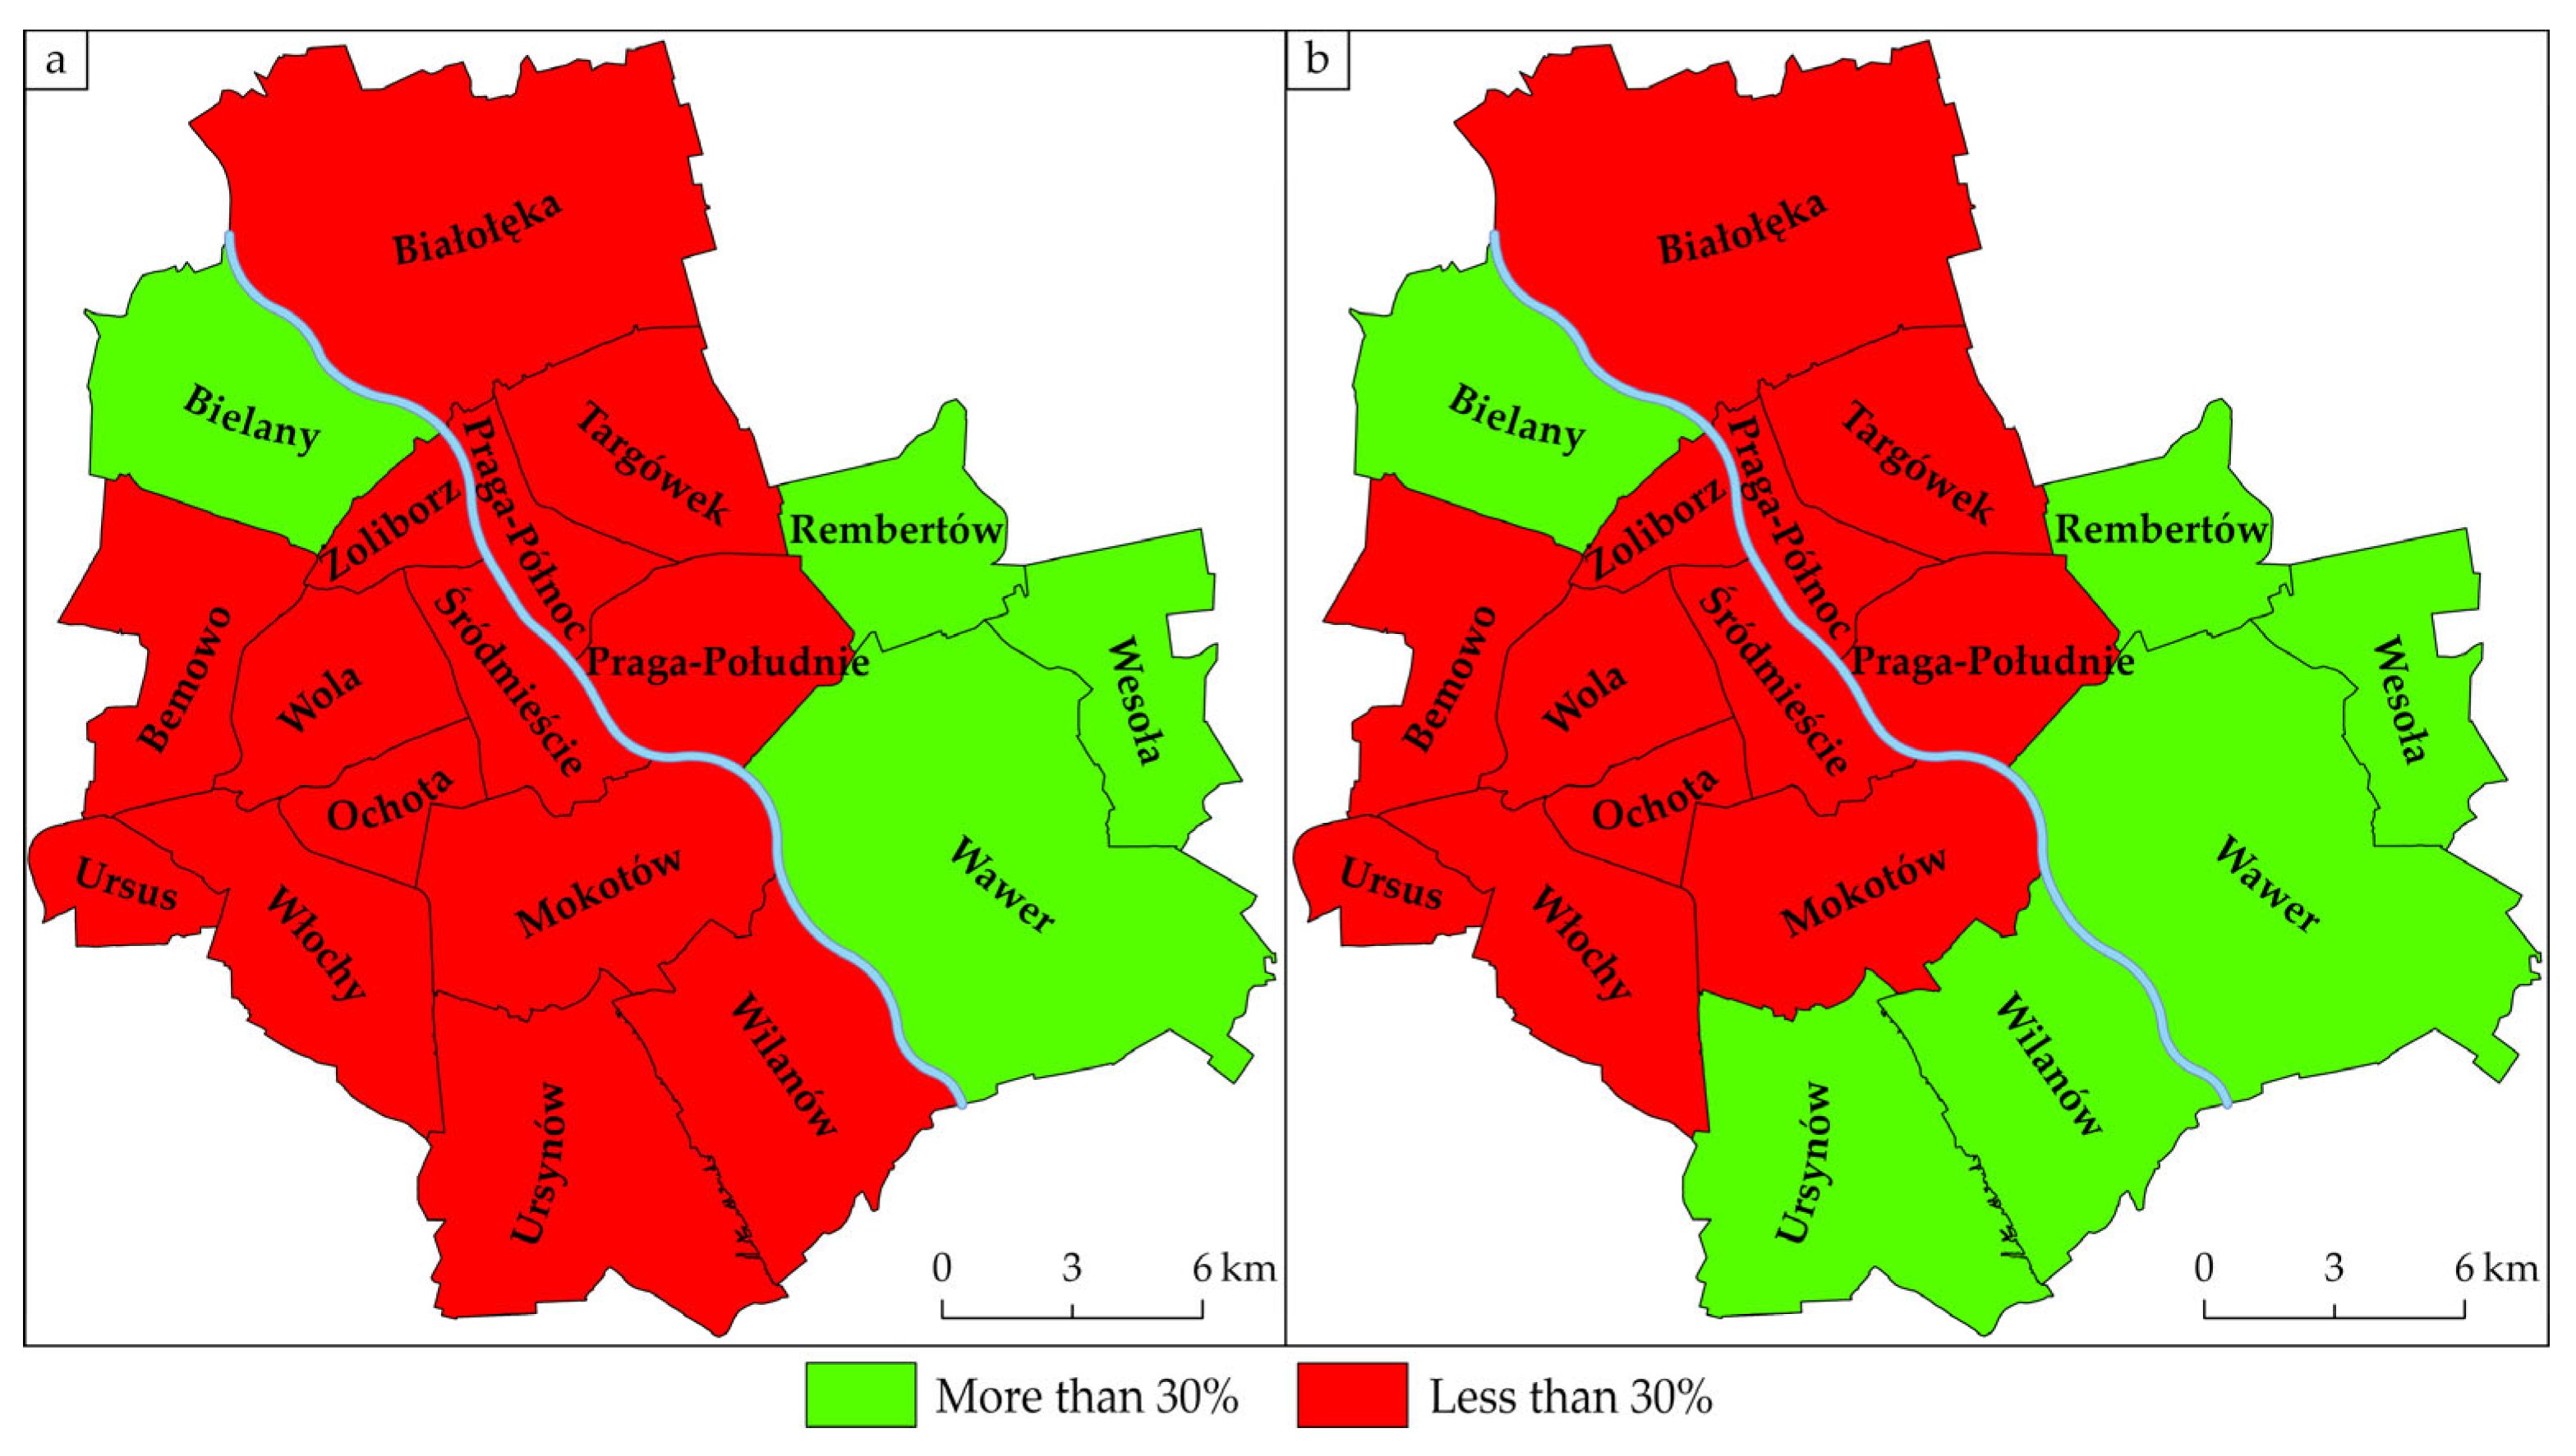
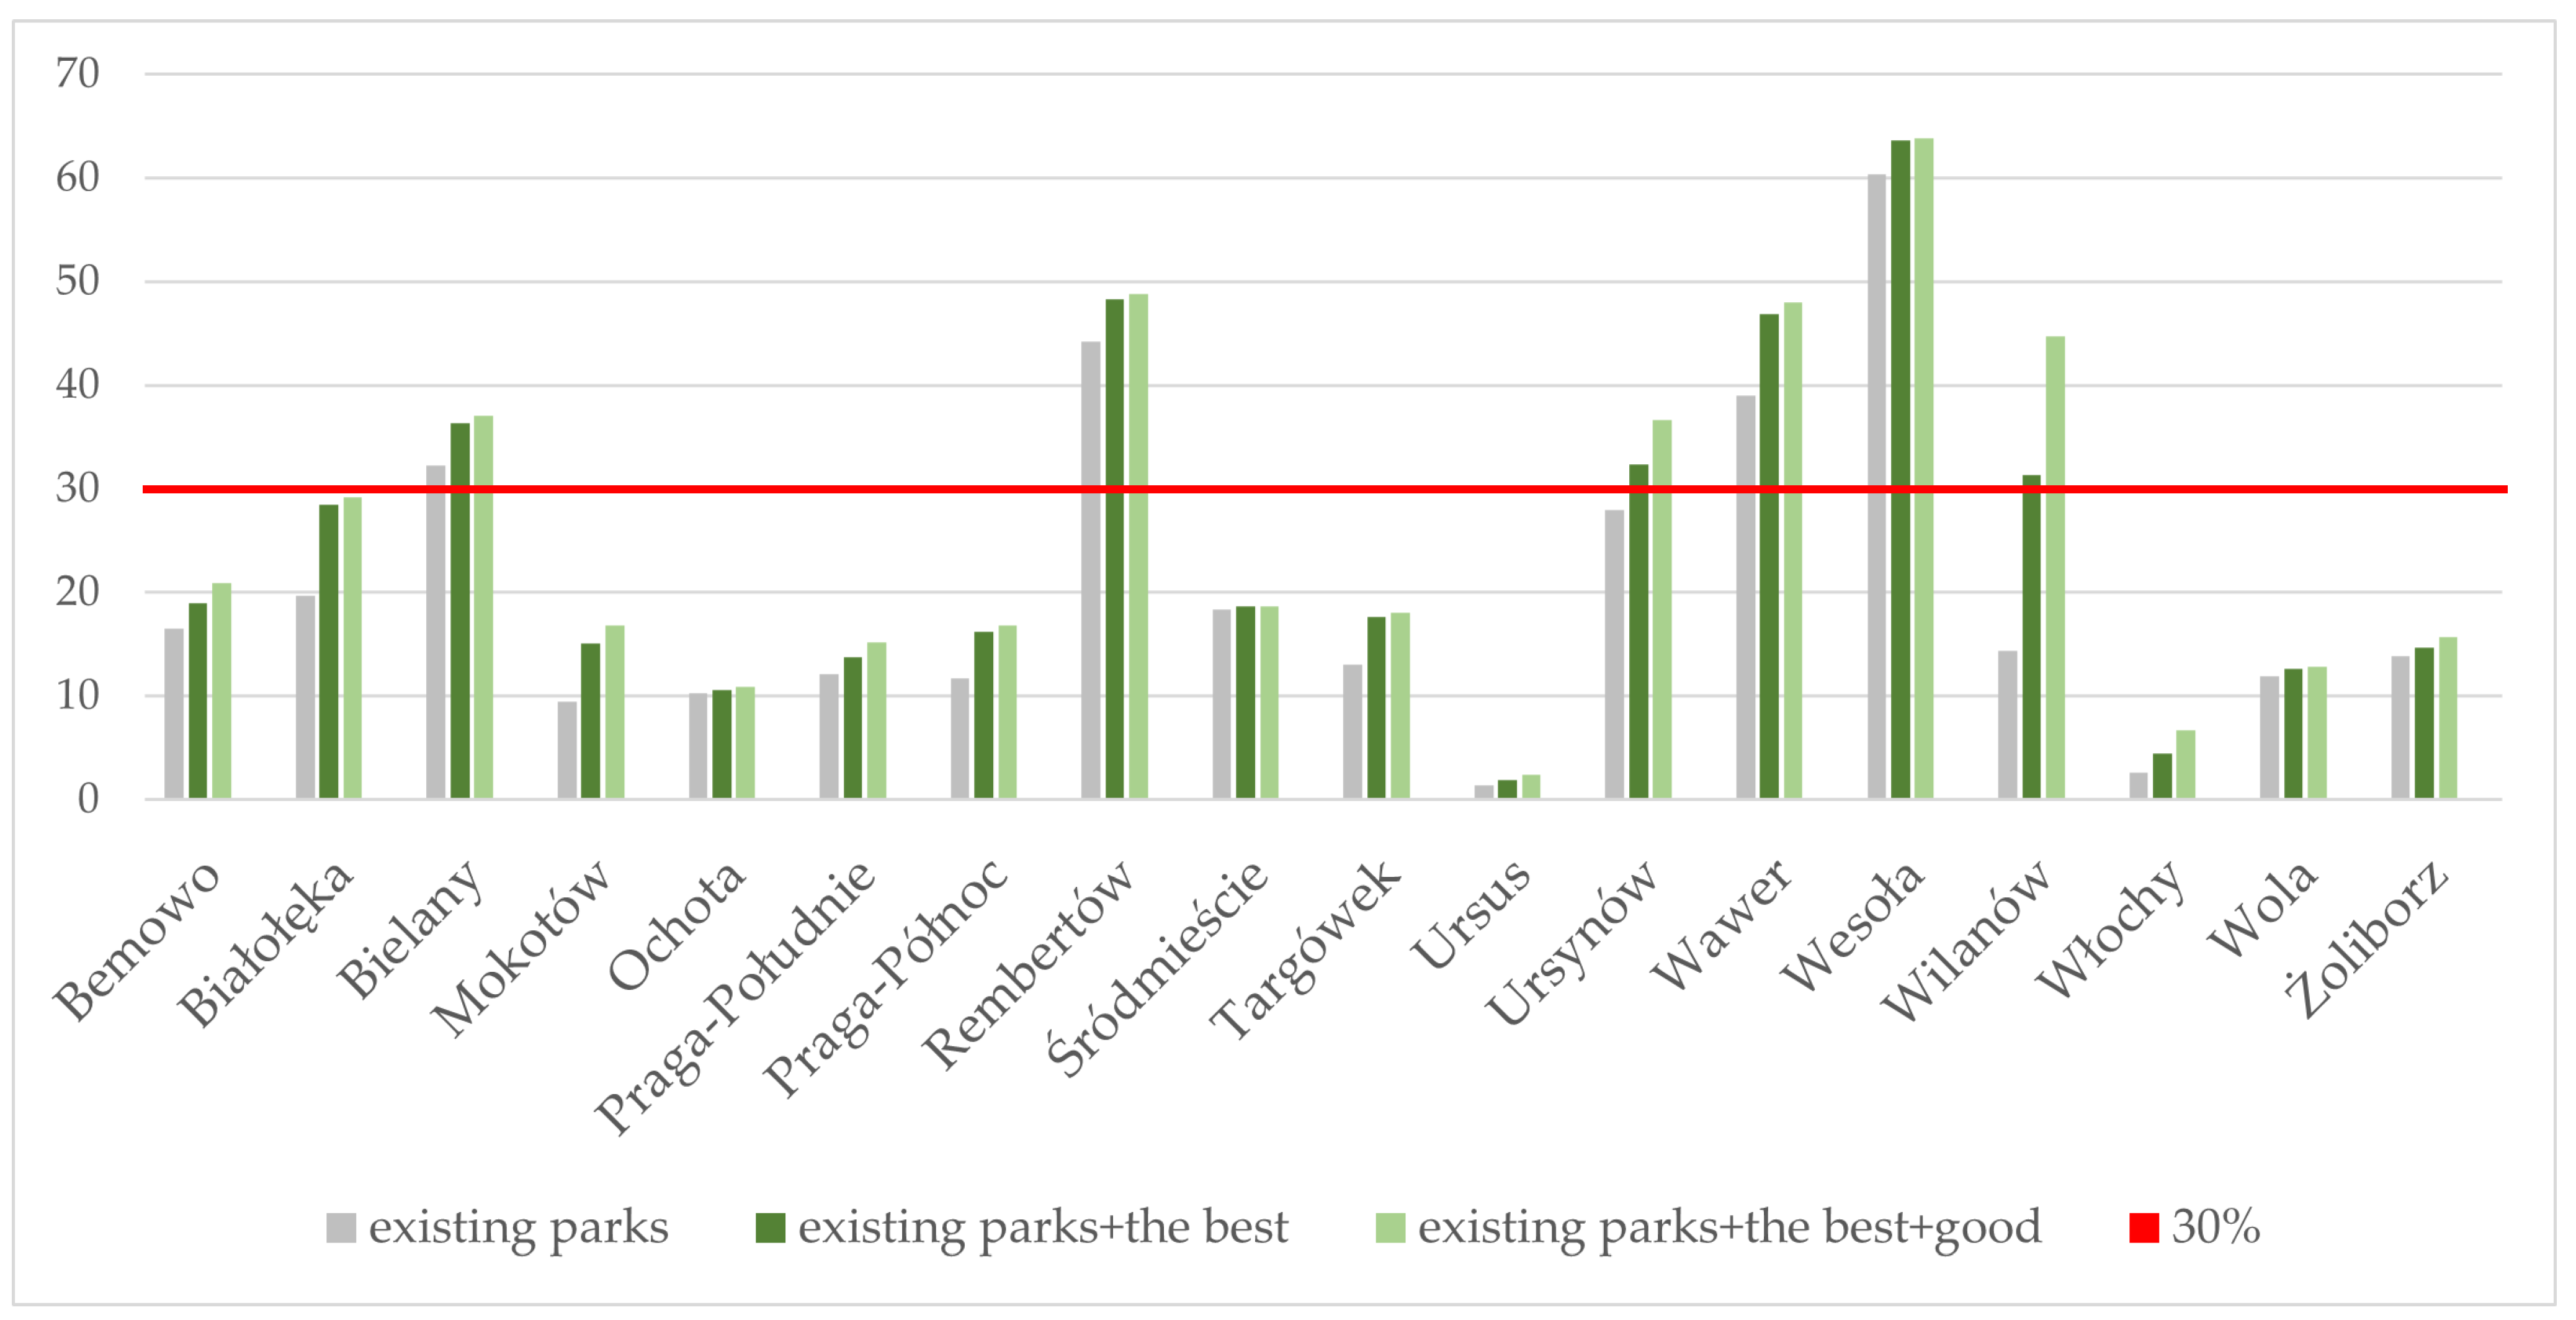
4.4. The Impact of Newly Designated Areas on Meeting the 30% Condition

Figure 9 presents two maps illustrating the division of Warsaw districts based on tree-covered areas. The map on the left shows the current state, while the map on the right takes into account both existing and new areas classified as “the best” quality, assuming a 30% coverage threshold. Districts marked in green meet this criterion, while those marked in red remain below this level. The analysis of the results indicates a clear variation in the distribution of green spaces within the city. Only six districts, i.e., Bielany, Rembertów, Wesoła, Wawer, Wilanów, and Ursynów, reach the required 30% tree coverage level. Most of them are peripheral areas characterized by large, forested areas, parks and spaces where new green areas can still be developed. Examples of existing forest complexes include the Kabaty Forest in Ursynów as well as the extensive forest areas in Wawer and Wesoła. In contrast, the central and western districts such as Śródmieście, Wola, Ochota, and Mokotów do not meet the 30% tree coverage criterion. Despite the presence of well-known large parks, such as Pole Mokotowskie or the Ogród Saski, their area proves insufficient in relation to the dense urban development. A similar situation can be observed in Białołęka and Targówek, where the dynamic growth of residential estates limits the share of tree-covered areas.
Unfortunately, even after including areas classified as “the best” and “good”, no additional district reaches the 30% threshold compared to the scenario considering only the potentially best park locations (i.e., “the best”). The situation is illustrated in Figure 10.
Changes in tree-covered areas across Warsaw’s districts, taking into account the proposed new park locations, are presented in Figure 11. Despite a noticeable increase in values in many districts, only two of them, i.e., Ursynów and Wilanów, exceeded the 30% threshold after the addition of new parks. In Wilanów, the increase compared to existing green areas was over 30%, while in Ursynów it grew by several percentage points.
It is worth noting the difference between the “the best” and “the best+good” variants. Only Wilanów showed a clear increase in value after including additional areas, whereas in other districts the differences were small or even negligible. This may indicate that, in most cases, the additional “good” areas do not have a significant impact on increasing the level of tree coverage.

5. Discussion

5.1. Implementation of Objective No. 1: Where in the City Can New Parks Be Established?

The first objective of the conducted research was to answer the question of where in the city of Warsaw new parks could be created. By applying the Fuzzy-AHP multi-criteria analysis method, areas with varying degrees of suitability for this purpose were identified, with only those areas classified as “the best” and “good” being considered favorable. The fuzzy method was applied to reduce the subjectivity of respondents’ evaluations, referring to studies available in international subject literature [11,19,22]. According to [55,56], the traditional AHP method does not adequately address uncertainty in the decision-making process. During the collection and analysis of respondents’ answers, it was found that in the process of identifying locations for new urban parks, it is crucial to conduct an initial discussion on the definition and selection of the most important factors influencing this process, involving not only specialists in geoinformation and spatial planning but also residents of the study area. This stage is extremely important in the context of interpreting the adopted criteria and, consequently, selecting the weight values.
Many research studies concerning the identification of the most suitable areas for the location of not only urban parks but also broadly understood green and blue infrastructure were analyzed. Various criteria determining the location of new green urban spaces were adopted in these studies. In study [32], thirteen factors were used, including terrain topography, weather conditions, surface temperature, NDVI, air pollution, carbon storage, transportation accessibility, and population distribution. In contrast, study [57] focused on factors such as land availability and cost, transportation accessibility, population density, and income level. The research presented here was based on environmental and social factors, omitting aspects related to the value of cadastral plots, as, due to the relatively limited availability of potential areas in many parts of the city, costs were considered a secondary issue. As our results show, in Warsaw the new parks can be mainly established in the Wilanów, Wawer, Białołęka, and Ursynów districts. This is a direct response to the first research question.
The application of the proposed methodology in a city other than Warsaw is entirely feasible, as the criteria we developed were selected to enable the replication of results in an international context. Owing to their universal character, this methodology can serve as a robust foundation for analyses in various urban locations, regardless of country or region. However, it is important to recognize that every city has its own specific characteristics—spatial, social, economic, and environmental—which may influence the effectiveness and relevance of the applied indicators. Therefore, implementing the methodology in a new study area may require appropriate adaptation to local conditions, including a reassessment of the selected criteria to ensure they accurately reflect the realities of the city under analysis (e.g., the addition of a parameter representing terrain topography) [11]. The presented methodology can be extended to include an analysis of cadastral plot acquisition costs in order to optimize the expenses related to the construction of new parks.

5.2. Implementation of Objective No. 2: What Impact Would the New Parks Have on Fulfilling the 30% Tree Canopy Cover and 300 m Proximity Criteria of the Green City Concept?

As a result of the conducted research, a number of urban areas were identified that could be transformed into parks of at least 1 hectare in size. This potential is highly relevant to the implementation of the 3-30-300 concept, as incorporating newly planned green spaces into urban infrastructure leads to a noticeable increase in the greening of urbanized areas.
The analysis showed that the application of the proposed methodology contributes to an increase in the number of buildings meeting the first criterion of the adopted green city concept—access to a park or forest within a 300 m radius. The results suggest that with relatively modest organizational and financial efforts, it is possible to increase the number of people who have a park “within reach”, which is likely to lead to improved health and social indicators. This is particularly important in the context of the so-called “green justice”, meaning equitable access to environments that promote health and well-being.
The analysis of the impact of creating new parks on the 30% green space coverage criterion demonstrated that these actions have a tangible, though limited, effect at the citywide scale. While an increase in green coverage was observed in most districts, significant changes were noted primarily in low-density areas, where the availability of land for green investment is relatively higher. In contrast, densely built-up urban areas showed considerable constraints—the lack of available plots with suitable parameters prevents the creation of parks of 1 hectare or more. Therefore, it is necessary to adapt urban greening strategies to local conditions. In highly urbanized districts, the optimal solution may involve the development of smaller forms of public greenery, such as pocket parks, green plazas, squares, or roadside vegetation. Although these spaces individually cover small areas, their distribution throughout the urban fabric can significantly improve green space accessibility and fulfill recreational, aesthetic, and ecological functions.
In future studies, the 3-30-300 concept should thus be considered not only in the context of large parks and forest complexes but also with attention to smaller, dispersed forms of urban greenery. Their role in shaping a healthy living environment in densely populated districts may prove to be essential.

5.3. The 3-30-300 Concept—Advantages and Disadvantages

Widespread application of the 3-30-300 concept in urban policy and spatial planning stems from its simplicity, clarity, and the possibility of quantifying the basic indicators intended to ensure residents’ access to greenery. According to the assumptions of this model, every person should (1) be able to see at least three trees from their place of residence, (2) live in an area where at least 30% of the surface is covered by green spaces, and (3) have access to a park or forest within a maximum distance of 300 m. Despite its many advantages—such as intuitiveness and ease of communication—this concept also has significant limitations, which paradoxically arise from those very strengths. The overly general formulation of its criteria hinders practical application and limits the potential for conducting consistent and comparable scientific research. For instance, the model does not clearly specify how far from a building trees must be located to be considered “visible from a window”. For some people, this may mean 5 m; for others, 50 or even 100 m—leading to interpretive challenges. A similar ambiguity concerns the definition of “green spaces”. It is unclear whether these include only parks and public squares or also roadside lawns, pocket gardens, green roofs, flower beds, or other forms of low vegetation. The lack of precision can lead to substantial discrepancies in assessments of green coverage and the availability of recreational areas across different cities and spatial contexts. Therefore, it is essential to refine the individual parameters of the 3-30-300 model. Clear, measurable, and consistently applied definitions will enable the effective implementation of this concept in urban planning practice and will enhance the comparative value and replicability of studies on the quality of the urban environment and residents’ health.

5.4. Urban Sustainable Development

While in older, densely built-up districts it is difficult to introduce significant changes to the urban space, the fact that newly developed residential areas often lack sufficient green spaces continues to raise concerns. This problem particularly affects peripheral districts that are currently undergoing intensive development (e.g., Ursus). There are extensive former industrial areas that have now been designated for residential development. They are being densely built up, with virtually no spaces allocated for green areas. It is difficult to expect changes from developers, as their main priority is to draw profit from selling newly built apartments. However, urgent changes in legal regulations are necessary to enforce the allocation of land for green infrastructure in such areas.
Due to the observed problem of creating new urban parks in many districts of Warsaw, greater attention should be paid to the management of areas intended for future development. Given the invaluable health benefits of urban green spaces for city residents, it is essential to plan such areas in locations that are yet to be developed.
The proposed methodology responds to the needs of local authorities and urban planners striving for sustainable urban development through investment in green infrastructure. The application of quantified factors of the green city concept enables an objective, data-driven decision-making process. It can also serve as an effective tool for communicating with residents that will provide them with clear information about the state of their surroundings and the impact of proposed solutions on their quality of life.
In light of the reviewed international literature, the proposed methodology stands out for its combination of reduced decision-making subjectivity, multidimensional and precise spatial planning, and a practical approach to achieving sustainable urban development.

6. Conclusions

The article presents a methodology for identifying locations for new urban parks in the city of Warsaw and includes an assessment of the impact of the designated areas on meeting the assumptions of the 3-30-300 concept, which defines the status of a green city.
A significant impact of the results obtained through the proposed methodology on meeting two conditions of the green city concept was identified. The first condition concerned the proximity of parks and forests larger than 1 hectare to residential buildings, while the second referred to achieving a 30% share of tree-covered areas within the districts of Warsaw. As a result of including “the best” and ”good” areas, an increase in the number of buildings meeting the 300 m condition was observed in every district. The largest increase, by 32%, was recorded in Wilanów, while the smallest, of 2%, was noted in Rembertów. As a result of including potential park locations, the availability of this type of urban greenery for residential buildings in individual districts increased from 17–86% to 25–88%, resulting in an average increase of 9% when considering only “the best” areas, and an average increase of 11% when both “the best” and ”good” areas were taken into account. The designated “the best” and ”good” areas also contributed to meeting the second considered condition of the 3-30-300 concept. Thanks to the identified areas for new parks, two districts (out of fourteen that initially did not meet this condition), i.e., Ursynów and Wilanów, exceeded the 30% threshold, while a third district, Białołęka (29%), came close to reaching it.
The new areas designated for urban greenery are mainly located in the southern and northern parts of Warsaw, as well as near the Vistula River. Opportunities for creating new green spaces in other parts of the city are limited due to dense development. Despite the lack of physical possibilities to establish new parks of at least 1 hectare across the entire city, incorporating the identified areas into urban greenery planning, as indicated by the conducted research, contributes to increasing the city’s overall greenery in line with the 3-30-300 concept.
Moreover, the implementation of the proposed concept to increase green space in areas requiring investment in greenery will further enhance the sustainable development of the city.

Author Contributions

Conceptualization, K.S. and B.W.; methodology, K.S.; formal analysis, K.S. and B.W.; writing—original draft preparation, K.S. and B.W.; writing—review and editing, K.S. and B.W.; visualization, K.S. and B.W. All authors have read and agreed to the published version of the manuscript.

Funding

This research was funded by Military University of Technology in Warsaw, Faculty of Civil Engineering and Geodesy, Institute of Geospatial Engineering and Geodesy statutory research funds UGB/22-785/2025/WAT.

Institutional Review Board Statement

Not applicable.

Informed Consent Statement

Not applicable.

Data Availability Statement

The data that support the findings of this study are available from the corresponding author upon reasonable request.

Conflicts of Interest

The authors declare no conflicts of interest.

References

  1. Maas, J.; Verheij, R.A.; de Vries, S.; Spreeuwenberg, P.; Schellevis, F.G.; Groenewegen, P.P. Morbidity Is Related to a Green Living Environment. J. Epidemiol. Community Health 2009, 63, 967–973. [Google Scholar] [CrossRef] [PubMed]
  2. Zhang, Y.; Mavoa, S.; Zhao, J.; Raphael, D.; Smith, M. The Association between Green Space and Adolescents’ Mental Well-Being: A Systematic Review. Int. J. Env. Res. Public. Health 2020, 17, 6640. [Google Scholar] [CrossRef]
  3. Wyrzykowski, B. Survey [Methodology for Determining Visibility of Trees from Dwellings]. 2025. [Google Scholar]
  4. Wyrzykowski, B.; Mościcka, A. Implementation of the 3-30-300 Green City Concept: Warsaw Case Study. Appl. Sci. 2024, 14, 10566. [Google Scholar] [CrossRef]
  5. Konijnendijk, C.C. Evidence-Based Guidelines for Greener, Healthier, More Resilient Neighbourhoods: Introducing the 3-30-300 Rule. J. Res. 2023, 34, 821–830. [Google Scholar] [CrossRef]
  6. Koeser, A.K.; Hauer, R.J.; Andreu, M.G.; Northrop, R.; Clarke, M.; Diaz, J.; Hilbert, D.R.; Konijnendijk, C.C.; Landry, S.M.; Thompson, G.L. Using the 3-30-300 Rule to Assess Urban Forest Access and Preferences in Florida (United States). Arboric. Urban For. (AUF) 2024, 50, 241–257. [Google Scholar] [CrossRef]
  7. Robitaille, É.; Douyon, C. Using the 3-30-300 Indicator to Evaluate Green Space Accessibility and Inequalities: A Case Study of Montreal, Canada. Geographies 2025, 5, 6. [Google Scholar] [CrossRef]
  8. Mitelsztedt, K.; Ciesielski, M.; Hycza, T.; Lisańczuk, M.; Guderski, K.; Kurpiewska, S.; Korzeniewski, K. Exploring the Possibilities of Implementing the ALS-Based 3-30-300 Concept for Urban Green Space Management in Small Municipalities. Land 2025, 14, 358. [Google Scholar] [CrossRef]
  9. Gelan, E. GIS-Based Multi-criteria Analysis for Sustainable Urban Green Spaces Planning in Emerging Towns of Ethiopia: The Case of Sululta Town. Environ. Syst. Res. 2021, 10, 1–14. [Google Scholar] [CrossRef]
  10. Bakolo, C.; Kayitete, L.; de Dieu Tuyizere, J.; Tomlinson, J.; Fawcett, J.; Alfaro, R.F. Identification of Optimal Locations for Green Space Initiatives through GIS-Based Multi-Criteria Analysis and the Analytical Hierarchy Process. Environ. Syst. Res. 2024, 13, 46. [Google Scholar] [CrossRef]
  11. Calka, B.; Siok, K.; Szostak, M.; Bielecka, E.; Kogut, T.; Zhran, M. Improvement of the Reliability of Urban Park Location Results Through the Use of Fuzzy Logic Theory. Sustainability 2025, 17, 521. [Google Scholar] [CrossRef]
  12. Huang, S.; Tang, L.; Hupy, J.P.; Wang, Y.; Shao, G. A Commentary Review on the Use of Normalized Difference Vegetation Index (NDVI) in the Era of Popular Remote Sensing. J. Res. 2021, 32, 1–6. [Google Scholar] [CrossRef]
  13. Pettorelli, N.; Vik, J.O.; Mysterud, A.; Gaillard, J.-M.; Tucker, C.J.; Stenseth, N.C. Using the Satellite-Derived NDVI to Assess Ecological Responses to Environmental Change. Trends Ecol. Evol. 2005, 20, 503–510. [Google Scholar] [CrossRef] [PubMed]
  14. Trzaskalik, T. Wielokryterialne Wspomaganie Decyzji. Przegląd Metod i Zastosowań. Zesz. Naukowe. Organ. I Zarządzanie/Politech. Śląska 2014, 74, 239–263. [Google Scholar]
  15. Saaty, R.W. The Analytic Hierarchy Process—What It Is and How It Is Used. Math. Model. 1987, 9, 161–176. [Google Scholar] [CrossRef]
  16. Zadeh, L.A. Fuzzy Sets. Inf. Control 1965, 8, 338–353. [Google Scholar] [CrossRef]
  17. Darko, A.; Chan, A.P.C.; Ameyaw, E.E.; Owusu, E.K.; Pärn, E.; Edwards, D.J. Review of Application of Analytic Hierarchy Process (AHP) in Construction. Int. J. Constr. Manag. 2019, 19, 436–452. [Google Scholar] [CrossRef]
  18. Sun, C.-C. A Performance Evaluation Model by Integrating Fuzzy AHP and Fuzzy TOPSIS Methods. Expert. Syst. Appl. 2010, 37, 7745–7754. [Google Scholar] [CrossRef]
  19. Liu, Y.; Eckert, C.M.; Earl, C. A Review of Fuzzy AHP Methods for Decision-Making with Subjective Judgements. Expert. Syst. Appl. 2020, 161, 113738. [Google Scholar] [CrossRef]
  20. Yang, C.-C.; Chen, B.-S. Key Quality Performance Evaluation Using Fuzzy AHP. J. Chin. Inst. Ind. Eng. 2004, 21, 543–550. [Google Scholar] [CrossRef]
  21. Cheng, C.-H.; Yang, K.-L.; Hwang, C.-L. Evaluating Attack Helicopters by AHP Based on Linguistic Variable Weight. Eur. J. Oper. Res. 1999, 116, 423–435. [Google Scholar] [CrossRef]
  22. Łuczak, A. Wpływ Różnych Sposobów Agregacji Opinii Ekspertów w FAHP Na Oceny Priorytetowych Czynników Rozwoju. Pr. Nauk. Uniw. Ekon. We Wrocławiu 2016, 426, 99–107. [Google Scholar]
  23. Łuczak, A.; Wysocki, F. Wykorzystanie Rozmytych Metod AHP i TOPSIS Do Porządkowania Liniowego Obiektów. 2010. Available online: https://dbc.wroc.pl/Content/121483/Luczak_Wysocki_Wykorzystanie_rozmytych.pdf (accessed on 15 April 2025).
  24. Liu, Y.; Eckert, C.; Yannou-Le Bris, G.; Petit, G. A Fuzzy Decision Tool to Evaluate the Sustainable Performance of Suppliers in an Agrifood Value Chain. Comput. Ind. Eng. 2019, 127, 196–212. [Google Scholar] [CrossRef]
  25. Xue, L.; Cao, P.; Xu, D.; Guo, Y.; Wang, Q.; Zheng, X.; Han, R.; You, A. Agricultural Land Suitability Analysis for an Integrated Rice-Crayfish Culture Using a Fuzzy AHP and GIS in Central China. Ecol. Indic. 2023, 148, 109837. [Google Scholar] [CrossRef]
  26. Hashemian, S.M.; Behzadian, M.; Samizadeh, R.; Ignatius, J. A Fuzzy Hybrid Group Decision Support System Approach for the Supplier Evaluation Process. Int. J. Adv. Manuf. Technol. 2014, 73, 1105–1117. [Google Scholar] [CrossRef]
  27. Yayla, A.Y.; Oztekin, A.; Gumus, A.T.; Gunasekaran, A. A Hybrid Data Analytic Methodology for 3PL Transportation Provider Evaluation Using Fuzzy Multi-Criteria Decision Making. Int. J. Prod. Res. 2015, 53, 6097–6113. [Google Scholar] [CrossRef]
  28. Calabrese, A.; Costa, R.; Levialdi, N.; Menichini, T. Integrating Sustainability into Strategic Decision-Making: A Fuzzy AHP Method for the Selection of Relevant Sustainability Issues. Technol. Forecast. Soc. Change 2019, 139, 155–168. [Google Scholar] [CrossRef]
  29. Calabrese, A.; Costa, R.; Levialdi, N.; Menichini, T. A Fuzzy Analytic Hierarchy Process Method to Support Materiality Assessment in Sustainability Reporting. J. Clean. Prod. 2016, 121, 248–264. [Google Scholar] [CrossRef]
  30. Mangla, S.K.; Kumar, P.; Barua, M.K. Risk Analysis in Green Supply Chain Using Fuzzy AHP Approach: A Case Study. Resour. Conserv. Recycl. 2015, 104, 375–390. [Google Scholar] [CrossRef]
  31. Pakfetrat, A.; Taghvaei, M.; Zarrabi, A. A Comprehensive Approach in Green Space Site Planning: An Application of a Three-Stage Multi-Criteria Decision Support System. Urban. Res. Pr. 2020, 13, 45–76. [Google Scholar] [CrossRef]
  32. Li, C.; Zhang, T.; Wang, X.; Lian, Z. Site Selection of Urban Parks Based on Fuzzy-Analytic Hierarchy Process (F-AHP): A Case Study of Nanjing, China. Int. J. Environ. Res. Public. Health 2022, 19, 13159. [Google Scholar] [CrossRef]
  33. Wicaksono, A. Priority Modeling for Public Urban Park Development in Feasible Locations Using GIS, Intuitionistic Fuzzy AHP, and Fuzzy TOPSIS. J. Rekayasa Elektr. 2021, 17. [Google Scholar] [CrossRef]
  34. Laks, I.; Walczak, Z.; Walczak, N. Fuzzy Analytical Hierarchy Process Methods in Changing the Damming Level of a Small Hydropower Plant: Case Study of Rosko SHP in Poland. Water Resour. Ind. 2023, 29, 100204. [Google Scholar] [CrossRef]
  35. Ahmad, N.; Qahmash, A. Implementing Fuzzy AHP and FUCOM to Evaluate Critical Success Factors for Sustained Academic Quality Assurance and ABET Accreditation. PLoS ONE 2020, 15, e0239140. [Google Scholar] [CrossRef] [PubMed]
  36. Hsieh, T.-Y.; Lu, S.-T.; Tzeng, G.-H. Fuzzy MCDM Approach for Planning and Design Tenders Selection in Public Office Buildings. Int. J. Proj. Manag. 2004, 22, 573–584. [Google Scholar] [CrossRef]
  37. Cabała, P. Proces Analitycznej Hierarchizacji w Ocenie Wariantów Rozwiązań Projektowych. Przedsiębiorstwo We Współczesnej Gospod.-Teor. I Prakt. 2018, 24, 23–33. [Google Scholar]
  38. Kutlu, A.C.; Ekmekçioğlu, M. Fuzzy Failure Modes and Effects Analysis by Using Fuzzy TOPSIS-Based Fuzzy AHP. Expert. Syst. Appl. 2012, 39, 61–67. [Google Scholar] [CrossRef]
  39. Krejčí, J.; Pavlačka, O.; Talašová, J. A Fuzzy Extension of Analytic Hierarchy Process Based on the Constrained Fuzzy Arithmetic. Fuzzy Optim. Decis. Mak. 2017, 16, 89–110. [Google Scholar] [CrossRef]
  40. Saaty, T.L. Decision Making—The Analytic Hierarchy and Network Processes (AHP/ANP). J. Syst. Sci. Syst. Eng. 2004, 13, 1–35. [Google Scholar] [CrossRef]
  41. Solecka, K. Wielokryterialna Ocena Wariantów Zintegrowanego Systemu Miejskiego Transportu Publicznego. 2014. Available online: https://repozytorium.biblos.pk.edu.pl/resources/26345 (accessed on 15 April 2025).
  42. Blachowski, J.; Masłowska, K. Wielokryterialna Ocena Dostępności Niezagospodarowanych Złóż Surowców Skalnych Metodami AHP i WLC Na Przykładzie Powiatu Kłodzkiego. Górnictwo Odkryw. 2015, 56, 61–70. [Google Scholar]
  43. Drobne, S.; Lisec, A. Multi-Attribute Decision Analysis in GIS: Weighted Linear Combination and Ordered Weighted Averaging. Informatica 2009, 33, 459–474. [Google Scholar]
  44. World Health Organization. Regional Office for Europe Urban Green Spaces: A Brief for Action. Available online: https://iris.who.int/handle/10665/344116 (accessed on 25 April 2025).
  45. Bieńkowska, M.; Błaszczak, E.; Czyżkowska, A.; Kaźmierczak, E.; Kotowoda, J.; Kwiecień, T.; Pasterkowska, A.; Podolska, J.; Sońta, I.; Suchecka, M. Przegląd Statystyczny Warszawy—3 Kwartał 2023; Główny Urząd Statystyczny: Warsaw, Poland, 2023. [Google Scholar]
  46. Kacperczyk, E.; Ciesielska, K.; Hernik, G.; Matysek-Zdun, U. Powierzchnia i Ludność w Przekroju Terytorialnym [Area and Population in the Territorial Profile]; Główny Urząd Statystyczny: Warsaw, Poland, 2023. (In Polish) [Google Scholar]
  47. The Greenery Board of the Capital City of Warsaw. A Million Trees for Warsaw [Milion Drzew Dla Warszawy]. Available online: https://zzw.waw.pl/2017/03/28/milion-drzew-dla-warszawy/ (accessed on 10 August 2024). (In Polish).
  48. The Greenery Board of the Capital City of Warsaw. Green Streets [Zielone Ulice]. Available online: https://zzw.waw.pl/zieloneulice/ (accessed on 31 December 2018). (In Polish).
  49. Head Office of Geodesy and Cartography Geoportal. Available online: https://www.geoportal.gov.pl/ (accessed on 1 November 2024).
  50. European Commission Copernicus GHSL. Available online: https://human-settlement.emergency.copernicus.eu/ (accessed on 10 January 2025).
  51. EarthExplorer. Available online: https://earthexplorer.usgs.gov/ (accessed on 15 March 2025).
  52. Digital Earth Africa. Available online: https://docs.digitalearthafrica.org/en/latest/data_specs/Landsat_C2_ST_specs.html (accessed on 18 March 2025).
  53. USGS. Available online: https://www.usgs.gov/media/files/landsat-8-9-collection-2-level-2-science-product-guide (accessed on 18 March 2025).
  54. Neema, M.N.; Ohgai, A. Multi-Objective Location Modeling of Urban Parks and Open Spaces: Continuous Optimization. Comput. Env. Urban. Syst. 2010, 34, 359–376. [Google Scholar] [CrossRef]
  55. Zabihi, H.; Alizadeh, M.; Wolf, I.D.; Karami, M.; Ahmad, A.; Salamian, H. A GIS-Based Fuzzy-Analytic Hierarchy Process (F-AHP) for Ecotourism Suitability Decision Making: A Case Study of Babol in Iran. Tour. Manag. Perspect. 2020, 36, 100726. [Google Scholar] [CrossRef]
  56. Sequeira, M.; Hilletofth, P.; Adlemo, A. AHP-Based Support Tools for Initial Screening of Manufacturing Reshoring Decisions. J. Glob. Oper. Strateg. Sourc. 2021, 14, 502–527. [Google Scholar] [CrossRef]
  57. Chandio, I.; Matori, A.-N.; Lawal, D.; Sabri, S. GIS- Based Land Suitability Analysis Using AHP for Public Parks Planning in Larkana City. Mod. Appl. Sci. 2011, 5, 177. [Google Scholar] [CrossRef]
Figure 1. Spatial representations of factors: (a) distance to population areas; (b) land cover/land use suitability; (c) surface temperature values; (d) distance to nuisance objects; (e) NDVI values.
Sustainability 17 05563 g001
Figure 2. Data after pre–processing: (a) distance to population areas; (b) land cover/land use suitability; (c) surface temperature; (d) distance to nuisance objects; (e) NDVI.
Sustainability 17 05563 g002
Figure 3. Buildings that meet all three conditions of the 3-30-300 concept [4].
Sustainability 17 05563 g003
Figure 4. Buildings within 300 m from a park or forest larger than 1 ha [4].
Sustainability 17 05563 g004
Figure 5. Map (a) presents the quality of potential new park locations across the entire city of Warsaw, while map (b) shows detailed results for the Wilanów district.
Sustainability 17 05563 g005
Figure 6. Compliance with the 300 m condition: (a) existing parks and forests; (b) existing parks and forests plus parks in new potential, optimal locations (“the best”).
Sustainability 17 05563 g006
Figure 7. Compliance with the 300 m condition—existing parks and parks in new potential locations (“the best” and “good”).
Sustainability 17 05563 g007
Figure 8. Number of buildings meeting the 300 m condition [%].
Sustainability 17 05563 g008
Figure 9. Meeting the 30% condition: (a) existing parks; (b) existing parks and parks in the potentially best locations.
Sustainability 17 05563 g009
Figure 10. Meeting the 30% condition, taking into account newly generated parks in “the best” and “good” locations.
Sustainability 17 05563 g010
Figure 11. Percentage of tree-covered areas in individual districts.
Sustainability 17 05563 g011
Table 1. The result of the assessment of the degree of suitability of land cover/use types.
Land Cover/Use TypesDegree of Suitability
Grasses, forests, and woodlotsThe best
Bushes and barren vegetationGood
Arable landsMediocre
Permanent cropsPoor
Roads, squares, surface waters, waste disposal sites, excavations, buildings, airports, cemeteries, monuments, and other undeveloped areasExtremely poor
Table 2. Comparison matrix A (square matrix, dimension defined by number of criteria, inversely symmetric).
CRITERIAC1C2CiCn
C11a12a1ia1n
C2 1 / a121a2ia2n
Ci 1 / a1i 1 / a2i1ain
1
Cn 1 / a1n 1 / a2n 1 / ain1
Table 3. Fuzzy matrix A ~ .
CriteriaC1C2CiCn
C1(1,1,1)(l12, a12, u12)(l1i,a1i,u1i)(l1n,a1n,u1n)
C2 ( 1 l 12 , 1 a 12 , 1 u 12 ) (1,1,1)(l2i,a2i,u2i)(l2n,a2n,u2n)
Ci ( 1 l 1 i , 1 a 1 i , 1 u 1 i ) ( 1 l 2 i , 1 a 2 i , 1 u 2 i ) (1,1,1)(lin,ain,uin)
(1,1,1)
Cn ( 1 l 1 n , 1 a 1 n , 1 u 1 n ) ( 1 l 2 n , 1 a 2 n , 1 u 2 n ) ( 1 l i n , 1 a i n , 1 u i m ) (1,1,1)
Table 4. Saaty’s rating scale with associated triangular fuzzy numbers [15,18,34,35].
Intensity of Importance
Classic ScaleDescriptionFuzzy Scale
1Equal 1 ~ = ( 1,1 , 1 )
2Weak advantage 2 ~ = ( 1,2 , 3 )
3Not bad 3 ~ = ( 2,3 , 4 )
4Preferable 4 ~ = ( 3,4 , 5 )
5Good 5 ~ = ( 4,5 , 6 )
6Fairly good 6 ~ = ( 5,6 , 7 )
7Very good 7 ~ = ( 6,7 , 8 )
8Absolute 8 ~ = ( 7,8 , 9 )
9Perfect 9 ~ = ( 8,9 , 10 )
Table 5. Random index values depending on the dimension of the preference matrix [15].
n123456
RI000.580.901.121.24
Table 6. Result of the defuzzification of the fuzzy preference matrix.
CriteriaLand Cover/Land UseSurface
Temperature
NDVIDistance from
Nuisance Objects
Distance from Densely Populated Areas
Land cover/land use1.005.008.006.000.56
Surface temperature0.201.003.002.000.20
NDVI0.130.351.000.560.11
Distance from
nuisance objects
0.170.562.001.000.14
Distance from
populated areas
2.005.009.007.001.00
Table 7. The values of the fuzzy geometric mean matrix, fuzzy weight matrix and normalized weights for each criterion.
CriteriaFuzzy Geometric Mean MatrixFuzzy Weights MatrixNormalized Weights
Distance from populated areas2.933.634.190.310.470.670.46
Land cover/land use2.162.613.280.230.340.520.34
Surface temperature0.560.750.940.060.100.150.10
Distance from nuisance objects0.360.470.630.040.060.100.06
NDVI0.250.300.390.030.040.060.04
Sum:1.00
Table 8. Criteria values and the associated fuzzy membership functions [32,54].
CriterionMaximumMinimumFunction Type
Distance from populated areas [m]17460Linear increasing
Land cover/land use51Linear decreasing
Surface temperature [oC]51.123.1Linear increasing
Distance from nuisance objects [m]32000Linear increasing
NDVI0.540.27Linear increasing
Disclaimer/Publisher’s Note: The statements, opinions and data contained in all publications are solely those of the individual author(s) and contributor(s) and not of MDPI and/or the editor(s). MDPI and/or the editor(s) disclaim responsibility for any injury to people or property resulting from any ideas, methods, instructions or products referred to in the content.

