Abstract
Sustainability is a key focus for the machinery manufacturing industry, aiming to align innovation with environmental and economic goals. This research proposes an Analytic Hierarchy Process (AHP)-based framework to evaluate and rank sustainability-focused innovation criteria. The model was validated using 54,054 projects from CORDIS and TÜBİTAK and a survey of 46 experts from academia, industry, and the public sector. According to AHP results, Economic Criteria ranked highest (46%), followed by Product-Related Environmental (18%), Market (16%), Process-Related Environmental (13%), and Social Criteria (7%). Product Cost (45%), Elimination of Hazardous Substances (30%), and Occupational Health and Safety (29%) ranked highest among sub-criteria, reflecting the dominance of financial and regulatory priorities. Social and process-related criteria were less prioritized unless linked to regulatory compliance. The framework provides a practical tool for innovation leaders and policymakers aiming to embed sustainability in strategic planning. It aligns with global initiatives like the Paris Agreement and the European Green Deal, contributing to both theory and practice in industrial sustainability.
1. Introduction
Innovation is a key driver of economic growth, competitive advantage, and sustainable development in the global economy [,]. In particular, the machinery manufacturing industry, with its energy-intensive processes and high material use, presents significant opportunities to use innovation to meet pressing sustainability targets. However, achieving sustainable innovation is complex. It requires both technological upgrades, strategic resource allocation, and the full integration of sustainability into core business operations [].
Strategic decision-making is a major barrier to sustainable innovation. Traditional evaluation models often prioritize short-term financial outcomes, overlooking broader social and environmental impacts []. In response, Multi-Criteria Decision-Making (MCDM) approaches have become increasingly popular over the past decade for enabling more comprehensive assessments. These methods allow decision-makers (DMs) to evaluate multiple, often conflicting, criteria such as cost, environmental impact, and social value, providing a structured and transparent framework for setting innovation priorities [,].
Although useful, MCDM techniques are still rarely applied in sustainability-focused innovation planning. There is a growing need for empirical studies exploring how these methods can be used to create integrated, sustainability-oriented innovation roadmaps []. This urgency has intensified with the introduction of international policy frameworks, such as the Paris Agreement and the European Green Deal, which press organizations to revise their innovation strategies under stronger sustainability expectations.
The recent literature, particularly since the mid-2010s, has shown increasing interest in connecting innovation, sustainability, and decision-making. However, there is still no clear consensus on how best to integrate the Analytic Hierarchy Process (AHP) into innovation management. While some researchers prefer quantitative tools such as cost–benefit analysis and life cycle assessment, others emphasize qualitative, stakeholder-driven approaches that consider ethical and contextual factors [,]. This divide highlights a deeper controversy: whether sustainability in innovation should be driven by measurable, replicable data or by values, discourse, and inclusion. Thus, an integrative model is needed—one that merges AHP’s quantitative rigor with stakeholder perspectives.
Moreover, much of the current research remains narrow in scope, often focused on specific industries or regions, which restricts the generalizability of findings. To overcome this, more inclusive analyses using large-scale datasets across sectors and regions are essential. Such research would improve our understanding of how sustainability is integrated into innovation strategies and support more widely applicable guidelines [].
This research aims to answer the question “How can sustainability criteria be prioritized to guide innovation strategy in machinery manufacturing?” In doing so, it contributes to the MCDM literature by applying AHP in a sector-specific innovation context. The proposed framework integrates environmental, economic, and social dimensions, positioning sustainability as a core element of industrial innovation planning. This sector-specific approach not only enhances methodological relevance but also improves practical value for decision-makers navigating sustainability transitions in manufacturing. While the framework is methodologically generalizable, its design is informed by the unique sustainability and innovation challenges of the machinery manufacturing industry.
To apply this framework, the research uses a dataset of approximately 500,000 projects from the Community Research and Development Information Service (CORDIS) of the European Union and the Scientific and Technological Research Council of Turkey (TÜBİTAK). A refined subset of 54,054 projects was analyzed using cosine similarity, a common technique in text mining and Natural Language Processing (NLP).
This analytical approach aims to identify the key sustainability criteria embedded within innovation initiatives across different sectors and regions. By uncovering these patterns, the research offers evidence-based insights into how sustainability is integrated into strategic innovation planning [,].
This research offers both theoretical and practical contributions to the fields of innovation management and sustainability. By applying AHP, it seeks to develop a comprehensive framework for guiding sustainable innovation efforts. The findings are expected to support balanced, evidence-based decision-making by companies, policymakers, and researchers, thereby aligning innovation with global development goals [,].
2. Materials and Methods
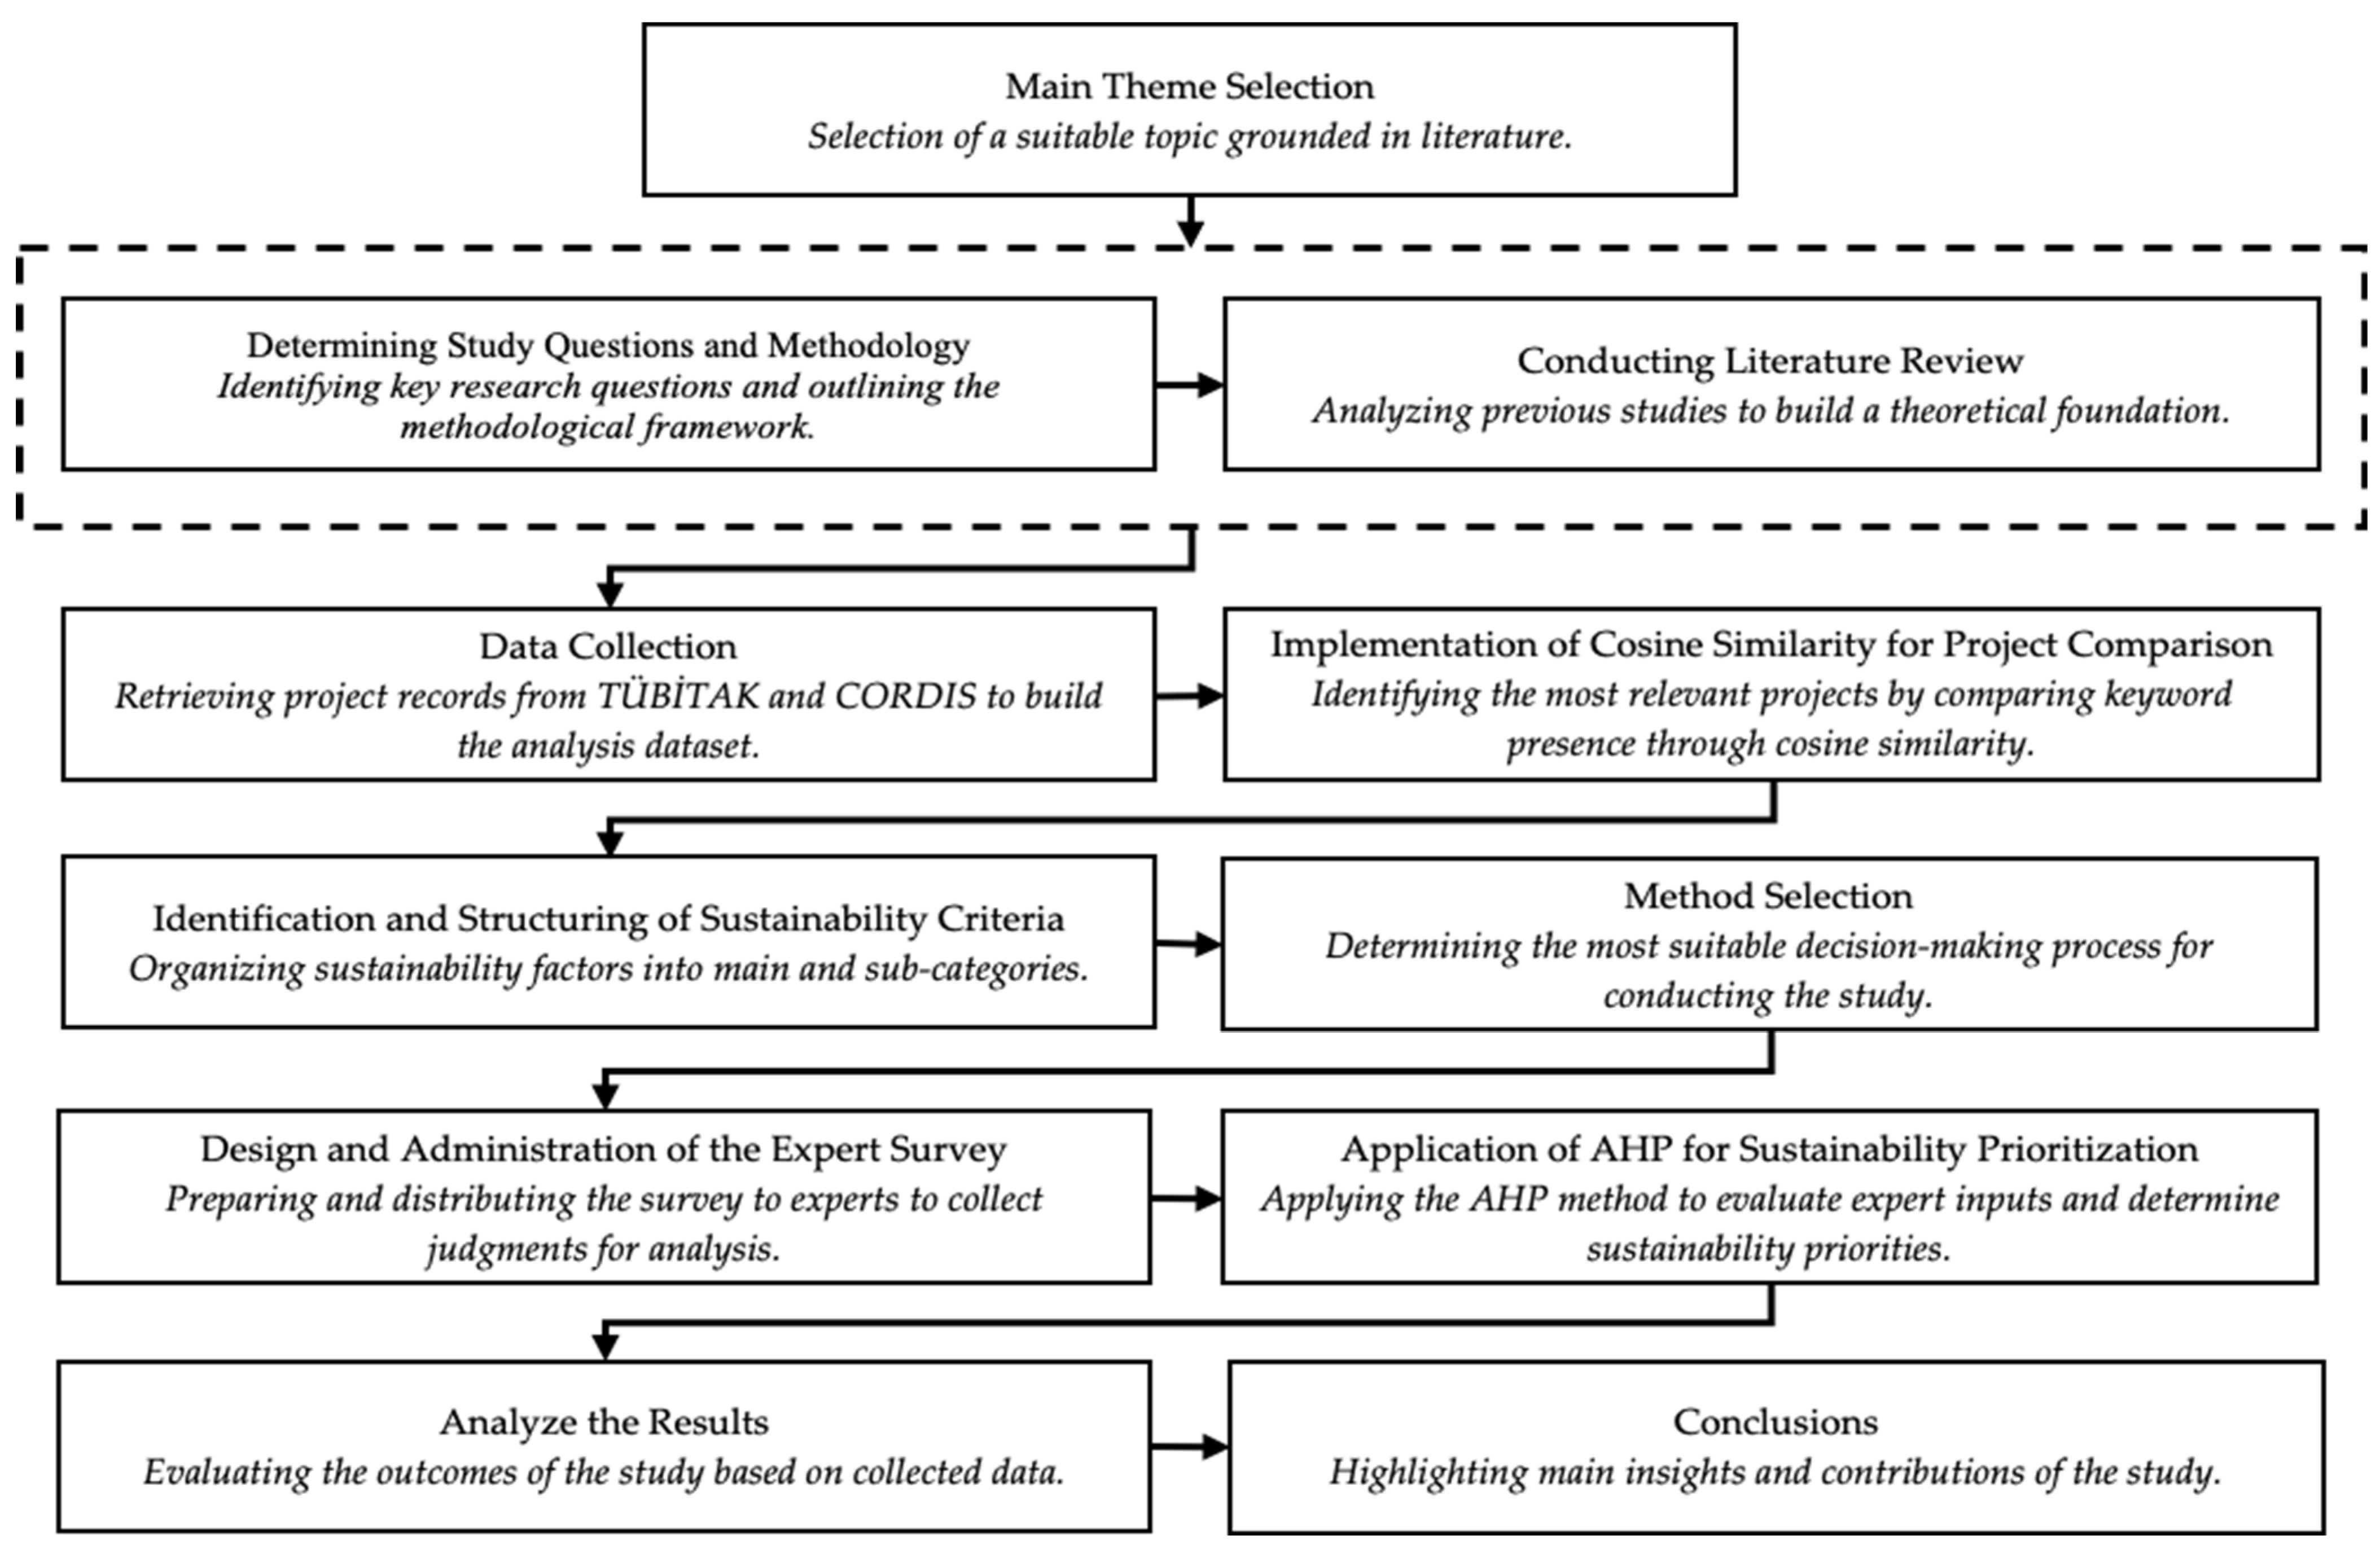
The methodological approach adopted in this research is designed to systematically examine the role of AHP in the development of innovation roadmaps aimed at supporting sustainable innovation []. The research is structured into several distinct phases, beginning with the collection of data and selection of relevant innovation projects. It then proceeds through a series of analytical steps, including the application of cosine similarity algorithms to identify patterns in sustainability alignment [] and concludes with the implementation of AHP to prioritize key sustainability criteria. Each phase is carefully structured to ensure methodological rigor by addressing reliability, validity, and replicability. The specific procedures and tools used are detailed in the following sections, beginning with the strategy for data collection and project selection.
The following diagram (Figure 1) summarizes the key steps of the methodological framework.
Figure 1.
Methodological framework of the research.
2.1. Data Collection and Project Selection
This research is based on the systematic collection and evaluation of data from two major sources: CORDIS and TÜBİTAK. These databases were selected due to their credibility, transparency, and extensive coverage of research and innovation activities. CORDIS, the European Union’s central repository for funded research, includes disciplines such as engineering, energy, and environmental sciences []. It provides structured metadata including project objectives, timelines, funding, and outputs. TÜBİTAK, Türkiye’s leading scientific funding agency, provides a similar project archive with national and regional scope, offering insights into local innovation ecosystems and public Research and Development (R&D) priorities []. Both sources have been widely used in previous studies to analyze research trends, policy outcomes, and the sustainability integration into innovation, making them appropriate for this research’s focus on large-scale innovation strategy analysis.
The initial dataset included approximately 500,000 projects obtained from CORDIS and TÜBİTAK, covering sectors such as technology, machine manufacturing, energy, and environmental sciences. To ensure relevance to the research objectives, a structured, multi-phase selection process was implemented. In the first stage, projects were filtered using sector- and theme-specific keywords such as “machinery”, “manufacturing”, “sustainability”, “innovation”, and “sustainable innovation”, selected based on alignment with European Union and TÜBİTAK strategic priorities. In the second stage, cosine similarity was applied to project abstracts using a sustainability-focused term vector. The similarity threshold was defined through expert input and iterative review to ensure thematic consistency while preserving dataset diversity.
This dual-filtering method combined automated text mining with expert validation, improving the selection’s reliability and contextual accuracy. As a result of this process, the dataset was refined to 54,054 projects, representing a diverse cross-section of innovation initiatives embedded with sustainability objectives. These projects were subsequently retained for in-depth analysis in the following phases.
Following the initial filtering process, a final dataset of 54,054 projects were selected for analysis. This sample size balances analytical manageability and statistical representativeness, ensuring a practical yet diverse dataset. The projects were categorized primarily under the machine manufacturing sector, which aligns with the research’s thematic focus. To capture a wide range of innovation approaches, the dataset includes projects from both public and private institutions, thereby reflecting varying organizational priorities, operational contexts, and funding mechanisms []. Project summaries and objectives were also reviewed to validate their relevance, confirming alignment with key sustainability themes such as carbon reduction, renewable energy, social inclusion, and economic resilience. Including projects across sectors and regions enhances the robustness and generalizability of findings, offering a comprehensive view of how sustainability principles are embedded in innovation strategies []. While the framework is methodologically generalizable, its design is shaped by sustainability needs and innovation challenges specific to the machinery manufacturing industry.
The DMs selected for this research were chosen for their active involvement in sustainability-focused innovation and represent a diverse group from academia, industry, and the public sector. Efforts were made to ensure diversity in sector, professional background, and institutional affiliation. Similarly, the project dataset was drawn from two established public sources—CORDIS and TÜBİTAK—and refined using domain-specific keywords and cosine similarity analysis. This dual-filtering method ensured thematic relevance by selecting projects explicitly addressing innovation and sustainability.
However, despite this rigor, the method may exclude relevant initiatives that contribute to sustainability but do not explicitly mention related terms. The dataset reflects publicly available records on CORDIS and TÜBİTAK and may evolve as new projects are added.
2.2. Implementation of Cosine Similarity for Project Comparison
Following the data collection and project selection phases, the next step involved analyzing the text content of selected projects to identify thematic patterns and similarities. For this purpose, the cosine similarity algorithm was used. Commonly applied in NLP and information retrieval, this method quantifies the similarity between two text vectors in high-dimensional space. It calculates the cosine of the angle between vectors, producing a similarity score from −1 to 1, where 1 indicates complete similarity, 0 represents no correlation, and −1 denotes complete opposition [].
Unlike distance-based measures, cosine similarity focuses solely on vector orientation, making it particularly suitable for textual data where document length may vary. This characteristic allows the algorithm to maintain accuracy and interpretability even when analyzing short descriptions or extended abstracts [].
The cosine similarity between two vectors, A and B, is calculated in Equation (1), as follows:
where
denotes the dot product of vectors and .
and are their respective Euclidean norms (magnitudes).
The dot product is calculated as the sum of the products of corresponding vector components, as follows:
and the magnitudes of each vector are calculated as
In this formulation, and represent the i-th components of the vectors, and n is the number of dimensions in the vector space, typically corresponding to the number of distinct terms across the document corpus. This vector space model, widely used in text mining and information retrieval, represents documents numerically based on term frequency [,].
The cosine similarity algorithm was applied to the metadata extracted from the selected projects, including titles, descriptions, and keywords. Each project was represented as a vector in a high-dimensional space, with each dimension corresponding to a unique term or keyword appearing in the corpus. To construct these vectors, the Term Frequency-Inverse Document Frequency (TF-IDF) method was used, which assigns higher weights to terms frequent within a document but rare across the dataset []. This reduces the impact of common words and highlights distinctive terms, improving the semantic precision of similarity calculations [].
As a result, the algorithm could more effectively capture the thematic content of each project and quantify their similarity based on shared terminology and conceptual overlap. This vector-based approach enabled the construction of a pairwise similarity matrix, forming the basis for the ranking process in the next step. Cosine similarity scores were calculated for project pairs, forming a square matrix where each element reflected the semantic similarity between two projects. This matrix enabled ranking against a reference set of projects explicitly addressing sustainability-related criteria. Top-ranked projects were selected for further analysis, as they likely contained valuable insights into sustainability-oriented innovation. This ranking process served as a targeted filter to ensure that the subsequent analysis focused on the most contextually relevant project data [].
It is important to note that similarity scores were not used to evaluate individual project quality or impact. Instead, they served as thematic indicators to assist filtering. Cosine similarity functioned as a heuristic to detect dominant sustainability patterns across the dataset. While no formal validation metrics (e.g., precision, recall) were applied, the term list for vector modeling was carefully curated based on the literature and policy documents. This is acknowledged as a methodological limitation and discussed further in Section 2.6.
The application of cosine similarity in this research presented several key advantages. It enabled the efficient processing of large-scale textual datasets, supported reproducible comparisons, and was adaptable to various document formats. These features made it well-suited for analyzing the 54,054 selected projects [].
To validate the algorithm results, a manual review of the highest-ranked projects was performed. This ensured their alignment with research objectives and confirmed that similarity scores captured meaningful relationships. Any outliers were flagged for further inspection, enhancing the reliability of the findings.
2.3. Identification and Structuring of Sustainability Criteria
After ranking the projects based on cosine similarity, the next step was to identify and categorize the sustainability criteria most reflected in the selected corpus. These criteria are essential for evaluating innovation projects based on environmental, social, and economic performance, ensuring that project outcomes are aligned with long-term Sustainable Development Goals (SDGs). This classification follows the triple bottom line framework, which emphasizes balance across people, planet, and profit dimensions [,].
The identified sustainability criteria were grouped into four major dimensions, “Economic”, “Market”, “Environmental”, and “Social”, each with several sub-criteria, forming a multi-level structure. This classification facilitates the precise evaluation of sustainability within innovation projects and supports the prioritization process in later stages using the AHP.
The identification of sustainability criteria initiated a thematic analysis of the selected projects’ textual content, particularly their descriptions and associated metadata. Thematic analysis is a commonly used qualitative method used to identify, analyze, and report patterns—or themes—within text datasets []. This approach is particularly valuable in exploratory research aimed at extracting complex constructs from unstructured data sources, such as sustainability dimensions in innovation [].
In this research, thematic analysis combined manual review and automated text mining techniques. The primary objective was to extract recurring sustainability-oriented themes, including economic viability, market relevance, environmental performance, and social contribution. To ensure rigor and replicability, the analysis followed a structured, five-phase process []:
- Initial immersion in project descriptions and metadata to understand the content;
- Identification and coding of key sustainability-related terms and expressions such as “cost efficiency,” “market demand,” “carbon footprint,” and “community engagement”;
- Organization of the coded items into broader thematic categories aligned with the sustainability criteria framework;
- Review and refinement of the thematic groupings to ensure conceptual accuracy and alignment with the research objectives;
- Final definition and naming of each theme to establish a coherent analytical structure for subsequent evaluation.
Based on this process, the sustainability criteria were finalized and categorized into four dimensions as outlined below:
- Economic Criteria focus on the financial feasibility and economic value of innovation projects. Indicators include cost-effectiveness, Return On Investment (ROI), job creation, and broader contributions to economic development;
- Market Criteria address the potential scalability and competitiveness of innovations. Indicators include market demand, customer satisfaction, anticipated market share, and the capacity for expansion;
- Environmental Criteria assess the ecological impact, divided into two subcategories:
- -
- Product-Related Environmental Criteria: energy efficiency, renewable material usage, recyclability, and reduction in greenhouse gas emissions;
- -
- Production Process-Related Environmental Criteria: waste and resource management, energy and water consumption, emission control, and compliance with environmental standards.
- Social Criteria consider the societal implications of innovation activities. Indicators include community engagement, equitable labor conditions, gender inclusion, access to education and healthcare, and improvements in overall quality of life.
Together, these criteria constitute a holistic framework for sustainability assessment, aligned with established models of sustainable innovation and the triple bottom line perspective [,].
To ensure the robustness and global relevance, the criteria were cross-referenced with internationally recognized frameworks, particularly the United Nations Sustainable Development Goals (SDGs) and Global Reporting Initiative (GRI) standards [,]. This comparison validated the framework’s conceptual soundness and enhanced its applicability across sectors and regions.
The finalized criteria set provides the analytical basis for the next research stages, including the design of the survey instrument and the application of the AHP. By systematically defining, structuring, and validating these criteria, the research ensures methodological rigor and contextual relevance in assessing innovation initiatives. This framework strengthens the research’s capacity to generate actionable insights aligned with the broader objectives of sustainable innovation and strategic decision-making in complex organizational settings.
2.4. Application of the Analytic Hierarchy Process (AHP) for Sustainability Prioritization
At the beginning of the research, several established MCDM methods were reviewed to ensure alignment with the research’s hierarchical structure and objectives. Given the multi-level organization of the sustainability criteria—including main categories and sub-dimensions—AHP was selected as the most suitable method.
Its intuitive structure and clarity made AHP appropriate for a diverse group of DMs with varying levels of expertise. Additionally, AHP facilitates structured reasoning in complex decision environments, integrates both qualitative judgments and quantitative data, and promotes participatory decision-making by incorporating expert and stakeholder input.
Originally developed by Saaty [], AHP is a structured MCDM method designed to facilitate complex evaluations involving both qualitative and quantitative inputs. Its hierarchical structure enables DM to decompose a complex problem into a set of interrelated decision elements, including objectives, criteria, sub-criteria, and alternatives [,]. This structured breakdown allows for systematic comparison and supports transparent and replicable analysis.
AHP is used to determine the relative importance of sustainability criteria identified through thematic analysis. It serves as a bridge between expert judgment and systematic prioritization, allowing the incorporation of stakeholder perspectives into an analytically robust framework [,]. Using the results of a structured expert survey, AHP derives weightings for both main and sub-criteria, supporting evidence-based decisions in sustainable innovation management.
The AHP implementation process involves the following steps []:
- Problem definition and objective determination;
- Determination of main and sub-criteria;
- Identification of decision alternatives;
- Establishing the hierarchical structure;
- Constructing pairwise comparison matrices;
- Pairwise comparison matrices for main and sub-criteria;
- Consistency Ratio (CR) calculation;
- Calculation of priority weights;
- Determining priorities and calculating alternative scores.
2.4.1. Problem Definition and Objective Determination
The initial phase of AHP involves clearly defining the problem and specifying the objective that the decision-making process seeks to achieve. This step establishes the analytical foundation for evaluating all variables and alternatives under a unified goal. A well-formulated problem statement enhances methodological rigor and improves the reliability of the resulting decisions [].
This stage involves identifying root causes, relevant stakeholders, and how the issue affects different domains. If the problem is poorly defined, it can lead to ambiguity in subsequent steps, making it harder to select appropriate criteria or evaluate alternatives, and ultimately weakening the model’s effectiveness.
2.4.2. Determination of Main and Sub-Criteria
Defining evaluation criteria in a structured way is a key step in AHP, as it provides the foundation for valid comparisons and decisions. In this research, the criteria are organized hierarchically into four core dimensions: Economic, Market, Environmental, and Social—a structure derived from the sustainability-focused innovation literature and MCDM frameworks [,]. To capture both product-level and process-level sustainability aspects, the Environmental criteria are further divided into Product-Related and Production Process-Related categories.
This classification was informed by internationally accepted sustainability standards, including the United Nations SDGs and the GRI Sustainability Reporting Standards, ensuring global relevance and practical applicability [,].
All sub-criteria and their definitions are presented in Tables (Table 1, Table 2, Table 3, Table 4, Table 5 and Table 6), organized by category and uniquely coded for reference in subsequent AHP analysis. This structure improves transparency, consistency in data collection, and traceability throughout the process.
Table 1.
Main criteria and their definitions.
Table 2.
Economic criteria—sub-criteria and definitions.
Table 3.
Market criteria—sub-criteria and definitions.
Table 4.
Product-related environmental criteria—sub-criteria and definitions.
Table 5.
Production process-related environmental criteria—sub-criteria and definitions.
Table 6.
Social criteria—sub-criteria and definitions.
2.4.3. Identification of Decision Alternatives
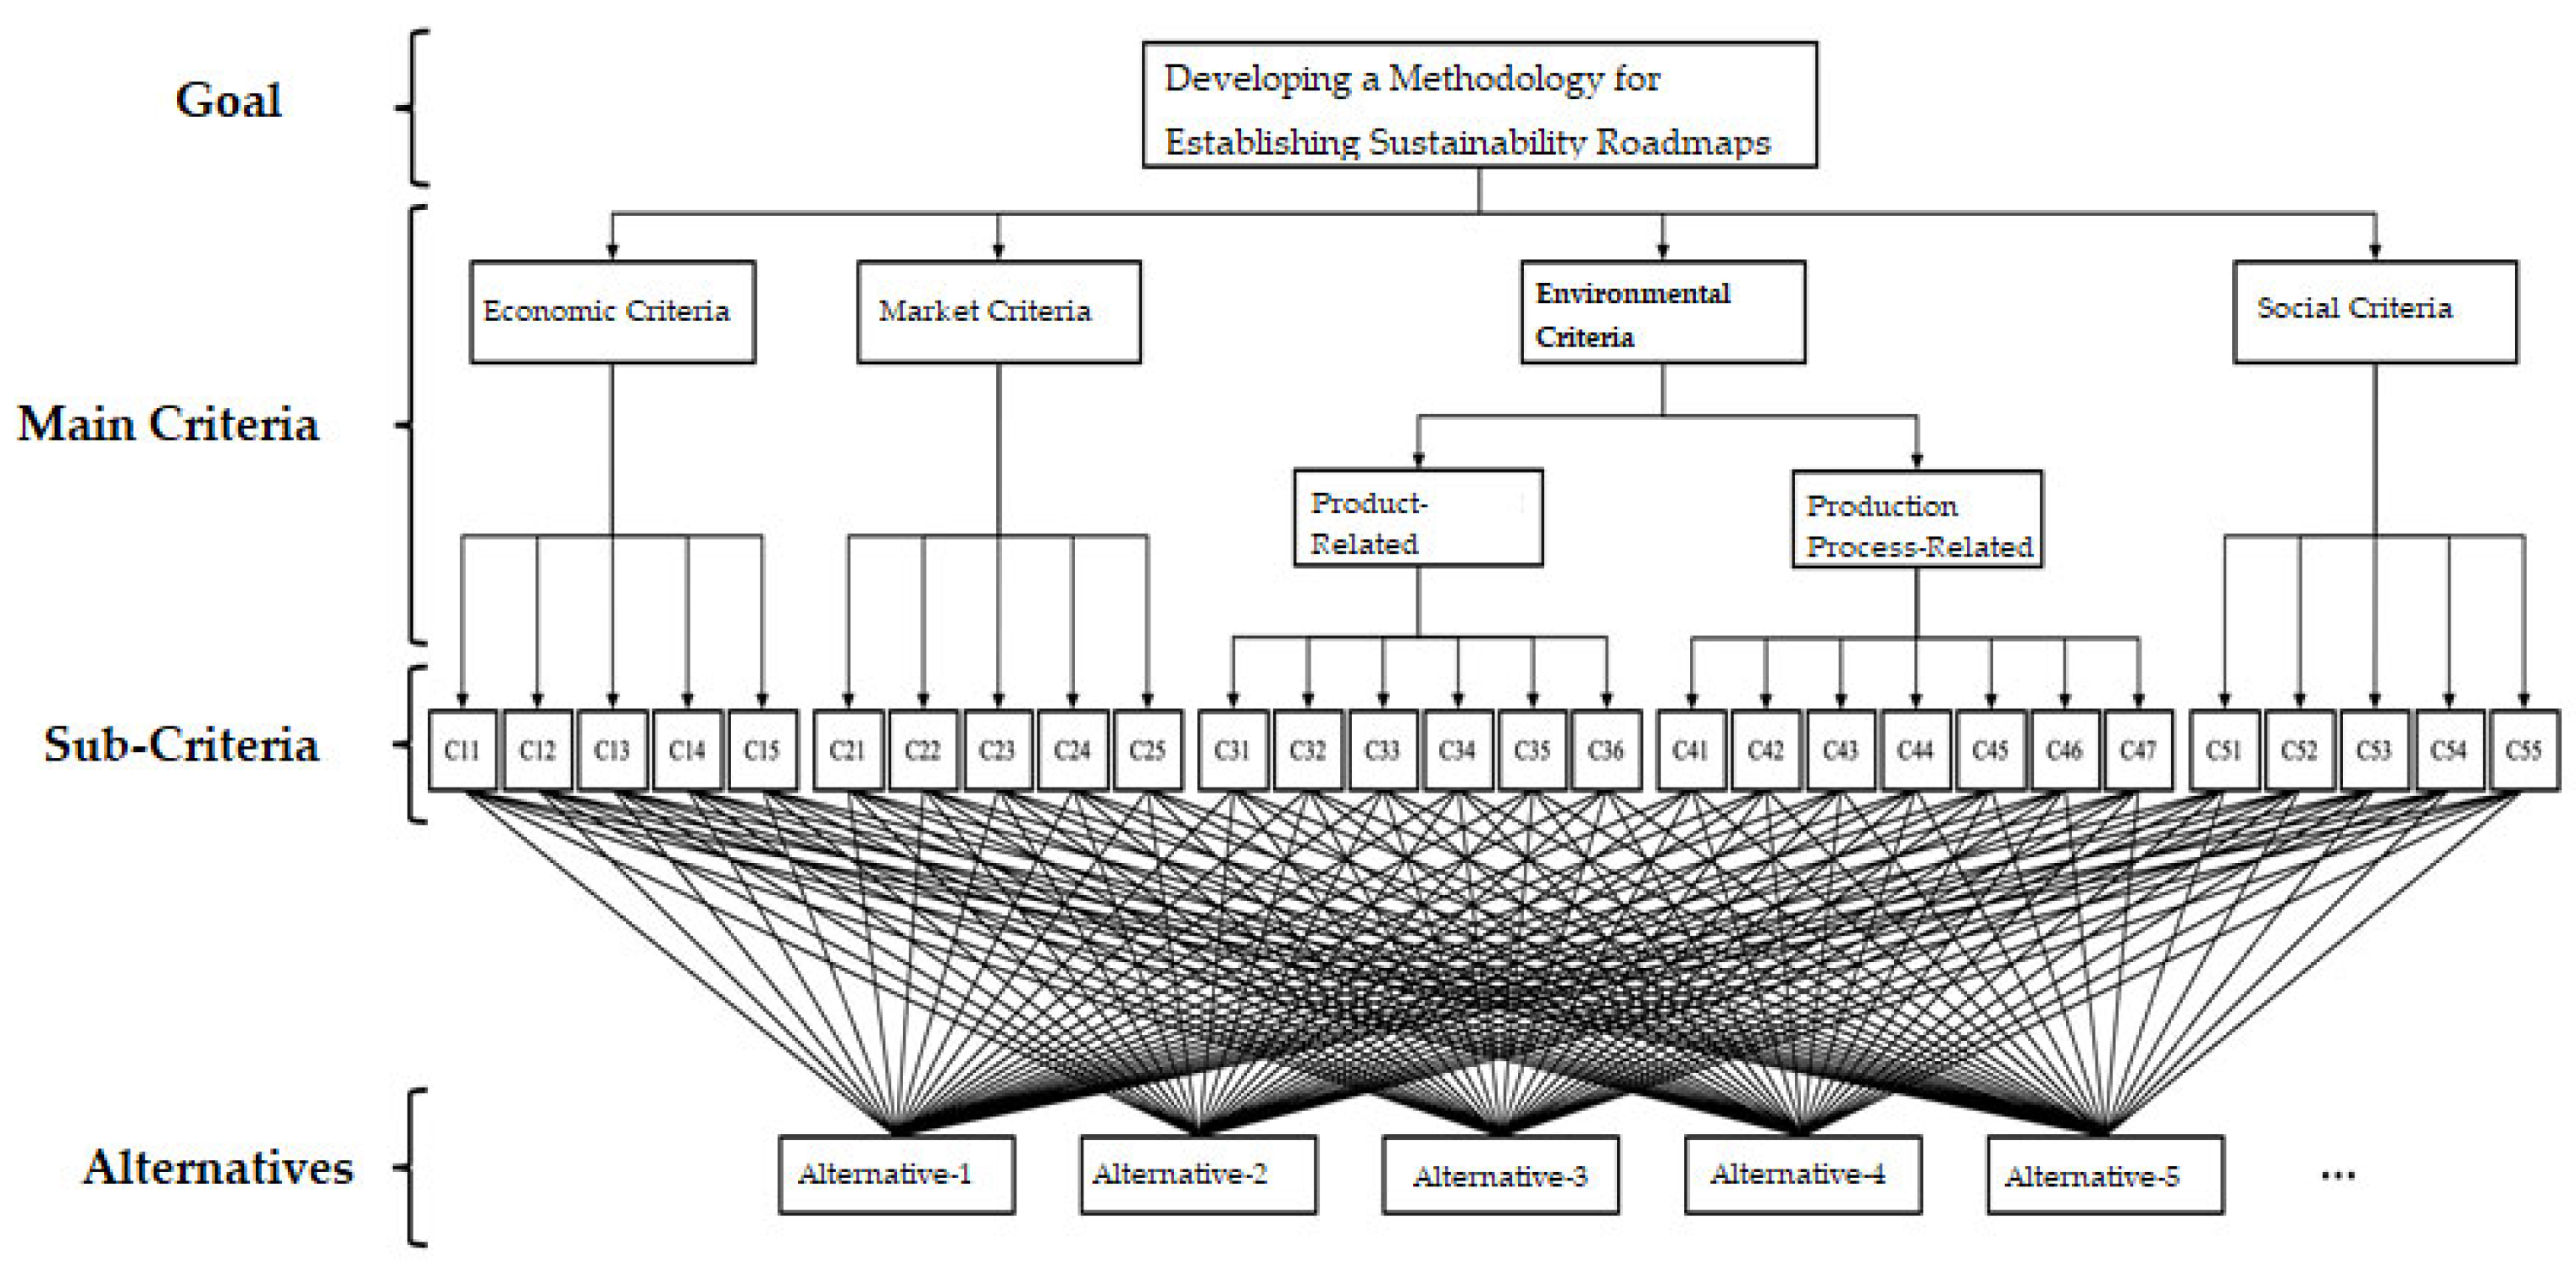
In the AHP, the decision-making process is structured into four hierarchical levels: goal, main criteria, sub-criteria, and alternatives. This structure enables DMs to systematically prioritize complex variables and clarify how each component contributes to the final outcome [,].
At the top is the goal, which defines the primary objective of the decision process. All criteria and alternatives are evaluated based on how well they support this goal []. Below the goal are the main criteria, representing broad dimensions essential to achieving the objective. These provide a structured basis for assessment []. Each main criterion is further divided into sub-criteria, which offer greater detail and precision in evaluation. This allows DMs to incorporate both expert judgment and quantitative data []. At the lowest level of the hierarchy, the alternatives represent the different options available. These are assessed against all criteria to identify the most suitable solution. The hierarchical structure enhances consistency, transparency, and cognitive alignment in the decision process [].
2.4.4. Establishing the Hierarchical Structure
The main and sub-criteria established in this research, along with the hierarchical structure developed for the analysis, are presented in Figure 2.
Figure 2.
Hierarchical structure.
2.4.5. Constructing Pairwise Comparison Matrices
In AHP, pairwise comparison matrices are essential for systematically comparing elements such as criteria and alternatives. These matrices allow DMs to evaluate the relative importance of elements by conducting two-by-two comparisons, thus facilitating the quantification of subjective judgments into priority weights [].
Each pairwise comparison matrix is square, with the number of rows and columns corresponding to the number of elements being compared. The diagonal entries are always assigned a value of 1, since an element is equally important to itself. If element A is judged to be more important than element B, the corresponding entry in the matrix reflects the relative strength of that preference; the reciprocal of that value is automatically assigned to the inverse comparison (B compared to A). This ensures that the matrix maintains reciprocal consistency.
The judgments are typically expressed using the fundamental scale developed by Saaty [], known as the Saaty Scale, which ranges from 1 to 9. Table 7 summarizes this scale and its qualitative interpretations.
Table 7.
Saaty scale for pairwise comparisons.
These matrices are constructed separately for both the main criteria and sub-criteria, as well as for the alternatives when needed, depending on the hierarchical structure of the problem. They produce weighted priorities based on the DMs’ evaluations and ensures consistency.
Beyond their intuitive clarity, pairwise comparisons offer mathematical robustness. Combined with consistency checks and eigenvalue calculations, they enhance the transparency and reliability of multi-criteria decisions [,].
2.4.6. Pairwise Comparison Matrices for Main and Sub-Criteria
The pairwise comparison matrices developed for the main and sub-criteria in this research form the foundation for determining the relative importance of evaluation factors within the AHP framework. These matrices maintain a symmetric structure, where each element reflects the perceived importance of one criterion over another, as assessed by DMs using the Saaty Scale [].
As an example, the matrix for the main criteria is shown in Table 8. Similar matrices were constructed for each sub-criterion group, including economic, market, environmental (product-related and process-related), and social dimensions. To maintain clarity and avoid repetition, the remaining matrices are provided in Appendix A.
Table 8.
Pairwise comparison matrix for main criteria (illustrative example).
When multiple DMs provide their judgments, it becomes essential to aggregate these evaluations systematically to ensure consistency and reliability. Within the AHP, the geometric mean method is widely accepted as the most appropriate approach for synthesizing individual pairwise comparisons []. This technique enables the combination of individual judgments while minimizing the influence of outliers, thereby offering a more robust and balanced aggregation compared to arithmetic averaging.
The geometric mean for each pairwise comparison is calculated across all DMs according to Equation (2), as follows:
where
represents the final pairwise comparison value;
denotes the pairwise comparison value assigned by the -th DM;
is the total number of DMs.
After deriving the aggregated pairwise comparison matrix, the next essential step is matrix normalization. Normalization ensures that the priority weights extracted from the matrix are both consistent and meaningful by converting the raw scores into a standardized scale. This is achieved by dividing each element of a column by the sum of that column in the aggregated matrix by using Equation (3).
The normalization process is expressed as
where
represents the normalized value in row and column ;
is the original value from the aggregated pairwise comparison matrix;
denotes the sum of all values in column .
This procedure ensures that each column in the normalized matrix sums to one, enabling the direct computation of relative weights.
Normalization also plays a crucial role in minimizing distortions caused by differences in measurement scales. It allows for the comparison of diverse criteria on a common scale, promoting fairness and clarity in the evaluation process.
Once the normalized matrix is obtained, the eigenvector representing the priority weights is computed by averaging the values in each row. This yields the relative importance of each criterion as a proportion of the total, as shown in Equation (4), as follows:
where
denotes the priority weight of criterion ;
represents the normalized value of the , element;
is the total number of criteria.
These priority weights wi are then assembled into a vector form, known as the eigenvector, as shown in Equation (5)
The eigenvector encapsulates the overall priority distribution among criteria or alternatives, based on the DMs’ input. It transforms qualitative judgments into a quantitative format, enabling a consistent and objective ranking. Also, it serves as the foundation for subsequent steps in the AHP methodology, such as consistency checking and final decision synthesis.
This method not only enhances the transparency of the evaluation process but also ensures that the final decision is well-grounded in a rational, systematic, and mathematically sound framework [].
2.4.7. Consistency Ratio (CR) Calculation
To assess whether the assigned importance weights are consistently derived, the CR is calculated []. This process involves computing the Consistency Index (CI) and the Random Index (RI).
The CI is a diagnostic tool for evaluating the degree of consistency within the pairwise comparison matrices. It quantifies how closely the judgments of DMs align with a perfectly consistent matrix. A lower CI indicates greater consistency, whereas a higher CI highlights the need for potential revisions.
The CI is calculated using Equation (6), as follows:
where
is the largest eigenvalue;
is the number of criteria in the comparison matrix.
To calculate the CI, the largest eigenvalue () must first be obtained. This involves multiplying the pairwise comparison matrix (A) by the eigenvector (w) derived from the normalized matrix as shown in Equation (7):
where
is the resulting eigenvalue vector;
is the aggregated comparison matrix;
is the priority vector (eigenvector) derived in the previous step.
This operation reflects how well the original matrix corresponds with the calculated priorities, forming the basis for computing .
Next, the largest eigenvalue is calculated as the average ratio of each element in w′ to the corresponding element in w, as shown in Equation (8).
where
is the value from the eigenvalue vector;
is the corresponding priority weight;
is the number of criteria.
This step is critical because it reflects the internal coherence of the DMs’ judgments. Once the is known, the CI can be computed using Equation (6).
After determining the CI, the appropriate RI value is selected from “Saaty’s Random Index (RI) Table” (Table 9), which contains empirically derived average consistency indices for randomly generated matrices of various sizes.
Table 9.
Saaty’s Random Index (RI) table.
- where
is the size of the matrix;
is the corresponding index.
This value is used in the CR calculation to determine whether the pairwise comparisons exhibit an acceptable level of consistency.
After the CI and RI are calculated, the CR can be determined. The CR is computed as shown in Equation (9).
This ratio indicates whether the level of inconsistency in the pairwise comparisons is acceptable. If CR < 0.10, the level of consistency is considered sufficient. However, if CR ≥ 0.10, it suggests that inconsistencies exist in the judgment data, requiring DMs to revisit and refine their responses.
A consistent matrix confirms that the decision-making process is logical and reliable, strengthening the validity of the results.
2.4.8. Calculation of Priority Weights
In the AHP, the numerical values that reflect the relative importance of criteria or alternatives are referred to as priority weights. These values—also known as eigenvectors—are derived from pairwise comparisons conducted by DMs and form the foundation for subsequent ranking and decision-making processes [].
The priority weights constitute a weight vector that quantifies how much influence each criterion or alternative has in relation to the others. This vector ensures that the decision-making process is both systematic and grounded in quantifiable judgments. The accurate computation of these weights is critical to preserving consistency and objectivity across the model.
Once the CR has been verified to fall within an acceptable range (i.e., CR < 0.10), the normalized eigenvector obtained in Equation (4) is interpreted as the set of priority weights. These values are typically expressed as percentages and directly indicate the relative significance of each criterion or the preference level of each alternative within the decision hierarchy.
2.4.9. Determining Priorities and Calculating Alternative Scores
Once the priority weights (eigenvectors) for the criteria have been established, they are ranked from highest to lowest to determine their relative importance []. This ranking facilitates the identification of which criteria hold the greatest weight in the decision-making process.
Following this prioritization, the next step involves calculating the final scores for each decision alternative. This is accomplished by multiplying the priority weight of each criterion by the corresponding performance value of the alternative for that criterion. The resulting weighted scores are then summed to yield an overall score for each alternative.
This method enables a comprehensive and objective evaluation of all alternatives, considering both their individual performances and the relative significance of the criteria. Ultimately, the alternative with the highest aggregated score is considered the most favorable within the context of the established decision framework.
2.5. Design and Administration of the Expert Survey
Following the structured identification and validation of sustainability criteria, the next methodological step involved the development of a tailored expert survey to capture expert evaluations of these criteria. The survey was structured to elicit both qualitative reflections and quantitative assessments, thus enabling a multidimensional understanding rooted in practice and scholarship. Adhering to established survey methodology standards, the design emphasized clarity, logical flow, and respondent accessibility to reduce bias and improve data quality []. This approach ensured that the instrument was both analytically rigorous and user-oriented.
The survey was organized into four main sustainability dimensions: “Economic,” “Market,” “Environmental” (further divided into “product-related” and “production process-related” aspects), and “Social”. In each category, a combination of question types was employed to gather both structured and exploratory responses. Closed-ended items used a nine-point Likert-type scale adapted from Saaty’s fundamental scale to capture participants’ judgments regarding the relative importance of criteria. This scale ranged from 9 (extremely important) to 1/9 (extremely unimportant), enabling precise pairwise comparisons. Open-ended questions were included to elicit qualitative insights, allowing respondents to elaborate on the rationale behind their evaluations and contextual factors influencing their decisions [].
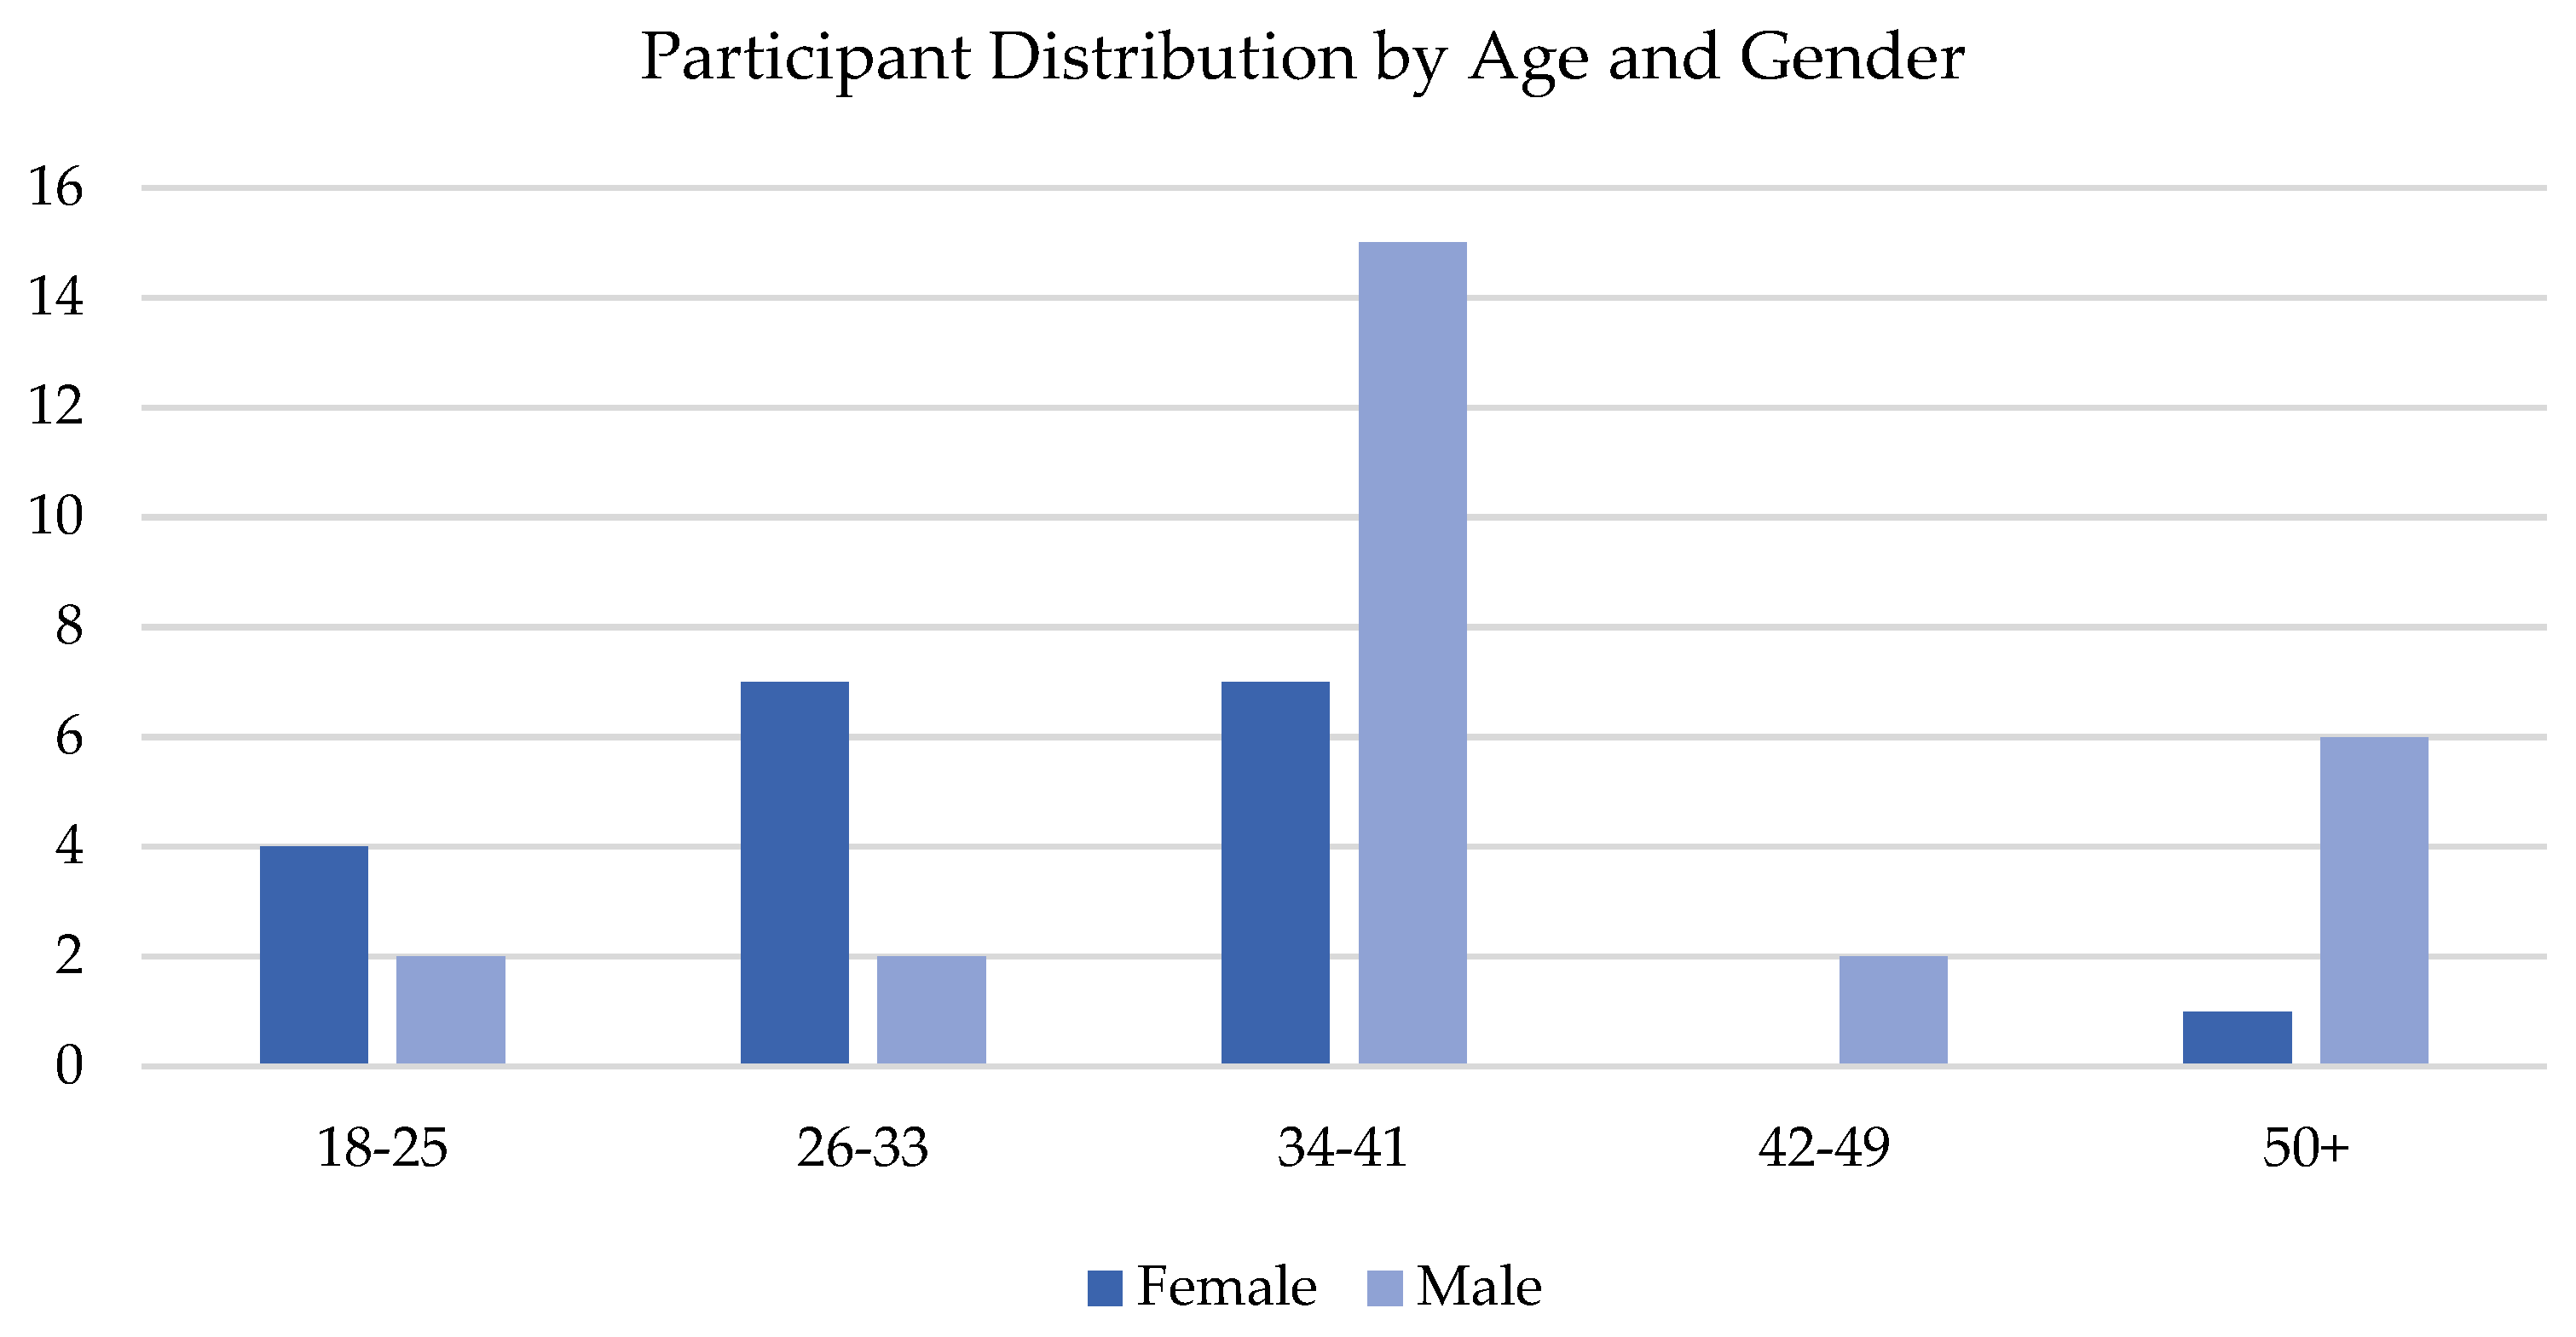
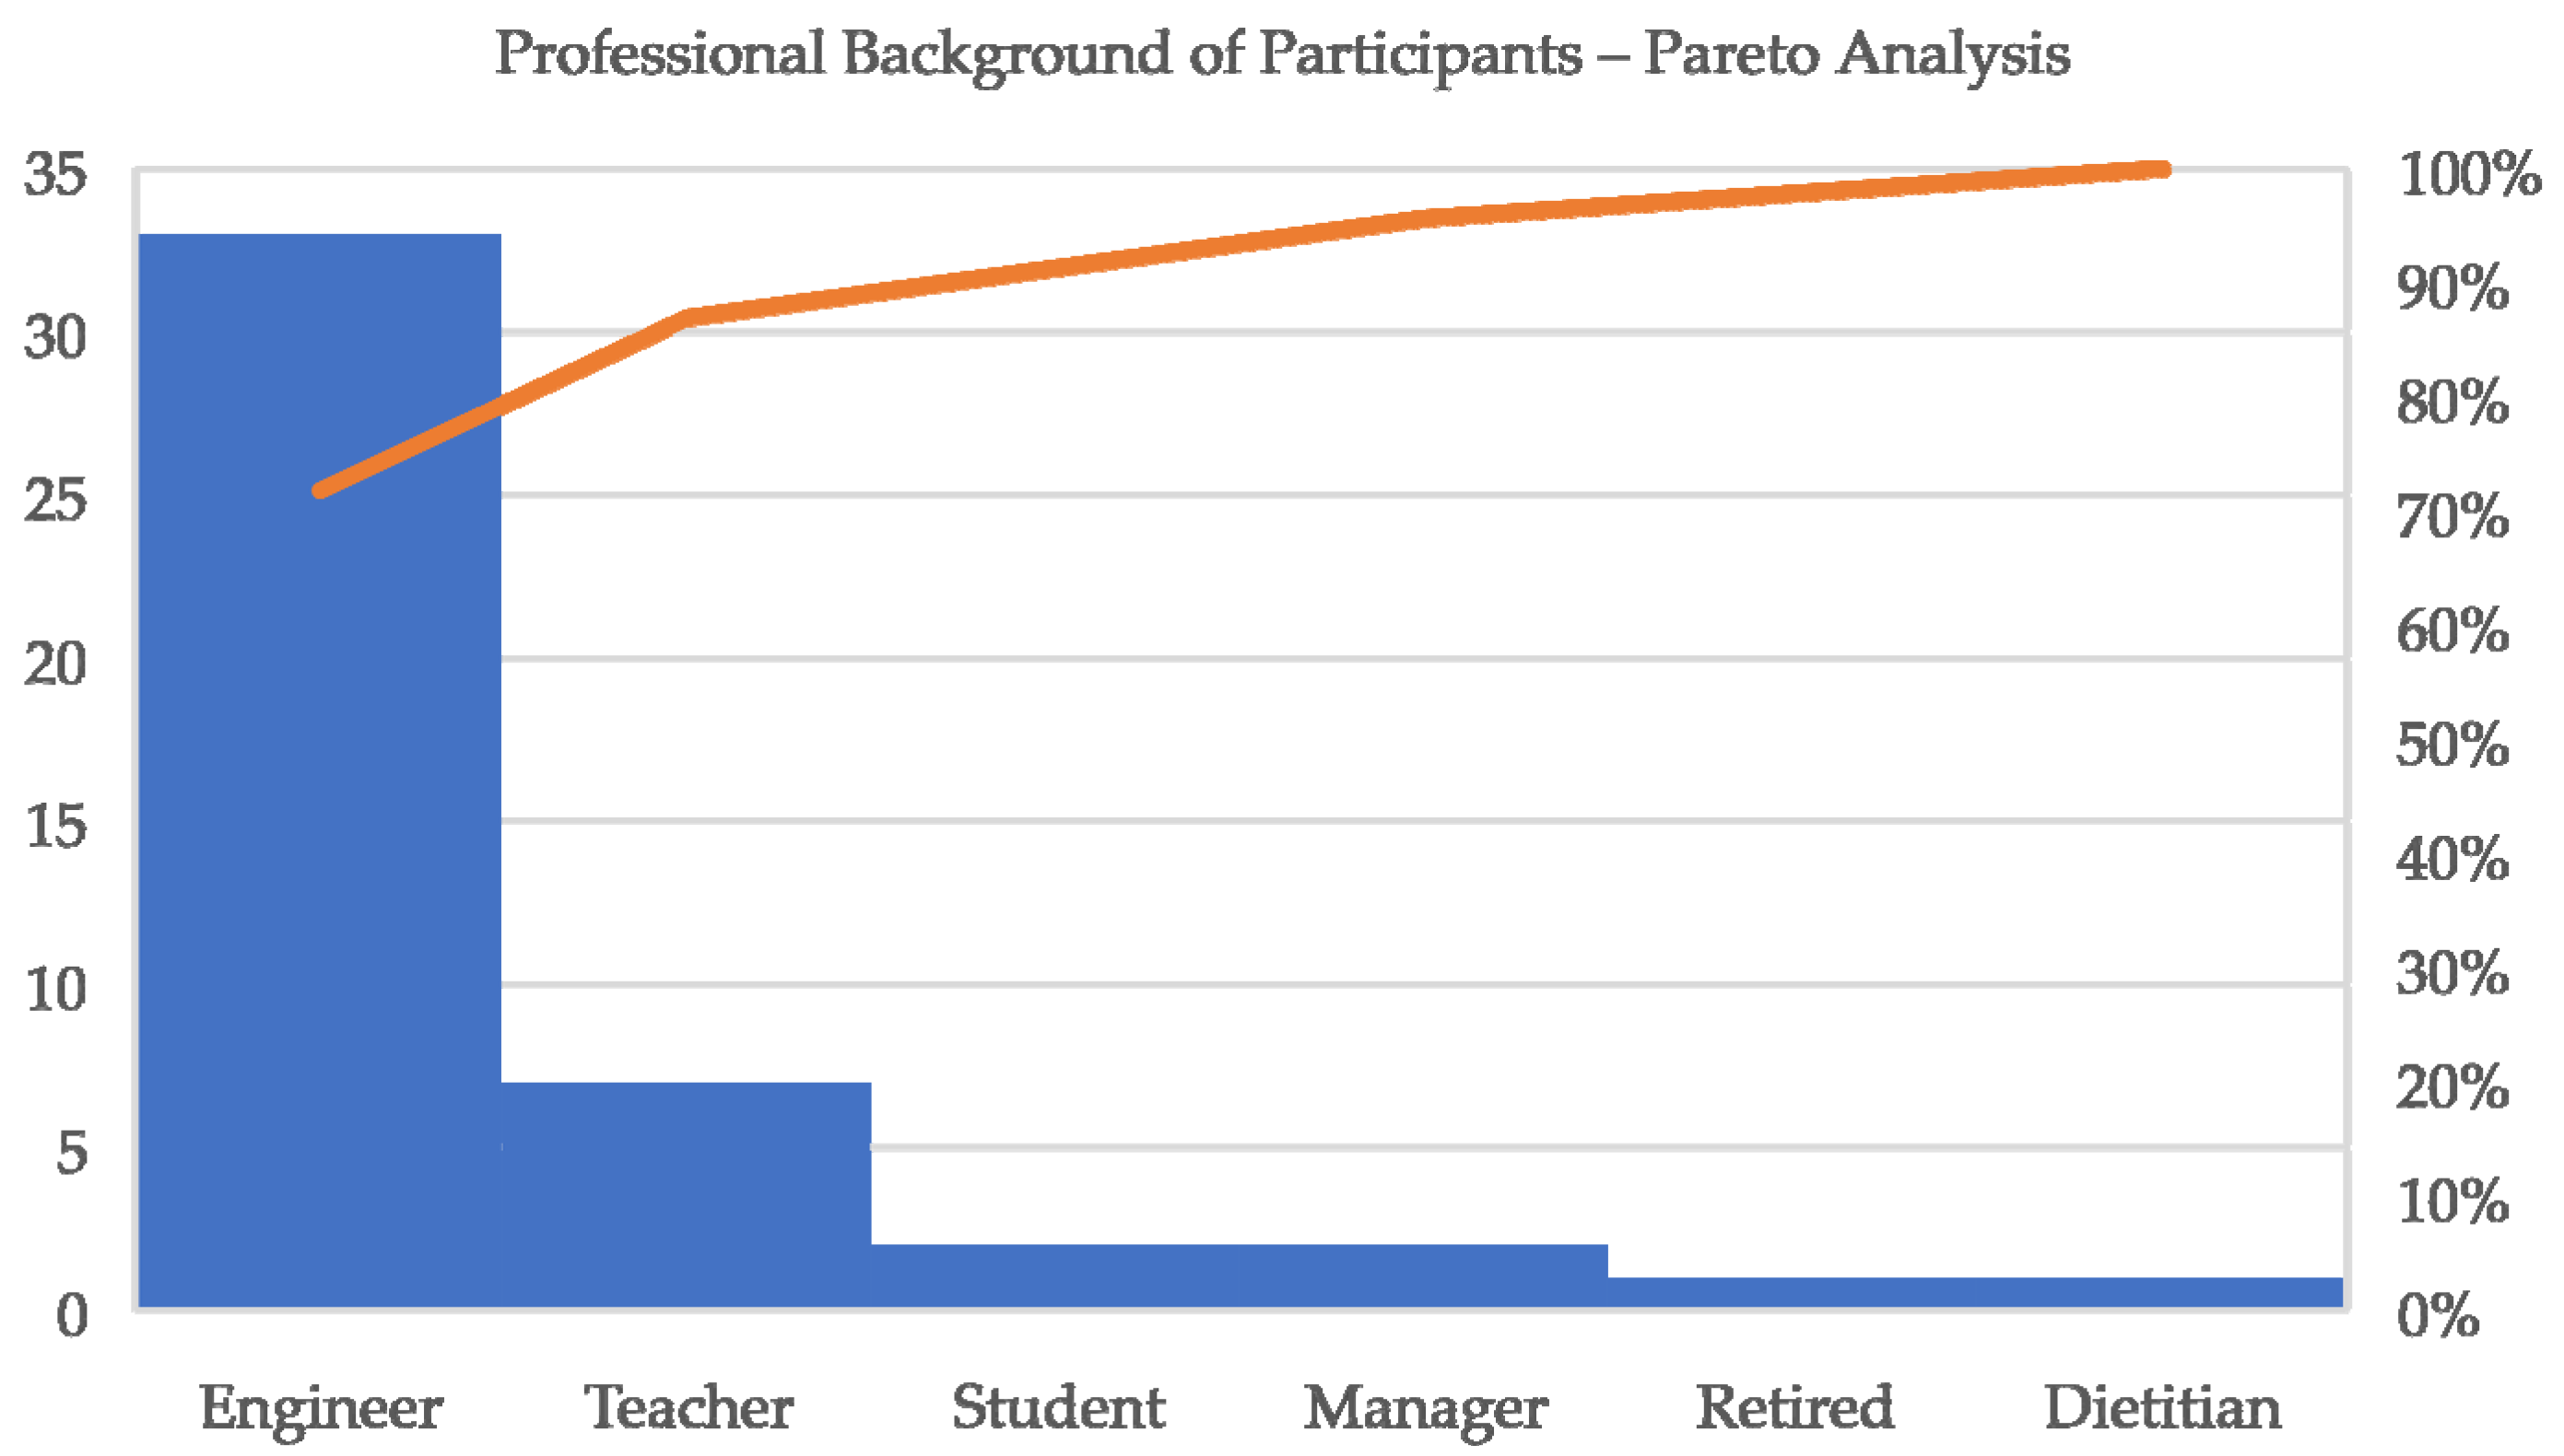
A total of 46 individuals participated in the AHP survey, selected from a national stakeholder database with a focus on demonstrated expertise in sustainability and innovation. Participants were chosen to reflect a diversity of professional backgrounds—including engineers, academics, students, retirees, dietitians, and teachers—with particular emphasis on those engaged in engineering, academic, or administrative roles relevant to the machinery manufacturing context. The selection criteria prioritized individuals with domain-specific knowledge and active involvement in organizational or policy-level sustainability efforts, enhancing both the validity and generalizability of the results []. Prior to the survey, participants received a brief orientation on the AHP methodology, the logic of pairwise comparisons, and the use of the 1–9 rating scale. This training material was also embedded in the online survey form as a downloadable reference to ensure consistency in interpretation. The survey was administered via a secure online platform (Google Forms), allowing for broad geographic access and efficient data collection. Respondents were given two weeks to complete the questionnaire; with reminder emails sent one week after initial distribution to minimize non-response bias []. All responses were anonymized and reported in aggregate to protect privacy.
To interpret the survey data, a dual-method approach was used. Quantitative analysis employed descriptive statistics (means and standard deviations) to rank the sustainability criteria. In parallel, open-ended responses were analyzed using Braun and Clarke’s six-phase thematic analysis framework [] This combination revealed both prioritized criteria and the reasoning behind them, enhancing the depth and interpretability of the results [].
To reduce the number of comparisons each respondent had to complete, the minimum number of pairwise comparisons was calculated using Equation (10). This ensured that all necessary comparisons were covered without redundancy. By limiting unnecessary repetition, this design reduced cognitive fatigue and improved the accuracy and reliability of responses.
where represents the total number of criteria included in the evaluation.
2.6. Limitations, Generalizability, and Future Research
This research proposes a structured, data-driven framework for prioritizing sustainability criteria using AHP and cosine similarity analysis. Despite its methodological strengths, several limitations must be acknowledged.
First, AHP depends on subjective expert input. The prioritizations may reflect individual perceptions, biases, or institutional roles. Although efforts were made to diversify the panel of 46 decision-makers from academia, industry, and public sectors, the sample was still centered on the machinery manufacturing context in Türkiye and Europe. This may limit the generalizability of the results to other sectors or regions.
Second, the project dataset was filtered using domain-specific keywords and cosine similarity. While effective in ensuring thematic relevance, this method may have excluded projects that support sustainability but lack explicit terminology. Moreover, the filtering process was not formally validated using standard metrics such as precision or recall, introducing uncertainty about completeness.
Third, the research lacks qualitative depth. While the AHP and text-based methods provided quantitative structure, the absence of expert interviews or case-based inquiry limits understanding of contextual motivations behind criteria rankings.
To overcome these limitations, future research should consider the following:
- Using longitudinal methods to track how sustainability priorities evolve in response to policy, technology, and social change;
- Expanding the geographic and industrial diversity of expert participants to improve generalizability;
- Incorporating qualitative methods—such as semi-structured interviews, focus groups, and case studies—to enrich interpretation and support triangulation.
Combining these approaches would strengthen both the theoretical grounding and practical relevance of future decision-support models. Ultimately, this can help create more adaptive and inclusive frameworks for sustainability-focused innovation.
3. Results
In this section, the data obtained from the research will be analyzed and presented. The findings of the survey are discussed, followed by a detailed evaluation of the results.
3.1. Structure and Quantity of Survey Items
To evaluate the relative importance of sustainability criteria, the survey used pairwise comparison based on Saaty’s fundamental AHP scale []. For each main criterion, its sub-criteria were compared two at a time. For example, when a given criterion included three sub-criteria—labeled X, Y, and Z—respondents were asked to compare X with Y, X with Z, and Y with Z. This comparative structure enabled a nuanced assessment of the internal priority relationships among sub-criteria.
The total number of these comparisons was determined using Equation (10), which calculates the minimum number of distinct pairings required for complete evaluation without redundancy. By applying this method, a total of 81 pairwise comparison questions were generated across the survey, distributed as follows:
- A total of 10 comparisons for five main criteria;
- A total of 10 for economic sub-criteria;
- A total of 10 for market sub-criteria;
- A total of 15 for six product-related environmental sub-criteria;
- A total of 21 for seven process-related environmental sub-criteria;
- A total of 15 for six social sub-criteria.
This distribution ensured a balanced and comprehensive coverage of all relevant dimensions within the sustainability framework, aligning with practices commonly used in multi-criteria evaluation studies [,].
In addition to these analytical items, three demographic questions—related to participants’ gender, age group, and occupational field—were included. This brought the total number of survey questions to 84.
3.2. Demographic Characteristics of the Decision-Makers (DMs)
To enable a richer interpretation of the survey results, the questionnaire included items capturing basic demographic information about the DMs, specifically their gender, age group, and professional background. The inclusion of these variables not only allowed for a more detailed profiling of participants but also supported the possibility of subgroup analyses to explore whether demographic factors might influence perceptions of sustainability priorities.
A total of 46 experts participated in the research. Of these, 27 respondents (58.7%) identified as male and 19 (41.3%) as female, indicating a moderately male-skewed participant base. In terms of age distribution, the majority fell within the 26–33 age range, comprising 22 participants (47.8%). This was followed by 9 participants aged 18–25 (19.6%), 7 aged 42–49 (15.2%), 6 aged 34–41 (13.0%), and 2 respondents aged 50 and over (4.3%). This demographic profile (shown in Figure 3) suggests that the respondent pool was largely composed of young to mid-career professionals, likely reflecting a cohort actively engaged in contemporary sustainability and innovation practices.
Figure 3.
Participant distribution by age and gender.
With respect to professional backgrounds, most DMs were engineers, accounting for 33 individuals (71.7%), demonstrating the technical orientation of the participant group. The remaining participants included 7 teachers (15.2%), 2 managers (4.3%), 2 students (4.3%), 1 retired respondent (2.2%), and 1 dietitian (2.2%). This composition indicates that (shown in Figure 4), while the sample was predominantly drawn from applied science and engineering fields, it also included some disciplinary diversity, offering additional interpretive depth to the survey responses.
Figure 4.
Professional background of participants—Pareto analysis.
3.3. Analytical Results of Main Criterias and Sub-Criterias Prioritization
In this research, each of the 46 DMs independently conducted pairwise comparisons for all main and sub-criteria based on the AHP framework. To synthesize these individual judgments into a single representative matrix per criterion, the geometric mean method was employed. This technique is particularly suitable for AHP contexts, as it maintains the reciprocal properties required for consistency and accurately aggregates ratio-scale judgments []. Through this method, the relative importance values assigned by each DM were combined element by element, producing a unified super matrix for each criterion.
As an illustrative example, Table 10 presents the geometric mean-based aggregated matrix constructed for the five main criteria. This geometric mean calculation was calculated using Equation (2) according to the answers given by the DMs. Each value in the matrix represents the aggregated importance of one criterion over another, based on the expert panel’s evaluations. While this section focuses on the main criteria for demonstration purposes, detailed aggregated matrices corresponding to each set of sub-criteria—namely economic, market, environmental (product and process), and social—are included in Appendix B.
Table 10.
Aggregated pairwise comparison matrix for main criteria (geometric mean method).
The pairwise comparison matrix reflects the collective judgments of the decision-makers (DMs) on the relative importance of the main criteria. To ensure consistency, the matrix was normalized by dividing each element by the sum of its column (as shown in Equation (3)
The normalized results are shown in Table 11. Each entry in the matrix represents the proportionate weight of a criterion relative to others in the same column. As expected, the sum of each column equals 1, validating the accuracy of the normalization.
Table 11.
Normalized pairwise comparison matrix for main criteria.
To calculate the final priority vector, the normalized values in each row were averaged. These row-wise averages represent the overall weight of each criterion and form the basis for prioritization in the AHP model.
To compute the priority weights of the main criteria, the normalized values in each row of the pairwise comparison matrix are averaged. The resulting values represent the relative weights assigned to each criterion in the decision model. This method is mathematically expressed in Equation (4) and forms the basis for subsequent ranking and analysis in the AHP process. The corresponding calculation has been presented in Table 12.
Table 12.
Eigenvector Calculation for Main Criteria.
After deriving the priority vector, the consistency of the pairwise comparisons were assessed to ensure the reliability of the decision-makers’ judgments. The consistency metrics—including λmax, CI, and CR—were computed using Equations (5)–(9), respectively. These formulas evaluate the degree of logical coherence in the judgments and help determine whether the comparisons fall within an acceptable range. The summary of these calculations is presented in the Table 13.
Table 13.
The Consistency Ratio calculation.
The same methodological steps applied to the main criteria were also followed for the calculation of priority weights for each group of sub-criteria: “Economic”, “Market”, “Product-Related Environmental”, “Production Process-Related Environmental”, and “Social”. In each case, the pairwise comparison matrices were constructed using the geometric mean of individual judgments, followed by normalization, eigenvector calculation, and consistency assessment. Detailed calculations and matrix structures are presented in Appendix C, Appendix D and Appendix E. All sub-criteria matrices yielded acceptable Consistency Ratios (CR < 0.10), validating the reliability of expert judgments.
Given that the CR value for the main criteria was also below the critical value of 0.10, it can be concluded that the priority weights derived from the eigenvector calculations are valid and suitable for subsequent stages of analysis within the AHP framework. This consistency enhances the robustness of the model and supports the reliability of the findings generated from the comparative assessments.
Table 14 presents the final eigenvectors and corresponding priority weights for both the main criteria and their associated sub-criteria. These values were derived following the AHP methodology, based on the consistent pairwise judgments provided by the DMs.
Table 14.
Eigenvector and priority weights of main criteria and sub-criteria.
As illustrated in Figure 5, the Economic Criteria (C1) emerged as the most influential dimension, receiving a priority weight of 46%, followed by Product-Related Environmental Criteria (C3) at 0.18% and Market Criteria (C2) at 16%. Production Process-Related Environmental Criteria (C4) and Social Criteria (C5) were assigned relatively lower weights, 13% and 7%, respectively. This prioritization reveals a strong emphasis on financial factors and product-level environmental impacts in the assessment of sustainable innovation.
Figure 5.
Priority weights of main criteria and sub-criteria.
Within each main category, the priority distribution among sub-criteria provides further insights into specific areas of focus. For example, under Economic Criteria, Product Cost (C11) was deemed most critical (45%), while under Market Criteria, Reliability in Meeting Market Demand (C22) ranked highest (34%). In the environmental domains, Elimination of Hazardous Substances (C32) and Zero Waste Practices Across Lifecycle (C41) were the most prominent sub-criteria, reflecting strong stakeholder concern for pollution prevention and sustainable resource management. Socially, the top-ranked items were Occupational Health and Safety Assurance (C52) and Employment and Child Labor Prevention (C51), suggesting an emphasis on workforce protection and ethical labor practices.
This comprehensive breakdown not only identifies which dimensions are perceived as most important but also supports subsequent decision-making steps by enabling targeted strategy development in line with expert-defined sustainability priorities.
4. Discussion
This research examined the prioritization of sustainability criteria within innovation strategies in the machinery manufacturing industry, utilizing a structured decision-making approach based on the AHP []. Using a dataset composed of 54,054 projects selected from CORDIS and TÜBİTAK databases through cosine similarity and thematic analysis [,], sustainability criteria were identified and systematically categorized into five main dimensions: Economic, Product-Related Environmental, Market, Production Process-Related Environmental, and Social.
The AHP survey conducted with 46 DMs revealed that Economic Criteria received the highest relative importance (46%), followed by Product-Related Environmental Criteria (18%) and Market Criteria (16%). Production Process-Related Environmental and Social Criteria were given comparatively lower weights (13% and 7%, respectively). This ranking highlights the continued emphasis on economic viability in innovation planning and underlines the secondary importance assigned to process and social dimensions [].
The dominance of Economic Criteria in the AHP results can be explained by the operational realities of the machinery manufacturing industry. As a capital-intensive sector with high fixed costs, long investment cycles, and complex supply chains, economic feasibility becomes a primary concern for decision-makers. The high priority assigned to “Product Cost” and “Indirect Costs” reflects this need for profitability and cost-efficiency to stay competitive in global markets.
In contrast, compliance-driven sustainability, such as reducing energy use or eliminating hazardous substances, is often preferred over transformative or socially oriented initiatives, which may be seen as risky, complex, or offering limited short-term return. This trend aligns with prior studies emphasizing the prevalence of “eco-efficiency” logic in traditional industries, where environmental action is mainly justified through cost savings. The low weight assigned to social criteria suggests that inclusive innovation and stakeholder engagement are still not fully integrated into strategic planning, revealing an implementation gap in achieving holistic sustainability.
Within the Economic Criteria, “Product Cost” (45%) emerged as the most significant sub-criterion, followed by “Indirect Product Costs” (20%) and “Logistics and Maintenance Costs” (15%). The strong prioritization of direct financial factors indicates that companies in the machinery manufacturing sector still perceive cost-efficiency as the primary driver for sustainable innovation initiatives []. This focus on financial factors suggests that economic feasibility remains the fundamental consideration in strategic innovation decision-making processes.
These findings highlight a persistent bias toward economic feasibility in industrial innovation, even when sustainability is part of the strategic agenda. This reflects the broader “implementation gap”, where environmental and social goals are often deprioritized during execution due to financial pressures. In the AHP results, the low ranking of social criteria suggests that inclusive and responsible innovation, such as stakeholder engagement and equity, remains underdeveloped in machinery manufacturing strategies.
This imbalance reveals a narrow interpretation of sustainability, focused mainly on cost and efficiency, rather than long-term societal value. Without integrated governance mechanisms, the shift from sustainability rhetoric to practice is likely to remain limited.
This trend is reinforced by research on “institutional inertia,” where organizations default to financial performance indicators, constraining systemic transformation. Even when sustainability goals are adopted, they are filtered through economic logics, reducing their transformative potential. Bridging this gap requires integrated, reflective decision-making frameworks that embed social and environmental values into innovation governance.
Beyond economic dominance, the next sections explore how environmental and social dimensions are shaped by factors like regulation, market responsiveness, and operational constraints.
Regarding Product-Related Environmental Criteria, “Elimination of Hazardous Substances” (30%) and “Reduction of Natural Resource Use” (26%) were the most emphasized sub-criteria. This suggests that DMs prioritize compliance with environmental regulations and resource efficiency as critical elements of sustainable product innovation []. The focus on these aspects indicates an understanding that product sustainability not only enhances brand value but also mitigates regulatory and operational risks.
When examining the Market Criteria, “Reliability in Meeting Market Demand” (34%) and “Agility in Supply Chain Response” (30%) were rated the highest. These findings reflect a growing recognition of the need for responsive, market-aligned innovation strategies where sustainability attributes must not compromise product availability, quality, or customer satisfaction []. The integration of sustainability considerations into supply chain management demonstrates that companies view responsiveness to market expectations as critical to maintaining competitive advantage.
In the context of Production Process-Related Environmental Criteria, “Zero Waste Practices Across Lifecycle” (30%) and “Water Efficiency and Reuse” (17%) were highlighted. While these results show some commitment to process-level sustainability, overall lower weights in this category suggest that production-related environmental improvements are perceived as less urgent unless tied directly to cost savings or regulatory requirements [,]. This prioritization pattern reveals a reactive approach to process sustainability, emphasizing compliance over innovation.
Finally, in the Social Criteria, “Occupational Health and Safety Assurance” (29%) and “Employment and Child Labor Prevention” (28%) were considered most important. However, other sub-criteria, such as “Employee Learning and Development” and “Supplier Engagement and Development”, were given lower priority. This indicates a focus on minimizing risks related to workforce safety and legal compliance, rather than on fostering proactive and inclusive social innovation strategies that could drive long-term organizational resilience [,].
From a methodological perspective, the combination of large-scale data mining through cosine similarity and expert-driven AHP application proved robust. The low CR (CR < 0.10) across all matrices confirmed the reliability of expert judgments [,]. This integrative approach offers a replicable model for future research aiming to balance big data analytics with expert validation in sustainability studies. However, the exclusion of formal validation metrics (e.g., precision, recall) in the similarity-based filtering process presents a limitation that should be addressed in future applications.
5. Conclusions
This study contributes to both theory and practice by presenting a scalable and evidence-based decision-making framework for prioritizing sustainability in manufacturing innovation. By combining text mining with AHP, it bridges data-driven analysis and expert judgment in a way that is sector-specific but adaptable. The results highlight a persistent economic bias in innovation planning, reflecting the broader implementation gap in sustainability transitions. Still, the structured inclusion of environmental, market, and social criteria offers a useful tool for aligning innovation strategies with global goals such as the Paris Agreement and European Green Deal [].
From a scholarly standpoint, this research contributes to the MCDM literature by applying AHP in a real-world innovation context and demonstrating its relevance to large-scale text-based datasets. It also emphasizes the need for qualitative methods to strengthen stakeholder alignment and contextual interpretation [,].
Practically, the framework helps decision-makers identify sustainability priorities that are both strategic and actionable. However, organizational and technical barriers must be addressed to enable effective adoption. Future studies should explore these challenges across different sectors and assess the long-term impact of using such models on innovation outcomes.
While the framework provides structure, real-world applications can be challenging. Common obstacles include resistance to change, limited technical capacity, and competing priorities. Successful use often requires internal champions and alignment with institutional goals. Evidence from EU-funded programs like Horizon Europe and EUREKA shows that tools like AHP are more effective when integrated into existing decision-making processes.
In conclusion, although financial and regulatory motivations still dominate, sustainable innovation will increasingly depend on holistic strategies that embed social and environmental concerns into core planning. Further research should examine the enablers and constraints that influence adoption across various industrial settings.
Author Contributions
Conceptualization, M.B.H.; methodology, M.B.H.; validation, A.F., H.H., and A.E.G.; formal analysis, M.B.H.; investigation, M.B.H.; resources, M.B.H.; data curation, M.B.H.; writing—original draft preparation, M.B.H.; writing—review and editing, A.F., H.H., and A.E.G.; visualization, M.B.H.; supervision, A.F. All authors have read and agreed to the published version of the manuscript.
Funding
This research received no external funding.
Institutional Review Board Statement
Not applicable.
Informed Consent Statement
Not applicable.
Data Availability Statement
The data presented in this research are available on request from the corresponding author.
Acknowledgments
We thank all participants and institutions who supported this research effort.
Conflicts of Interest
The authors declare that they have no known competing financial interests or personal relationships that could have appeared to influence the work reported in this paper.
Abbreviations
The following abbreviations are used in this manuscript:
| AHP | Analytic Hierarchy Process |
| CI | Consistency Index |
| CO | Carbon Monoxide |
| CORDIS | Community Research and Development Information Service |
| CR | Consistency Ratio |
| DM | Decision-maker |
| GRI | Global Reporting Initiative |
| HC | Hydrocarbons |
| MCDM | Multi-Criteria Decision-Making |
| NLP | Natural Language Processing |
| NOx | Nitrogen Oxides |
| OECD | Organization for Economic Co-operation and Development |
| PM | Particulate Matter |
| R&D | Research and Development |
| RI | Random Index |
| ROI | Return on Investment |
| SDG | Sustainable Development Goal |
| SO2 | Sulfur Dioxide |
| TF-IDF | Term Frequency-Inverse Document Frequency |
| TÜBİTAK | Scientific and Technological Research Council of Turkey |
Appendix A
Pairwise Comparison Matrices
Table A1.
Pairwise Comparison Matrix for Economic Criteria’s Sub-Criteria.
Table A1.
Pairwise Comparison Matrix for Economic Criteria’s Sub-Criteria.
| C11 | C12 | C13 | C14 | C15 | |
|---|---|---|---|---|---|
| C11 | 1 | ||||
| C12 | 1/ | 1 | |||
| C13 | 1/ | 1/ | 1 | ||
| C14 | 1/ | 1/ | 1/ | 1 | |
| C15 | 1/ | 1/ | 1/ | 1/ | 1 |
Table A2.
Pairwise Comparison Matrix for Market Criteria’s Sub-Criteria.
Table A2.
Pairwise Comparison Matrix for Market Criteria’s Sub-Criteria.
| C21 | C22 | C23 | C24 | C25 | |
|---|---|---|---|---|---|
| C21 | 1 | ||||
| C22 | 1/ | 1 | |||
| C23 | 1/ | 1/ | 1 | ||
| C24 | 1/ | 1/ | 1/ | 1 | |
| C25 | 1/ | 1/ | 1/ | 1/ | 1 |
Table A3.
Pairwise Comparison Matrix for Product-Related Environmental Criteria’s Sub-Criteria.
Table A3.
Pairwise Comparison Matrix for Product-Related Environmental Criteria’s Sub-Criteria.
| C31 | C32 | C33 | C34 | C35 | C36 | |
|---|---|---|---|---|---|---|
| C31 | 1 | |||||
| C32 | 1/ | 1 | ||||
| C33 | 1/ | 1/ | 1 | |||
| C34 | 1/ | 1/ | 1/ | 1 | ||
| C35 | 1/ | 1/ | 1/ | 1/ | 1 | |
| C36 | 1/ | 1/ | 1/ | 1/ | 1/ | 1 |
Table A4.
Pairwise Comparison Matrix for Production Process-Related Environment Criteria’s Sub-Criteria.
Table A4.
Pairwise Comparison Matrix for Production Process-Related Environment Criteria’s Sub-Criteria.
| C41 | C42 | C43 | C44 | C45 | C46 | C47 | |
|---|---|---|---|---|---|---|---|
| C41 | 1 | ||||||
| C42 | 1/ | 1 | |||||
| C43 | 1/ | 1/ | 1 | ||||
| C44 | 1/ | 1/ | 1/ | 1 | |||
| C45 | 1/ | 1/ | 1/ | 1/ | 1 | ||
| C46 | 1/ | 1/ | 1/ | 1/ | 1/ | 1 | |
| C47 | 1/ | 1/ | 1/ | 1/ | 1/ | 1/ | 1 |
Table A5.
Pairwise Comparison Matrix for Social Criteria’s Sub-Criteria.
Table A5.
Pairwise Comparison Matrix for Social Criteria’s Sub-Criteria.
| C51 | C52 | C53 | C54 | C55 | C56 | |
|---|---|---|---|---|---|---|
| C51 | 1 | |||||
| C52 | 1/ | 1 | ||||
| C53 | 1/ | 1/ | 1 | |||
| C54 | 1/ | 1/ | 1/ | 1 | ||
| C55 | 1/ | 1/ | 1/ | 1/ | 1 | |
| C56 | 1/ | 1/ | 1/ | 1/ | 1/ | 1 |
Appendix B
Aggregated Pairwise Comparison Matrices
Table A6.
Aggregated Pairwise Comparison Matrix for Economic Criteria’s Sub-Criteria (Geometric Mean Method).
Table A6.
Aggregated Pairwise Comparison Matrix for Economic Criteria’s Sub-Criteria (Geometric Mean Method).
| Economic Criteria | C11 | C12 | C13 | C14 | C15 |
|---|---|---|---|---|---|
| C11 | 1.00 | 4.05 | 3.89 | 3.21 | 3.83 |
| C12 | 0.25 | 1.00 | 2.41 | 1.58 | 3.45 |
| C13 | 0.26 | 0.42 | 1.00 | 2.09 | 3.13 |
| C14 | 0.31 | 0.63 | 0.48 | 1.00 | 4.00 |
| C15 | 0.26 | 0.29 | 0.32 | 0.25 | 1.00 |
| Sum | 2.08 | 6.39 | 8.10 | 8.12 | 15.41 |
Table A7.
Aggregated Pairwise Comparison Matrix for Market Criteria’s Sub-Criteria (Geometric Mean Method).
Table A7.
Aggregated Pairwise Comparison Matrix for Market Criteria’s Sub-Criteria (Geometric Mean Method).
| Market Criteria | C21 | C22 | C23 | C24 | C25 |
| C21 | 1.00 | 1.70 | 2.70 | 2.19 | 1.67 |
| C22 | 0.59 | 1.00 | 4.58 | 3.83 | 3.15 |
| C23 | 0.37 | 0.22 | 1.00 | 2.26 | 1.55 |
| C24 | 0.46 | 0.26 | 0.44 | 1.00 | 1.79 |
| C25 | 0.60 | 0.32 | 0.65 | 0.56 | 1.00 |
| Sum | 3.01 | 3.50 | 9.37 | 9.84 | 9.16 |
Table A8.
Aggregated Pairwise Comparison Matrix for Product-Related Environmental Criteria’s Sub-Criteria (Geometric Mean Method).
Table A8.
Aggregated Pairwise Comparison Matrix for Product-Related Environmental Criteria’s Sub-Criteria (Geometric Mean Method).
| Product-Related Environmental Criteria | C31 | C32 | C33 | C34 | C35 | C36 |
|---|---|---|---|---|---|---|
| C31 | 1.00 | 1.65 | 2.53 | 2.36 | 2.07 | 1.63 |
| C32 | 0.60 | 1.00 | 3.70 | 3.40 | 4.47 | 3.22 |
| C33 | 0.39 | 0.27 | 1.00 | 2.63 | 2.54 | 1.67 |
| C34 | 0.42 | 0.29 | 0.38 | 1.00 | 3.07 | 2.16 |
| C35 | 0.48 | 0.22 | 0.39 | 0.33 | 1.00 | 1.77 |
| C36 | 0.61 | 0.31 | 0.60 | 0.46 | 0.57 | 1.00 |
| Sum | 3.52 | 3.75 | 8.61 | 10.18 | 13.72 | 11.46 |
Table A9.
Aggregated Pairwise Comparison Matrix for Production Process-Related Environment Criteria’s Sub-Criteria (Geometric Mean Method).
Table A9.
Aggregated Pairwise Comparison Matrix for Production Process-Related Environment Criteria’s Sub-Criteria (Geometric Mean Method).
| Production Process-Related Environment Criteria | C41 | C42 | C43 | C44 | C45 | C46 | C47 |
| C41 | 1.00 | 3.89 | 2.84 | 3.21 | 1.92 | 3.18 | 2.80 |
| C42 | 0.26 | 1.00 | 1.91 | 2.52 | 1.33 | 2.80 | 1.61 |
| C43 | 0.35 | 0.52 | 1.00 | 2.94 | 2.36 | 2.99 | 2.35 |
| C44 | 0.31 | 0.40 | 0.34 | 1.00 | 1.81 | 3.52 | 1.71 |
| C45 | 0.52 | 0.75 | 0.42 | 0.55 | 1.00 | 4.63 | 2.69 |
| C46 | 0.31 | 0.36 | 0.33 | 0.28 | 0.22 | 1.00 | 1.07 |
| C47 | 0.36 | 0.62 | 0.43 | 0.58 | 0.37 | 0.93 | 1.00 |
| Sum | 3.11 | 7.54 | 7.27 | 11.09 | 9.00 | 19.06 | 13.23 |
Table A10.
Aggregated Pairwise Comparison Matrix for Social Criteria’s Sub-Criteria (Geometric Mean Method).
Table A10.
Aggregated Pairwise Comparison Matrix for Social Criteria’s Sub-Criteria (Geometric Mean Method).
| Social Criteria | C51 | C52 | C53 | C54 | C55 | C56 |
|---|---|---|---|---|---|---|
| C51 | 1.00 | 1.68 | 2.47 | 1.85 | 3.31 | 2.85 |
| C52 | 0.60 | 1.00 | 3.32 | 2.80 | 5.27 | 4.19 |
| C53 | 0.40 | 0.30 | 1.00 | 1.60 | 2.96 | 3.15 |
| C54 | 0.54 | 0.36 | 0.63 | 1.00 | 3.98 | 4.17 |
| C55 | 0.30 | 0.19 | 0.34 | 0.25 | 1.00 | 3.54 |
| C56 | 0.35 | 0.24 | 0.32 | 0.24 | 0.28 | 1.00 |
| Sum | 3.19 | 3.76 | 8.07 | 7.74 | 16.80 | 18.89 |
Appendix C
Normalized Pairwise Comparison Matrices
Table A11.
Normalized Pairwise Comparison Matrix for Economic Criteria’s Sub-Criteria.
Table A11.
Normalized Pairwise Comparison Matrix for Economic Criteria’s Sub-Criteria.
| Economic Criteria | C11 | C12 | C13 | C14 | C15 | Sum |
|---|---|---|---|---|---|---|
| C11 | 0.48 | 0.63 | 0.48 | 0.39 | 0.25 | 2.24 |
| C12 | 0.12 | 0.16 | 0.30 | 0.19 | 0.22 | 0.99 |
| C13 | 0.12 | 0.06 | 0.12 | 0.26 | 0.20 | 0.77 |
| C14 | 0.15 | 0.10 | 0.06 | 0.12 | 0.26 | 0.69 |
| C15 | 0.13 | 0.05 | 0.04 | 0.03 | 0.06 | 0.31 |
| Sum | 1.00 | 1.00 | 1.00 | 1.00 | 1.00 | 5.00 |
Table A12.
Normalized Pairwise Comparison Matrix for Market Criteria’s Sub-Criteria.
Table A12.
Normalized Pairwise Comparison Matrix for Market Criteria’s Sub-Criteria.
| Market Criteria | C21 | C22 | C23 | C24 | C25 | Sum |
|---|---|---|---|---|---|---|
| C21 | 0.33 | 0.49 | 0.29 | 0.22 | 0.18 | 1.51 |
| C22 | 0.20 | 0.29 | 0.49 | 0.39 | 0.34 | 1.70 |
| C23 | 0.12 | 0.06 | 0.11 | 0.23 | 0.17 | 0.69 |
| C24 | 0.15 | 0.07 | 0.05 | 0.10 | 0.20 | 0.57 |
| C25 | 0.20 | 0.09 | 0.07 | 0.06 | 0.11 | 0.52 |
| Sum | 1.00 | 1.00 | 1.00 | 1.00 | 1.00 | 5.00 |
Table A13.
Normalized Pairwise Comparison Matrix for Product-Related Environmental Criteria’s Sub-Criteria.
Table A13.
Normalized Pairwise Comparison Matrix for Product-Related Environmental Criteria’s Sub-Criteria.
| Product-Related Environmental Criteria | C31 | C32 | C33 | C34 | C35 | C36 | Sum |
|---|---|---|---|---|---|---|---|
| C31 | 0.28 | 0.44 | 0.29 | 0.23 | 0.15 | 0.14 | 1.54 |
| C32 | 0.17 | 0.27 | 0.43 | 0.33 | 0.33 | 0.28 | 1.81 |
| C33 | 0.11 | 0.07 | 0.12 | 0.26 | 0.19 | 0.15 | 0.89 |
| C34 | 0.12 | 0.08 | 0.04 | 0.10 | 0.22 | 0.19 | 0.75 |
| C35 | 0.14 | 0.06 | 0.05 | 0.03 | 0.07 | 0.15 | 0.50 |
| C36 | 0.17 | 0.08 | 0.07 | 0.05 | 0.04 | 0.09 | 0.50 |
| Sum | 1.00 | 1.00 | 1.00 | 1.00 | 1.00 | 1.00 | 6.00 |
Table A14.
Normalized Pairwise Comparison Matrix for Production Process-Related Environmental Criteria’s Sub-Criteria.
Table A14.
Normalized Pairwise Comparison Matrix for Production Process-Related Environmental Criteria’s Sub-Criteria.
| Production Process-Related Environmental Criteria | C41 | C42 | C43 | C44 | C45 | C46 | C47 | Sum |
|---|---|---|---|---|---|---|---|---|
| C41 | 0.32 | 0.52 | 0.39 | 0.29 | 0.21 | 0.17 | 0.21 | 2.11 |
| C42 | 0.08 | 0.13 | 0.26 | 0.23 | 0.15 | 0.15 | 0.12 | 1.12 |
| C43 | 0.11 | 0.07 | 0.14 | 0.27 | 0.26 | 0.16 | 0.18 | 1.18 |
| C44 | 0.10 | 0.05 | 0.05 | 0.09 | 0.20 | 0.18 | 0.13 | 0.80 |
| C45 | 0.17 | 0.10 | 0.06 | 0.05 | 0.11 | 0.24 | 0.20 | 0.93 |
| C46 | 0.10 | 0.05 | 0.05 | 0.03 | 0.02 | 0.05 | 0.08 | 0.38 |
| C47 | 0.11 | 0.08 | 0.06 | 0.05 | 0.04 | 0.05 | 0.08 | 0.47 |
| Sum | 1.00 | 1.00 | 1.00 | 1.00 | 1.00 | 1.00 | 1.00 | 7.00 |
Table A15.
Normalized Pairwise Comparison Matrix for Social Criteria’s Sub-Criteria.
Table A15.
Normalized Pairwise Comparison Matrix for Social Criteria’s Sub-Criteria.
| Social Criteria | C51 | C52 | C53 | C54 | C55 | C56 | Sum |
|---|---|---|---|---|---|---|---|
| C51 | 0.31 | 0.45 | 0.31 | 0.24 | 0.20 | 0.15 | 1.65 |
| C52 | 0.19 | 0.27 | 0.41 | 0.36 | 0.31 | 0.22 | 1.76 |
| C53 | 0.13 | 0.08 | 0.12 | 0.21 | 0.18 | 0.17 | 0.88 |
| C54 | 0.17 | 0.09 | 0.08 | 0.13 | 0.24 | 0.22 | 0.93 |
| C55 | 0.09 | 0.05 | 0.04 | 0.03 | 0.06 | 0.19 | 0.47 |
| C56 | 0.11 | 0.06 | 0.04 | 0.03 | 0.02 | 0.05 | 0.31 |
| Sum | 1.00 | 1.00 | 1.00 | 1.00 | 1.00 | 1.00 | 6.00 |
Appendix D
Eigenvector and Priority Weight Matrices
Table A16.
Eigenvector and Priority Weight Matrix for Economic Criteria’s Sub-Criteria.
Table A16.
Eigenvector and Priority Weight Matrix for Economic Criteria’s Sub-Criteria.
| Economic Criteria | Eigenvector of Economic Criteria’s Sub-Criteria | Priority Weight of Economic Criteria’s Sub-Criteria |
|---|---|---|
| C11 | 0.45 | 45% |
| C12 | 0.20 | 20% |
| C13 | 0.15 | 15% |
| C14 | 0.14 | 14% |
| C15 | 0.06 | 6% |
Table A17.
Eigenvector and Priority Weight Matrix for Market Criteria’s Sub-Criteria.
Table A17.
Eigenvector and Priority Weight Matrix for Market Criteria’s Sub-Criteria.
| Market Criteria | Eigenvector of Market Criteria’s Sub-Criteria | Priority Weight of Market Criteria’s Sub-Criteria |
|---|---|---|
| C21 | 0.30 | 30% |
| C22 | 0.34 | 34% |
| C23 | 0.14 | 14% |
| C24 | 0.11 | 11% |
| C25 | 0.10 | 10% |
Table A18.
Eigenvector and Priority Weight Matrix for Product-Related Environmental Criteria’s Sub-Criteria.
Table A18.
Eigenvector and Priority Weight Matrix for Product-Related Environmental Criteria’s Sub-Criteria.
| Product-Related Environmental Criteria | Eigenvector of Product-Related Environmental Criteria’s Sub-Criteria | Priority Weight of Product-Related Environmental Criteria’s Sub-Criteria |
|---|---|---|
| C31 | 0.26 | 26% |
| C32 | 0.30 | 30% |
| C33 | 0.15 | 15% |
| C34 | 0.13 | 13% |
| C35 | 0.08 | 8% |
| C36 | 0.08 | 8% |
Table A19.
Eigenvector and Priority Weight Matrix for Production Process-Related Environmental Criteria’s Sub-Criteria.
Table A19.
Eigenvector and Priority Weight Matrix for Production Process-Related Environmental Criteria’s Sub-Criteria.
| Production Process-Related Environmental Criteria | Eigenvector of Production Process-Related Environmental Criteria’s Sub-Criteria | Priority Weight of Production Process-Related Environmental Criteria’s Sub-Criteria |
|---|---|---|
| C41 | 0.30 | 30% |
| C42 | 0.16 | 16% |
| C43 | 0.17 | 17% |
| C44 | 0.11 | 11% |
| C45 | 0.13 | 13% |
| C46 | 0.05 | 5% |
| C47 | 0.07 | 7% |
Table A20.
Eigenvector and Priority Weight Matrix for Social Criteria’s Sub-Criteria.
Table A20.
Eigenvector and Priority Weight Matrix for Social Criteria’s Sub-Criteria.
| Social Criteria | Eigenvector of Social Criteria’s Sub-Criteria | Priority Weight of Social Criteria’s Sub-Criteria |
|---|---|---|
| C51 | 0.28 | 28% |
| C52 | 0.29 | 29% |
| C53 | 0.15 | 15% |
| C54 | 0.15 | 15% |
| C55 | 0.08 | 8% |
| C56 | 0.05 | 5% |
Appendix E
Consistency Status
Table A21.
Consistency Status of Economic Criteria’s Sub-Criteria.
Table A21.
Consistency Status of Economic Criteria’s Sub-Criteria.
| 5.416 | |
| Consistency Index (CI) | 0.104 |
| Random Index (RI) | 1.11 |
| Consistency Ratio (CR) | 0.094 |
| Consistency Status | Acceptable (CR < 0.10) |
Table A22.
Consistency Status of Market Criteria’s Sub-Criteria.
Table A22.
Consistency Status of Market Criteria’s Sub-Criteria.
| 5.393 | |
| Consistency Index (CI) | 0.098 |
| Random Index (RI) | 1.11 |
| Consistency Ratio (CR) | 0.088 |
| Consistency Status | Acceptable (CR < 0.10) |
Table A23.
Consistency Status of Product-Related Environmental Criteria’s Sub-Criteria.
Table A23.
Consistency Status of Product-Related Environmental Criteria’s Sub-Criteria.
| 6.592 | |
| Consistency Index (CI) | 0.118 |
| Random Index (RI) | 1.25 |
| Consistency Ratio (CR) | 0.095 |
| Consistency Status | Acceptable (CR < 0.10) |
Table A24.
Consistency Status of Production Process-Related Environmental Criteria’s Sub-Criteria.
Table A24.
Consistency Status of Production Process-Related Environmental Criteria’s Sub-Criteria.
| 7.678 | |
| Consistency Index (CI) | 0.113 |
| Random Index (RI) | 1.35 |
| Consistency Ratio (CR) | 0.084 |
| Consistency Status | Acceptable (CR < 0.10) |
Table A25.
Consistency Status of Social Criteria’s Sub-Criteria.
Table A25.
Consistency Status of Social Criteria’s Sub-Criteria.
| 6.557 | |
| Consistency Index (CI) | 0.111 |
| Random Index (RI) | 1.25 |
| Consistency Ratio (CR) | 0.089 |
| Consistency Status | Acceptable (CR < 0.10) |
References
- Schumpeter, J.A. The Theory of Economic Development; Harvard University Press: Cambridge, MA, USA, 1934; ISBN 9780367705268. [Google Scholar]
- OECD. Innovation for a Sustainable Future. Available online: https://www.oecd.org/innovation (accessed on 29 April 2025).
- Falcone, G.; De Luca, A.I.; Stillitano, T.; Strano, A.; Romeo, G.; Gulisano, G. Assessment of Environmental and Economic Impacts of Vine-Growing Combining Life Cycle Assessment, Life Cycle Costing and Multicriterial Analysis. Sustainability 2016, 8, 793. [Google Scholar] [CrossRef]
- Huang, I.B.; Keisler, J.; Linkov, I. Multi-criteria decision analysis in environmental sciences: Ten years of applications and trends. Sci. Total Environ. 2011, 409, 3578–3594. [Google Scholar] [CrossRef] [PubMed]
- Saaty, T.L. The Analytic Hierarchy Process: Planning, Priority Setting, Resource Allocation; McGraw-Hill: New York, NY, USA, 1980; ISBN 13978-0070543713. [Google Scholar]
- Hwang, C.L.; Yoon, K. Multiple Attribute Decision Making: Methods and Applications; Springer: Berlin, Germany, 1981; ISSN 2196-9957. [Google Scholar]
- Cinelli, M.; Kadziński, M.; Gonzalez, M.; Słowiński, R. How to support the application of multiple criteria decision analysis? Let us start with a comprehensive taxonomy. Omega 2020, 96, 102261. [Google Scholar] [CrossRef] [PubMed]
- Elkington, J. Cannibals with Forks: The Triple Bottom Line of 21st Century Business; Capstone: Oxford, UK, 1997; ISBN 0865713928. [Google Scholar]
- Singh, R.K.; Murty, H.R.; Gupta, S.K.; Dikshit, A.K. An overview of sustainability assessment methodologies. Ecol. Indic. 2012, 15, 281–299. [Google Scholar] [CrossRef]
- Opricovic, S.; Tzeng, G.H. Compromise solution by MCDM methods: A comparative analysis of VIKOR and TOPSIS. Eur. J. Oper. Res. 2004, 156, 445–455. [Google Scholar] [CrossRef]
- European Commission. CORDIS: EU Research Results. Available online: https://cordis.europa.eu/projects (accessed on 29 April 2025).
- TÜBİTAK. Bilimsel Araştırma Projeleri Veri Tabanı. Available online: https://search.trdizin.gov.tr/tr/yayin/ara?q=&order=publicationYear-DESC&page=1&limit=20&facet-documentType=PROJECT (accessed on 29 April 2025).
- Porter, M.E.; Kramer, M.R. Creating shared value. Harv. Bus. Rev. 2011, 89, 62–77. [Google Scholar]
- United Nations. Transforming Our World: The 2030 Agenda for Sustainable Development. Available online: https://sdgs.un.org/2030agenda (accessed on 29 April 2025).
- Singhal, A. Modern information retrieval: A brief overview. Bull. Tech. Comm. Data Eng. IEEE Comput. Soc. 2001, 24, 35–43. [Google Scholar]
- Paipa-Sanabria, E.; Orozco-Lopez, M.B.; Escalante-Torres, F.; Camargo-Díaz, C.P.; Zapata-Cortes, J.A. Exploring the Landscape of Eco-Innovation: A Bibliometric Analysis of Concepts and Trends in the Manufacturing and Shipbuilding Industries. Sustainability 2024, 16, 5188. [Google Scholar] [CrossRef]
- Weber, K.M.; Schaper-Rinkel, P. European sectoral innovation foresight: Identifying emerging cross-sectoral patterns and policy issues. Technol. Forecast. Soc. Change 2017, 115, 240–250. [Google Scholar] [CrossRef]
- Manning, C.D.; Raghavan, P.; Schütze, H. Introduction to Information Retrieval; Cambridge University Press: Cambridge, UK, 2008. [Google Scholar]
- Han, J.; Kamber, M.; Pei, J. Data Mining: Concepts and Techniques, 3rd ed.; Morgan Kaufmann: Burlington, MA, USA, 2011. [Google Scholar]
- Wang, Y.; Zhao, Y.; Wang, H. Enhancing Semantic Similarity in Document Clustering Using TF-IDF with Context Refinement; Elsevier: Amsterdam, The Netherlands, 2020; Volume 158, p. 113609. ISBN 978-0-12-381479-1. [Google Scholar]
- Salton, G.; Buckley, C. Term-weighting approaches in automatic text retrieval. Inf. Process. Manag. 1988, 24, 513–523. [Google Scholar] [CrossRef]
- Kusner, M.; Sun, Y.; Kolkin, N.; Weinberger, K. From word embeddings to document distances. In Proceedings of the 32nd International Conference on Machine Learning, Lille, France, 6–11 July 2015; pp. 957–966. [Google Scholar]
- Ye, J. Cosine similarity measures for intuitionistic fuzzy sets and their applications. Math. Comput. Model. 2021, 53, 91–97. [Google Scholar] [CrossRef]
- Purvis, B.; Mao, Y.; Robinson, D. Three pillars of sustainability: In search of conceptual origins. Sustain. Sci. 2019, 14, 681–695. [Google Scholar] [CrossRef]
- Lozano, R. Envisioning sustainability three-dimensionally. J. Clean. Prod. 2008, 16, 1838–1846. [Google Scholar] [CrossRef]
- Braun, V.; Clarke, V. Using thematic analysis in psychology. Qual. Res. Psychol. 2006, 3, 77–101. [Google Scholar] [CrossRef]
- Nowell, L.S.; Norris, J.M.; White, D.E.; Moules, N.J. Thematic analysis: Striving to meet the trustworthiness criteria. Int. J. Qual. Methods 2017, 16, 1609406917733847. [Google Scholar] [CrossRef]
- Silvestre, B.S.; Ţîrcă, D.M. Innovations for sustainable development: Moving toward a sustainable innovation framework. J. Clean. Prod. 2019, 208, 325–332. [Google Scholar] [CrossRef]
- Global Reporting Initiative (GRI). GRI Standards 2021: Consolidated Set of Standards; GRI: Amsterdam, The Netherlands, 2021. [Google Scholar]
- Vargas, L.G. An overview of the analytic hierarchy process and its applications. Eur. J. Oper. Res. 1990, 48, 2–8. [Google Scholar] [CrossRef]
- Ishizaka, A.; Labib, A. Review of the main developments in the analytic hierarchy process. Expert Syst. Appl. 2011, 38, 14336–14345. [Google Scholar] [CrossRef]
- Saaty, T.L.; Vargas, L.G. Models, Methods, Concepts & Applications of the Analytic Hierarchy Process, 2nd ed.; Springer: Boston, MA, USA, 2012; ISBN 978-1-4614-3596-9. [Google Scholar]
- Vaidya, O.S.; Kumar, S. Analytic hierarchy process: An overview of applications. Eur. J. Oper. Res. 2006, 169, 1–29. [Google Scholar] [CrossRef]
- Fink, A. How to Conduct Surveys: A Step-by-Step Guide, 5th ed.; SAGE Publications: Thousand Oaks, CA, USA, 2013; ISBN 9781071861325. [Google Scholar]
- Dillman, D.A.; Smyth, J.D.; Christian, L.M. Internet, Phone, Mail, and Mixed-Mode Surveys: The Tailored Design Method, 4th ed.; Wiley: Hoboken, NJ, USA, 2014; ISBN 978-1-118-45614-9. [Google Scholar]
- Guest, G.; Namey, E.E.; Mitchell, M.L. Collecting Qualitative Data: A Field Manual for Applied Research; SAGE Publications: Thousand Oaks, CA, USA, 2013. [Google Scholar]
- Braun, V.; Clarke, V. Successful Qualitative Research: A Practical Guide for Beginners; SAGE Publications: London, UK, 2013; ISBN 9781847875822. [Google Scholar]
- Forman, E.H.; Peniwati, K. Aggregating individual judgments and priorities with the analytic hierarchy process. Eur. J. Oper. Res. 1998, 108, 165–169. [Google Scholar] [CrossRef]
Disclaimer/Publisher’s Note: The statements, opinions and data contained in all publications are solely those of the individual author(s) and contributor(s) and not of MDPI and/or the editor(s). MDPI and/or the editor(s) disclaim responsibility for any injury to people or property resulting from any ideas, methods, instructions or products referred to in the content. |
© 2025 by the authors. Licensee MDPI, Basel, Switzerland. This article is an open access article distributed under the terms and conditions of the Creative Commons Attribution (CC BY) license (https://creativecommons.org/licenses/by/4.0/).