Abstract
Effective sustainable fish farming necessitates enhanced models that incorporate environmental variability and contemporary monitoring methods. This research presents an innovative framework for assessing and modeling the environmental carrying capacity based on phosphorus (ECCp) in tropical and neotropical lakes and reservoirs. The model evaluates phosphorus waste from tilapia farming (Oreochromis niloticus) under diverse climatic conditions and production scenarios in cage systems. Using bioenergetic modeling and Monte Carlo simulations, we estimated phosphorus retention in fish and maximum production limits across different temperatures (21 °C, 25 °C, 29 °C) and dietary phosphorus concentrations (0.8%, 1.2%, 2.1%) in Brazil’s Chavantes reservoir. Results indicated that phosphorus retention diminished with higher dietary phosphorus and increased temperatures, ranging from 51% (0.8% P) to 20% (2.1% P). Phosphorus discharge ranged from 3.3 to 20.5 kg/ton of fish produced. The ECCp model forecasted an allowable production of roughly 40 tons per year at full operational capacity, reflecting a 41% increase compared to current regulations. The model’s accuracy (96%) surpassed that of traditional regulatory frameworks, which rely on static parameters, emphasizing the shortcomings of existing practices. The findings promote enhanced modeling strategies, sophisticated monitoring, adaptive management, and revised public policies to mitigate phosphorus emissions and support sustainable aquaculture in tropical and neotropical regions.
1. Introduction
Aquaculture in lakes and reservoirs has experienced significant global growth, driven by the increasing demand for fish as a protein source and the limitations of wild fisheries. This expansion is supported by advancements in aquaculture technologies and improved management practices [1]. In Brazil, aquaculture activities have thrived in large lakes and reservoirs [2]. The country has emerged as a major player in Nile tilapia (Oreochromis niloticus) production, accounting for approximately 64% of Brazil’s national output and positioning the nation as the fourth-largest tilapia producer worldwide [3,4].
Although the growth of aquaculture in lakes and reservoirs has introduced notable benefits, such as meeting the increasing demand for fish protein, concerns regarding the release of waste into aquatic environments have also arisen [5,6,7]. Phosphates are among the most concerning waste products [7]. Phosphorus, a limiting element for algal growth, is particularly problematic in tropical and neotropical environments, where it contributes to eutrophication [8,9,10,11]. This process leads to harmful algal blooms, oxygen depletion, and deterioration of water quality, compromising various uses of aquatic ecosystems, including recreation, drinking water, and fisheries [12]. Consequently, the potential negative impacts of fish farming on natural water bodies have been magnified, particularly when considering the legal requirements for fish production in public lakes and reservoirs [2,13,14]. In environments with long residence times and poor water circulation, such as lakes and reservoirs, these impacts can be more intense and extend over larger areas [15,16].
Currently, environmental agencies in Asia, South America, and several other regions lack a standardized methodology for quantifying effluent loads from fish farming [17,18,19,20]. The lack of proper methods for determining waste emissions complicates the aquaculture sector, as specific measures are necessary to obtain environmental licenses and other legal authorizations for production. Thus, aquaculture requires modern tools and instruments that facilitate effective environmental monitoring and management to mitigate its impact throughout production [21].
To address this gap, many studies have attempted to predict aquaculture waste release and carrying capacity in aquatic environments, primarily by focusing on phosphorus concentrations. These studies often treat the system as a “closed production loop”, where nutrient inputs and outputs are calculated without accounting for the varied physiological responses of fish or the direct influence that the aquatic environment exerts on nutrient excretion [20,22,23]. This approach risks underestimating or overestimating the true impact of waste release, which could lead to misinformed management decisions.
In response to these limitations, technological advancements have led to the development of mathematical models that simulate environmental impacts and enhance impact assessment methodologies. These models are widely applied in hydrological studies of complex systems, such as reservoirs [13,24]. However, when these models are applied to public environments affected by aquaculture operations, caution must be exercised when accounting for site-specific variables and conditions [25]. Moreover, developing low-cost environmental monitoring methods is critical for implementing optimal management practices and ensuring sustainable production, particularly in leading tilapia-producing countries, such as Brazil and China [26,27]. This scenario highlights the necessity for modeling frameworks tailored to the environmental conditions prevalent in major producing countries, which frequently encounter challenges related to high temperatures and nutrient dynamics in freshwater systems. In this context, the present study proposes an integrated modeling framework that incorporates fish physiological responses to environmental factors such as water temperature and dietary phosphorus levels, aiming to improve the accuracy of environmental carrying capacity estimates in tropical freshwater aquaculture.
Building on this approach, the present study developed a framework to apply a new model for determining the environmental carrying capacity (ECCp) in tropical and neotropical lakes and reservoirs. This model is based on phosphorus release from fish farms and its concentration in water under different neotropical climatic conditions and production scenarios for tilapia (O. niloticus) reared in cage systems. It identifies key attributes for managing aquaculture waste discharge, maintaining the aquatic ecosystem, and monitoring the practices employed in fish farming.
2. Material and Methods
2.1. Study Area and Applied Methodology
This study was conducted on a commercial Nile tilapia (O. niloticus) farm using intensive cage culture systems installed in the Chavantes Hydroelectric Power Plant (HPP) reservoir, located in the municipality of Fartura, São Paulo, Brazil (23°22′46″ S and 49°35′16″ W) (Figure 1). The region’s climate is humid subtropical (Cfa, according to the Köppen climate classification). The reservoir was selected because it hosts one of the largest tilapia production operations in net cages in Brazil, operated by Piscicultura Cristalina, which maintains continuous production with an average daily harvest of about 20 tons of tilapia. This scale of production, combined with the typical conditions of tropical environments, makes the reservoir an excellent representative model for studies of environmental carrying capacity.
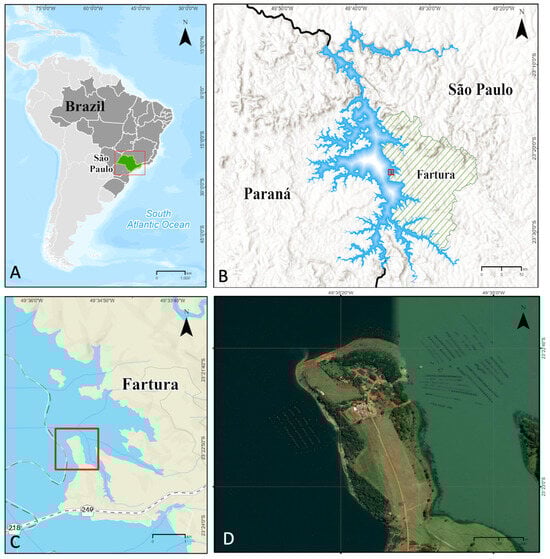
Figure 1.
Geographical location of the study area in the Chavantes reservoir, São Paulo, Brazil, highlighting the evaluated fish farming area. (A) Location of Brazil and the state of São Paulo. (B) Dendritic morphology of the Chavantes reservoir, situated at the border between São Paulo (Fartura) and Paraná states. (C) Fartura region, approximate location of the fish farming facility (red boxes). (D) Location of the study area (Cristalina Fish Farm). Source: Google Earth and elaboration by the author.
The Chavantes reservoir is a typical storage reservoir with a dendritic shape, characterized by morphometric and hydrological conditions that influence its stability and seasonal dynamics [28,29]. The reservoir spans an area of 301.78 to 402.53 km2 at elevations ranging from 465.23 to 474.00 m above sea level, with an installed power generation capacity of 414 MW. It accumulates water for downstream flow regulation, presenting a total water volume between 5754 and 8795 hm3, an average inflow of 321 to 400 m3/s, an average depth reaching 90 m, and a water residence time exceeding 130 days. These values were sourced from national databases, including the Brazilian Hydroelectric Potential Information System (SIPOT), the Brazilian National Electric System Operator (ONS), and the Brazilian National Water and Basic Sanitation Agency (ANA). The complete methodological structure adopted in this study, including data collection, modeling steps, and scenario simulations, is summarized in the schematic representation of the ECCp framework (Figure 2).
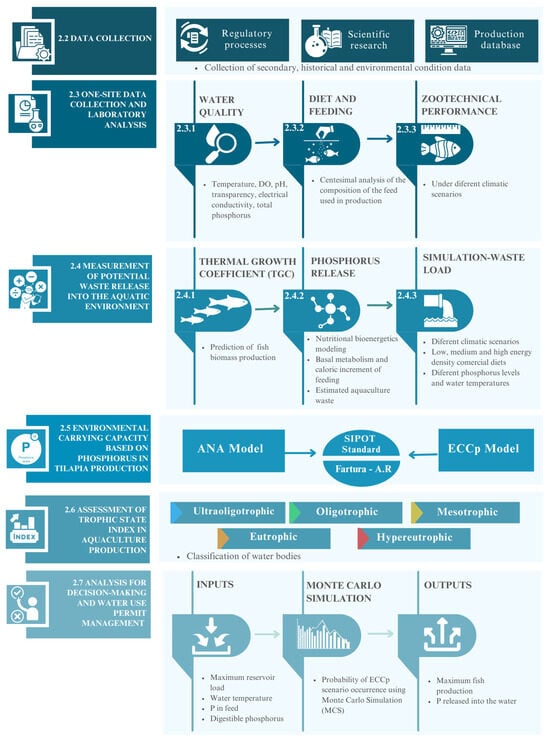
Figure 2.
Framework of the ECCp model: methodology for modeling environmental carrying capacity in a neotropical reservoir under different scenarios of fish production and climate conditions.
2.2. Collection of Secondary, Historical, and Environmental Condition Data
Information related to the state of São Paulo, the Paranapanema River Basin, the Chavantes Hydroelectric Power Plant (HPP), and the municipality of Fartura was gathered from official documents, regulatory processes, scientific research, and secondary data to verify the enterprise’s compliance with the conditions and current legislation of environmental agencies. Historical zootechnical data from 178 production batches of O. niloticus and climatic data from 2010 to 2021 from the same regions were used as inputs for the ECCp model.
2.3. On-Site Data Collection and Laboratory Analysis
2.3.1. Water Quality
For seven months, biweekly observations of pH, dissolved oxygen, transparency, and conductivity were conducted using a YSI Pro20i multiparameter probe (Yellow Springs Instruments, OH, EUA) in the aquaculture area at three distinct points: the aquaculture area, upstream, and downstream of the reservoir. Water temperature (°C) was measured weekly on the cage surfaces (averaging 1.5 m, in five different regions of the aquaculture area, between 11:00 a.m. and 12:00 p.m.) and in an area of at least 500 m above the water flow relative to the cultivation area as a control, following the methods applied by Fialho et al. [30]. During the same period, 32 water samples from the reservoir were collected monthly with a Von Dorn bottle. To determine total phosphorus, samples were subjected to previous digestion, releasing the compounds associated with organic matter as orthophosphate, according to the persulfate digestion method (APHA, [31]—method 4500-P B5). After that, orthophosphate was measured using the stannous chloride method (APHA [31]—method 4500-P D) with a spectrophotometer (Shimadzu UV-1800). The average values obtained were subjected to a variance analysis, and when significant differences were identified between the means, Tukey’s post hoc test was utilized at a 5% significance level.
2.3.2. Diet and Feeding
During an approximately 215-day O. niloticus production cycle, three commercial feeds were utilized on the farm based on the fish’s weight: 4 mm pellets during the Juvenile I (JVI) phase, 6 mm pellets during the Juvenile II (JVII) phase, and 8 mm pellets until the fish reached the market weight (MWt). Samples of the feeds used in all three cultivation phases were randomly collected (300 g of each diet), labeled, preserved in thermal bags at −10 °C, and sent to a laboratory for subsequent proximate analysis and comparison with the values listed on commercial feed labels.
2.3.3. Zootechnical Performance
For approximately eight months (one cycle/harvest), 55 cages of 48 m3 each were monitored under an initial stocking density of ~35 kg/m3 of O. niloticus, with an initial body weight of 30 ± 5.80 g and a final body weight for slaughter of approximately 850 g. The production cycle was divided into three stages: JVI, 30–150 g; JVII, 150–500 g; and MWt, 500–850 g. Monthly, 150 individuals were collected from each batch and production phase to measure biometric and zootechnical performance indices, including initial and final body weight, daily weight gain, mortality, final biomass, feed conversion ratio (FCR), and feed efficiency (weight gain).
2.4. Measurement of Potential Waste Release into the Aquatic Environment
2.4.1. Prediction of Fish Biomass to Be Produced Through the Thermal Growth Coefficient
To accurately simulate the growth of tilapia in net pens on commercial fish farms, data collected on-site and from the farm’s historical series were used in the thermal growth coefficient (TGC) model [32,33]. This information included all stages of tilapia growth, representing a complete production cycle. Growth data were analyzed using the TGC model, which considers a fixed body weight (1 − b = 0.3333) and non-fixed exponents (Equation (1)). This exponent represents an allometric correction to account for differences in metabolic growth scaling with body weight, ensuring the comparability of growth rates across various fish sizes. Body weight exponents were adjusted according to the recommendations of Dumas et al. [34].
where IBW and FBW are the initial and final body weights (g/fish), respectively, d is the number of cultivation days, and T is the water temperature (°C). The FBW was calculated by reorganizing Equation (1) into the corresponding model shown below (Equation (2)):
The model was adjusted using the sum of squares of residuals (RSS) function to assess the accuracy of the average body weight (ABW) predictions provided by the TGC model with values observed in the field. The model calibration considered all ABW observations made during the different production phases.
The RSS values allowed a comparison of the TGC model’s performance, allowing the ideal exponent to be identified. Thus, the model could be adequately adjusted to the temperature and metabolic conditions of the tilapia in each production phase of the analyzed fish farm.
2.4.2. Nutritional Bioenergetics Modeling to Define the Potential Phosphorus Release into Water from Aquaculture
The simulation of phosphorus load released into the water from aquaculture was calculated using factorial bioenergetics modeling [33], assuming the production values of Nile tilapia reared in cage systems within a neotropical environment [20]. Basal metabolism (HeE) was calculated according to Cho and Bureau [33], using Equation (3):
where HeE represents the fish’s basal metabolism (kJ/fish/day), a and b are empirical coefficients dependent on temperature (T in °C), and BW0.8 indicates the fish’s metabolic body weight (g), based on allometric relationships. Subsequently, the caloric increment of feeding (HiE) was estimated using 70 observations from 40 studies published between 1989 and 2015, as presented by Chowdhury et al. [35]. The values calculated by Bueno et al. [20] for O. niloticus reared in cage systems in a neotropical reservoir [20] were used, as shown in Equation (4).
where EI (kJ/fish) represents the energy intake, FE the feces (kJ/fish), RE the retained energy, and UE + ZE the urinary and branchial excretion (kJ/fish).
The total waste (solid and dissolved) released through aquaculture, including feed leftovers, feces, and urine, resulting from the feeding process during production, was then estimated using the following Equations (5) and (6).
where TSW is the total solid waste, DM the dry matter, and ADC the apparent digestibility coefficient of phosphorus.
where DPW refers to the dissolved phosphorus waste, and P indicates the phosphorus ingested and retained. Thus, the energy and nutrient flux in the studied aquaculture system was determined by applying specific values to the Nile tilapia raised in this reservoir [20].
2.4.3. Simulation of Tilapia Production Waste Load Under Different Climatic Scenarios
Using the zootechnical data and waste estimation obtained from the TGC along with bioenergetics modeling, a simulation of the waste load from tilapia production in the Chavantes reservoir was conducted under different climatic scenarios. The following variables were used to compose the scenarios:
- (a)
- Commercial diets with low, medium, and high energy densities and different levels of phosphorus (0.8%, 1.2%, and 2.1% total P)
- (b)
- Different water temperature conditions (21 °C, 25 °C, and 29 °C)
2.5. Determination of Environmental Carrying Capacity Based on Phosphorus Concentration in Water During Tilapia Production Under Different Climatic, Zootechnical, and Environmental Scenarios
Based on the morphometric characteristics and hydrological data of the Chavantes reservoir, ECCp scenarios were developed by simulating the maximum allowable phosphorus load (kg/year) and fish production (tons/year) using the hydrodynamic model [36]. This simulation incorporated phosphorus waste estimates derived from bioenergetic modeling, as outlined by Bueno et al. [2].
In developing the scenarios, various operational hydrological situations of the reservoir (maximum, average, and minimum) were considered, utilizing morphometric and hydrological data provided by the Brazilian Hydroelectric Potential Information System (SIPOT). These data included elevation (m), area (km2), volume (hm3), average flow (m3/s), residence time (years), and water renewal rate (years⁻1). Additionally, standardized zootechnical data obtained from the Brazilian National Water and Basic Sanitation Agency (ANA) for tilapia production were incorporated, such as the phosphorus content in feed (1.0%), phosphorus retained in fish (9.38 kg/ton), phosphorus released into the water (6.62 kg/ton), and the feed conversion ratio (1.6). Considering the input data and model used to calculate the carrying capacity of the aquatic environment [36,37], these scenarios were referred to as SIPOT Standard scenarios. (Figure 3).
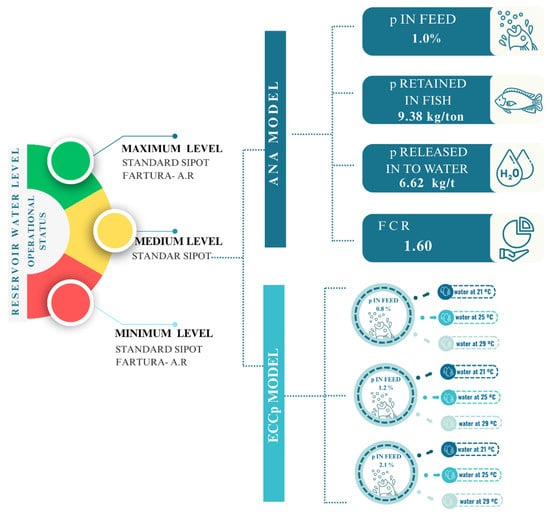
Figure 3.
The environmental carrying capacity based on phosphorus (ECCp) model simulations for tilapia farming incorporates various scenarios. These scenarios combine three different reservoir water levels (maximum, medium, minimum), standardized zootechnical parameters from the ANA Model, as well as various combinations of water temperatures (21 °C, 25 °C, 29 °C) and phosphorus levels in feed (0.8%, 1.2%, 2.1%).
Moreover, as the Chavantes reservoir is large and has distinct characteristics along its length, specific scenarios were developed for the Fartura—SP region (Fartura—A.R.), where the aquaculture area of this study is located. Therefore, a survey of the morphometric and hydrological data of the Chavantes HPP was conducted using historical series from the Brazilian National Interconnected System (SIN/ONS), ANA [38], and scientific studies conducted in the Fartura region [29].
Furthermore, these scenarios were developed with input from zootechnical and environmental data, including variations in water temperature observed in aquaculture and data on phosphorus release into the water based on the feed used, which were obtained in the current study through simulation of the tilapia production waste load.
To define the ECCp, the phosphorus concentration in water ([P], mg/m3) was considered a function of the annual areal phosphorus load (La, mg/m2/year), phosphorus retention coefficient (R), mean depth (z, meters), and annual water renewal rate (ρ, years) of the reservoir (Equation (7)).
where z is calculated by the ratio between the volume and area of the water body, ρ is calculated by the ratio between the average flow and maximum volume of the reservoir, and R is the phosphorus retention coefficient derived from the study conducted by Straškraba [39], as obtained through Equation (8) below:
where td is the water residence time in the reservoir (years). The parameter of phosphorus concentration in Equation (7) refers to Δ[P], which is the increase in phosphorus concentration in the water for a given load La through Equation (9) below:
where Δ[P] is given by the current concentration of P in the reservoir water subtracted from the maximum concentration allowed by Brazilian legislation (CONAMA Resolution No. 357/2005 [40]). From the maximum allowable Δ[P], the maximum allowable La can be calculated as the amount of phosphorus added to the water (Equation (9)).
The annual La in the reservoir was calculated considering a Δ[P] of 5 mg/m3 in the function (Equation (11)). This value was defined by the weight given to the maximum increment of 1/6 of the phosphorus concentration allowed by the CONAMA [40] for Class II water bodies, which include aquaculture activities, corresponding to 5 mg phosphorus per m3 of water [41]. The remaining 5/6 phosphorus concentration was allocated to other uses where phosphorus inputs occurred, such as diluting domestic and industrial sewage, as well as natural inputs.
Next, the allowable phosphorus load in the entire reservoir (Lr, mg/year) was determined using La, which denotes the maximum permissible phosphorus load per m2, by multiplying that value by the water surface area (A, m2) of the reservoir (Equation (10)). Then, Lr (kg/year) was computed using Equation (11), where V (hm3) represents the volume at the specified elevation.
Subsequently, Lr was converted into the allowable annual fish production (B, tons/year) by estimating the proportion of P in the water (Pw) obtained through bioenergetics modeling for each ton of fish produced (Equation (12)).
2.6. Assessment of the Water Body’s Trophic State Index (TSI) During Aquaculture Production
Using the obtained values for phosphorus load and concentration in the water, the ECCp model approach was enhanced by classifying water bodies into different trophic states. This enabled the evaluation of water quality concerning nutrient enrichment, such as total phosphorus (P), represented by Equation (13), which is a linear transformation of Carlson’s [42] values, modified by Kratzer and Brezonik [43]. Consequently, the water body was classified into trophic states: ultraoligotrophic, oligotrophic, mesotrophic, eutrophic, and hypereutrophic, based on Carlson’s [42] index.
where Pt is the total phosphorus concentration measured at the water surface, in µg·L−1, and Ln represent the natural logarithm.
According to the classification [42], the Trophic State Index (TSI) categorizes water bodies based on their nutrient status and primary productivity. TSI values below 20 indicate ultraoligotrophic conditions, characterized by extremely low nutrient levels and primary productivity. Values between 21 and 40 correspond to oligotrophic systems, typically characterized by low nutrient concentrations and high water transparency. When TSI values range from 41 to 50, the water body is classified as mesotrophic, indicating moderate levels of nutrients and productivity. Eutrophic conditions are identified when TSI values fall between 51 and 60, suggesting high nutrient availability and the potential for algal blooms. Finally, TSI values exceeding 61 indicate hypereutrophic conditions, characterized by excessive nutrient enrichment and a high risk of ecological imbalance, including oxygen depletion and harmful algal blooms.
2.7. Analyses for Decision-Making and Management of Water Use Permits for Tilapia Production in the Chavantes Reservoir
Probability of ECCp Scenario Occurrence Using Monte Carlo Simulation
The final stage of the ECCp model involved applying a Monte Carlo simulation (MCS) to estimate the probability of the ECCp scenario occurring according to the operational status of the reservoir. The @RISK 7.6 Professional software (Palisade Corporation, Ithaca, NY, USA; registration ID number 7112268) was integrated with the ECCp model to create a decision-making map regarding the probability of the scenarios occurring. The likelihood of the occurrence of maximum fish production (B) and phosphorus released into the water (Pw) (stochastic output variables) was estimated using 10,000 iterations. For all scenarios, the input stochastic variables were defined as the maximum reservoir load, water temperature, phosphorus content in the feed, and digestible phosphorus (Table 1). These variables were determined based on the information required by the ANA [38] to calculate the reservoir’s carrying capacity and obtain water use permits for aquaculture purposes.

Table 1.
Stochastic input variables in the Monte Carlo simulation (MCS) and the type of value distribution for all evaluated production scenarios.
Following this, the MCS was performed through interactions among these stochastic variables for each output variable [44,45], according to the stochastic probability in Equation (14) below:
where f is the probabilistic function, (1, 2, 3, …, k) the stochastic output variables, and a and b the probability interval of occurrence for Bk and Pak, respectively.
The Monte Carlo simulation used in this study assumed independence among the stochastic variables, adequately represented variability through defined probability distributions, and achieved sufficient statistical convergence with 10,000 iterations.
3. Results
3.1. Secondary Data, Historical Records, and Environmental Conditions
The most essential parameters for environmental monitoring in the field, both before implementation of the enterprise and during aquaculture production in Union waters, were dissolved oxygen, total phosphorus, nitrogen, pH, chlorophyll, turbidity, and reservoir depth, following the recommended values established by Brazilian environmental regulations, specifically the CONAMA [40].
Additionally, information was gathered about the environmental conditions required by State Environmental Agencies (OEMAS) for the environmental licensing process related to waste from fish production in Union waters—lakes and reservoirs [46].
3.2. On-Site and Laboratory Data
3.2.1. Water Quality
The water quality variables collected during Nile tilapia production in the Chavantes reservoir indicated that limnological parameters remained within the limits recommended by the CONAMA [40] for intermediate lentic environments. The average values for dissolved oxygen, total phosphorus, and pH were 8.7 mg/L, 40.5 mg/m3, and 7.3, respectively, while the water temperature ranged from 21.5 to 29.2 °C.
3.2.2. Diet and Feeding
The three diets employed during the tilapia production cycle in the aquaculture system consisted of medium-energy density feeds that contained approximately 31% crude protein, 90% dry matter (DM), 1.2% total phosphorus, and 16 MJ/kg gross energy (Table 2).
Table 2.
Low-, medium-, and high-energy density feeds with different phosphorus levels were used to simulate the release of waste into the aquatic environment.
3.2.3. Zootechnical Performance
The fish performance parameters evaluated throughout the entire production cycle demonstrated final biomass values of 35 ± 9.8, 84 ± 7.9, and 97 ± 15.4 kg/m3, with feed conversion ratios of 1.41, 1.70, and 1.83, respectively. This resulted in a feed efficiency of 0.74, 0.65, and 0.61 for the respective JVI, JVII, and MWt phases (Table 3).
Table 3.
Performance parameters of tilapia in net cages in the aquaculture area of the Chavantes reservoir, São Paulo, Brazil, for the production phases Juvenile I (JVI), Juvenile II (JVII), and market weight (MWt).
3.3. Measurement of the Potential Waste Release into the Aquatic Environment
3.3.1. Prediction of Fish Biomass to Be Produced in the Enterprise Through Thermal Growth Coefficient Modeling
The predicted body growth values and the adjustment of the growth relationship were determined through a residual sum analysis using actual field data. During the Juvenile I phase (30–150 g), the revised TGC was 1.147, with an exponential coefficient of 0.5332. The residual sum of squares (RSS) values for this phase were 88 and 37 for the original and revised TGC models, respectively. In the Juvenile II phase (150–500 g), the original TGC decreased to 0.116, while the revised TGC significantly increased to 12.870, with an exponential coefficient of 0.9501. The RSS values for this phase were 1.554 (original TGC) and 7.729 (revised TGC). Finally, in the market weight phase (500–850 g), the original TGC was 0.109, the revised TGC increased to 19.122, and the exponential coefficient was 0.8532. The corresponding RSS values for this phase were 1.039 and 1.202, respectively. These results demonstrate a progressive refinement of the growth model across different fish growth phases, highlighting the improved accuracy of the revised TGC model, particularly in later growth stages. The TGC model estimated growth trajectories.
3.3.2. Nutritional Bioenergetics Modeling to Define Phosphorus Release from Aquaculture
The chemical composition and nutrient digestibility of commercial diets with different phosphorus levels were used to simulate the phosphorus waste released into the aquatic environment under diverse climatic conditions (Table 2). The low-, medium-, and high-energy-density feeds contained phosphorus levels of approximately 0.8%, 1.2%, and 2.1%, respectively.
Considering the realities of the studied aquaculture area (feed containing 1.2% phosphorus), producing one ton of O. niloticus in cage systems at temperatures of 21 °C, 25 °C, and 29 °C required the release of 5.37, 7.81, and 8.63 kg of total phosphorus into the water, respectively (Table 4). Under the same temperature conditions, reducing the feed’s phosphorus content to 0.8% meant that 3.28, 4.99, and 5.17 kg of phosphorus per ton of fish produced would be released into the environment, which is, on average, 1.6 times less phosphorus. These results were obtained through simulations of phosphorus waste release into the aquatic environment using various commercial feeds (Table 4). Therefore, it was possible to compile the primary data inputs in the factorial bioenergetics model and determine the phosphorus retention and excretion rates for each weight category of tilapia produced in the cage systems, taking into account different climatic and zootechnical scenarios.
Table 4.
Simulations of waste release into the aquatic environment for the production of one ton of Oreochromis niloticus in net cages in the aquaculture area of the Brazilian Chavantes reservoir under different climatic and zootechnical scenarios.
3.4. Determination of Environmental Carrying Capacity for Tilapia Production Based on Phosphorus Concentration and Release into Water Under Different Climatic, Zootechnical, and Environmental Scenarios
The ECC and the maximum allowable fish production in the Chavantes reservoir varied under different operational scenarios for the reservoir. A drop in water level, shifting the operation from maximum to medium capacity, resulted in a 13.32% reduction in ECCp—from 39,767 to 34,468 —equivalent to 5298 fewer tons of fish per year (Table 5). With a further decrease in water level, as the reservoir moved from medium to minimum operational capacity, the ECCp declined by an additional 7.66%, corresponding to 2641 fewer tons of fish per year.
Table 5.
Environmental carrying capacity scenarios for phosphorus (ECCp) with simulations of the maximum phosphorus load and the maximum allowable fish production in the Chavantes reservoir and the studied aquaculture area under different climatic and zootechnical scenarios.
The comparison between the standard SIPOT ECCp scenario and the specific scenario for the Fartura region, under minimum operational reservoir conditions, revealed a 46.77% reduction in the maximum phosphorus load, corresponding to 14,885 fewer tons of fish production per year. This reduction was determined by the difference between 31,827.42 tons (scenario 3) and 16,942.05 tons (scenario 5) (Table 5). The 46.77% reduction was calculated based on the proportional relationship between these values (Table 5 and complete in Appendix A). Regarding the studied aquaculture area, using feeds with higher phosphorus content under different water temperatures was observed to reduce the maximum allowable fish production when compared to the calculation made by the ANA using standardized zootechnical data for tilapia production (scenarios 01–05). This was evident in scenarios 06–50, developed using data input obtained by modeling the TCG and nutritional bioenergetics. Considering the reality of the studied aquaculture system (1.2% P in feed, scenarios 21–35), at a temperature of 21 °C, the maximum allowable production in the reservoir increased by 23% compared to that calculated by the ANA. However, at a temperature of 29 °C, production decreased by 23%. Furthermore, depending on the water temperature, the high-energy-density feed (2.1% P) resulted in a 2–3 times reduction in output.
3.5. Assessment of the Trophic State Index (TSI)
Throughout the tilapia production cycle, the aquaculture area predominantly exhibited an oligotrophic state, with TSI values ranging from 4 to 32. Notably, the water was classified as ultraoligotrophic during January and February, indicating even lower nutrient levels. These results suggest that aquaculture production did not influence the trophic status of this reservoir area during the study period.
3.6. Analyses for Decision-Making and Management of Water Use Permits for Tilapia Production in the Chavantes Reservoir
Probability of ECCp Scenario Occurrence Using a Monte Carlo Simulation
Overall, the MCS indicated a 90% likelihood that phosphorus release into the water would exceed 6.62 kg/ton, a value adopted by ANA for calculating the maximum allowable fish production in the reservoir. This estimate arose from the difference between the 95% and 5% percentiles, as only 5% of the simulations produced values below 6.62 kg/t (Table 6). However, a 50% probability was noted for fish production to fall within the values calculated by the ANA (scenarios 01–04).
Table 6.
Monte Carlo simulation analysis (MCS) with 10,000 random interactions for the variables of phosphorus released into the water (Pa) and the maximum fish production (B) in the SIPOT standard and Fartura A.R. scenarios.
Considering the standard SIPOT scenarios, to produce one ton of tilapia with an average weight of 850 g, the simulation demonstrated a 50% probability that phosphorus release into the water would nearly reach 10.77 kg, corresponding to 21 out of the 30 scenarios developed and the production of 21,712.15 tons of fish per year. In the specific scenarios for Fartura, although the simulation did not show significant differences in phosphorus release into the water compared to the SIPOT standard scenarios, there was a 50% probability that the maximum allowable fish production in the reservoir would be reduced from 21,712.15 to 17,123.32 (~21%).
These results allowed us to develop a probability and productivity capacity map for the Chavantes reservoir (Figure 4). On average, 50% of the scenarios fell within the productive range of 22,000–50,000 tons of fish per year, representing the average tilapia production capacity in this aquatic environment, based on variations in phosphorus discharge and fish production across hydrological, dietary, and climatic conditions.
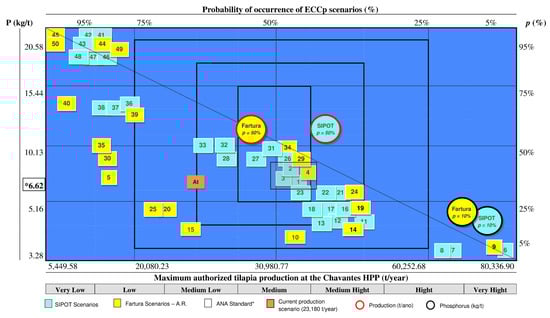
Figure 4.
Map of the probability of occurrence of the 50 ECCp scenarios and the maximum authorized tilapia production in the Chavantes reservoir (SP, Brazil), considering phosphorus concentration and discharge into the water. The x-axis (bottom) displays the maximum authorized fish production (t/year), while the x-axis (top) shows the probability (%) of achieving that production level. The y-axis (left) represents phosphorus discharge per ton of fish produced (kg/t), and the y-axis (right) shows the probability (%) of that phosphorus release occurring. * Standard value used by the ANA for calculating the carrying capacity and maximum allowable fish production in the reservoir. Scenarios 1 to 5: developed according to the standard value used by the ANA for phosphorus discharge into the water resulting from fish production. p = 10%: probability that the phosphorus discharge into the water is equal to 6.62 kg/t. p = 50%: probability of occurrence of the standard SIPOT and Fartura scenarios—A.R. At: Current scenario with a productive capacity of 23,180 tons of fish per year [49].
4. Discussion
The main findings of this study demonstrated that the new approach used for modeling the ECCp effectively predicted the maximum allowable production of Nile tilapia (O. niloticus) in the Chavantes reservoir under different climatic and zootechnical scenarios. Phosphorus retention by the fish varied depending on the phosphorus content in the feed and water temperature, with higher retention observed in feeds with lower phosphorus levels (0.8%) and at cooler water temperatures (21 °C). The MCS employed to estimate the maximum permissible phosphorus load indicated a potential production range of 22,000–50,000 tons of tilapia per year, depending on climatic conditions. These findings highlight the importance of adjusting feed formulations and management practices in response to environmental conditions to optimize production while minimizing environmental impact, particularly in terms of phosphorus release, a key contributor to eutrophication.
The study region is characterized by rainy summers, dry winters, and an average temperature above 22 °C during the hottest month, as classified by Köppen [50]. This climatic variability directly affects tilapia growth rates and feed efficiency, which, in turn, influence phosphorus excretion into the water. The air temperature fluctuates between 28 °C in March and 17 °C in August. The most favorable months for tilapia production are from December to June, when higher temperatures promote better fish growth. However, water quality must also be considered during the peak production months. These seasonal variations in temperature and water quality not only affect fish growth and feed conversion efficiency but also influence the environmental carrying capacity (ECCp) of the reservoir. This highlights the necessity for a modeling approach that combines climatic and operational variability to ensure sustainable production while minimizing potential environmental impacts.
The water quality in the aquaculture area of the Chavantes reservoir remained within acceptable limits for tilapia production. Other authors [30,51] reported similar water quality conditions in cage systems within neotropical reservoirs, achieving satisfactory zootechnical performance for O. niloticus. Throughout this study, total phosphorus concentrations remained mainly within the limits established by the CONAMA (50 mg/m3 for Class II waters) [40], except for two months, when they reached 60.54 and 71.10 mg/m3. Despite these temporary increases, water quality parameters suggested stable fish farming conditions.
Moreover, the trophic state index (TSI) remained predominantly oligotrophic throughout the production cycle, suggesting that aquaculture activities did not contribute to increased trophic levels in the study area. This contrasts with findings from other neotropical reservoirs, where intensive fish farming has been linked to greater eutrophication risks [47,52]. Even during peak biomass and feed consumption periods, TSI values did not show a shift toward mesotrophic or eutrophic conditions, indicating that localized hydrodynamics and reservoir management effectively mitigate potential impacts from aquaculture operations.
Although feed provision is the primary factor influencing phosphorus levels in aquaculture [10], the observed increase in phosphorus levels in this study may also have been influenced by external anthropogenic activities, such as domestic effluent discharge and local agricultural practices. Since the Chavantes reservoir is a multi-use environment, identifying the primary source of phosphorus input remains challenging [29,53,54]. Spatial and temporal variations in phosphorus concentrations were notable within the Chavantes HPP, especially in areas influenced by tributary rivers [29].
During the production cycle, water temperatures in the Chavantes reservoir fluctuated between 21 °C and 29 °C, with an average of 25.4 °C, which is close to the optimal range for tropical fish growth (26–30 °C) [55]. Although O. niloticus can maintain regular physiological activity at temperatures as low as 16 °C [56], higher temperatures can alter its metabolic processes, resulting in increased phosphorus excretion and overall waste production. Thus, variations in phosphorus discharge are directly influenced by feed composition and water temperature. Integrating bioenergetic modeling into ECC calculations enables the refinement of phosphorus excretion estimates and a more accurate assessment of the environmental impact of tilapia farming, particularly in mitigating eutrophication.
Given that phosphorus excretion is strongly influenced by water temperature and metabolic activity, the role of feed composition becomes equally crucial in determining waste outputs. The three diets used in this study had a similar nutritional composition (~31% CP, ~90% DM, ~1.2% TP, and ~16 MJ/kg GE). However, differences emerged between the manufacturer-reported compositions and those verified through laboratory analyses. This discrepancy highlights the importance of rigorous study and quality control of feed batches, as variations in nutrient content can impact both growth performance and environmental waste outputs, particularly given that feed costs can account for up to 70% of total aquaculture production expenses [57,58,59]. Feeds with the highest phosphorus content (2.1% P) led to lower phosphorus retention and increased waste production, particularly at 29 °C. These findings are consistent with prior research indicating that the digestible phosphorus requirement of tilapia ranges from 0.4–0.8% [60,61,62,63]. Thus, reducing phosphorus in feed decreases excretion and improved water quality significantly [64,65].
Beyond its impact on fish performance, feed management is a key factor in the environmental sustainability of aquaculture. The release of uneaten feed and excreta into the surrounding waters is a significant concern, as these externalities contribute to nutrient accumulation and potential ecosystem imbalances [47,66]. Additionally, excess feed may be consumed by wild fish or other organisms. Nobile et al. [67] and Brandão et al. [68] demonstrated that wild fish consumed residual feed from aquaculture cages, thereby altering their diet and trophic interactions. This suggests that aquaculture activities can influence nutrient dynamics within the broader aquatic ecosystem.
Another critical factor influencing tilapia production is water temperature, which directly affects fish performance and feed intake [66,69]. In this study, producing one ton of tilapia at an average water temperature of 25 °C with feed containing 0.8%, 1.2%, and 2.1% phosphorus resulted in phosphorus retention rates of 51%, 40%, and 20%, respectively. These results are consistent with those of Boyd et al. [70] and Osti et al. [71], who observed that tilapia biomass retained between 40% and 46% of the phosphorus obtained from feed. Reducing dietary phosphorus substantially lowers excretion rates and improved water quality [2,72], making it a key strategy in sustainable aquaculture management.
Phosphorus plays a central role in eutrophication, one of the most concerning environmental impacts of aquaculture in aquatic systems. Wang et al. [73] found that 70% of the phosphorus from feed in salmon farming was released into the environment. In contrast, Montanhini Neto and Ostrensky [47] reported that the production of one ton of tilapia released approximately 1040 kg of organic matter, 45 kg of nitrogen, and 14 kg of phosphorus into the surrounding waters. Similar studies [51,52] have further shown that only a small portion of the phosphorus (17–23%) is retained in fish biomass, with the remainder being deposited in sediments (66%) or released into the water column (11%). These findings demonstrate the significant environmental footprint associated with phosphorus discharge.
In this study, the phosphorus waste released into the water ranged from 3.3 to 20.5 kg per ton of tilapia produced, depending on the feed composition and water temperature. These results are comparable to those reported for Nile tilapia [51,74] and other species, including Piaractus mesopotamicus, Oncorhynchus mykiss, Pangasianodon hypophthalmus, and Penaeus vannamei, with phosphorus discharges ranging from 5.9 to 14.8 kg per ton [75,76,77,78]. This reinforces the strong connection between water temperature, feed quality, and waste generation, highlighting the necessity of incorporating climatic and zootechnical factors into growth modeling and waste simulations for aquaculture systems to reduce environmental impacts. Furthermore, Montanhini Neto et al. [53] emphasized that water use regulations must consider reservoirs that may already have phosphorus levels exceeding the recommended thresholds or even be eutrophic. This highlights the necessity for environmental policies tailored to the unique conditions of each water body, thereby ensuring more targeted management and mitigation of phosphorus-related ecological risks.
The TGC model used in this study achieved an accuracy of 85.4% in predicting fish biomass at different water temperatures. This model has been successfully applied in studies involving other fish species, such as Oncorhynchus mykiss and Salmo salar, as well as other genetic varieties of O. niloticus [57,79,80]. These results reinforce the utility of mathematical models in predicting growth and nutritional requirements when water temperature is integrated into the calculations [20,35,81]. These factors are crucial for accurate ECC calculations in aquaculture.
The results of this study suggest that the maximum estimated phosphorus load for the Chavantes HPP could reach 263,258 kg/year under maximum operational conditions (95% of the total water capacity). This would support a potential tilapia production of 39,767 tons per year, representing a 71% increase in production capacity compared to the 23,180 tons per year currently regulated by the ANA [49]. This substantial difference indicates that the ECCp model employed in this study provides more accurate and reliable estimates than current regulatory frameworks. Correia and Dias [82] emphasized that each reservoir operated under unique conditions, influenced by various factors such as water availability, discharge patterns, and climatic variability, which must be carefully considered in ECCp calculations. Given that the Chavantes HPP is situated in a transitional climatic zone, it is susceptible to fluctuations in temperature, precipitation, and wind patterns, further complicating reservoir management.
This study also demonstrated that feeds with lower phosphorus content (0.8% TP), used at 21 °C, 25 °C, and 29 °C, could lead to production increases of up to twice those estimated by the ANA. Although the most substantial reduction in phosphorus discharge occurred at 21 °C, this temperature is below the optimal thermal range for Nile tilapia, which may potentially negatively affect growth and productivity. Thus, despite the environmental benefits of lower phosphorus emissions, this scenario might not represent optimal conditions for fish welfare or economic performance. These findings highlight the complexity involved in accurately estimating environmental carrying capacity and emphasize the limitations of using static values for phosphorus content and ecological factors in regulatory models, as evidenced by discrepancies of up to 80% between the ECCp model and ANA calculations.
Reliance on outdated models by regulatory agencies [21,53,66] poses a significant threat to sustainable fish production, particularly in tropical and neotropical reservoirs. Relying on outdated, low-accuracy data for water use permits and public policy in major aquaculture-producing countries such as Brazil poses significant environmental and financial risks to the entire aquaculture production chain. These concerns have been recognized in the regulations governing operations in tropical and neotropical lakes and reservoirs.
The methodology used in this study attained 96% accuracy, as it compared the carrying capacity estimated by the ECCp model with the maximum production limit set by the federal regulatory system for freshwater aquaculture licensing for the Chavantes reservoir. This high accuracy is attributed to the integration of multiple equations and the ability to simulate diverse production scenarios by incorporating dynamic interactions among zootechnical, climatic, and environmental factors. Additionally, the geographical location of fish farms, particularly in large reservoirs with spatial and temporal complexity, plays a crucial role in the accuracy of ECCp calculations [29,83,84].
When evaluating the main factors influencing the release of organic waste from a commercial aquaculture farm, we found that producing one ton of tilapia at an average temperature of 25 °C with feeds containing 0.8%, 1.2%, and 2.1% phosphorus resulted in phosphorus retention rates of 51%, 40%, and 20%, respectively. These findings are consistent with those of Boyd et al. [70] and Osti et al. [71], who estimated that tilapia biomass recovered 40% and 46% of the phosphorus applied from feed, respectively. Additionally, Hardy and Gatlin [72] observed a reduction of over 50% in fecal and excretory phosphorus losses when dietary phosphorus was reduced, supporting this hypothesis. However, Bueno et al. [2] noted that fish can disperse unused nutrients from feed and organic matter directly from cages into the surrounding waters, complicating effluent treatment. This factor can significantly affect ECCp modeling by altering phosphorus concentrations in the water used for these calculations.
Given these findings, evaluating ECCp in the Chavantes reservoir by separating regions with dendritic and run-of-river characteristics resulted in more accurate carrying-capacity modeling. A significant difference in carrying capacity and maximum fish production was observed when comparing the two minimum operational scenarios of the reservoir (SIPOT standard and Fartura—R.A.). This difference can be attributed to the limnological and morphometric characteristics of the site, as the sheltered area of this reservoir compartment experiences lower flow and longer water residence times, leading to higher phosphorus concentrations. Despite an 85% increase in biomass and feed consumption observed between January and February, phosphorus concentrations in the water declined to ultraoligotrophic levels. This may be linked to wind events that promote the formation of currents and waves, which interfere with water mass agitation, waste dispersion, and the dissolution of atmospheric oxygen into the water [85].
When calculating 10,000 possible interactions for the ECCp, the phosphorus release into the water from this production system showed a 50% probability of occurring near 10.77 kg to produce one ton of tilapia in the Chavantes reservoir, a value similar to those observed in other studies [30,51,74]. In assessing the carrying capacity of eight reservoirs along the Paranapanema River, Montanhini Neto et al. [53] estimated that the total nutrient loads entering the environment were 78% organic matter, 65% nitrogen, and 72% phosphorus. They concluded that the ECC estimates for fish production in these environments should be limited to 3.5 km2, with a potential annual production of less than 100,000 tons, which represents one-fifth of the current values recommended by government agencies that grant fish production permits in these environments [49]. This highlights the need to implement more modern and accurate approaches that allow for effective evaluations of ECC, considering the species’ characteristics for production, management conditions, and climatic and limnological factors that affect water use, thereby permitting more efficient processes for fish production in inland waters.
Aligned with this perspective, the ECCp framework was specifically designed for cage farming of Nile tilapia (O. niloticus) in tropical and neotropical reservoirs, where phosphorus is recognized as the key nutrient driving environmental impact. While its structure allows for adaptation to other fish species and freshwater systems, its applicability depends on the availability and accuracy of input data, such as limnological parameters and species-specific bioenergetic values. In contexts where phosphorus is not the limiting factor for eutrophication or where such data are not well established, the model may require adjustments to ensure accurate estimations of the carrying capacity
Based on the findings of this study, adjusting production management to seasonal and environmental variations can help fish farmers optimize zootechnical performance while reducing phosphorus emissions. Strategies such as fractional feeding management, the use of highly digestible feed ingredients, the application of enzymes like phytase, and the incorporation of nano-structured nutrients have the potential to improve nutrient utilization efficiency without compromising productivity. Additionally, integrating multitrophic aquaculture systems presents a promising approach to mitigating environmental impacts. For policymakers, the ECCp model offers a more precise and adaptable tool for environmental licensing, enabling decisions that more accurately reflect the ecological and operational variability of aquaculture systems.
5. Conclusions
The new modeling approach used in this study achieved a high level of precision (96%) in estimating the environmental carrying capacity (ECC) for phosphorus in fish production under different climatic conditions and production scenarios for tilapia (O. niloticus) reared in cage systems within a neotropical reservoir. This framework can potentially be applied to other fish species and regions by adjusting the specific parameters to reflect each species’ characteristics and the hydrographic and climatic conditions of the respective reservoirs and lakes.
Results indicate that adjusting dietary phosphorus levels is a crucial strategy for reducing environmental impact. Lower levels of digestible total phosphorus in feed, even at higher water temperatures, can decrease phosphorus release into the environment by as much as two times. This would lead to an increase in the ECC of fish production in this setting.
On average, 50% of the ECCp scenarios and simulations based on phosphorus concentration and release into the water fell within the productive range of 22,000 to 50,000 tons of tilapia per year in the Chavantes reservoir, São Paulo. Given these results, this study advocates adaptive management practices and the revision of public policies to mitigate the environmental impact of phosphorus discharge, thereby ensuring the long-term sustainability of aquaculture in tropical and neotropical regions.
While the proposed framework demonstrated high accuracy and consistency with the existing literature, its applicability to other freshwater systems and fish species depends on the availability of local data, as well as the specific limnological and operational characteristics of each environment. Therefore, future studies should test the model in various productive and environmental contexts, explore potential nonlinear interactions among ecological variables, and validate its performance across diverse aquaculture settings. Furthermore, the results underscore the importance of considering environmental, zootechnical, and climatic factors in the development and implementation of studies on carrying capacity approaches for sustainable aquaculture strategies. Striking a balance among these aspects is crucial to ensure both ecological integrity and the long-term viability and community acceptance of fish farming, particularly in areas with significant production potential and environmental vulnerability.
Author Contributions
Conceptualization, methodology, formal analysis, investigation, visualization, writing—original draft, writing—review and editing, E.M.d.G.; writing—review and editing, T.R.C., M.T. and R.R.; supervision, writing—review and editing, D.C.P., J.M.C.O. and P.G.; supervision, writing—review and editing, funding acquisition, resources, G.W.B. All authors have read and agreed to the published version of the manuscript.
Funding
The authors would like to thank the Foundation for the Improvement of Higher Education Personnel—Brasil (CAPES)–AUXPE 274/2021 (Process 88881.638983/2021-01); INCT Nanotechnology for Sustainable Agriculture, National Council for Scientific and Technological Development (MCTI-CNPqINCTNanoAgro #405924/2022-4; CNPq Productivity development technological grant #303653/2022-1 and MEC-CAPES INCTNanoAgro #88887.953443/2024-00; São Paulo Research Foundation (FAPESP) process nº 2021/10639-5 (CbioClima Cepid), 2022/02756-4, 2023/03232-1 and 2024/03203-4 (Blasp4 Project); and Secretary of Science, Technology and Innovation of the Government of São Paulo—SCTI, CETMA Project/Tech Incubator Aquarium of Ideas for the financial support to perform this study # 008.00000262/2024-34.
Institutional Review Board Statement
Not applicable.
Informed Consent Statement
Not applicable.
Data Availability Statement
No data were used for the research described in the article.
Acknowledgments
We would like to thank the Foundation for the Improvement of Higher Education Personnel—Brasil (CAPES) – AUXPE 274/2021 (Process 88881.638983/2021-01); the Center for Research on Biodiversity Dynamics and Climate Change—CBioClima Fapesp; the Secretary of Science, Technology and Innovation of the Government of São Paulo—SCTI, SPAI Network, Cetma Project; the INCT Nanotechnology for Sustainable Agriculture, the Coordination for the Improvement of Higher Education Personnel—Brazil (MEC-CAPES INCTNanoAgro #88887.986628/2024-00) for the postdoctoral fellowship (Obando J.M.C.; and the São Paulo Research Foundation (FAPESP) for the fellowship (Godoy E.M. and Toniato M.).
Conflicts of Interest
Elisa Maia de Godoy, Moranne Toniato, and Danilo Cintra Proença are employed by the company Biomonetize Valuation and Monetization of Environmental Services Ltda. The remaining authors declare that the research was conducted in the absence of any commercial or financial relationships that could be construed as a potential conflict of interest.
Abbreviations
| [P] | Phosphorus concentration in water |
| A | Area |
| ABW | Average body weight |
| ADC | Apparent digestibility coefficient of phosphorus |
| ANA | Brazilian National Water and Basic Sanitation Agency |
| B | Annual fish production |
| BW | Fish’s metabolic body weight |
| CP | Crude protein |
| d | Number of cultivation days |
| DDM | Digestible dry matter |
| DE | Digestible energy |
| DM | Dry matter |
| DP | Digestible protein |
| DP | Digestible phosphorus |
| DP/DE | Digestible protein to digestible energy ratio |
| DPW | Dissolved phosphorus waste |
| DWG | Daily weight gain |
| ECCp | Environmental carrying capacity based on phosphorus |
| EI | Energy intake |
| A.R. | Accumulation reservoir |
| FB | Final biomass |
| FBW | Final body weight |
| FCR | Feed conversion ratio |
| FE | Feces |
| FE | Feed efficiency |
| GE | Gross energy |
| HeE | Fish’s basal metabolism |
| HiE | Caloric increment of feeding |
| HPP | Hydroelectric power plant |
| IBW | Initial body weight |
| JVI | Juvenile I |
| JVII | Juvenile II |
| La | Annual areal phosphorus load |
| Lr | Phosphorus load in the entire reservoir |
| MCS | Monte Carlo simulation |
| MO | Mortality |
| MWt | Market weight |
| OEMAS | State Environmental Agencies |
| ONS | Brazilian National Electric System Operator |
| P | Total phosphorus |
| Pa | Phosphorus released into the water |
| pH | Hydrogen ionic potential |
| Pp | Phosphorus retained in fish |
| Pr | Phosphorus in feed |
| Pw | Phosphorus in the water |
| R | Phosphorus retention coefficient |
| RE | Retained energy |
| RSS | Sum of squares of residuals |
| SIPOT | Brazilian Hydroelectric Potential Information System |
| T | Water temperature |
| td | Water residence time |
| TGC | Thermal growth coefficient |
| TSI | Trophic state index |
| TSW | Total solid waste |
| UE | Urinary excretion |
| V | Volume |
| Z | Mean depth |
| ZE | Branchial excretion |
| Δ[P] | Phosphorus concentration |
| ρ | Annual water renewal rate |
Appendix A
Table A1.
Environmental carrying capacity scenarios for phosphorus (ECCp) with simulations of the maximum phosphorus load and the maximum allowable fish production in the Chavantes reservoir and the studied aquaculture area, under different climatic and zootechnical scenarios.
Table A1.
Environmental carrying capacity scenarios for phosphorus (ECCp) with simulations of the maximum phosphorus load and the maximum allowable fish production in the Chavantes reservoir and the studied aquaculture area, under different climatic and zootechnical scenarios.
| Reservoir Water Level | Operational Status | Maximum Operational Level (SIPOT Standard) | Medium Operational Level (SIPOT Standard) | Minimum Operational Level (SIPOT Standard) | Maximum Operational Level (Fartura—A.R.) | Minimum Operational Level (Fartura—A.R.) |
|---|---|---|---|---|---|
| Scenario 01 | Scenario 02 | Scenario 03 | Scenario 04 | Scenario 05 | |
| Elevation (m) * | 474.00 | 470.29 | 465.23 | 472.60 | 467.90 |
| Area (km2) ** | 402.53 | 349.12 | 301.78 | 387.32 | 333.98 |
| Volume (hm3) ** | 8795 | 7368 | 5754 | 8321 | 6669 |
| Average inflow rate—Qmlt (m3/s) * | 400.00 | 346.94 | 322.36 | 400.00 | 170.00 |
| Average depth at the elevation considered—z (m) | 21.85 | 21.10 | 19.07 | 21.48 | 19.97 |
| Residence time—td (years) | 0.697 | 0.673 | 0.566 | 0.660 | 1.244 |
| Residence time—td (days) | 254.48 | 245.79 | 206.59 | 240.77 | 454.03 |
| Water renewal rate in the reservoir—ρ (years) | 0.045 | 0.047 | 0.056 | 0.048 | 0.025 |
| Δ[P] (mg/m3) *** | 5.00 | 5.00 | 5.00 | 5.00 | 5.00 |
| Phosphorus retention coefficient—R **** | 0.760 | 0.760 | 0.759 | 0.761 | 0.761 |
| Zootechnical Data for the Studied Specie | |||||
| P feed (kg/t)—Pr (1% P—total) | 10.00 | 10.00 | 10.00 | 10.00 | 10.00 |
| P retained in fish (kg/t)—Pp ***** | 9.38 | 9.38 | 9.38 | 9.38 | 9.38 |
| P released into water (kg/t)—Pa | 6.62 | 6.62 | 6.62 | 6.62 | 6.62 |
| FCR | 1.60 | 1.60 | 1.60 | 1.60 | 1.60 |
| Environmental Carrying Capacity for P (ECCp) at the Chavantes Hydroelectric Power Plant (UHE Chavantes) | |||||
| Maximum load of the reservoir Lr (kg/year) | 263,258.87 | 228,183.68 | 210,697.50 | 263,899.58 | 112,156.34 |
| Maximum fish production B (t/ano)—ANA | 39,767.20 | 34,468.83 | 31,827.42 | 39,863.99 | 16,942.05 |
| Environmental Carrying Capacity for P (ECCp) in the Aquaculture Area (UHE Chavantes—Fartura) | |||||
| Feed with 0.8% P and water temperature of 21 °C | Scenario 06 | Scenario 07 | Scenario 08 | Scenario 09 | Scenario 10 |
| Water temperature (°C) | 21 | 21 | 21 | 21 | 21 |
| P feed (kg/t)—(0.8% P—total) | 8.00 | 8.00 | 8.00 | 8.00 | 8.00 |
| P retained in fish (kg/t)—Pp | 4.09 | 4.09 | 4.09 | 4.09 | 4.09 |
| P released into the water (kg/t)—Pa | 3.28 | 3.28 | 3.28 | 3.28 | 3.28 |
| New maximum fish production (t/year)—0.8% P 21 °C | 80,141.85 | 69,464.18 | 64,141.00 | 80,336.90 | 34,142.88 |
| Feed with 0.8% P and water temperature of 25 °C | Scenario 11 | Scenario 12 | Scenario 13 | Scenario 14 | Scenario 15 |
| Water temperature (°C) | 25 | 25 | 25 | 25 | 25 |
| P feed (kg/t)—(0.8% P—total) | 8.00 | 8.00 | 8.00 | 8.00 | 8.00 |
| P retained in fish (kg/t)—Pp | 5.00 | 5.00 | 5.00 | 5.00 | 5.00 |
| P released into the water (kg/t)—Pa | 4.99 | 4.99 | 4.99 | 4.99 | 4.99 |
| New maximum fish production (t/year)—0.8% P 25 °C | 52,775.75 | 45,744.19 | 42,238.72 | 52,904.19 | 22,484.08 |
| Feed with 0.8% P and water temperature of 29 °C | Scenario 16 | Scenario 17 | Scenario 18 | Scenario 19 | Scenario 20 |
| Water temperature (°C) | 29 | 29 | 29 | 29 | 29 |
| P feed (kg/t)—(0.8% P—total) | 8.00 | 8.00 | 8.00 | 8.00 | 8.00 |
| P retained in fish (kg/t)—Pp | 5.00 | 5.00 | 5.00 | 5.00 | 5.00 |
| P released into the water (kg/t)—Pa | 5.17 | 5.17 | 5.17 | 5.17 | 5.17 |
| New maximum fish production (t/year)—0.8% P 29 °C | 50,906.54 | 44,124.03 | 40,742.71 | 51,030.43 | 21,687.74 |
| Feed with 1.2% P and water temperature of 21 °C 1 | Scenario 21 | Scenario 22 | Scenario 23 | Scenario 24 | Scenario 25 |
| Water temperature (°C) | 21 | 21 | 21 | 21 | 21 |
| P feed (kg/t)—Pr (1.2% P—total) | 12.00 | 12.00 | 12.00 | 12.00 | 12.00 |
| P retained in fish (kg/t)—Pp | 4.09 | 4.09 | 4.09 | 4.09 | 4.09 |
| P released into the water (kg/t)—Pa | 5.37 | 5.37 | 5.37 | 5.37 | 5.37 |
| New maximum fish production (t/year)—1.2% P 21 °C | 48,980.30 | 42,454.43 | 39,201.06 | 49,099.51 | 20,867.11 |
| Feed with 1.2% P and water temperature of 25 °C 1 | Scenario 26 | Scenario 27 | Scenario 28 | Scenario 29 | Scenario 30 |
| Water temperature (°C) | 25 | 25 | 25 | 25 | 25 |
| P feed (kg/t)—Pr (1.2% P—total) | 12.00 | 12.00 | 12.00 | 12.00 | 12.00 |
| P retained in fish (kg/t)—Pp | 5.00 | 5.00 | 5.00 | 5.00 | 5.00 |
| P released into the water (kg/t)—Pa | 7.81 | 7.81 | 7.81 | 7.81 | 7.81 |
| New maximum fish production (t/year)—1.2% P 25 °C | 33,719.52 | 29,226.91 | 26,987.20 | 33,801.59 | 14,365.55 |
| Feed with 1.2% P and water temperature of 29 °C 1 | Scenario 31 | Scenario 32 | Scenario 33 | Scenario 34 | Scenario 35 |
| Water temperature (°C) | 29 | 29 | 29 | 29 | 29 |
| P feed (kg/t)—Pr (1.2% P—total) | 12.00 | 12.00 | 12.00 | 12.00 | 12.00 |
| P retained in fish (kg/t)—Pp | 5.00 | 5.00 | 5.00 | 5.00 | 5.00 |
| P released into the water (kg/t)—Pa | 8.63 | 8.63 | 8.63 | 8.63 | 8.63 |
| New maximum fish production (t/year)—1.2% P 29 °C | 30,514.15 | 26,448.61 | 24,421.80 | 30,588.41 | 12,999.96 |
| Feed with 2.1% P and water temperature of 21 °C | Scenario 36 | Scenario 37 | Scenario 38 | Scenario 39 | Scenario 40 |
| Water temperature (°C) | 21 | 21 | 21 | 21 | 21 |
| P feed (kg/t)—Pr (2.1% P—total) | 21.00 | 21.00 | 21.00 | 21.00 | 21.00 |
| P retained in fish (kg/t)—Pp | 4.09 | 4.09 | 4.09 | 4.09 | 4.09 |
| P released into the water (kg/t)—Pa | 14.83 | 14.83 | 14.83 | 14.83 | 14.83 |
| New maximum fish production (t/year)—2.1% P 21 °C | 17,754.40 | 15,388.90 | 14,209.62 | 17,797.61 | 7563.92 |
| Feed with 2.1% P and water temperature of 25 °C | Scenario 41 | Scenario 42 | Scenario 43 | Scenario 44 | Scenario 45 |
| Water temperature (°C) | 25 | 25 | 25 | 25 | 25 |
| P feed (kg/t)—Pr (2.1% P—total) | 21.00 | 21.00 | 21.00 | 21.00 | 21.00 |
| P retained in fish (kg/t)—Pp | 5.00 | 5.00 | 5.00 | 5.00 | 5.00 |
| P released into the water (kg/t)—Pa | 20.58 | 20.58 | 20.58 | 20.58 | 20.58 |
| New maximum fish production (t/year)—2.1% P 25 °C | 12,791.53 | 11,087.26 | 10,237.62 | 12,822.66 | 5449.58 |
| Feed with 2.1% P and water temperature of 29 °C | Scenario 46 | Scenario 47 | Scenario 48 | Scenario 49 | Scenario 50 |
| Water temperature (°C) | 29 | 29 | 29 | 29 | 29 |
| P feed (kg/t)—Pr (2.1% P—total) | 21.00 | 21.00 | 21.00 | 21.00 | 21.00 |
| P retained in fish (kg/t)—Pp | 5.00 | 5.00 | 5.00 | 5.00 | 5.00 |
| P released into the water (kg/t)—Pa | 20.54 | 20.54 | 20.54 | 20.54 | 20.54 |
| New maximum fish production (t/year)—2.1% P 29 °C | 12,816.32 | 11,108.74 | 10,257.46 | 12,847.51 | 5460.15 |
Water level categories are indicated by the colors of the letters and numbers: Maximum Operational Level (green), Medium Operational Level (yellow), and Minimum Operational Level (red). A.R. = Accumulation Reservoir. Scenarios with the real situation of the studied aquaculture area. * In the Medium Operational Level scenario (SIPOT Standard), the values of quotas and flows correspond to the average of historical data from the UHE Chavantes from 2010 to 2021, provided by the Brazilian National Interconnected System (SIN)—ONS. In the Maximum and Minimum Operational Level scenarios (UHE Chavantes—Fartura), the values of quotas and flows were taken from the work of Nogueira et al. [29] corresponding to the specific region of Fartura, SP (approximately 25 km from the aquaculture enterprise evaluated in this study). ** In the Operational Medium Level scenario (SIPOT Standard), the area and volume values correspond to the average value of UHE Chavantes as presented in the ANA metadata catalog [38] (Elevation vs. Area vs. Volume curves revised in 2016, p. 29). In the Maximum and Minimum Operational Level scenarios (UHG Chavantes—Fartura), the area and volume values correspond to the respective quotas as presented in the Technical Report [38] (Elevation vs. Area vs. Volume curves revised in 2016, p. 56 and 67). *** Lr = Eq. 11 [36]. **** R = Eq. 08 [39]. ***** Pr: common market values. Pp: [48].
References
- Chen, Y.; Li, S.; Liu, H.; Tao, P.; Chen, Y. Application of Intelligent Technology in Animal Husbandry and Aquaculture Industry. In Proceedings of the 14th International Conference on Computer Science & Education (ICCSE 2019), Toronto, ON, Canada, 22–24 August 2019; IEEE: New York, NY, USA, 2019; pp. 335–339. [Google Scholar] [CrossRef]
- Bueno, G.W.; Bureau, D.; Skipper-Horton, J.O.; Roubach, R.; Mattos, F.T.; Bernal, F.E.M. Mathematical Modeling for the Management of the Carrying Capacity of Aquaculture Enterprises in Lakes and Reservoirs. Pesqui. Agropecu. Bras. 2017, 52, 695–706. [Google Scholar] [CrossRef]
- Valenti, W.C.; Barros, H.P.; Moraes-Valenti, P.; Bueno, G.W.; Cavalli, R.O. Aquaculture in Brazil: Past, Present and Future. Aquac. Rep. 2021, 19, 100611. [Google Scholar] [CrossRef]
- FAO. The State of World Fisheries and Aquaculture 2024—Blue Transformation in Action; FAO: Rome, Italy, 2024. [Google Scholar] [CrossRef]
- Verdegem, M.C. Nutrient Discharge from Aquaculture Operations in Function of System Design and Production Environment. Rev. Aquac. 2013, 5, 158–171. [Google Scholar] [CrossRef]
- Herath, S.; Satoh, S. Environmental Impact of Phosphorus and Nitrogen from Aquaculture. In Feed and Feeding Practices in Aquaculture, 1st ed.; Davis, D.A., Ed.; Woodhead Publishing: Cambridge, UK, 2015; pp. 369–386. [Google Scholar] [CrossRef]
- Streicher, M.D.; Reiss, H.; Reiss, K. Impact of Aquaculture and Agriculture Nutrient Sources on Macroalgae in a Bioassay Study. Mar. Pollut. Bull. 2021, 173, 113025. [Google Scholar] [CrossRef]
- Baccarin, A.E.; Camargo, A.F.M. Characterization and Evaluation of the Impact of Feed Management on the Effluents of Nile Tilapia (Oreochromis niloticus) Culture. Braz. Arch. Biol. Technol. 2005, 48, 81–90. [Google Scholar] [CrossRef]
- Sugiura, S.H.; Marchant, D.D.; Kelsey, K.; Wiggins, T.; Ferraris, R.P. Effluent Profile of Commercially Used Low-Phosphorus Fish Feeds. Environ. Pollut. 2006, 140, 95–101. [Google Scholar] [CrossRef]
- David, F.S.; Proença, D.C.; Valenti, W.C. Phosphorus Budget in Integrated Multitrophic Aquaculture Systems with Nile Tilapia, Oreochromis niloticus, and Amazon River Prawn, Macrobrachium amazonicum. J. World Aquac. Soc. 2017, 48, 402–414. [Google Scholar] [CrossRef]
- Huang, Y.; Ciais, P.; Goll, D.S.; Sardans, J.; Peñuelas, J.; Cresto-Aleina, F.; Zhang, H. The Shift of Phosphorus Transfers in Global Fisheries and Aquaculture. Nat. Commun. 2020, 11, 355. [Google Scholar] [CrossRef]
- Hooda, V.; Gupta, S.; Chundawat, T.S.; Lather, A.S. From Nutrient to Nuisance: The Impact of Phosphorus on Aquatic Ecosystem Health. In Futuristic Trends in Chemical, Material Science and Nanotechnology; IIP Series; IIP Publisher: Haryana, India, 2024; Volume 3, pp. 177–202. [Google Scholar]
- Falconer, L.; Ozretich, R.; Ekpeki, A.; Telfer, T. Carrying Capacity and Production Models for Aquaculture within Freshwater Lake Systems in Europe. In EU H2020 TAPAS Project; Deliverable 5.6 Report; European Union: Brussels, Belgium, 2019; 21p, Available online: https://ec.europa.eu/research/participants/documents/downloadPublic?appId=PPGMS&documentIds=080166e5c1f34e72 (accessed on 14 April 2025).
- Bohnes, F.A.; Laurent, A. Environmental Impacts of Existing and Future Aquaculture Production: Comparison of Technologies and Feed Options in Singapore. Aquaculture 2021, 532, 736001. [Google Scholar] [CrossRef]
- Matta, E.; Koch, H.; Selge, F.; Simshäuser, M.N.; Rossiter, K.; Silva, G.M.N.; Gunkel, G.; Hinkelmann, R. Modeling the Impacts of Climate Extremes and Multiple Water Uses to Support Water Management in the Icó-Mandantes Bay, Northeast Brazil. J. Water Clim. Chang. 2019, 10, 893–906. [Google Scholar] [CrossRef]
- D’Abramo, L.R.; Slater, M.J. Climate Change: Response and Role of Aquaculture. J. World Aquac. Soc. 2019, 50, 710–714. [Google Scholar] [CrossRef]
- Xie, S.; Cui, Y.; Yang, Y.; Liu, J. Energy Budget of Nile Tilapia, Oreochromis niloticus, in Relation to Ration Size. Aquaculture 1997, 154, 57–68. [Google Scholar] [CrossRef]
- Glencross, B.D. A Factorial Growth and Feed Utilization Model for Barramundi, Lates calcarifer, Based on Australian Production Conditions. Aquac. Nutr. 2008, 14, 360–373. [Google Scholar] [CrossRef]
- Trung, D.V.; Diu, N.T.; Hao, N.T.; Glencross, B. Development of Nutritional Model to Define the Energy and Protein Requirements of Tilapia, Oreochromis niloticus. Aquaculture 2011, 463, 193–200. [Google Scholar] [CrossRef]
- Bueno, G.W.; Bernal, F.; Roubach, R.; Skipper-Horton, J.; Sampaio, F.; Fialho, N.; Bureau, D. Modeling of waste outputs in the aquatic environment from a commercial cage farm under neotropical climate conditions. Aquac. Environ. Interact. 2023, 15, 133–144. [Google Scholar] [CrossRef]
- Nobile, A.B.; Cunico, A.M.; Vitule, J.R.S.; Queiroz, J.; Vidotto-Magnoni, A.P.; Garcia, D.A.Z.; Orsi, M.L.; Lima, F.P.; Acosta, A.A.; da Silva, R.J.; et al. Status and Recommendations for Sustainable Freshwater Aquaculture in Brazil. Rev. Aquac. 2020, 12, 1495–1517. [Google Scholar] [CrossRef]
- Ferreira, J.G.; Hawkins, A.J.S.; Monteiro, P.; Moore, H.; Service, M.; Pascoe, P.L.; Ramos, L.; Sequeira, A. Integrated Assessment of Ecosystem-Scale Carrying Capacity in Shellfish Growing Areas. Aquaculture 2008, 275, 138–151. [Google Scholar] [CrossRef]
- Weitzman, J.; Filgueira, R. The Evolution and Application of Carrying Capacity in Aquaculture: Towards a Research Agenda. Rev. Aquac. 2019, 12, 1297–1322. [Google Scholar] [CrossRef]
- Lopes, J.E.G.; Santos, R.C.P. Reservoir Capacity. Lecture notes, University of São Paulo, São Paulo, Brazil, 2002. Available online: http://www.ler.esalq.usp.br/disciplinas/Fernando/leb1440/Aula%206/Capacidade%20de%20Reservatorios.pdf (accessed on 14 April 2025).
- Ferreira, J.G.; Grant, J.; Verner-Jefferys, D.W.; Taylor, N.G. Modelling Frameworks for Determination of Carrying Capacity for Aquaculture. In Sustainable Food Production; Christou, P., Savin, R., Costa-Pierce, B., Misztal, I., Whitelaw, B., Eds.; Springer: New York, NY, USA, 2013; pp. 986–1049. [Google Scholar] [CrossRef]
- Fitzsimmons, K. Future Trends of Tilapia Aquaculture in the Americas. In Tilapia Aquaculture in the Americas; Costa-Pierce, B.A., Rakocy, J.E., Eds.; World Aquaculture Society: Baton Rouge, LA, USA, 2000; Volume 2, pp. 252–264. [Google Scholar]
- Sampaio, F.G.; Araújo, C.A.S.; Dallago, B.S.L.; Stech, J.L.; Lorenzzetti, J.A.; Alcântara, E.; Losekann, M.E.; Marin, D.B.; Leão, J.A.D.; Bueno, G.W. Unveiling Low-to-High-Frequency Data Sampling Caveats for Aquaculture Environmental Monitoring and Management. Aquac. Rep. 2021, 20, 100764. [Google Scholar] [CrossRef]
- Soares, M.C.S.; Marinho, M.M.; Huszar, V.L.M.; Branco, C.W.C.; Azevedo, S.M.F.O. The Effects of Water Retention Time and Watershed Features on the Limnology of Two Tropical Reservoirs in Brazil. Lakes Reserv. Res. Manag. 2008, 13, 257–269. [Google Scholar] [CrossRef]
- Nogueira, M.G.; Neves, G.P.; Naliato, D.A.O. Limnology of Two Contrasting Hydroelectric Reservoirs (Storage and Run-of-River) in Southeast Brazil. In Hydropower—Practice and Application; Samadi-Boroujeni, H., Ed.; InTech: Rijeka, Croatia, 2012. [Google Scholar] [CrossRef]
- Fialho, N.S.; Valenti, W.C.; David, F.S.; Godoy, E.M.; Proença, D.C.; Roubach, R.; Bueno, G.W. Environmental Sustainability of Nile Tilapia Net-Cage Culture in a Neotropical Region. Ecol. Indic. 2021, 129, 108008. [Google Scholar] [CrossRef]
- APHA. Standard Methods for the Examination of Water and Wastewater, 23rd ed.; American Public Health Association: Washington, DC, USA; American Water Works Association: Washington, DC, USA; Water Environment Federation: Washington, DC, USA, 2017. [Google Scholar]
- Iwama, G.K.; Tautz, A.F. A Simple Growth Model for Salmonids in Hatcheries. Can. J. Fish. Aquat. Sci. 1981, 38, 649–656. [Google Scholar] [CrossRef]
- Cho, C.Y.; Bureau, D.P. Development of Bioenergetic Models and the Fish-PrFEQ Software to Estimate Production, Feeding Ration and Waste Output in Aquaculture. Aquat. Living Resour. 1998, 11, 199–210. [Google Scholar] [CrossRef]
- Dumas, A.; France, J.; Bureau, D.P. Modelling Growth and Body Composition in Fish Nutrition: Where Have We Been and Where Are We Going? Aquac. Res. 2010, 41, 161–181. [Google Scholar] [CrossRef]
- Chowdhury, M.A.K.; Siddiqui, S.; Hua, K.; Bureau, D.P. Bioenergetics-Based Factorial Model to Determine Feed Requirement and Waste Output of Tilapia Produced under Commercial Conditions. Aquaculture 2013, 410–411, 138–147. [Google Scholar] [CrossRef]
- Dillon, P.J.; Rigler, F.H. A Test of a Simple Nutrient Budget Model Predicting the Phosphorus Concentration in Lake Water. J. Fish. Res. Board Can. 1974, 31, 1771–1778. [Google Scholar] [CrossRef]
- Beveridge, M.C.M. The Environmental Impact of Freshwater Cage and Pen Fish Farming and the Use of Simple Models to Predict Carrying Capacity; FAO Fisheries Technical Paper 255; FAO: Rome, Italy, 1984. [Google Scholar]
- Agência Nacional de Águas e Saneamento Básico (ANA). Catálogo de Metadados da ANA: Relatório Técnico de Atualização das Curvas Cota x Área x Volume da UHE de Chavantes; Agência Nacional de Águas e Saneamento Básico (ANA): Brasília, Brazil, 2019; 115p. Available online: https://metadados.snirh.gov.br/geonetwork/srv/api/records/b8f0487a-df73-4f8d-8b22-bb49cf9f3683 (accessed on 14 April 2025).
- Straškraba, M. Lake and Reservoir Management. Int. Ver. Theor. Angew. Limnol. Verh. 1996, 26, 193–209. [Google Scholar] [CrossRef]
- Conselho Nacional do Meio Ambiente (CONAMA). Resolução CONAMA nº 357, de 17 de Março de 2005—Dispõe Sobre a Classificação dos Corpos de Água e Diretrizes Ambientais Para o Seu Enquadramento, Bem Como Estabelece As Condições e Padrões de Lançamento de Efluentes. Available online: https://conama.mma.gov.br/?option=com_sisconama&task=arquivo.download&id=450 (accessed on 14 April 2025).
- Agência Nacional de Águas e Saneamento Básico (ANA). Nota Técnica n.009/2009/GEOUT/SOF-ANA: Atualização na Metodologia de Análise de Pedidos de Outorga para Piscicultura em Tanques-Rede; ANA: Brasília, Brazil, 2009; 3p.
- Carlson, R.E. A Trophic State Index for Lakes. Limnol. Oceanogr. 1977, 22, 361–369. [Google Scholar] [CrossRef]
- Kratzer, C.R.; Brezonik, P.L. Carlson-Type Trophic State Index for Nitrogen in Florida Lakes. Water Resour. Bull. 1981, 17, 713–715. [Google Scholar] [CrossRef]
- Gentle, J.E. Random Number Generation and Monte Carlo Methods; Springer: New York, NY, USA, 1998. [Google Scholar]
- Vose, D. Risk Analysis: A Quantitative Guide, 3rd ed.; John Wiley & Sons: New York, NY, USA, 2008. [Google Scholar]
- Sampaio, F.G.; Silva, C.M.; Mignani, L.; Packer, A.P.; Manzatto, C.V. (Eds.) Monitoramento Ambiental da Aquicultura em Águas da União: Subsídios para a Proposição de um Plano Nacional; Embrapa Meio Ambiente: Brasília, Brazil, 2019. [Google Scholar]
- Montanhini Neto, R.; Ostrensky, A. Evaluation of Commercial Feeds Intended for the Brazilian Production of Nile Tilapia (Oreochromis niloticus L.): Nutritional and Environmental Implications. Aquacult. Nutr. 2014, 21, 311–320. [Google Scholar] [CrossRef]
- Dantas, M.C.; Attayde, J.L. Nitrogen and Phosphorus Content of Some Temperate and Tropical Freshwater Fishes. J. Fish Biol. 2007, 70, 100–108. [Google Scholar] [CrossRef]
- Ministério da Agricultura, Pecuária e Abastecimento (MAPA). Boletim da Aquicultura em Águas da União 2021—Annual Production Report (RAP); MAPA: Brasília, Brazil, 2022; 95p. Available online: https://www.gov.br/mpa/pt-br/assuntos/aquicultura/boletimaquiculturaemguasdaunio2021final_compressed.pdf (accessed on 14 April 2025).
- Köppen, W. Das Geographische System der Klimate. In Handbuch der Klimatologie; Köppen, W., Geiger, G., Eds.; Gebrüder Borntraeger: Berlin, Germany, 1936; Volume 1, pp. 1–44. Available online: https://koeppen-geiger.vu-wien.ac.at/pdf/Koppen_1936.pdf (accessed on 14 April 2025).
- Moura, R.S.T.; Valenti, W.C.; Henry-Silva, G.G. Sustainability of Nile Tilapia Net-Cage Culture in a Reservoir in a Semi-Arid Region. Ecol. Indic. 2016, 66, 574–582. [Google Scholar] [CrossRef]
- Alves, R.C.P.; Baccarin, A.L. Effects of Fish Farming in Net Cages on the Sedimentation of Suspended Matter and Nutrients. In Reservoir Ecology: Potential Impacts, Management Actions and Cascade Systems; Nogueira, M.G., Henry, R., Jorcin, A., Eds.; Rima: São Carlos, Brazil, 2005; pp. 329–348. [Google Scholar]
- Montanhini Neto, R.; Nocko, H.R.; Ostrensky, A. Carrying Capacity and Potential Environmental Impact of Fish Farming in the Cascade Reservoirs of the Paranapanema River, Brazil. Aquac. Res. 2017, 48, 3433–3449. [Google Scholar] [CrossRef]
- Rosanova, C.; Pinho, E.S.; Matos, F.T.; Akama, A.; Bueno, G.W.; Macedo, D.B. Monitoring Aquaculture in Continental Reservoirs Using the Trophic State Index; Embrapa Pesca e Aquicultura: Palmas, TO, Brazil, 2019. [Google Scholar]
- Boyd, C.E.; Tucker, C.S. Pond Aquaculture Water Quality Management; Kluwer Academic Publishers: Boston, MA, USA, 1998; 700p. [Google Scholar] [CrossRef]
- Sifa, L.; Chenhong, L.; Dey, M.; Gagalac, F.; Dunham, R. Cold tolerance of three strains of Nile tilapia, Oreochromis niloticus, in China. Aquaculture 2002, 213, 123–129. [Google Scholar] [CrossRef]
- Brande, M.R. Modelagem Financeira e Risco Econômico da Produção Comercial de Tilápia (Oreochromis niloticus) em Lagos e Reservatórios Tropicais. Master’s Thesis, Centro de Aquicultura da Universidade Estadual Paulista, Jaboticabal, Brazil, 2019. [Google Scholar]
- Calixto, E.S.; Santos, D.F.B.; Lange, D.; Galdiano, M.S.; Rahman, I.U. Aquaculture in Brazil and Worldwide: Overview and Perspectives. J. Environ. Anal. Prog. 2020, 5, 98–107. [Google Scholar] [CrossRef]
- Moraes, C.R.F.; Attayde, J.L.; Henry-Silva, G.G. Stable Isotopes of C and N as Dietary Indicators of Nile Tilapia (Oreochromis niloticus) Cultivated in Net Cages in a Tropical Reservoir. Aquac. Rep. 2020, 18, 100458. [Google Scholar] [CrossRef]
- Boscolo, W.R.; Feiden, A.; Bombardelli, R.A.; Signor, A.; Gentelini, A.L.; Souza, B.E. Phosphorus requirements for Nile tilapia (Oreochromis niloticus) fingerlings. Acta Sci. Anim. Sci. 2005, 27, 87–91. [Google Scholar] [CrossRef][Green Version]
- Miranda, E.C.; Pezatto, C.A.; Pezzato, L.E.; Furuya, W.M. Apparent phosphorus availability in feed ingredients for Nile tilapia (Oreochromis niloticus). Acta Sci. Anim. Sci. 2008, 22, 669–675. [Google Scholar] [CrossRef]
- Furuya, W.M.; Pezzato, L.E.; Barros, M.M.; Boscolo, W.R.; Cyrino, J.E.P.; Furuya, V.R.B.; Feiden, A. Brazilian Tables for Nile Tilapia Nutrition; GFM: Toledo, PR, Brazil, 2010; 100p. [Google Scholar]
- National Research Council (NRC). Nutrient Requirements of Fish and Shrimp; National Academy Press: Washington, DC, USA, 2011; 392p. [CrossRef]
- Hardy, R.W. Collaborative Opportunities Between Fish Nutrition and Other Disciplines in Aquaculture: An Overview. Aquaculture 1999, 177, 217–230. [Google Scholar] [CrossRef]
- Bueno, G.W.; Feiden, A.; Neu, D.H.; Lui, T.A.; Wächter, N.; Boscolo, W.R. Digestibility of phosphorus in feed as a nutritional strategy for reduce of effluents from tilapia culture. Arq. Bras. Med. Vet. Zootec. 2012, 64, 183–191. [Google Scholar] [CrossRef]
- Bueno, G.W.; Mattos, B.O.; Neu, D.H.; David, F.S.; Feiden, A.; Boscolo, W.R. Stability and Phosphorus Leaching of Tilapia Feed in Water. Ciênc. Rural 2019, 49, 1–8. [Google Scholar] [CrossRef]
- Nobile, A.B.; Zanatta, A.S.; Brandão, H.; Zica, E.O.; Lima, F.P.; Freitas-Souza, D.; Carvalho, E.D.; Silva, R.J.; Ramos, I.P. Cage Fish Farm Acts as a Source of Changes in the Fish Community of a Neotropical Reservoir. Aquaculture 2018, 495, 780–785. [Google Scholar] [CrossRef]
- Brandão, H.; Lange, D.; Blanco, D.R.; Ramos, I.P.; Sousa, J.Q.D.; Nobile, A.B.; Carvalho, E.D. Fish-food interaction network around cage fish farming in a neotropical reservoir. Acta Limnol. Bras. 2021, 33, e18. [Google Scholar] [CrossRef]
- Houlihan, D.; Boujard, T.; Jobling, M. Food Intake in Fish; Blackwell Science: Oxford, UK, 2001; 440p. [Google Scholar] [CrossRef]
- Boyd, C.E.; Tucker, C.; McNevin, A.; Bostick, K.; Clay, J. Indicators of Resource Use Efficiency and Environmental Performance in Fish and Crustacean Aquaculture. Rev. Fish. Sci. 2007, 15, 327–360. [Google Scholar] [CrossRef]
- Osti, J.A.S.; Moraes, M.A.B.; Carmo, C.F.; Mercante, C.T.J. Nitrogen and Phosphorus Flux from the Production of Nile Tilapia through the Application of Environmental Indicators. Braz. J. Biol. 2017, 78, 25–31. [Google Scholar] [CrossRef]
- Hardy, R.W.; Gatlin, D. Nutritional strategies to reduce nutrient losses in intensive aquaculture. In Avances en Nutrición Acuícola VI. Memorias del VI Simposium Internacional de Nutrición Acuícola, Cancún, Quintana Roo, México, 3–6 September 2002; Cruz-Suárez, L.E., Ricque-Marie, D., Tapia Salazar, M., Gaxiola-Cortés, M.G., Simoes, N., Eds.; Universidad Autónoma de Nuevo León: Monterrey, Mexico, 2002; pp. 105–125. [Google Scholar]
- Wang, X.; Olsen, L.M.; Reitan, K.I.; Olsen, Y. Discharge of Nutrient Wastes from Salmon Farms: Environmental Effects, and Potential for Integrated Multi-Trophic Aquaculture. Aquac. Environ. Interact. 2012, 2, 267–283. [Google Scholar] [CrossRef]
- David, G.S.; Carvalho, E.D.D.; Lemos, D.; Silveira, A.N.; Dall’Aglio-Sobrinho, M. Ecological Carrying Capacity for Intensive Tilapia (Oreochromis niloticus) Cage Aquaculture in a Large Hydroelectrical Reservoir in Southeastern Brazil. Aquac. Eng. 2015, 66, 30–40. [Google Scholar] [CrossRef]
- Boyd, C.E.; Teichert-Coddington, D. Dry Matter, Ash, and Elemental Composition of Pond-Cultured Penaeus vannamei and P. stylirostris. J. World Aquacult. Soc. 1995, 26, 88–92. [Google Scholar] [CrossRef]
- Lefrançois, P.; Légaré, B.; Légaré, S.; Vézina, A. Minimizing Phosphorus Discharge from Aquaculture Earth Ponds by a Novel Sediment Retention System. Aquac. Eng. 2010, 43, 94–100. [Google Scholar] [CrossRef]
- De Silva, S.S.; Ingram, B.A.; Nguyen, P.T.; Bui, T.M.; Gooley, G.J.; Turchini, G.M. Estimation of Nitrogen and Phosphorus in Effluent from the Striped Catfish Farming Sector in the Mekong Delta, Vietnam. Ambio 2010, 39, 504–514. [Google Scholar] [CrossRef]
- Lewandowski, V.; Bridi, V.R.C.; Bittencourt, F.; Signor, A.; Boscolo, W.R.; Feiden, A. Spatial and Temporal Limnological Changes of an Aquaculture Area in a Neotropical Reservoir. Ann. Limnol. Int. J. Limnol. 2018, 54, 27. [Google Scholar] [CrossRef]
- Bureau, D.; Hua, K.; Cho, C.Y. Effect of Feeding Level on Growth and Nutrient Deposition in Rainbow Trout (Oncorhynchus mykiss Walbaum) Growing from 150 to 600 g. Aquac. Res. 2006, 37, 1090–1098. [Google Scholar] [CrossRef]
- Dumas, A.; Fraser, K.P.P.; Higgs, D.A.; Beaulieu, L.; Bureau, D.P. Evidence of Three Growth Stanzas in Rainbow Trout (Oncorhynchus mykiss) and Atlantic Salmon (Salmo salar) Using Factorial and Multivariate Approaches. Aquaculture 2007, 267, 139–150. [Google Scholar] [CrossRef]
- Jobling, M. Bioenergetics in Aquaculture Settings. In Encyclopedia of Fish Physiology: From Genome to Environment; Farrell, A.P., Ed.; Elsevier: Amsterdam, The Netherlands, 2011; pp. 1664–1674. [Google Scholar] [CrossRef]
- Correia, M.F.; Dias, M.A.F.S. Variation in the Sobradinho Reservoir Level and Its Impact on the Regional Climate. Rev. Bras. Recur. Hídricos 2003, 8, 157–168. [Google Scholar] [CrossRef]
- Nogueira, M.G.; Henry, R.; Maricatto, F.E. Spatial and Temporal Heterogeneity in the Jurumirim Reservoir, São Paulo, Brazil. Lakes Reserv. Res. Manag. 1999, 4, 107–120. [Google Scholar] [CrossRef]
- Pomari, J. Effects of Cage Tilapia Farming on the Zooplankton Assemblages in the Chavantes Reservoir, Paranapanema River (SP/PR). Master’s Thesis, State University of Londrina, Londrina, Brazil, 2010. [Google Scholar]
- Ayroza, D.M.M.R. Limnological Characteristics in Areas under the Influence of Cage Fish Farming in the UHE Chavantes Reservoir, Paranapanema River, Southeastern/Southern Brazil. Ph.D. Thesis, São Paulo State University (UNESP), Jaboticabal, Brazil, 2012. [Google Scholar]
Disclaimer/Publisher’s Note: The statements, opinions and data contained in all publications are solely those of the individual author(s) and contributor(s) and not of MDPI and/or the editor(s). MDPI and/or the editor(s) disclaim responsibility for any injury to people or property resulting from any ideas, methods, instructions or products referred to in the content. |
© 2025 by the authors. Licensee MDPI, Basel, Switzerland. This article is an open access article distributed under the terms and conditions of the Creative Commons Attribution (CC BY) license (https://creativecommons.org/licenses/by/4.0/).