Abstract
Environmental information disclosure, a key tool in modern environmental governance, drives green technology innovation and sustainable development. In this study, we examined how air information disclosure, induced by the issuance of China’s Ambient Air Quality Standards (AAQSs), drives urban sustainable development (USD) through environmental information disclosure. Using a multi-period difference-in-differences model and panel data from 278 cities (2005–2022), we analyzed causal effects, mechanisms, and urban heterogeneity. The findings offer insights for leveraging disclosure to advance urban sustainability. The results showed that AAQSs’ implementation significantly increases USD. Mechanism analysis revealed two mediating pathways: stimulating green technological innovation and enhancing governmental environmental concern. Climate policy uncertainty positively moderates this relationship. Heterogeneity analysis revealed stronger impacts in non-provincial capital cities, non-resource-dependent cities, and regions with weaker sustainable development foundations. The findings provide empirical evidence for leveraging information disclosure to promote green transitions and strengthen environmental concerns.
1. Introduction
The formal conceptualization of sustainable development dates back to the 1987 report “Our Common Future” by the United Nations World Commission on Environment and Development, which defined it as “development that meets the needs of the present without compromising the ability of future generations to meet their own needs” [1]. This paradigm-shifting concept was further operationalized through the 2030 Agenda for Sustainable Development adopted by the United Nations in 2015, which established an actionable framework comprising 17 Sustainable Development Goals (SDGs). These goals encompass critical domains, including poverty alleviation, clean energy transition, climate governance, and gender equality, marking a significant advancement toward quantifiable global sustainability assessments. Environmental governance constitutes a pivotal element in achieving high-quality development and implementing the UN 2030 Agenda. It demonstrates particularly strong synergies with SDG11 (Sustainable Cities and Communities), SDG13 (Climate Action), and SDG15 (Life on Land). Amidst advancing industrialization and urbanization, urban environmental pollution has emerged as a critical constraint on economic transformation and social progress. The escalating health risks to urban populations (SDG3) further underscore the urgency of effective environmental governance [2]. To achieve coordinated development across economic, social, and environmental dimensions while modernizing governance systems, environmental information disclosure (EID) has evolved into a crucial regulatory instrument. This practice aligns with SDG principles of transparent governance and public participation and has been increasingly adopted to optimize governance frameworks and enhance environmental management efficacy [3]. Within this context, the Chinese government has prioritized the synergistic advancement of environmental governance and sustainable development, continuously innovating regional environmental governance mechanisms through policy design. A landmark initiative emerged in 2012 through the joint issuance and implementation of the Ambient Air Quality Standards (AAQS) by the Ministry of Ecology and Environment and the General Administration of Quality Supervision, Inspection, and Quarantine. This regulatory framework marked a milestone transition into systematic, standardized, regionally collaborative governance for EID in China. The AAQS framework operationalizes its core objectives through a dynamic monitoring system tracking critical pollutants, including PM2.5, CO, and NO2. This system not only substantially enhanced regional environmental transparency and governmental accountability but also established actionable guidelines for Chinese cities to advance SDG11 targets—specifically, “reducing per capita environmental impact” and “developing inclusive, safe, resilient, and sustainable cities”. Furthermore, the data-sharing mechanisms embedded in AAQS provide practical models for fulfilling SDG17’s mandate to “strengthen global partnerships for sustainable development”, thereby enabling cross-regional knowledge transfer and coordinated climate governance.
Existing studies have evaluated the impacts of EID from economic, environmental, and social dimensions. Specifically, in terms of economic effects, EID can promote urban economic development, enhance total-factor energy efficiency and green innovation [4], and drive low-carbon economic transitions [5]. Regarding environmental effects, EID significantly improves ecological conditions through mechanisms such as pollution emission constraints [6] and pressures for cleaner production within firms [7]. From the perspective of social effects, EID has reshaped the paradigm of government–public collaborative governance [8] and catalyzed a shift toward greener social behaviors [9]. However, the existing literature predominantly focuses on the singular effects of EID and often overlooks a consideration of cities as complex development systems. Consequently, there is a lack of systematic evaluations of urban sustainability and an insufficient identification of the underlying mechanisms.
In response to these omissions, this study utilizes panel data from 278 prefecture-level and higher cities in China spanning 2005 to 2022 to examine the impact of EID on urban sustainable development. Specifically, it constructs a comprehensive sustainable development indicator system encompassing economic, environmental, and social dimensions, measuring urban sustainability via the entropy method. Leveraging the implementation of the AAQSs as a quasi-natural experiment, this study investigates the causal effects of EID as a “soft” environmental regulatory tool on urban sustainability. Despite the growing interest in environmental information policies, key questions remain unclear: How does EID affect the sustainability of cities through its multi-dimensional components, and are there possible potential paths and differences in the impact of EID on different types of cities? The findings provide empirical evidence supporting the formulation of scientific and refined environmental governance policies in developing countries and advance the achievement of urban sustainability goals. The marginal contributions of this study are encompassed within the following three aspects: ① Research Perspective: This study constructed a theoretical framework of “EID → (Green Innovation and Governmental Environmental Concern) → Sustainable Cities”, systematically revealing the mechanisms through which EID influences urban sustainability. By incorporating climate policy uncertainty (CPU) as a moderating factor into the framework, this study enhances understanding of the intrinsic relationship between environmental concern and sustainable urban development. This work enriches the knowledge of the sustainable development effects of environmental information policies and extends the theoretical boundaries of environmental policy research. ② Research Content: Based on the “Triple Bottom Line” principle, this study identified the average treatment effects of EID on urban sustainability across economic, environmental, and social dimensions. It further delineated the heterogeneous characteristics of these effects along factors such as city size and resource endowment. In addition, it thoroughly examined the mediating roles of green innovation and government environmental concern in the relationship between EID and urban sustainability, as well as how CPU moderates these processes. This study fills the gap in meso-level research on the nexus between environmental information policies and urban sustainable development (USD) and uncovers the diversified causal relationships between the two. ③ Research Methods: In measuring urban sustainability using the entropy method, this study integrated multiple key indicators, including green economic growth, air quality improvement, and social welfare development, ensuring that the measurement results are comprehensive, objective, and accurately reflect the differentiated characteristics of urban sustainability across various stages of AAQSs implementation. To address potential endogeneity concerns, this study employed a staggered difference-in-differences (DID) approach to estimate the long-term effects of EID, overcoming the limitations of traditional DID methods under non-synchronous policy shocks. Furthermore, the credibility of the baseline findings was validated through a series of robustness checks, including placebo tests and heterogeneous treatment DID tests.
The remainder of this paper is organized as follows: Section 2 reviews the relevant literature. Section 3 elaborates on the theoretical mechanisms and research hypotheses. Section 4 presents the model design, variable selection, and data description. Section 5 reports the baseline regression results, robustness checks, heterogeneity analysis, and mechanism tests, and the final section concludes with key findings, policy implications, and future research directions.
2. A Literature Review
2.1. Research on Environmental Information Policy and Its Influence Mechanism
Environmental policy instruments constitute a set of regulatory, economic, and strategic tools employed by governmental or international bodies to mitigate environmental degradation and promote sustainability.
Command-and-control instruments are grounded in governmental authority and employ mandatory measures—such as laws, standards, and regulatory directives—to directly control polluting activities [10]. Characterized by strong enforcement, clarity, and uniformity, these instruments are particularly effective in sectors with well-defined pollution sources and available technological solutions (e.g., industrial wastewater treatment) or in cases requiring rapid intervention to mitigate acute environmental risks [11,12]. However, their rigidity often limits flexibility and innovation incentives. In contrast, market-based instruments involve lower levels of direct government intervention. They utilize economic mechanisms—such as taxes, subsidies, and emissions trading schemes—to incentivize voluntary pollution reduction by firms and individuals [10,13]. These instruments are valued for their flexibility and cost-effectiveness but require well-developed market institutions and regulatory infrastructures to function effectively. They are typically utilized to achieve long-term emission reduction targets or to foster technological innovation [14]. Voluntary instruments involve minimal direct government intervention. They aim to improve environmental performance through tools such as environmental information disclosure (EID), public participation, and voluntary agreements, relying on social norms, peer pressure, and moral persuasion [15]. While low in administrative burden, their effectiveness varies with levels of public engagement and the strength of societal expectations.
From the perspective of policy instrument attributes, EID is classified as a voluntary policy instrument. The academic community has extensively explored the conceptual foundations, classifications, and combined applications of environmental policy instruments with the aim of enhancing both their theoretical understanding and practical implementation. In this context, the present paper focuses on reviewing the literature related to environmental information policies, particularly their mechanisms and impacts.
2.1.1. Research on Environmental Information Policy
In environmental governance practice, a single type of environmental policy instrument is often insufficient to address the complex and diverse demands of governance. Therefore, regions typically adopt a combination of multiple policy tools based on their specific circumstances to achieve more effective environmental outcomes. Scholars have also extensively explored the application and effects of various policy instruments.
In the European Union, the selection of environmental policy instruments has shown a trend toward diversification. Roelfsema et al. (2020) found that regulatory tools are predominantly used for air pollution control, while market-based and voluntary instruments are more prevalent in energy management [16]. Caputo et al. (2021) further noted that although regulatory instruments dominated the early stages, the adoption of market-based and voluntary measures—particularly EID—has grown steadily, contributing significantly to the green transformation of production technologies [17]. In the Americas, the US federal government has employed a mix of regulatory, market-based, and voluntary instruments to tackle a variety of environmental challenges. For example, Currie et al. (2023) noted that the Clean Air Act primarily relies on regulatory tools but has progressively incorporated market-based instruments, such as emissions trading systems, to enhance policy flexibility and efficiency [18]. Similarly, Lessmann and Krame (2024) reported that California’s amendments to its emissions trading program, notably the establishment of a cap-and-trade system, have effectively reduced industrial emissions and offer valuable lessons for other jurisdictions [19].
In Asia, Xie et al. (2021) compared environmental policy instrument use across China, Japan, and South Korea, finding that South Korea favors market-based approaches, while China and Japan predominantly rely on regulatory tools [20]. China’s environmental governance has evolved from a primary dependence on regulatory instruments toward a more diversified policy mix. Facing escalating environmental challenges, the Chinese government has increasingly emphasized market-based and voluntary instruments. Zhang et al. (2022) noted that policymakers recognized the limitations of solely relying on regulations and have thus expanded the adoption of market incentives and voluntary measures to better address governance complexities [21]. Further, Liu et al. (2023) found that stricter environmental policies are associated with lower pollution levels and improved governance outcomes in the corresponding regions [22]. Wang et al. (2024) analyzed public responses to heterogeneous environmental policies and discovered that policy guidance, interest appeals, implementation costs, and commitment mechanisms significantly influence public reactions [23]. Moreover, these effects vary among individuals depending on their environmental responsibility, policy awareness, time preferences, and peer influence.
2.1.2. Research on the Impact and Effect of EID
As one of the most common voluntary environmental policy instruments, EID plays a critical role. The existing literature has primarily focused on exploring its environmental and economic effects.
Regarding environmental effects, most scholars hold a positive view, suggesting that EID contributes to improving environmental quality and reducing pollution emissions [24]. Firstly, government disclosure of environmental data—such as emissions and monitoring results—increases transparency and heightens social pressure on heavily polluted areas. This pressure motivates local authorities and enterprises to implement emission reduction measures, advance technological upgrades, and invest in environmental protection, thereby enhancing regional environmental conditions. Secondly, EID reduces information asymmetry among governments, firms, and the public. Making environmental information accessible raises public awareness of urban environmental status, enabling citizens to monitor corporate pollution and, when necessary, seek legal recourse. This transparency strengthens environmental governance and facilitates pollution control and carbon reduction efforts [9].
However, a minority of scholars argue that the effectiveness of EID in improving environmental governance efficiency may be overstated, and in some cases, it may even have adverse effects. For example, Fabrizio and Kim (2019) provide empirical evidence that some firms engage in data manipulation or selective disclosure to evade transparency pressures [25]. Such firms may temporarily reduce emissions during monitoring but revert to polluting practices afterward, undermining disclosure goals and potentially worsening environmental harm. Feng and He (2020) further argue that EID may intensify regional disparities in competition [26]. Heavily polluted areas often face greater social pressure and economic losses due to publicized data, which may place them at a competitive disadvantage. Moreover, if the disclosed environmental data contain inaccuracies or are perceived as unreliable, this may trigger a crisis of public trust in both governments and enterprises. Such a trust deficit not only weakens the policy’s effectiveness but may also contribute to social instability [27].
In terms of economic effects, existing studies have primarily examined the impacts of EID at both the firm and regional levels. At the firm level, Xie and Nozawa (2019) find that EID, by enhancing corporate transparency, compels firms to optimize production processes and foster technological innovation, thereby improving their product competitiveness in international markets [28]. Raimo et al. (2021) further demonstrate that EID significantly reduces firms’ debt financing costs by mitigating the information asymmetry between investors and corporations [29]. High-quality disclosure is more likely to gain recognition from financial institutions in the form of green credit, enabling firms to access lower-cost funding and improve capital allocation efficiency. This financial resource reallocation effect has been corroborated in cross-country comparative studies conducted by Huang et al. (2025) [30]. At the regional level, research shows that EID can promote urban economic development [31], enhance urban total-factor energy efficiency, and facilitate technological innovation and industrial upgrading [21]. For example, Liu et al. (2021) find that disclosure encourages local governments to intensify regulation of highly polluting and energy-intensive industries, thereby promoting a shift toward greener and higher-end industrial structures [32]. Guo and Xu (2024) show that by improving urban environmental quality, EID attracts greater investment and talent inflows, thereby driving urban economic growth [5]. Wang and Shao (2024) further confirm that disclosure prompts local governments to prioritize energy efficiency, resulting in improvements in regional total-factor energy efficiency [23].
2.2. Research on USD
In the implementation of the Sustainable Development Goals (SDGs), interdisciplinary research has become a crucial approach to addressing the complex challenges of coordinating ecological degradation, social inequality, and economic imbalance. Academic research on the United Nations 2030 Agenda for Sustainable Development primarily follows two dimensions: the scientific construction of the SDG indicator system and empirical studies related to the SDGs.
Regarding the construction of the Sustainable Development Goal (SDG) indicator framework, significant disparities in resource endowments and governance capacities across cities and regions have consistently fueled debates about the applicability of a unified assessment framework for sustainable development. Early research was criticized for neglecting the specific characteristics of local socio-ecological systems. For example, Feleki et al. (2018), through cross-national comparative studies, demonstrated that substantial variations in key variables such as infrastructure levels and the efficiency of fiscal resource allocation compromise the comparability of standardized indicator systems across regions [33]. In response, Verma et al. (2018) proposed an “economy–society–environment” three-dimensional assessment model, emphasizing that indicator selection should balance data availability, target threshold setting, and system dynamic equilibrium [34]. Kwatra et al. (2020), based on evaluations of various sustainable development index tools, found that aggregated and theme-based frameworks are the most widely adopted approaches for assessing sustainability across regions and that integrating these two frameworks enables a more comprehensive evaluation of regional sustainable development [35]. Focusing on SDG7 (Affordable and Clean Energy), Montoya (2022) identified three critical pathways through which energy system transitions enhance sustainable development performance: improving social welfare, enhancing infrastructure resilience, and sustainably managing ecosystem services [36]. Gebara et al. (2024), through a review of the existing literature, proposed or applied indicator evaluation criteria and mapped out an indicator system that can guide the assessment and selection of SDGs at different levels [37]. Based on the 17 SDGs, Li et al. (2024) developed a framework of 126 SDG indicators across Chinese provinces to comprehensively measure regional sustainable development performance [12].
Regarding empirical research on the SDGs, scholars have mainly focused on two dimensions: the analysis of multi-goal synergies and the evaluation of policy intervention effects. For instance, Nilsson et al. (2018) proposed a “taxonomy of goal interactions”, establishing a knowledge base that reveals the complex interrelationships among the SDGs, wherein the progress (or lack thereof) of one specific target can exert either a positive or negative influence on another [38]. Liu et al. (2018), through a quasi-natural experiment, demonstrated that while renewable energy subsidy policies in developing countries (SDG 7) can reduce carbon emissions (SDG 13), they may also exacerbate educational inequality (SDG 4) due to the fiscal crowding-out effect, underscoring the dynamic nature of goal conflicts [39]. In terms of synergies, Warchold et al. (2021) employed complex network analysis to quantify the nonlinear synergistic pathways between SDG 6 (Clean Water and Sanitation) and SDG 3 (Good Health and Well-being) in Africa, finding that the marginal effects of water quality improvements on reducing child mortality followed an S-shaped curve [40]. Demirkale (2025), by constructing ARDL and NARDL models, explored the positive synergy between SDG 7 (Affordable and Clean Energy) and SDG 13 (Climate Action) under the influence of climate, energy, and policy uncertainty [41].
In the area of SDG policy evaluation, scholars have developed a variety of assessment frameworks and identified key factors influencing the implementation of SDG policies. For example, Muganyi et al. (2021) found that green finance policies significantly improved urban ecological environments and promoted sustainable urban development [42]. Zope et al. (2019), through empirical analysis, demonstrated that better-developed intercity transportation systems facilitate the achievement of sustainable development goals in India [43]. Similarly, Liu et al. (2022) showed that indicators of residents’ living standards, such as environmental resources, infrastructure, healthcare services, and population size, have significant impacts on urban sustainability [44]. Montoya et al. (2020) developed an assessment framework comprising 13 core indicators, including resource accessibility and community autonomy, specifically targeting informal settlements in Latin America, and confirmed the critical moderating role of local knowledge in the effectiveness of SDG implementation [36]. Beccarello et al. (2022) further demonstrated that the implementation of local waste management policies contributes to the realization of SDG11 (Sustainable Cities and Communities) and SDG12 (Responsible Consumption and Production) [45].
In summary, EID, as an important policy instrument for promoting USD, has attracted widespread concern. However, significant research gaps and opportunities for further exploration remain in both theoretical framework construction and empirical investigation. First, existing studies predominantly adopt an isolated perspective to analyze the impact mechanisms of EID on USD. This one-dimensional analytical paradigm fails to fully capture the complex interactions between EID and sustainable development, particularly lacking in-depth exploration of the mediating transmission pathways linking the two. Second, although scholars have empirically examined the economic and environmental effects of EID, research on whether and how it influences USD has yet to establish a comprehensive theoretical explanatory framework, and robust empirical evidence remains scarce.
2.3. Research on USD EID
Research on the Impact of EID on USD
With the advancement of the global sustainable development agenda, environmental information policies and disclosure practices have become critical instruments for guiding the behavior of both enterprises and governments. Academic research has increasingly focused on the impact of EID on corporate sustainable growth, forming two main streams of inquiry. One stream emphasizes the potential inhibitory effects of EID, arguing that disclosure may impose economic burdens and reputational risks, thereby hindering long-term growth.
From the perspective of negative impacts, the neoclassical economic viewpoint traditionally holds that the benefits of environmental protection are often offset by increased private costs [46]. When firms disclose environmental information, the public not only gains insight into their environmental initiatives but also becomes aware of negative aspects such as pollution emissions and regulatory penalties [47]. This may damage a company’s reputation, trigger regulatory scrutiny, elevate operational costs, and ultimately impair its growth prospects. Moreover, EID is often accompanied by managerial restructuring and technological investments, which can increase environmental management costs [48] and crowd out investment in other high-potential projects, leading to resource misallocation and a reduction in long-term growth capacity.
Conversely, from a positive perspective, signaling theory suggests that proactive disclosure of environmental information enables firms to communicate their green governance capabilities to investors, governments, and the public, thereby enhancing market recognition and facilitating access to financing [46]. This not only helps build green goodwill and strengthen competitive advantage but also improves a firm’s position in policy approvals and resource allocation, reducing development risks and enhancing business resilience. Additionally, EID can mitigate information asymmetry between firms and external stakeholders, alleviate agency problems, and improve the efficiency of resource allocation [49], thereby indirectly promoting corporate sustainable development.
3. Mechanism Analysis and Research Hypotheses
3.1. Direct Relationship Between EID and USD
As an emerging environmental regulatory instrument, EID differs significantly from traditional command-and-control and market-based regulatory approaches. Its core philosophy lies in promoting transparency to encourage the collaborative participation of governments, enterprises, and the public, thereby injecting momentum into USD [50]. Compared to other environmental policies, EID enhances transparency and establishes a society-wide supervisory system, thus providing a new pathway for environmental governance [25]. The role of EID in promoting USD is mainly reflected in the following three aspects.
First, EID provides a scientific basis for government decision-making through data transparency, thereby significantly enhancing governance efficiency. By publicly disclosing real-time pollution emission data, governments can accurately identify major sources of pollution, prioritize the remediation of highly polluted areas, and optimize the allocation of environmental resources [51]. Moreover, cross-departmental environmental data sharing helps establish a systematic regulatory framework, strengthening the coordination of governance efforts [52]. This information-based precision governance model reduces policy trial-and-error costs and lays an institutional foundation for USD [53]. Second, EID creates a dual-pressure mechanism. On the one hand, for enterprises, mandatory disclosure compels greater investment in the development of green technologies and promotes the greening of production processes [54]. On the other hand, in the market, consumers leverage environmental information to select green products, while investors assess corporate sustainability based on disclosed data, guiding capital flows toward green industries [55]. This dynamic accelerates the transformation of the urban economic structure and stimulates investment in green infrastructure and clean energy sectors [56], fostering a virtuous cycle between environmental governance and economic development. Third, EID strengthens public participation and oversight [57]. It reshapes the power dynamics of environmental governance by empowering the public to form a multi-dimensional supervisory system. Through access to environmental data, citizens’ right to know is transformed into substantive participation [57], enabling the public to monitor corporate environmental behaviors and promote government policy optimization [58]. This bottom–up supervision mechanism injects new vitality into urban environmental governance and further enhances the sustainability of urban development [59]. Accordingly, this study proposes the following research hypothesis:
H1.
EID significantly improves urban sustainability.
3.2. Indirect Effects of EID on USD
3.2.1. EID, Green Innovation, and USD
On the one hand, as a form of “soft” environmental regulation, EID effectively breaks down information barriers among governments, enterprises, and the public through mechanisms of transparency, providing a viable solution to the pervasive issue of “information silos” in traditional environmental governance [60]. Regions with higher levels of EID have had a significant increase in patent applications and investments in green technology research and development [61]. EID promotes green innovation through two primary effects:
① Agglomeration Effect. The open access to urban environmental data reduces the search costs for green technologies [26], attracting innovative resources to regions with high concentrations of environmental technologies. Neighboring areas benefit from the sharing of pollution control patents, thereby enhancing the overall efficiency of regional green innovation [62];
② Demonstration Effect. The public disclosure of environmental credit ratings compels highly polluting industries to relocate to regions with more relaxed environmental regulations [63]. This spatial reallocation process accelerates the dissolution of the “pollution haven” effect within urban clusters, further driving the development of green technologies [64].
On the other hand, green innovation enhances urban sustainability across economic, environmental, and social dimensions. First, from an economic perspective, green technological innovations, such as clean energy technologies and circular production processes, significantly reduce resource consumption and pollution control costs, promote the transition of industrial structures toward low-carbon models, and facilitate urban economic development. At the same time, the application of green technologies attracts additional investment, further driving economic growth [65,66]. Second, from an environmental perspective, cities can effectively mitigate the impact of industrial and municipal waste on the environment by adopting advanced waste treatment and resource recycling technologies, thereby improving overall environmental quality [67]. Based on the analysis above, this study proposes the following hypothesis:
H2-1.
EID indirectly promotes urban sustainability by fostering green innovation.
3.2.2. EID, Government Environmental Concern, and Urban Sustainability
As a key tool of environmental governance, EID enhances government environmental concerns and provides an effective driving force for urban sustainability. On the one hand, EID continuously strengthens the government’s environmental concerns. Specifically, first, the real-time publication of environmental data not only reflects the current state of the environment but also reveals potential climate risks. This enables local governments to adjust their policies promptly based on monitoring information, ensuring a balance between environmental protection and economic development, raising the priority of environmental issues on local policy agendas [68], providing a scientific basis for decision-making, enhancing information transparency, and promoting cross-regional joint law enforcement and environmental governance cooperation [69] (Lou and Zhu, 2025). Second, publicly available environmental information significantly enhances public participation and supervision. In other words, the public can express concerns about environmental issues through channels such as social media and community meetings, creating social pressure on governments. This pressure compels governments to increase their concern for and governance of environmental issues, thus prompting more effective actions [70]. Finally, the transparency of environmental information facilitates interdepartmental collaboration, which improves the efficiency of environmental governance. When different departments can share and access environmental data, they are better able to coordinate their actions, avoid resource wastage and redundant efforts, and, thus, further enhance the government’s concern for environmental issues [71].
On the other hand, increasing the government’s concern for environmental issues helps promote urban sustainability. Government environmental concern is first reflected in the institutional supply of environmental governance. Specifically, by formulating legally binding targets such as pollutant emission limits, higher levels of government concern lead to better regional pollution control performance and higher levels of environmental sustainability [71]. Second, government environmental concern extends through market incentive mechanisms. Governments employ differentiated environmental tax rates (e.g., imposing a 4.8% environmental surcharge on highly polluting industries) and provide subsidies for clean technology R&D (up to 30% of project investment) to encourage enterprises to adopt cleaner production technologies and promote the green transformation of traditional industries, thereby facilitating urban sustainability [72,73]. In addition, as governments enhance their environmental concern, they optimize fiscal expenditures based on publicly disclosed environmental information, prioritizing support for sustainable development projects such as clean energy and ecological restoration. By establishing environmental project portfolios and funding coordination mechanisms, governments guide private capital into environmental governance, thus driving urban sustainability [74]. Accordingly, this study proposes the following hypothesis:
H2-2.
EID promotes urban sustainability indirectly by enhancing environmental concerns.
3.3. Moderating Effect of CPU on the Relationship Between EID and USD
Climate change has become one of the most serious risks facing the world over the next decade, and its profound impact on the economy, society, and environment has attracted significant concern from governments and international organizations. In response to climate change, countries worldwide have implemented a series of policies aimed at mitigating global warming. However, the CPU has become a critical factor influencing global economic, social, and environmental sustainability [75]. Despite the implementation of a range of policies designed to mitigate climate change, protect the environment, and promote sustainable development, the frequent shifts in these policies may lead to fluctuations in energy prices, the implementation of new tax policies, and changes in subsidies for certain technologies or products. As a result, investors and financial institutions regard CPU as a potential risk [76].
The stability and predictability of climate policies are crucial for the sustainable development of nations because they provide clear direction for government departments to achieve long-term economic, social, and environmental goals [77]. CPU not only affects green innovation and sustainable investment but also influences the ecological environment, thereby impacting urban sustainability. When climate policies are stable, EID can more effectively promote sustainable development, raise environmental awareness across society, and facilitate the implementation of concrete actions [78]. On the contrary, when there is significant uncertainty in climate policies, even high levels of EID can suppress energy transitions, increase energy consumption, hinder industrial upgrades, reduce energy efficiency, and potentially obstruct the progress of urban sustainability. Therefore, the degree of uncertainty in climate policies determines whether the disclosure of environmental information can be effectively translated into actionable momentum for sustainable development [79]. In conclusion, we propose the following hypothesis:
H3.
CPU positively moderates the mediating effects of green innovation and government environmental concerns.
Based on the above potential mechanism of environmental information policy affecting USD, Figure 1 shows the mechanism analysis diagram of the corresponding research hypothesis.
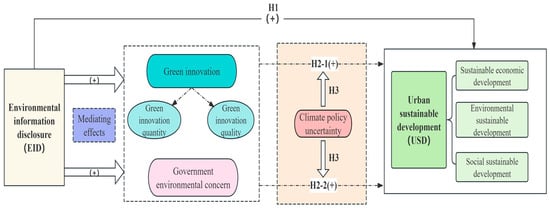
Figure 1.
Conceptual framework.
4. Methodology and Data
4.1. Model Specification
4.1.1. Multi-Period DID Model
The difference-in-differences (DID) model is a widely adopted approach for evaluating the causal effects of policy interventions. By comparing changes in outcomes between treatment and control groups before and after the implementation of an exogenous policy, the DID method effectively mitigates endogeneity concerns. Given that cities adopted environmental air quality standards at different times, this study utilizes a time-varying DID model to assess the impact of environmental information disclosure (EID) on urban sustainability. Building on the preceding theoretical framework, the following empirical model is developed to examine how EID contributes to the advancement of sustainable urban development:
In this model, the dependent variable, USDit, represents the level of urban sustainability for city i in year t. The key explanatory variable, EIDit, indicates whether city i had disclosed environmental information in year t, that is, whether the city had implemented the AAQSs. The distribution of treated cities is shown in Figure 2. The coefficient β captures the effect of EID on urban sustainability. A significantly positive β would suggest that the implementation of the AAQSs has a positive and significant impact on urban sustainability, indicating that EID effectively promotes sustainable urban development. Based on the relevant theoretical basis and empirical experience in the existing literature, the aim is to control other factors that may affect the USD as much as possible so as to identify the policy effect of EID more accurately. This model also includes a set of control variables, Xit, which account for other factors that may influence urban sustainability. These variables include economic contribution (ecd), population concentration (pcd), fiscal decentralization (fdi), infrastructure (inf), and industrial upgrading (ais). In addition, and represent city-fixed effects and time-fixed effects, respectively, controlling for unobserved heterogeneity across cities and over time. The random error term εit captures unexplained random fluctuations.
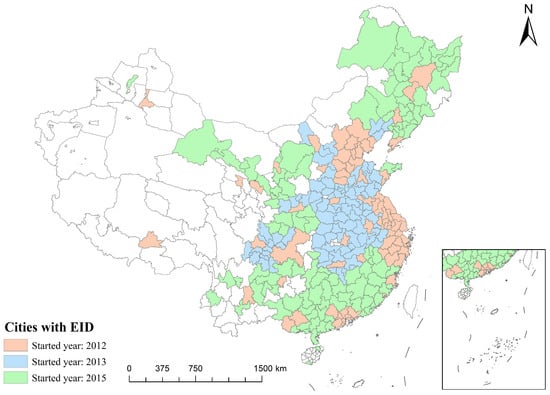
Figure 2.
Staggered spatial distribution of treated cities in China.
4.1.2. Mediation Effect Model
The mediation effect model is a statistical approach used to explore the mechanism underlying the relationship between an independent variable (predictor) and a dependent variable (outcome). Its core principle is to introduce a mediator variable to analyze how the independent variable indirectly affects the dependent variable through the mediator, thereby revealing the complex causal relationships among variables. Building on the baseline regression results that confirm the impact of EID on urban sustainability, we further construct the following mediation effect models to examine the mediating pathway between EID and USD. The specific model specifications are as follows:
In this model, the mediator variable MEDit includes green innovation and governmental environmental concern (gec). Following Huang et al. (2023) [80], green innovation is further divided into green innovation quantity (gpn) and green innovation quality (gpq), aiming to provide a more comprehensive understanding of the mediating role of green innovation between EID and USD. All other variables are consistent with those defined in Equation (1). In Model (2), the regression coefficient α1 measures the direct effect of EID on each of the mediators. In Model (3), the regression coefficients γ1 and γ2 capture the effects of EID and the mediator variables on USD, respectively. We employ the Structural Equation Modeling approach to estimate these coefficients. Additionally, we conduct robustness checks using the bootstrap method to assess the mediation effects and confidence intervals for gpn, gpq, and gec.
4.1.3. Moderated Mediation Effect Model
The moderated mediation effect model is designed to analyze how the mediation process is influenced by a moderator variable. Its core purpose is to test whether the strength or direction of a specific link in the mediation pathway varies across different levels of the moderator, thereby uncovering more complex causal mechanisms. Building on the mediation effect model that examines how EID affects USD, we further construct the following moderated mediation effect model:
In this model, i denotes the city, and t represents the year. Xit refers to the set of control variables. The term CPUit denotes the moderator. and are the constant terms, while and are the regression coefficients. and represent the individual and time-fixed effects, respectively, capturing city-specific and time-specific unobservable factors; is the random error term used to account for unexplained random fluctuations.
4.2. Data Description
Following the methods of Hickel (2020) [80] and considering indicator selection principles as well as the availability of data at the prefecture level, this study constructs a comprehensive urban sustainability evaluation index system based on the connotation of urban sustainable development and the United Nations Sustainable Development Goals (SDGs). Specifically, we develop a set of 16 tertiary indicators across these three dimensions. We then applied the entropy method to assign weights to each indicator. Due to differences in the scales of indicators across dimensions, a logarithmic transformation was applied to the composite scores obtained from the entropy method to enhance comparability and robustness (see Table 1).

Table 1.
Comprehensive Evaluation Index System for USD.
This variable is designed to measure whether a city has begun implementing the Ambient Air Quality Standards, that is, whether it has started disclosing information related to its ambient air quality. The AAQSs were implemented nationwide in three phases across prefecture-level and above cities starting in 2012. Specifically, on 29 February 2012, the first batch of pilot cities included 74 cities located in regions such as Beijing–Tianjin–Hebei, the Yangtze River Delta, and the Pearl River Delta. In 2013, the second batch of pilot cities expanded to include 113 key environmental protection cities and national environmental model cities. By 2015, the standards had been extended to cover all prefecture-level and above cities in China. Given that, after 2015, all cities had implemented EID, resulting in the loss of a control group, this study focuses on the first two batches of pilot cities from 2012 and 2013 as the research sample to ensure the validity of effect identification.
Control Variables: Based on empirical evidence from the existing literature, the following control variables are selected with the aim of accounting for other potential factors that may influence urban sustainable development, thereby enabling a more accurate identification of the policy effects of EID. (1) Economic Contribution (ecd): Measured by the proportion of a city’s GDP to the national GDP. (2) Population Concentration (pcd): Measured by the natural logarithm of population density (persons per square kilometer). (3) Foreign Direct Investment (fdi): Measured by the ratio of the total industrial output value of foreign-invested enterprises to the city’s GDP. (4) Infrastructure (inf): Measured by the natural logarithm of the total length of domestic highways (in kilometers). (5) Industrial Upgrading (ais): Measured by the ratio of the value added of the tertiary industry to that of the secondary industry.
Mediating Variables: (1) Green innovation quantity (gpn): Measured by the natural logarithm of the number of green patent applications plus one. The number of green patent applications serves as a key indicator of green innovation output, directly reflecting a region’s level of activity in environmental protection and technological advancement. (2) Green innovation quality (gpq): Measured by the natural logarithm of the number of granted green patents plus one. The number of granted green patents is an important standard for assessing the actual value and market competitiveness of green innovations. High-quality green innovations often lead to greater environmental and socioeconomic benefits. (3) Government Environmental concern (gec): A higher level of government environmental concern implies stronger environmental regulations, greater financial support, and more effective regulatory measures. Following the method of Liu et al. (2023) [71], this variable is measured by the proportion of environmentally related keywords (such as“air quality”, “environmental governance”, “environmental protection”, and “green development”) in the annual government work reports of Chinese cities.
Moderating Variable: Climate Policy Uncertainty (cpu). Referring to the method proposed by Faccini et al. (2023) [81], we employ deep learning techniques to automatically extract information related to climate policy uncertainty from authoritative and specialized media sources, including People’s Daily, Xinhua News Agency, China Environment News, and Economic Daily. This method enables the construction of a Climate Policy Uncertainty (CPU) index characterized by high temporal sensitivity, spatial granularity, and semantic precision. Given that this index has been adopted in peer-reviewed studies and is based on a transparent and publicly accessible methodology, we directly utilize the city-level CPU index developed by Ma et al. (2023) as a moderating variable in our analysis [82].
4.3. Data Sources and Descriptive Statistics
In consideration of the significant external shock posed by the COVID-19 pandemic and the substantial data missingness observed in certain cities, this study excludes the affected observations to ensure data reliability. The final sample comprises panel data from 278 prefecture-level and above cities in China, covering the period from 2000 to 2020. To address partially missing values, linear interpolation is employed. Descriptive statistics for all variables are presented in Table 2.
Table 2.
Descriptive statistics of all variables.
5. Empirical Analysis
5.1. Benchmark Tests
Table 3 presents the static treatment effects of EID on USD, accounting for year and city-fixed effects. Column (1) reports the multi-period DID regression results without control variables; Columns (3) to (5) present the regression results using economic sustainability, environmental sustainability, and social sustainability of cities as dependent variables, respectively, while including control variables; Column (2) shows the multi-period DID regression results using overall urban sustainability as the dependent variable.
Table 3.
Benchmark results of multi-period DID regression.
The regression coefficients of EID on overall urban sustainability, both without and with control variables, are reported in Columns (1) and (2), respectively, with values of 0.075 and 0.069. Both coefficients are significantly positive at the 1% level. Moreover, the regression results for the secondary indicators—economic, environmental, and social sustainability—are also significantly positive at the 1% significance level. The coefficient for economic sustainability (0.128) is notably larger than that for environmental sustainability (0.060), which may be attributed, on the one hand, to the fact that EID promotes urban industrial upgrading through mechanisms such as green credit incentives and restrictions on high-pollution industries, directly boosting economic growth. On the other hand, “race-to-the-bottom” competition in environmental governance among cities may lead some local governments to weaken environmental regulation to attract investment, thereby diluting environmental benefits through accelerated economic growth. In contrast, the regression result for social sustainability is negative and fails to pass the significance test. This could reflect the complexity of social factors, such as social structure, public participation, and public awareness and response to environmental information. Additionally, the development of social sustainability often requires a longer time horizon and broader collaboration, meaning that EID alone may not yield immediate significant effects. The above regression results indicate that following the implementation of the Ambient Air Quality Standards, EID has effectively promoted USD.
Furthermore, regarding control variables, all regression coefficients are significantly positive, suggesting that factors such as economic contribution and population agglomeration play important roles in promoting USD. Among them, the coefficient for economic contribution is the largest, possibly because a higher level of economic contribution reflects a stronger economic foundation, which can provide more direct support for sustainable development. These findings provide preliminary validation for Hypothesis H1.
5.2. Parallel Trend Test
To further examine the dynamic incentives of EID on USD, we construct the following model for estimation.
Figure 3 illustrates the dynamic changes in the treatment effects of EID on USD. As shown, at each time point prior to the implementation of EID (j = −6, …, −2), the coefficients γ are significantly negative and gradually increase over time. This indicates that before the policy implementation, EID exerted a certain negative impact on the USD, though the negative effect showed a weakening trend. In the year of AAQSs implementation, the regression coefficient turned from negative to positive, suggesting that the negative impact of EID on USD was largely eliminated at the early stage of the policy and began to exhibit a certain positive effect. Following the policy implementation (from t + 1 to t + 5), the regression coefficients remained generally positive and relatively stable, indicating that EID generated a sustained positive impact on USD after the AAQSs came into effect. However, the effect did not further intensify significantly over time. A possible explanation for this phenomenon is that in the initial phase of EID, although transparency improved, local governments, enterprises, and the public had not yet developed effective response mechanisms, resulting in some short-term negative shocks to sustainable development. As the AAQSs were implemented, increased information transparency and greater public participation gradually raised awareness of environmental protection and sustainable development among governments, enterprises, and the public, leading to a reallocation of resources toward related fields. Meanwhile, local governments actively responded to policy requirements by taking various measures to improve environmental quality, enhancing the efficiency of environmental governance, and thereby promoting USD to some extent. Summarily, the combined effect of EID and policy responses jointly fostered a virtuous cycle of environmental protection and urban development following the policy implementation, and this positive effect was sustained in subsequent periods.
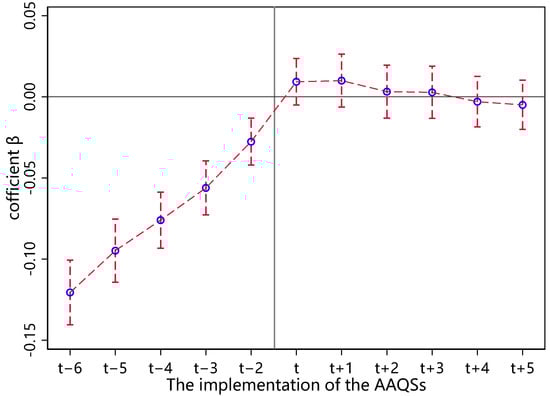
Figure 3.
The dynamic changes in the treatment effects of EID on USD.
5.3. Robustness Tests
5.3.1. PSM–DID
In the baseline regression, directly selecting demonstration cities as the treatment group for the DID estimation may introduce bias due to non-random sampling. To further verify the robustness of the above conclusions, this study employs the Propensity Score Matching–Difference-in-Differences (PSM–DID) approach to correct for potential sample selection bias. To avoid sample loss after matching, the control variables used in the baseline regression are selected as the matching variables. Using the 1:1 nearest-neighbor matching method, each treated sample is matched with a control sample having a similar year-by-year propensity score. After matching, the mean differences in the control variables between the treatment and control groups are statistically insignificant, indicating that the covariates between the two groups are balanced. Subsequently, the DID regression is re-estimated using the matched samples. As shown in Table 4, the PSM–DID regression results demonstrate that columns (1) to (3) report the outcomes for economic, environmental, and social sustainability, respectively, which are largely consistent with the baseline regression results. Column (4) presents the PSM–DID result for overall USD, with a regression coefficient of 0.068, which is significantly positive at the 1% level. This once again confirms that EID has a significant positive effect on USD, which is consistent with the baseline findings.
Table 4.
PSM–DID regression results.
5.3.2. Placebo Test
We randomly grouped the samples according to city codes, and from each group, we randomly selected a year as the time point for EID. This process was repeated 1000 times for a placebo test. As shown in Figure 4, the regression coefficients β for the treatment variable, EID, are mostly centered around zero, with the vast majority of the coefficients falling within the range of [−0.02, 0.02]. This result indicates that the effect of EID on USD, derived from random sampling, is nearly zero and significantly lower than the positive effect observed in the baseline regression. This finding provides strong validation for the baseline regression results, confirming the positive impact of the disclosure of environmental air-related information brought about by AAQSs on USD.
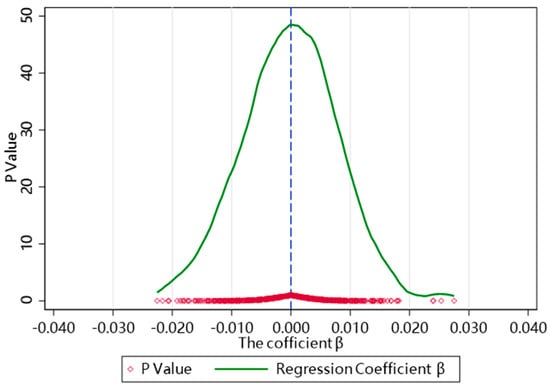
Figure 4.
Placebo test. Notes: The green curve represents the K-density distribution of regression coefficient β, and the red diamond dot represents the point estimate of β.
5.3.3. Heterogeneity Robust DID Test
To more accurately capture heterogeneous treatment effects and explore the incentive mechanisms through which EID influences urban sustainability, we further conduct a series of heterogeneity-robust DID tests using three counterfactual-based approaches, including the staggered DID and two-stage DID models.
As shown in Figure 5, the regression coefficients β of the EID variable are predominantly concentrated around values below zero in the periods prior to policy implementation, indicated by the left side of the vertical grey line. This suggests that there were no significant differences in the level of urban sustainability between the treatment and control groups before the adoption of EID policies, thus supporting the parallel trends assumption. In contrast, after the implementation of EID—represented by the right side of the grey vertical line—the estimated average treatment effect becomes significantly positive. The confidence intervals for the post-treatment periods no longer include zero, and the coefficients exhibit an upward trend within three periods following the policy intervention. These results indicate that EID has had a positive and growing impact on urban sustainability in the years following its adoption. Taken together, the findings from all robustness checks consistently confirm the causal relationship between EID and improvements in urban sustainability.
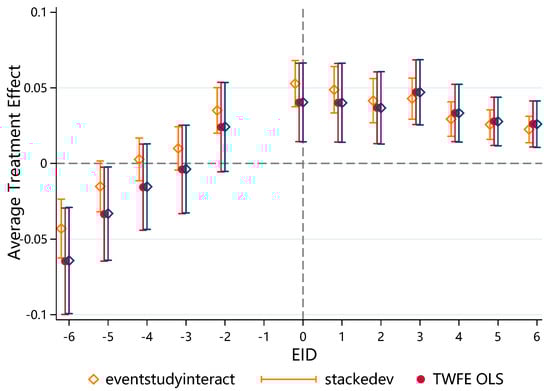
Figure 5.
Robustness test of DID under heterogeneous treatment effects.
5.3.4. Other Robustness Tests
- (1)
- Excluding municipalities and provincial capitals.
Considering that the municipalities (Beijing, Tianjin, Shanghai, Chongqing) and the regional capital cities have significant advantages in terms of policy and economy, this may have a potential impact on the regression results. In order to ensure the robustness of the research conclusions, we excluded the data of these four municipalities directly under the Central Government and provincial capitals and re-conducted regression analysis on the remaining samples. The regression results in column (1) of Table 5 show that even after removing these city samples, the positive impact of EID on USD is still significant at the significance level of 1%. This result shows that the main conclusions of this paper remain robust in sample selection without significant interference from specific city categories;
Table 5.
Other robustness test results.
- (2)
- Excluding the Influence of Other Policies.
Considering that during the sample period, the Chinese government announced two batches of low-carbon pilot cities in 2010 and 2012 and launched the “Sustainable Development Pilot Zone” policy in 2014—both of which could potentially affect USD—we re-estimate the models by excluding the influence of these policies. The results reported in Column (2) of Table 5 show that after controlling for the Sustainable Development Pilot Zone (ESD) policy, the regression coefficient of EID remains significantly positive at the 1% confidence level, while the coefficient for the Sustainable Development Pilot Zone is significantly negative at the 1% level. Furthermore, after excluding the potential interference of the Low-Carbon Pilot (LCP) policy, the results in Column (3) of Table 5 indicate that the regression coefficient of EID remains significantly positive at the 1% confidence level, whereas the coefficient for low-carbon pilot cities is statistically insignificant. Overall, these results suggest that, compared to the ESD and LCP policies, the improvement in USD is primarily attributable to the positive incentives brought about by EID;
- (3)
- Altering the Policy Implementation Period.
To further examine whether the impact of EID on USD is sensitive to the policy implementation timeframe, we adjust the time window of the regression analysis. As shown in Column (4) of Table 5, when a three-year lag after policy implementation is considered, the regression coefficient of EID remains significantly positive at the 1% level. This finding suggests that the effect of EID on promoting USD exhibits a lagged response, gradually emerging over time following the policy implementation. This result highlights the long-term effectiveness of EID and indicates that the positive impact on USD may require a certain period to fully materialize.
5.4. Heterogeneity Test
5.4.1. Heterogeneity Test of Urban Administrative Levels
Cities of different types exhibit significant variation in resource allocation, governance capacity, and levels of public participation. These disparities may lead to systematic biases in the implementation effectiveness of EID. To account for this, we further divide the sample into two subgroups—provincial capital cities (including sub-provincial cities) and non-provincial capital cities —based on administrative status in order to investigate the mechanisms through which EID influences sustainable development, as well as the heterogeneity of its effects. As shown by the regression coefficients in Table 6, the EID coefficient for provincial capital cities is 0.051, which is significantly positive at the 5% confidence level. In contrast, the coefficient for other cities is 0.073, which is significant at the 1% level. Although EID exerts a positive effect on both city groups, the policy impact appears stronger in non-capital cities. Several factors may explain this difference. On the one hand, although provincial capitals tend to exhibit stronger governance capabilities, their more institutionalized channels for public participation in environmental governance may dampen the marginal incentives brought by EID. In contrast, in other cities, EID may more effectively stimulate public attention to environmental issues, thereby fostering stronger government–citizen feedback mechanisms. On the other hand, provincial capital cities often face a more complex array of administrative responsibilities and overlapping policy agendas, which may dilute the practical impact of EID. In other cities, however, policy resources are often concentrated on fewer priorities, and EID may, thus, receive comparatively greater emphasis in implementation.
Table 6.
City size and resource-based city heterogeneity.
5.4.2. Heterogeneity Test of Resource-Based Cities
Given the significant differences between resource-based and non-resource-based cities in terms of economic structure, development models, and resource dependence, these differences may lead to notable variations in the mechanisms and effects of EID on sustainable development. Therefore, we conducted a heterogeneity analysis based on resource-based and non-resource-based cities. The regression results are shown in columns (3) and (4) of Table 6. The results indicate that, compared to resource-based cities, non-resource-based cities have a larger EID coefficient, suggesting a relatively stronger role of EID in promoting sustainable development. This difference can be attributed to several factors. On the one hand, non-resource-based cities have a more diversified economic structure and are less reliant on a single resource industry, which provides them with greater flexibility and adaptability in promoting sustainable development. These cities tend to focus more on innovation and green transformation, and EID can effectively support their policy transformation and economic upgrading. In contrast, resource-based cities are often constrained by resource dependence and industrial transformation, with more homogeneous economic structures and greater pressures to transform, resulting in less significant effects from EID. On the other hand, non-resource-based cities tend to have higher government and public attention to sustainable development issues, with stronger environmental awareness and policy support. Resource-based cities, however, may focus more on short-term economic growth and overlook long-term environmental governance. As a result, non-resource-based cities experience smoother implementation of EID, with more pronounced effects.
5.4.3. Heterogeneity Test of Sustainability
(1) Economic Sustainability Heterogeneity Analysis. Based on the measurement of sustainable development levels for each city, we further divided the sample into two sub-samples according to the average economic sustainability development index of the cities: low economic sustainability cities (Low ESD cities) and high economic sustainability cities (High ESD cities). A heterogeneity test was then conducted. As shown in column (1) of Table 7, the EID regression coefficient is 0.059, which is significantly positive at the 1% confidence level, indicating that EID has a significantly positive effect on the sustainable development of cities with low economic sustainability. However, in column (2) of Table 7, the EID regression coefficient is −0.014, which does not pass the significance test, suggesting that in cities with high economic sustainability, the impact of EID on sustainable development is not significant. One possible explanation is that cities with lower economic sustainability have more room for improvement in sustainable development. EID can enhance transparency and external supervisory pressure, motivating local governments to strengthen environmental governance, fulfill environmental responsibilities, and encourage public participation, thus significantly improving urban sustainability. On the other hand, cities with higher economic sustainability have already established relatively well-developed sustainability systems, leaving limited room for marginal improvement. As a result, the incentive effect of EID on policy improvement and decision-making behavior is weaker.
Table 7.
Heterogeneity analysis of sustainable development.
(2) Environmental Sustainability Heterogeneity Analysis. Similarly, we divided the sample into two sub-samples based on the average environmental sustainability development index: low environmental sustainability cities (Low ENSD cities) and high environmental sustainability cities (High ENSD cities). A heterogeneity test was conducted. The results, shown in columns (3) and (4) of Table 7, indicate that in cities with low environmental sustainability, the EID regression coefficient is significantly positive at the 1% significance level, suggesting that EID has a strong promoting effect on sustainable development. In contrast, in cities with high environmental sustainability, although the EID regression coefficient is −0.035, it does not pass the significance test, indicating that the effect of EID on cities with high environmental sustainability is not significant. This heterogeneity phenomenon may be explained by the fact that cities with lower environmental sustainability have weaker foundations in ecological, environmental protection and resource management. EID, by enhancing external oversight and policy pressure, can significantly improve its sustainability. In contrast, cities with higher environmental sustainability already have a well-established environmental protection system and green development model, with relatively mature environmental governance infrastructure and institutional mechanisms, making further improvements in the effects of EID less pronounced.
Social Sustainability Heterogeneity. Further heterogeneity analysis was conducted for cities with Low SSD and High SSD. The results, shown in columns (5) and (6) of Table 7, indicate that in cities with low social sustainability, the EID regression coefficient is significantly positive at the 1% significance level, suggesting that EID has a significantly positive effect on their sustainability. In contrast, in cities with high social sustainability, although the EID regression coefficient is −0.014, it does not pass the significance test, indicating that the effect of EID on cities with high social sustainability is not significant. This may be because cities with low social sustainability have significant room for improvement in public services, social security, education, healthcare, and other areas. EID, by enhancing government transparency and public participation, can help improve public governance, thereby promoting social sustainability. On the other hand, cities with high social sustainability already have relatively well-developed infrastructure and governance mechanisms. The public’s demand for EID is lower, and the marginal effect of policy incentives is diminished, leading to a less pronounced promoting effect on social sustainability. Additionally, the disclosure of information might increase management costs or expose conflicts of interest, potentially generating negative impacts.
5.5. Mediation Effect Test
To verify Hypotheses H2-1 and H2-2, this study explores the mediating pathways between EID and USD from two perspectives: green innovation and government environmental concern. Green innovation is further divided into the quantity of green innovation (gpn) and the quality of green innovation (gpq). The detailed regression results are presented in Table 8. On the one hand, as shown in Columns (1) and (2) of Table 8, the regression coefficients of EID are 1.705 and 0.107, respectively, both of which are significantly positive at the 1% level. Meanwhile, the coefficient of green innovation quantity (gpn) is also significantly positive, indicating that EID significantly enhances the quantity of urban green innovation, thereby promoting sustainable development. Similarly, all regression coefficients related to green innovation quality (gpq) are significantly positive at the 1% confidence level, suggesting that improvements in green innovation quality also drive USD. To further assess the magnitude of the mediating effects, the Sobel test and the Bootstrap method with 1000 resamples were employed. The results show that the indirect effects of green innovation quantity and quality are 0.307 and 0.322, respectively, accounting for approximately 74.15% and 77.75% of the total effects. These findings confirm that green innovation plays a significant mediating role in the relationship between EID and USD, namely, through Path1: EID→gpn→USD and Path2: EID→gpq→USD.
Table 8.
Mediating effect regression results.
On the other hand, as presented in Columns (5) and (6) of Table 8, the regression coefficients of EID are 0.122 and 0.389, respectively, both significant at the 1% level. Additionally, the coefficient of government environmental concern is significantly positive (0.145), indicating that EID promotes USD by enhancing governmental environmental concern, thus confirming Path3: EID→gec→USD. Using the Sobel test and Bootstrap resampling, the mediating effect of government environmental concern was estimated to be 0.018, accounting for approximately 4.43% of the total effect. In conclusion, H2-1 and H2-2 are empirically supported.
5.6. Test of Moderated Mediation Effects
To verify H3, this study adopts the moderated mediation testing method proposed by Jiang et al. (2021) [83], constructing a moderated mediation model with CPU as the moderating variable. The specific results are presented in Columns (2) and (4) of Table 9. When green innovation quality and green innovation quantity serve as the mediating variables, the interaction terms between green innovation (both quantity and quality) and CPU are significantly associated with USD, with coefficients of 0.089 and 0.101, respectively, significant at the 1% confidence level. This suggests that CPU positively moderates the relationship between green innovation and USD. Similarly, as shown in Column (6), when government environmental concern serves as the mediating variable, the interaction term between government environmental concern and CPU yields a coefficient of 0.167, also significantly positive at the 1% level. This indicates that the CPU significantly and positively moderates the relationship between government environmental concerns and USD. Taken together, the results from Columns (2) to (6) suggest that CPU acts as a moderator in the relationship between EID and USD. Specifically, CPU moderates the latter part of the mediation pathways, namely, EID→gp→USD and EID→gec→USD.
Table 9.
The mediated effects are moderated by regression results.
In order to show the adjustment effect more clearly, the mean value of the adjustment variable and the mean value plus or minus one standard deviation were taken, and the moderated mediating effect changes in the three cases were obtained using the Bootstrap method, as shown in Table 9 and Table 10. The results show that when green innovation and government environmental concern serve as mediators, the positive moderating effect strengthens as CPU increases. These findings indicate that in the process by which EID promotes green innovation and government environmental concern, CPU further reinforces this trend. CPU, by incentivizing governments to enhance transparency and disclosure of environmental information, fosters the adoption of more innovative green technologies and solutions, thereby improving the quality and efficiency of green innovation and ultimately advancing USD. In this mechanism, the CPU functions not only as an external challenge but also as a crucial catalyst that encourages governments to prioritize environmental issues and accelerate green transition and sustainable development. In summary, the H3 is empirically supported.
Table 10.
Mediated effects are regulated.
6. Conclusions, Recommendations, and Research Outlook
6.1. Conclusions
This study, from the perspective of modernizing environmental governance, systematically investigates the policy effects and underlying mechanisms of EID on USD. Utilizing panel data from 278 prefecture-level and above cities in China, we treat the implementation of the AAQSs as a quasi-natural experiment and construct a multi-period DID model to rigorously identify the driving effect of EID on USD. This research design aligns closely with our overarching objective of exploring both the overall impact of EID and its causal mechanisms. First, EID significantly promotes USD. This conclusion remains robust after a series of tests, including parallel trend tests and placebo tests, thereby validating the effectiveness of informational regulatory instruments within the modern environmental governance framework. Second, significant spatiotemporal heterogeneity is observed in the policy effects. Spatially, non-provincial capital cities exhibit greater potential for improvement in environmental governance, public resource allocation, and information transparency. Non-resource-dependent cities, with fewer constraints from industrial structure, demonstrate stronger policy responsiveness. Furthermore, in regions with lower levels of economic, environmental, and social sustainability, the positive impact of EID on USD is more pronounced. Third, mechanism analysis reveals that EID fosters USD through two primary channels: stimulating green innovation and enhancing governmental concern for environmental governance. In addition, the moderating effect of CPU suggests that external environmental risks amplify the policy effects of EID. In summary, this study not only validates the proposed research hypotheses but also expands the research paradigm of environmental policy evaluation from a mechanistic perspective, providing empirical support for understanding how EID influences USD within China’s environmental governance system.
6.2. Recommendations
Based on the above findings, this study proposes the following policy recommendations: First, it is essential to improve the environmental information governance system by establishing dynamically optimized disclosure standards and introducing third-party quality assessment mechanisms to ensure the timeliness and comparability of data. Efforts should also be made to upgrade environmental information platforms through intelligent technologies, integrating satellite remote sensing, the Internet of Things, and other diverse data sources to develop a digital twin system for USD. Second, incentives for green innovation should be strengthened. Policymakers are encouraged to support local governments in promoting the innovation and application of green technologies through fiscal subsidies, tax incentives, and dedicated research and development (R&D) funds. Third, governmental concern about environmental issues should be enhanced. The government plays a critical role in EID, particularly in raising public environmental awareness and promoting effective policy implementation. Strengthened governmental focus on environmental issues can ensure the effective enforcement of environmental policies, increase governmental guidance and support, promote cross-sectoral coordination, and, ultimately, improve overall policy effectiveness. Fourth, governments should minimize frequent changes in climate-related policies and maintain policy stability and continuity to alleviate public and societal concerns about policy uncertainty.
6.3. Research Outlook
While this research has made meaningful contributions to both theoretical development and empirical analysis, it still has certain limitations. These issues can be explored from the following aspects in the future: First, this study focuses on the AAQS as the primary environmental policy instrument. Future research could develop a comparative framework that includes other tools, such as environmental taxes and emissions trading schemes, to reflect the diversity of regulatory approaches. Incorporating firm-level microdata and emerging sources like satellite remote sensing may also support a more comprehensive measurement of environmental information transparency, enabling deeper insight into micro-level policy transmission mechanisms. Second, while green innovation and governmental environmental concern are identified as key mediating pathways, their dynamic interaction deserves further investigation. Future studies might also explore alternative channels, such as public environmental behavior and green finance, to better understand the multifaceted effects of environmental policies. Third, adopting a political economy perspective could help examine shifting power dynamics among government, market, and society in environmental governance. This would aid in building a more context-sensitive theoretical framework for USD, especially relevant to developing countries.
Author Contributions
Conceptualization, H.Z.; data curation, W.Q.; formal analysis, H.Z. and W.Q.; software, S.Y.; validation, X.L. and S.G.; writing—original draft, H.Z. and W.Q. All authors have read and agreed to the published version of the manuscript..
Funding
This research was funded by the Social Science Planning Project of Qingdao (CN), QDSKL2401071.
Institutional Review Board Statement
Not applicable.
Informed Consent Statement
Not applicable.
Data Availability Statement
The datasets used and/or analyzed during the current study are available from the corresponding author upon reasonable request.
Conflicts of Interest
The authors declare no conflicts of interest.
Abbreviations
The following abbreviations are used in this manuscript:
| MDPI | Multidisciplinary Digital Publishing Institute |
| DOAJ | Directory of open access journals |
| TLA | Three letter acronym |
| LD | Linear dichroism |
| AAQSs | Ambient Air Quality Standards |
| DID | Difference-in-Differences |
| EID | Environmental information disclosure |
| GDP | Gross Domestic Product |
| PSM–DID | Propensity Score Matching–Difference-in-Differences |
| USD | Urban sustainable development |
References
- Brundtland, G.H. Our Common Future—Call for Action. Environ. Conserv. 1987, 14, 291–294. [Google Scholar] [CrossRef]
- Nasrollahi, Z.; Hashemi, M.; Bameri, S.; Mohamad Taghvaee, V. Environmental Pollution, Economic Growth, Population, Industrialization, and Technology in Weak and Strong Sustainability: Using STIRPAT Model. Environ. Dev. Sustain. 2020, 22, 1105–1122. [Google Scholar] [CrossRef]
- Xuwen, P.; Wenlin, F. Environmental Information Disclosure and Regional Air Quality: A Quasi-Natural Experiment Based on the PM2.5 Monitoring. J. Financ. Econ. 2022, 48, 110–124. [Google Scholar] [CrossRef]
- Dagestani, A.A.; Chen, P.; Du, L.; Hu, J.; Bilan, Y. The Impacts of Urban Development Orientation of Resource-Based Cities on Environmental Information Disclosure and Greenwashing Behavior of Listed Firms in China. Environ. Dev. Sustain. 2024, 1, 26. [Google Scholar] [CrossRef]
- Guo, X.; Xu, J. New Ambient Air Quality Standards, Human Capital Flow, and Economic Growth: Evidence from an Environmental Information Disclosure Policy in China. J. Clean. Prod. 2024, 434, 140168. [Google Scholar] [CrossRef]
- Zhong, S.; Li, J.; Zhao, R. Does Environmental Information Disclosure Promote Sulfur Dioxide (SO2) remove? New Evidence from 113 Cities in China. J. Clean. Prod. 2021, 299, 126906. [Google Scholar] [CrossRef]
- Siming, Y.; Lingli, X.; Peng, D.; Zhaohui, Q.; Qianqian, Z.; Tuanjie, Z. The Impact of Air Pollution on Corporate Environmental Information Disclosure–Evidence from Heavy Pollution Industries in China. Financ. Res. Lett. 2024, 59, 104793. [Google Scholar] [CrossRef]
- Zhang, H.; Xu, T.; Feng, C. Does Public Participation Promote Environmental Efficiency? Evidence from a Quasi-Natural Experiment of Environmental Information Disclosure in China. Energy Econ. 2022, 108, 105871. [Google Scholar] [CrossRef]
- Yu, W.; Jin, X. Does Environmental Information Disclosure Promote the Awakening of Public Environmental Awareness? Insights from Baidu Keyword Analysis. J. Clean. Prod. 2022, 375, 134072. [Google Scholar] [CrossRef]
- Tang, M.; Li, X.; Zhang, Y.; Wu, Y.; Wu, B. From Command-and-Control to Market-Based Environmental Policies: Optimal Transition Timing and China’s Heterogeneous Environmental Effectiveness. Econ. Model. 2020, 90, 1–10. [Google Scholar] [CrossRef]
- Beiser-McGrath, L.F.; Thomas, B.; Prakash, A. Command and Control or Market-Based Instruments? Public Support for Policies to Address Vehicular Pollution in Beijing and New Delhi. Environ. Politics 2023, 32, 586–618. [Google Scholar] [CrossRef]
- Li, J.; Huang, J.; Li, B. Do Command-and-Control Environmental Regulations Realize the Win-Win of “Pollution Reduction” and “Efficiency Improvement” for Enterprises? Evidence from China. Sustain. Dev. 2024, 32, 3271–3292. [Google Scholar] [CrossRef]
- Lamperti, F.; Napoletano, M.; Roventini, A. Green transitions and the prevention of environmental disasters: Market-based vs. command-and-control policies. Macroecon. Dyn. 2020, 24, 1861–1880. [Google Scholar] [CrossRef]
- Li, M.; Gao, X. Implementation of Enterprises’ Green Technology Innovation under Market-Based Environmental Regulation: An Evolutionary Game Approach. J. Environ. Manag. 2022, 308, 114570. [Google Scholar] [CrossRef] [PubMed]
- Aragòn-Correa, J.A.; Marcus, A.A.; Vogel, D. The Effects of Mandatory and Voluntary Regulatory Pressures on Firms’ Environmental Strategies: A Review and Recommendations for Future Research. Acad. Manag. Ann. 2020, 14, 339–365. [Google Scholar] [CrossRef]
- Roelfsema, M.; van Soest, H.L.; Harmsen, M.; van Vuuren, D.P.; Bertram, C.; den Elzen, M.; Höhne, N.; Iacobuta, G.; Krey, V.; Kriegler, E.; et al. Taking Stock of National Climate Policies to Evaluate Implementation of the Paris Agreement. Nat. Commun. 2020, 11, 2096. [Google Scholar] [CrossRef]
- Caputo, F.; Pizzi, S.; Ligorio, L.; Leopizzi, R. Enhancing Environmental Information Transparency through Corporate Social Responsibility Reporting Regulation. Bus. Strategy Environ. 2021, 30, 3470–3484. [Google Scholar] [CrossRef]
- Currie, J.; Voorheis, J.; Walker, R. What Caused Racial Disparities in Particulate Exposure to Fall? New Evidence from the Clean Air Act and Satellite-Based Measures of Air Quality. Am. Econ. Rev. 2023, 113, 71–97. [Google Scholar] [CrossRef]
- Lessmann, C.; Kramer, N. The Effect of Cap-and-Trade on Sectoral Emissions: Evidence from California. Energy Policy 2024, 188, 114066. [Google Scholar] [CrossRef]
- Xie, H.; Wen, J.; Choi, Y. How the SDGs Are Implemented in China—A Comparative Study Based on the Perspective of Policy Instruments. J. Clean. Prod. 2021, 291, 125937. [Google Scholar] [CrossRef]
- Zhang, C.; Khan, I.; Dagar, V.; Saeed, A.; Zafar, M.W. Environmental Impact of Information and Communication Technology: Unveiling the Role of Education in Developing Countries. Technol. Forecast. Social. Chang. 2022, 178, 121570. [Google Scholar] [CrossRef]
- Liu, L.; Pang, L.; Wu, H.; Hafeez, M.; Salahodjaev, R. Does Environmental Policy Stringency Influence CO2 Emissions in the Asia Pacific Region? A Nonlinear Perspective. Air Qual. Atmos. Health 2023, 16, 2499–2508. [Google Scholar] [CrossRef]
- Wang, L.; Shao, J. Environmental Information Disclosure and Energy Efficiency: Empirical Evidence from China. Environ. Dev. Sustain. 2024, 26, 4781–4800. [Google Scholar] [CrossRef]
- Ren, X.; Li, J.; He, F.; Lucey, B. Impact of Climate Policy Uncertainty on Traditional Energy and Green Markets: Evidence from Time-Varying Granger Tests. Renew. Sustain. Energy Rev. 2023, 173, 113058. [Google Scholar] [CrossRef]
- Fabrizio, K.R.; Kim, E.-H. Reluctant Disclosure and Transparency: Evidence from Environmental Disclosures. Organ. Sci. 2019, 30, 1207–1231. [Google Scholar] [CrossRef]
- Feng, Y.; He, F. The Effect of Environmental Information Disclosure on Environmental Quality: Evidence from Chinese Cities. J. Clean. Prod. 2020, 276, 124027. [Google Scholar] [CrossRef]
- Liao, Z.; Zhang, M. Regulatory Distance and Firms’ Environmental Innovation: The Role of Environmental Information Disclosure and Social Trust. Bus. Strategy Environ. 2024, 33, 5529–5539. [Google Scholar] [CrossRef]
- Xie, J.; Nozawa, W.; Yagi, M.; Fujii, H.; Managi, S. Do Environmental, Social, and Governance Activities Improve Corporate Financial Performance? Bus. Strategy Environ. 2019, 28, 286–300. [Google Scholar] [CrossRef]
- Raimo, N.; Caragnano, A.; Zito, M.; Vitolla, F.; Mariani, M. Extending the Benefits of ESG Disclosure: The Effect on the Cost of Debt Financing. Corp. Social. Responsib. Environ. Manag. 2021, 28, 1412–1421. [Google Scholar] [CrossRef]
- Huang, H.; Zou, Y.; Wang, L.; Wang, W.; Ren, X. Impact of Carbon Information Disclosure on Corporate Financing Constraints: Evidence from the Carbon Disclosure Project. Aust. J. Manag. 2025, 50, 104–131. [Google Scholar] [CrossRef]
- Murphy, J.; Gouldson, A. Environmental Policy and Industrial Innovation: Integrating Environment and Economy Through Ecological Modernisation. In The Ecological Modernisation Reader; Routledge: London, UK, 2009; ISBN 978-1-003-06106-9. [Google Scholar]
- Liu, S.; Liu, C.; Yang, M. The Effects of National Environmental Information Disclosure Program on the Upgradation of Regional Industrial Structure: Evidence from 286 Prefecture-Level Cities in China. Struct. Change Econ. Dyn. 2021, 58, 552–561. [Google Scholar] [CrossRef]
- Feleki, E.; Vlachokostas, C.; Moussiopoulos, N. Characterisation of Sustainability in Urban Areas: An Analysis of Assessment Tools with Emphasis on European Cities. Sustain. Cities Soc. 2018, 43, 563–577. [Google Scholar] [CrossRef]
- Verma, P.; Raghubanshi, A.S. Urban Sustainability Indicators: Challenges and Opportunities. Ecol. Indic. 2018, 93, 282–291. [Google Scholar] [CrossRef]
- Kwatra, S.; Kumar, A.; Sharma, P. A Critical Review of Studies Related to Construction and Computation of Sustainable Development Indices. Ecol. Indic. 2020, 112, 106061. [Google Scholar] [CrossRef]
- Montoya, J.; Cartes, I.; Zumelzu, A. Indicators for Evaluating Sustainability in Bogota’s Informal Settlements: Definition and Validation. Sustain. Cities Soc. 2020, 53, 101896. [Google Scholar] [CrossRef]
- Gebara, C.H.; Thammaraksa, C.; Hauschild, M.; Laurent, A. Selecting Indicators for Measuring Progress towards Sustainable Development Goals at the Global, National and Corporate Levels. Sustain. Prod. Consum. 2024, 44, 151–165. [Google Scholar] [CrossRef]
- Nilsson, M.; Chisholm, E.; Griggs, D.; Howden-Chapman, P.; McCollum, D.; Messerli, P.; Neumann, B.; Stevance, A.-S.; Visbeck, M.; Stafford-Smith, M. Mapping Interactions between the Sustainable Development Goals: Lessons Learned and Ways Forward. Sustain. Sci. 2018, 13, 1489–1503. [Google Scholar] [CrossRef]
- Liu, J.; Hull, V.; Godfray, H.C.J.; Tilman, D.; Gleick, P.; Hoff, H.; Pahl-Wostl, C.; Xu, Z.; Chung, M.G.; Sun, J.; et al. Nexus Approaches to Global Sustainable Development. Nat. Sustain. 2018, 1, 466–476. [Google Scholar] [CrossRef]
- Warchold, A.; Pradhan, P.; Kropp, J.P. Variations in Sustainable Development Goal Interactions: Population, Regional, and Income Disaggregation. Sustain. Dev. 2021, 29, 285–299. [Google Scholar] [CrossRef]
- Demirkale, O.; Duran, N.I. China’s Sustainable Development under Climate, Energy and Policy Uncertainty: A Focus on SDG 7 and SDG 13. Int. J. Energy Econ. Policy 2025, 15, 532–540. [Google Scholar] [CrossRef]
- Muganyi, T.; Yan, L.; Sun, H. Green Finance, Fintech and Environmental Protection: Evidence from China. Environ. Sci. Ecotechnol. 2021, 7, 100107. [Google Scholar] [CrossRef] [PubMed]
- Zope, R.; Vasudevan, N.; Arkatkar, S.S.; Joshi, G. Benchmarking: A Tool for Evaluation and Monitoring Sustainability of Urban Transport System in Metropolitan Cities of India. Sustain. Cities Soc. 2019, 45, 48–58. [Google Scholar] [CrossRef]
- Liu, B.; Yang, Z.; Xue, B.; Zhao, D.; Sun, X.; Wang, W. Formalizing an Integrated Metric System Measuring Performance of Urban Sustainability: Evidence from China. Sustain. Cities Soc. 2022, 79, 103702. [Google Scholar] [CrossRef]
- Beccarello, M.; Di Foggia, G. Sustainable Development Goals Data-Driven Local Policy: Focus on SDG 11 and SDG 12. Adm. Sci. 2022, 12, 167. [Google Scholar] [CrossRef]
- Chan, R.Y.K.; Lai, J.W.M.; Kim, N. Strategic Motives and Performance Implications of Proactive versus Reactive Environmental Strategies in Corporate Sustainable Development. Bus. Strategy Environ. 2022, 31, 2127–2142. [Google Scholar] [CrossRef]
- Ge, T.; Qiu, W.; Li, J.; Hao, X. The Impact of Environmental Regulation Efficiency Loss on Inclusive Growth: Evidence from China. J. Environ. Manag. 2020, 268, 110700. [Google Scholar] [CrossRef]
- Zhou, B.; Wu, J.; Guo, S.; Hu, M.; Wang, J. Environmental Regulation and Financial Performance of Chinese Listed Companies. PLoS ONE 2020, 15, e0244083. [Google Scholar] [CrossRef]
- Ouyang, X.; Liao, J.; Sun, C.; Cao, Y. Measure Is Treasure: Revisiting the Role of Environmental Regulation in Chinese Industrial Green Productivity. Environ. Impact Assess. Rev. 2023, 98, 106968. [Google Scholar] [CrossRef]
- Li, G.; Xue, Q.; Qin, J. Environmental Information Disclosure and Green Technology Innovation: Empirical Evidence from China. Technol. Forecast. Social. Chang. 2022, 176, 121453. [Google Scholar] [CrossRef]
- Lu, J.; Wang, J. Corporate Governance, Law, Culture, Environmental Performance and CSR Disclosure: A Global Perspective. J. Int. Financ. Mark. Inst. Money 2021, 70, 101264. [Google Scholar] [CrossRef]
- Lagasio, V.; Cucari, N. Corporate Governance and Environmental Social Governance Disclosure: A Meta-Analytical Review. Corp. Social. Responsib. Environ. Manag. 2019, 26, 701–711. [Google Scholar] [CrossRef]
- Huang, M.; Li, X. Exploring the Impact of Ambient Air Quality Standards on Firm Innovation: Evidence from Listed Industrial Companies in China. Int. J. Emerg. Mark. 2023, 20, 787–804. [Google Scholar] [CrossRef]
- Li, Y.; Zhang, X.; Yao, T.; Sake, A.; Liu, X.; Peng, N. The Developing Trends and Driving Factors of Environmental Information Disclosure in China. J. Environ. Manag. 2021, 288, 112386. [Google Scholar] [CrossRef]
- Ahmad, N.; Li, H.-Z.; Tian, X.-L. Increased Firm Profitability under a Nationwide Environmental Information Disclosure Program? Evidence from China. J. Clean. Prod. 2019, 230, 1176–1187. [Google Scholar] [CrossRef]
- Dhar, B.K.; Sarkar, S.M.; Ayittey, F.K. Impact of Social Responsibility Disclosure between Implementation of Green Accounting and Sustainable Development: A Study on Heavily Polluting Companies in Bangladesh. Corp. Social. Responsib. Environ. Manag. 2022, 29, 71–78. [Google Scholar] [CrossRef]
- Luo, W.; Guo, X.; Zhong, S.; Wang, J. Environmental Information Disclosure Quality, Media Attention and Debt Financing Costs: Evidence from Chinese Heavy Polluting Listed Companies. J. Clean. Prod. 2019, 231, 268–277. [Google Scholar] [CrossRef]
- Wang, B.; Ma, Y.; Luo, B.; Shi, D.; Jiang, S. Environmental Supervision Distance, Government-Enterprise Collusion and Corporate Environmental Information Disclosure. Int. Rev. Econ. Financ. 2024, 96, 103710. [Google Scholar] [CrossRef]
- Jager, N.W.; Newig, J.; Challies, E.; Kochskämper, E. Pathways to Implementation: Evidence on How Participation in Environmental Governance Impacts on Environmental Outcomes. J. Public Adm. Res. Theory 2019, 30, 383–399. [Google Scholar] [CrossRef]
- Deng, Y.; Yue, Q.; Zhao, X. What Does Air Quality Information Disclosure Deliver and to Whom? Evidence from the Ambient Air Quality Standard (2012) Program in China. Environ. Resour. Econ. 2024, 87, 2859–2887. [Google Scholar] [CrossRef]
- Lu, Z.; Li, H. Does Environmental Information Disclosure Affect Green Innovation? Econ. Anal. Policy 2023, 80, 47–59. [Google Scholar] [CrossRef]
- Lin, B.; Ma, R. Green Technology Innovations, Urban Innovation Environment and CO2 Emission Reduction in China: Fresh Evidence from a Partially Linear Functional-Coefficient Panel Model. Technol. Forecast. Social. Chang. 2022, 176, 121434. [Google Scholar] [CrossRef]
- He, Z.; Cao, C.; Feng, C. Media Attention, Environmental Information Disclosure and Corporate Green Technology Innovations in China’s Heavily Polluting Industries. Emerg. Mark. Financ. Trade 2022, 58, 3939–3952. [Google Scholar] [CrossRef]
- Mak, H.W.L.; Lam, Y.F. Comparative Assessments and Insights of Data Openness of 50 Smart Cities in Air Quality Aspects. Sustain. Cities Soc. 2021, 69, 102868. [Google Scholar] [CrossRef]
- Irfan, M.; Razzaq, A.; Sharif, A.; Yang, X. Influence Mechanism between Green Finance and Green Innovation: Exploring Regional Policy Intervention Effects in China. Technol. Forecast. Social. Chang. 2022, 182, 121882. [Google Scholar] [CrossRef]
- Hu, S.; Wang, M.; Wu, M.; Wang, A. Voluntary Environmental Regulations, Greenwashing and Green Innovation: Empirical Study of China’s ISO14001 Certification. Environ. Impact Assess. Rev. 2023, 102, 107224. [Google Scholar] [CrossRef]
- Kirikkaleli, D.; Adebayo, T.S. Political Risk and Environmental Quality in Brazil: Role of Green Finance and Green Innovation. Int. J. Financ. Econ. 2024, 29, 1205–1218. [Google Scholar] [CrossRef]
- Tian, X.-L.; Guo, Q.-G.; Han, C.; Ahmad, N. Different Extent of Environmental Information Disclosure across Chinese Cities: Contributing Factors and Correlation with Local Pollution. Glob. Environ. Chang. 2016, 39, 244–257. [Google Scholar] [CrossRef]
- Lou, K.; Zhu, X. The Pollution Abatement Effect of EnvironmentalInformation Disclosure:Based on Quasi-Natural Experiments. Pol. J. Environ. Stud. 2025, 34, 1269–1284. [Google Scholar] [CrossRef]
- Pan, D.; Fan, W.; Kong, F. Dose Environmental Information Disclosure Raise Public Environmental Concern? Generalized Propensity Score Evidence from China. J. Clean. Prod. 2022, 379, 134640. [Google Scholar] [CrossRef]
- Prokop, V.; Gerstlberger, W.; Vrabcová, P.; Zapletal, D.; Sein, Y.Y. Does Being Stricter Mean Doing Better? Different Effects of Environmental Policy Stringency on Quality of Life, Green Innovation, and International Cooperation. Heliyon 2023, 9. [Google Scholar] [CrossRef]
- Li, C.; Chen, Z.; Jiang, Q.; Yue, M.; Wu, L.; Bao, Y.; Huang, B.; Wang, A.B.; Tan, Y.; Xu, Z. Impacts of Government Attention on Achieving Sustainable Development Goals: Evidence from China. Geogr. Sustain. 2025, 6, 100233. [Google Scholar] [CrossRef]
- Xiong, L.; Long, H.; Zhang, X.; Yu, C.; Wen, Z. Can Environmental Information Disclosure Reduce Air Pollution? Evidence from China. Front. Environ. Sci. 2023, 11, 1126565. [Google Scholar] [CrossRef]
- Fried, S.; Novan, K.M.; Peterman, W. The Macro Effects of Climate Policy Uncertainty. In Finance and Economics Discussion Series 2021-018; Board of Governors of the Federal Reserve System (U.S.): Washington, DC, USA, 2021. [Google Scholar] [CrossRef]
- Hoang, H.V. Environmental, Social, and Governance Disclosure in Response to Climate Policy Uncertainty: Evidence from US Firms. Environ. Dev. Sustain. 2024, 26, 4293–4333. [Google Scholar] [CrossRef]
- Liang, C.; Umar, M.; Ma, F.; Huynh, T.L.D. Climate Policy Uncertainty and World Renewable Energy Index Volatility Forecasting. Technol. Forecast. Social. Chang. 2022, 182, 121810. [Google Scholar] [CrossRef]
- Bouri, E.; Iqbal, N.; Klein, T. Climate Policy Uncertainty and the Price Dynamics of Green and Brown Energy Stocks. Financ. Res. Lett. 2022, 47, 102740. [Google Scholar] [CrossRef]
- Guesmi, K.; Makrychoriti, P.; Spyrou, S. The Relationship between Climate Risk, Climate Policy Uncertainty, and CO2 Emissions: Empirical Evidence from the US. J. Econ. Behav. Organ. 2023, 212, 610–628. [Google Scholar] [CrossRef]
- Huang, X.; Liu, W.; Zhang, Z.; Zou, X.; Li, P. Quantity or Quality: Environmental Legislation and Corporate Green Innovations. Ecol. Econ. 2023, 204, 107684. [Google Scholar] [CrossRef]
- Hickel, J. The Sustainable Development Index: Measuring the Ecological Efficiency of Human Development in the Anthropocene. Ecol. Econ. 2020, 167, 106331. [Google Scholar] [CrossRef]
- Faccini, R.; Matin, R.; Skiadopoulos, G. Dissecting Climate Risks: Are They Reflected in Stock Prices? J. Bank. Financ. 2023, 155, 106948. [Google Scholar] [CrossRef]
- Ma, Y.-R.; Liu, Z.; Ma, D.; Zhai, P.; Guo, K.; Zhang, D.; Ji, Q. A News-Based Climate Policy Uncertainty Index for China. Sci. Data 2023, 10, 881. [Google Scholar] [CrossRef] [PubMed]
- Jiang, X.; Jiang, F.; Sheng, S.; Wang, G. A Moderated Mediation Model Linking Entrepreneurial Orientation to Strategic Alliance Performance. Br. J. Manag. 2021, 32, 1338–1358. [Google Scholar] [CrossRef]
Disclaimer/Publisher’s Note: The statements, opinions and data contained in all publications are solely those of the individual author(s) and contributor(s) and not of MDPI and/or the editor(s). MDPI and/or the editor(s) disclaim responsibility for any injury to people or property resulting from any ideas, methods, instructions or products referred to in the content. |
© 2025 by the authors. Licensee MDPI, Basel, Switzerland. This article is an open access article distributed under the terms and conditions of the Creative Commons Attribution (CC BY) license (https://creativecommons.org/licenses/by/4.0/).