Article

Optimisation of the Production Process of Ironing Refractory Products Using the OEE Indicator as Part of Innovative Solutions for Sustainable Production

by
Mariusz Niekurzak
1,* and
Wojciech Lewicki
2,*
1
Faculty of Management, AGH University of Krakow, 30-067 Krakow, Poland
2
Faculty of Economics, West Pomeranian University of Technology, 71-210 Szczecin, Poland
*
Authors to whom correspondence should be addressed.
Sustainability 2025, 17(11), 4779; https://doi.org/10.3390/su17114779
Submission received: 18 April 2025 / Revised: 19 May 2025 / Accepted: 21 May 2025 / Published: 22 May 2025
(This article belongs to the Special Issue Recent Advances in Modern Technologies for Sustainable Manufacturing)

Abstract

:
The article addresses the problem of optimising a selected production process in a company from the refractory products industry. As part of the research, individual activities were divided, identifying key wastes occurring in the production process. In addition, the 5S (the 5S methodology—Sort, Set in Order, Shine, Standardise, and Sustain) quality system was modified, its efficiency was increased, and a better work organisation was established based on it. Data from the actual production process were analysed based on total work efficiency using the OEE (Overall Equipment Effectiveness) coefficient. The use of machine working time was indicated, and key parameters were determined, i.e., availability, efficiency, and quality of the implemented production processes. The results obtained in the course of the research were compared to the Word Class OEE standards. The goal of the work is to indicate possibilities and recommendations for increasing production efficiency without increasing costs, thanks to actions reducing the number of production defects and optimal distribution of employees on the production line. The presented analyses can help assess the management processes of other manufacturing companies operating in this highly specialised manufacturing sector. At the same time, the research conclusions enable other entities to evaluate the implementation of the proposed solutions in practice without incurring unnecessary financial outlays on improving production processes.

1. Introduction

The reality around us, rapidly changing energy prices and availability of materials, has become a challenge for every manufacturing company. Despite market differences and problems specific to individual types of production or countries, one global challenge can be distinguished and the doubts that go hand in hand with it, which concern all manufacturers, and this global challenge is the optimisation of production processes. Optimisation in an enterprise is a constant pursuit of finding the best possible solutions, taking into account the appropriate priorities of the criteria and parameters that guide the company should be guided. It involves finding processes or activities that, with minimal expenditure, could achieve the best possible results, while meeting all quality standards and customers expectations for the produced products. Optimisation of the production process is a key task of every enterprise [1,2,3]. This maximises profits while minimising costs and promoting continuous improvement. Each company struggles with qualitative, performance, and staffing problems, more than once, due to the growing demand for its products. Sustainable development policies are increasingly appearing in corporate strategies. At the operational level, especially in the case of small and medium-sized enterprises, there are numerous problems related to the selection of appropriate indicators, the assessment of the current state, and the identification of areas requiring improvement. It was noted that many factors slow down the production process [4,5,6]. An attempt to improve efficiency and assess the level of sustainable development of enterprises is the primary goal of the analysed work. The authors present the main assumptions of the methodology and an example of its application. The basic measure used to verify the efficiency of machines and processes, OEE, is production [7,8,9,10,11]. This indicator is a method of measuring and visualising data, showing how effectively production resources are used in the company. Due to the prevailing variability, including rapid increases in energy and component prices, the assessment of this indicator becomes crucial, which allows for comparisons and optimisation of production in terms of profitability.
The work aims to improve the functioning of the production process and its optimisation based on the parameters of the OEE indicator, taking into account the appropriate criteria and the most effective use of the bottleneck, as well as shortening the machine’s work cycle time, specifically for the water press. The choice of this indicator was not accidental, as process standardisation and understanding the OEE indicator are key to eliminating waste, continuous improvement, and meeting increasingly higher customer requirements. As part of the research, optimisation was analysed through the prism of the 5S standard. The results of the workshop were presented in an attempt to optimise the production of TS-type fittings (industry name characterised by T shape), and the corrective actions were understood. The bottlenecks were defined and located, and solutions were suggested [8,12,13,14]. Selected materials of the collected data of the parameters of the work cooperation of the machine with a carousel were also analysed, and solutions were proposed based on observations [15,16,17]. The article is designed to present a real company’s case study analysis, highlighting the most frequently made measuring errors and the implementation of OEE measures. The work focused on the calculation of the indicator for various random factors occurring in the production process. The obtained results enabled the improvement of the efficiency of the production process and also reflected the potential of unused production capacity. The purpose of the article is to present a critical analysis of the OEE indicator as an effective way to implement Lean Management solutions in the analysed company. The research method was used for conceptual work and a method of critical analysis, synthesis, and logical inference. The obtained results allowed the creation of new standards of staff proceedings and foundations to implement subsequent tools. In addition, the obtained results lead to the achievement of a long-term goal, which is an increase in efficiency, and thus an increase in the value of the enterprise.
The motivation for taking up the topic was the growing quantities of orders and limited production capabilities, such as the capacity of the machine and the carousel. The research has an application dimension in a real production environment. The collected data parameters of the machine from the selected two months were analysed, and the OEE indicator for each day was calculated. Based on the calculations from the collected data, the optimal conditions that would have to be met for an OEE World Class level (>85%) were suggested [18]. Additionally, based on the observation of the work cooperation of the carousel with the machine, as well as the work of the machine itself, optimisation solutions were proposed to significantly reduce the time of a single machine work cycle, improving its performance. The entire consideration was made for a plant producing ceramic refractory products. The focus is on two stages of the production process—production and ironing (covered with appropriate mixtures, specially dedicated) forms from polyurethane. The research object is data from two selected months on the work parameters of the water press machine and the work of the carousel.
The novelty of this article is the holistic approach to the analysis and assessment of the real production environment concerning the production of special-purpose products based on OEE, which has undoubtedly become the standard for measuring the efficiency of equipment used in manufacturing companies. To our knowledge, this is the first approach covering such a comprehensive analysis of production optimisation taking into account the contemporary requirements of Industry 4.0 for this market sector. The presented research, therefore, fills a gap in the literature, introducing a new perspective in such research areas, such as the following: (I) OEE, (II) production process, (III) efficiency, (IV) sustainable production.
The structure of the article is as follows. Section 2 is based on knowledge, experience, the national literature, and foreign production processes of a company producing high-quality refractory ceramics, as well as bottlenecks, which are indicated in the production process and optimisation possibilities. Section 3 describes the research methods used to analyse the research problem. Section 4 describes and discusses the results. Section 5 presents conclusions and perspectives for future research.

2. Research Background

2.1. Structure of the Research Problem in the Analysed Company

The company manufactures, sells, and designs high-quality ceramics, refractories, and control systems for demanding industrial applications, and manufactures products and solutions for industry. The company is distinguished by its reliability, technology, and comprehensive service. The basic element of the production process at the department where the research was conducted is the pressing stage, which is performed isostatically. This means that pressure is injected into the press tank, which is filled with water. The pressure exerted on the water acts on the flexible moulds, giving the finished shapes the desired shape, and properly compacts, into a compact unit, the mixture inside. The plant in the selected department uses such equipment and machinery as a water press, a washing machine, an automated carousel, moving tables (operation: up–down), and moving tables (operation: up–down) equipped with vibration at workstations for filling the moulds with the appropriate mixes, as well as dryers and industrial ovens used successively for drying and firing the pressed moulds, and a so-called “transfercar” moving along a line. The “transfercar” moves on rails in a rectilinear motion, used for transporting carts with mouldings. In the surveyed area of the plant at the site of manufacturing and pressing of refractory products, the work performed by operators is of a craft nature because the backfilling of moulds, due to their nature and technological process, cannot be replaced by machines.
The production process includes all phenomena and intentionally undertaken actions that make the desired changes gradually occur in the subject of work, undergoing their impact. By accumulating, they cause successive acquisition by the subject of the features, bringing them and making them part of the intended product. Achieving all required features in the expected dimension means the end of the production process. The diagram of the detailed production process in the analysed company is shown in Figure 1.
Ceramic materials in the contemporary understanding of the word are materials obtained from inorganic substances with high thermal durability. The production of refractory ceramic products formed from loose masses is a complex, time-consuming, and demanding process. The whole cycle from a dry packing mixture takes several days in which the product passes through several technological and quality processes. The work focused on the production process of their ironing, which is a sensitive production process. In the first stage, the forms are overwhelmed by the scheme shown in Figure 2.
The next stage of production, which will be taken into account in the optimisation analysis, is to dismantle forms. Here, as in the case of backfilling forms, their undressing has its specific time depending on the number of forms on the disc and on the number of activities to perform. The scheme of individual workstations, the concept of the carousel, and the location of water work are shown in Figure 3.
The ironing stage takes place between the first and second stages. It consists of the fact that the form, along with the material, is closed in a sealed press and flooded with water, and then, on the inside, water is pressed under immense pressure. Thanks to the elastic form made of polyurethane, the mixture thickens, and then its hardening occurs. Thanks to this, forms can take any shape. The water press scheme is shown in Figure 4.

2.2. Review Literature

The OEE coefficient is a key tool in production efficiency management. Its main goal is to identify opportunities to improve the use of machines and eliminate losses related to their operation [4,6,9,13,19,20,21]. OEE provides information on three basic aspects: machine availability, production efficiency, and the quality of manufactured products. A key element of effective OEE implementation is the involvement of employees who operate machines daily. They have the best knowledge of the specifics of equipment operation and potential problems that can affect production efficiency [5,7,22,23,24,25]. Therefore, it is important that operators are properly trained, understand how OEE is calculated, what factors affect it, and actively participate in collecting the data needed for its calculation [11,12,13,26]. Visualisation of OEE results in the workplace, for example, in the form of graphs, is key to promoting a culture of continuous improvement and motivating teams to improve results [15,17,27].
Implementing OEE allows for ongoing monitoring of machine efficiency, identification of sources of waste, and undertaking appropriate corrective actions [4,22,28,29,30]. Thanks to OEE, companies can not only increase production efficiency and quality, but also better plan the operation of machines, which leads to savings and avoidance of unnecessary investments in new devices [5,9,12,22,31,32,33]. In the long term, the goal is to achieve 100% utilisation of the machine park and zero-defect production, which is possible thanks to continuous process improvement [2,19,23,34]. Operational efficiency is one of the factors determining the properties in a set of systems [3,6,15,24,35,36,37]. The efficiency of the system is influenced by pre-operational factors, i.e., necessary actions and primary outlays related to given system features, features surrounding this system, and operating factors recognised in the operation process [22,23,24,25,26,30,38,39,40]. A significant role in the management of machines in a company is played by maintenance services. The issue of maintaining machines in every company is associated with many problems, such as designing technical equipment and machines so that they can be used in an increasingly simple way, but at the cost of increasingly difficult maintenance of machines in a serviceable state, because this is associated with a more complex structure [9,16,36,41,42,43]. The more complex the devices and structures, the more expensive they are, so special efforts should be made to ensure that they can be used as long as possible, for economic reasons. The high efficiency of current machines means that losses caused by failures are very high [2,9,22,30,31,32,33,34,44]. The chance of defects in automatic machines is much greater than in conventional machines. Failures pose a significant threat to nature and society [39,44,45]. Greater competitiveness causes a decrease in the company’s income, and its maintenance is due to the company’s technological machine system [22,28,34,46,47,48,49,50]. An inseparable element responsible for assessing the effectiveness of the functioning of devices in a company is the use of various measures. All information obtained from the measurements of the given indicators is a basic database of information on the need to make various types of decisions. There are many ways in which we can obtain information on whether individual machines and technological machines are working well, but the most important thing is to determine what is being measured [38,41,46,51,52,53]. Therefore, it is necessary to rely on appropriate measures that are used to assess the activities carried out in connection with the specific goals of the organisation [11,17,29,35,54,55,56,57]. We can use various assessment criteria to assess the effectiveness of the system [58].
Measuring challenges in the context of OEE are mainly due to the necessity of accurate and precise collection of data on working time, downtime, and product quality. OEE, used as a KPI (Key Performance Indicator), allows you to identify areas requiring improvements, but to be possible, reliable data are needed.
Measurement challenges:
  • Thorough definition and measurement of working time:
The difficulty is to precisely determine when the machine is turned on and works, and when it is in downtime, even if it is not physically turned off.
  • Identification and classification of downtime:
It is important to distinguish between planned downtime (e.g., maintenance, changes) and unplanned downtime (e.g., failures) and to determine their causes.
  • Product quality measurement:
Requires monitoring of quality indicators, such as the number of defective products, to be able to determine how many products meet the standards and how many are defined.
  • Restrictions on access to data:
Not all machines and processes are equipped with automatic data collection systems, which hinders precise OEE calculations.
  • Data standardisation and comparability:
Various measuring systems and definitions are used, which makes it difficult to compare OEE results and trend identification.
  • Impact of external factors:
Some production processes are more susceptible to external factors, such as changing working conditions or supplies of raw materials.
The beneficial effects of using OEE as a KPI:
  • Identification of areas to improve:
OEE allows for a thorough analysis of the causes of downtime and defects, which allows you to direct repair activities to the most needed places.
  • Monitoring of progress:
OEE allows you to track progress in improving the efficiency and quality of production, which helps in achieving goals.
  • Prioritising optimisation activities:
OEE allows you to identify areas with the highest potential to improve, which makes it easier Planning optimisation activities.
  • Support in making decisions:
OEE can be used to support in making decisions regarding investment in new machines and technologies, as well as in the organisational and personnel field.
To effectively use OEE as KPIs, it is necessary to develop a coherent measurement system that takes into account the specificity of the production plant and provides precise and reliable data.
When analysing the introduction of OEE in a specific company in 2021, the need to monitor production processes and identify sources of waste was noted. The implementation of an IT system for OEE visualisation was aimed at improving the monitoring of machine efficiency. In 2025, a diagnosis of the functioning of this system was carried out, the aim of which was to adapt it to the needs of the company and to assess the effectiveness of OEE calculations. The results of the analysis and the proposed corrective actions can be successfully applied in other companies that want to improve the efficiency of using their machinery. In this way, OEE becomes not only an analysis tool but also the foundation of the lean manufacturing philosophy, promoting continuous improvement and elimination of losses.

3. Materials and Methods

3.1. System 5S as One of the Basic Lean Management Tools

The 5S principle is a methodology for creating and maintaining a well-organised, clean, highly efficient workplace. It is a preliminary condition for the implementation of visual control. This rule defines five levels of workplace organisation [22,34,48,59,60]:
1S = semi = sort = selection—elimination of unnecessary materials,
2S = seitan = storage = systematics—a place for everything,
3S = season = shine = czystość—cleaning, cleaning, removing waste, dirt,
4S = secrets = standardise = standardisation—a permanent place for things, constant rules for organising and maintaining cleanliness,
5S = sustain = self-discipline—automatic implementation by rules.
The implementation of the 5S technique is aimed at reducing waste, improving quality management, increasing the organisation’s efficiency, as well as optimisation of the processes taking place in it and eliminating processes that do not add value to the manufactured product (or service). The 5S also serves to increase the sense of responsibility of employees for the tools, activities and processes related to their workplace. The effects of effective implementation of the 5S system in the organisation, answering the question: “What is 5S?” You cannot ignore the benefits of its implementation, which include the following [12,34,56,61]:
-
Improving the quality of produced products, following the simplification of the environment in the work environment, reduction in the number of errors and defects and standardisation of operations;
-
An increase in productivity, which is dealing with shortening the time of order processing, shortening the cycle time, shift improvements, eliminating lost time on searching for time tools, as well as reducing the time of reckoning;
-
Reduction in costs thanks to savings obtained by reducing stocks, and thus, reducing fees for the used production and warehouse space, as well as increasing safety at the workplace (and as a result, reducing the costs of staff treatment as a result of possible accidents).
The 5S tools introduced conscientiously and systematically bring long-term, measurable benefits. In the final, these small changes lead to the optimisation of processes and the obtaining of the desired results.

3.2. OEE Optimisation Methodology

The OEE indicator describes three basic areas of the company’s activity: availability, efficiency of use and the quality of produced products. The calculation of the OEE indicator allows you to define improvement activities in the scope of implemented production processes, allows you to measure their effect after implementation and eliminates existing problems. It allows you to identify bottlenecks and the main problems of the company. The OEE indicator, i.e., the efficiency of using the equipment, allows for a percentage of the degree of use of production machines. It is an indicator presented as the product of availability, use and quality indicators [12,35,62,63]:
OEE = A·E·Q
where
A—availability,
E—efficiency,
Q—quality.
The availability indicator is a relationship between the planned working time in a given period to the actual working time of the machine in the same period. It is expressed in the pattern:
A = APT/PBT
where
APT—real working time of the machine,
PBT—planned machine working time.
The use (efficiency) indicator is the ratio of normative unit time to the actual time needed to make 1 item. It is expressed in the pattern:
E = PRI/(APT/PQ) = PRI·PQ/APT
where
PRI—planned individual time,
PQ—number of products made,
APT—real working time of the machine.
The quality indicator is the ratio of good products to the total number of products produced in a given period. It is expressed in the pattern:
Q = GQ/PQ
where
GQ—number of good products,
PQ—the number of all products made.
OEE turns towards the process, i.e., it takes into account not only the time of machine availability but also performance (actual performance/nominal performance) and the quality factor (number of good pieces/entire production). Its essence consists of comparing the use of the machine for ideal use, which occurs when production and its preparation are carried out as planned.

4. Results and Discussion

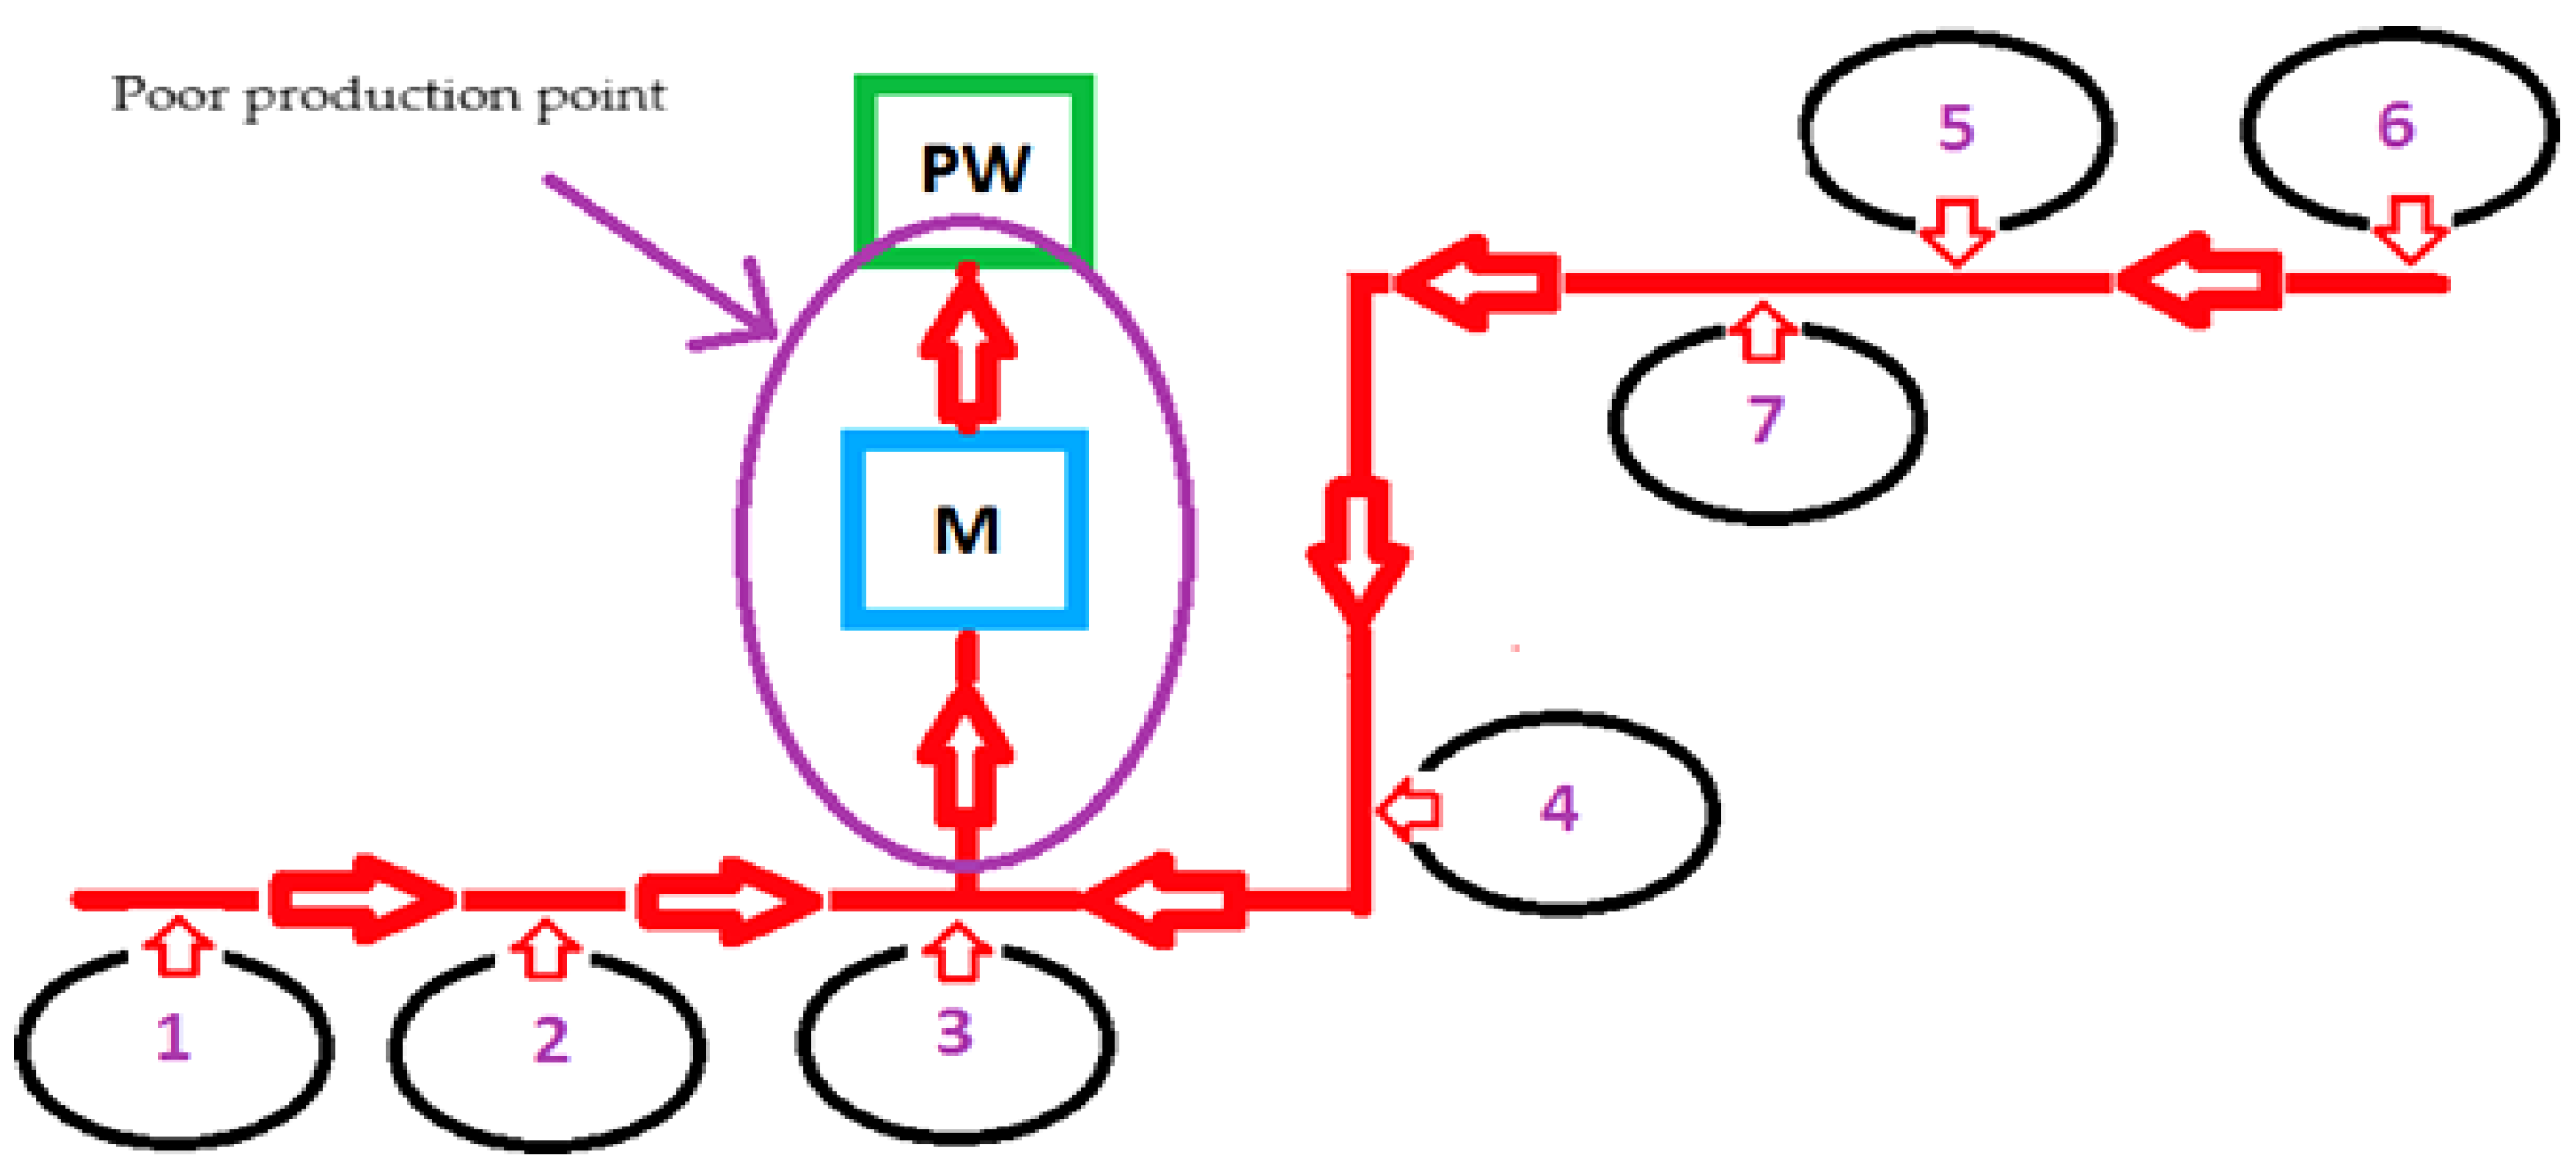
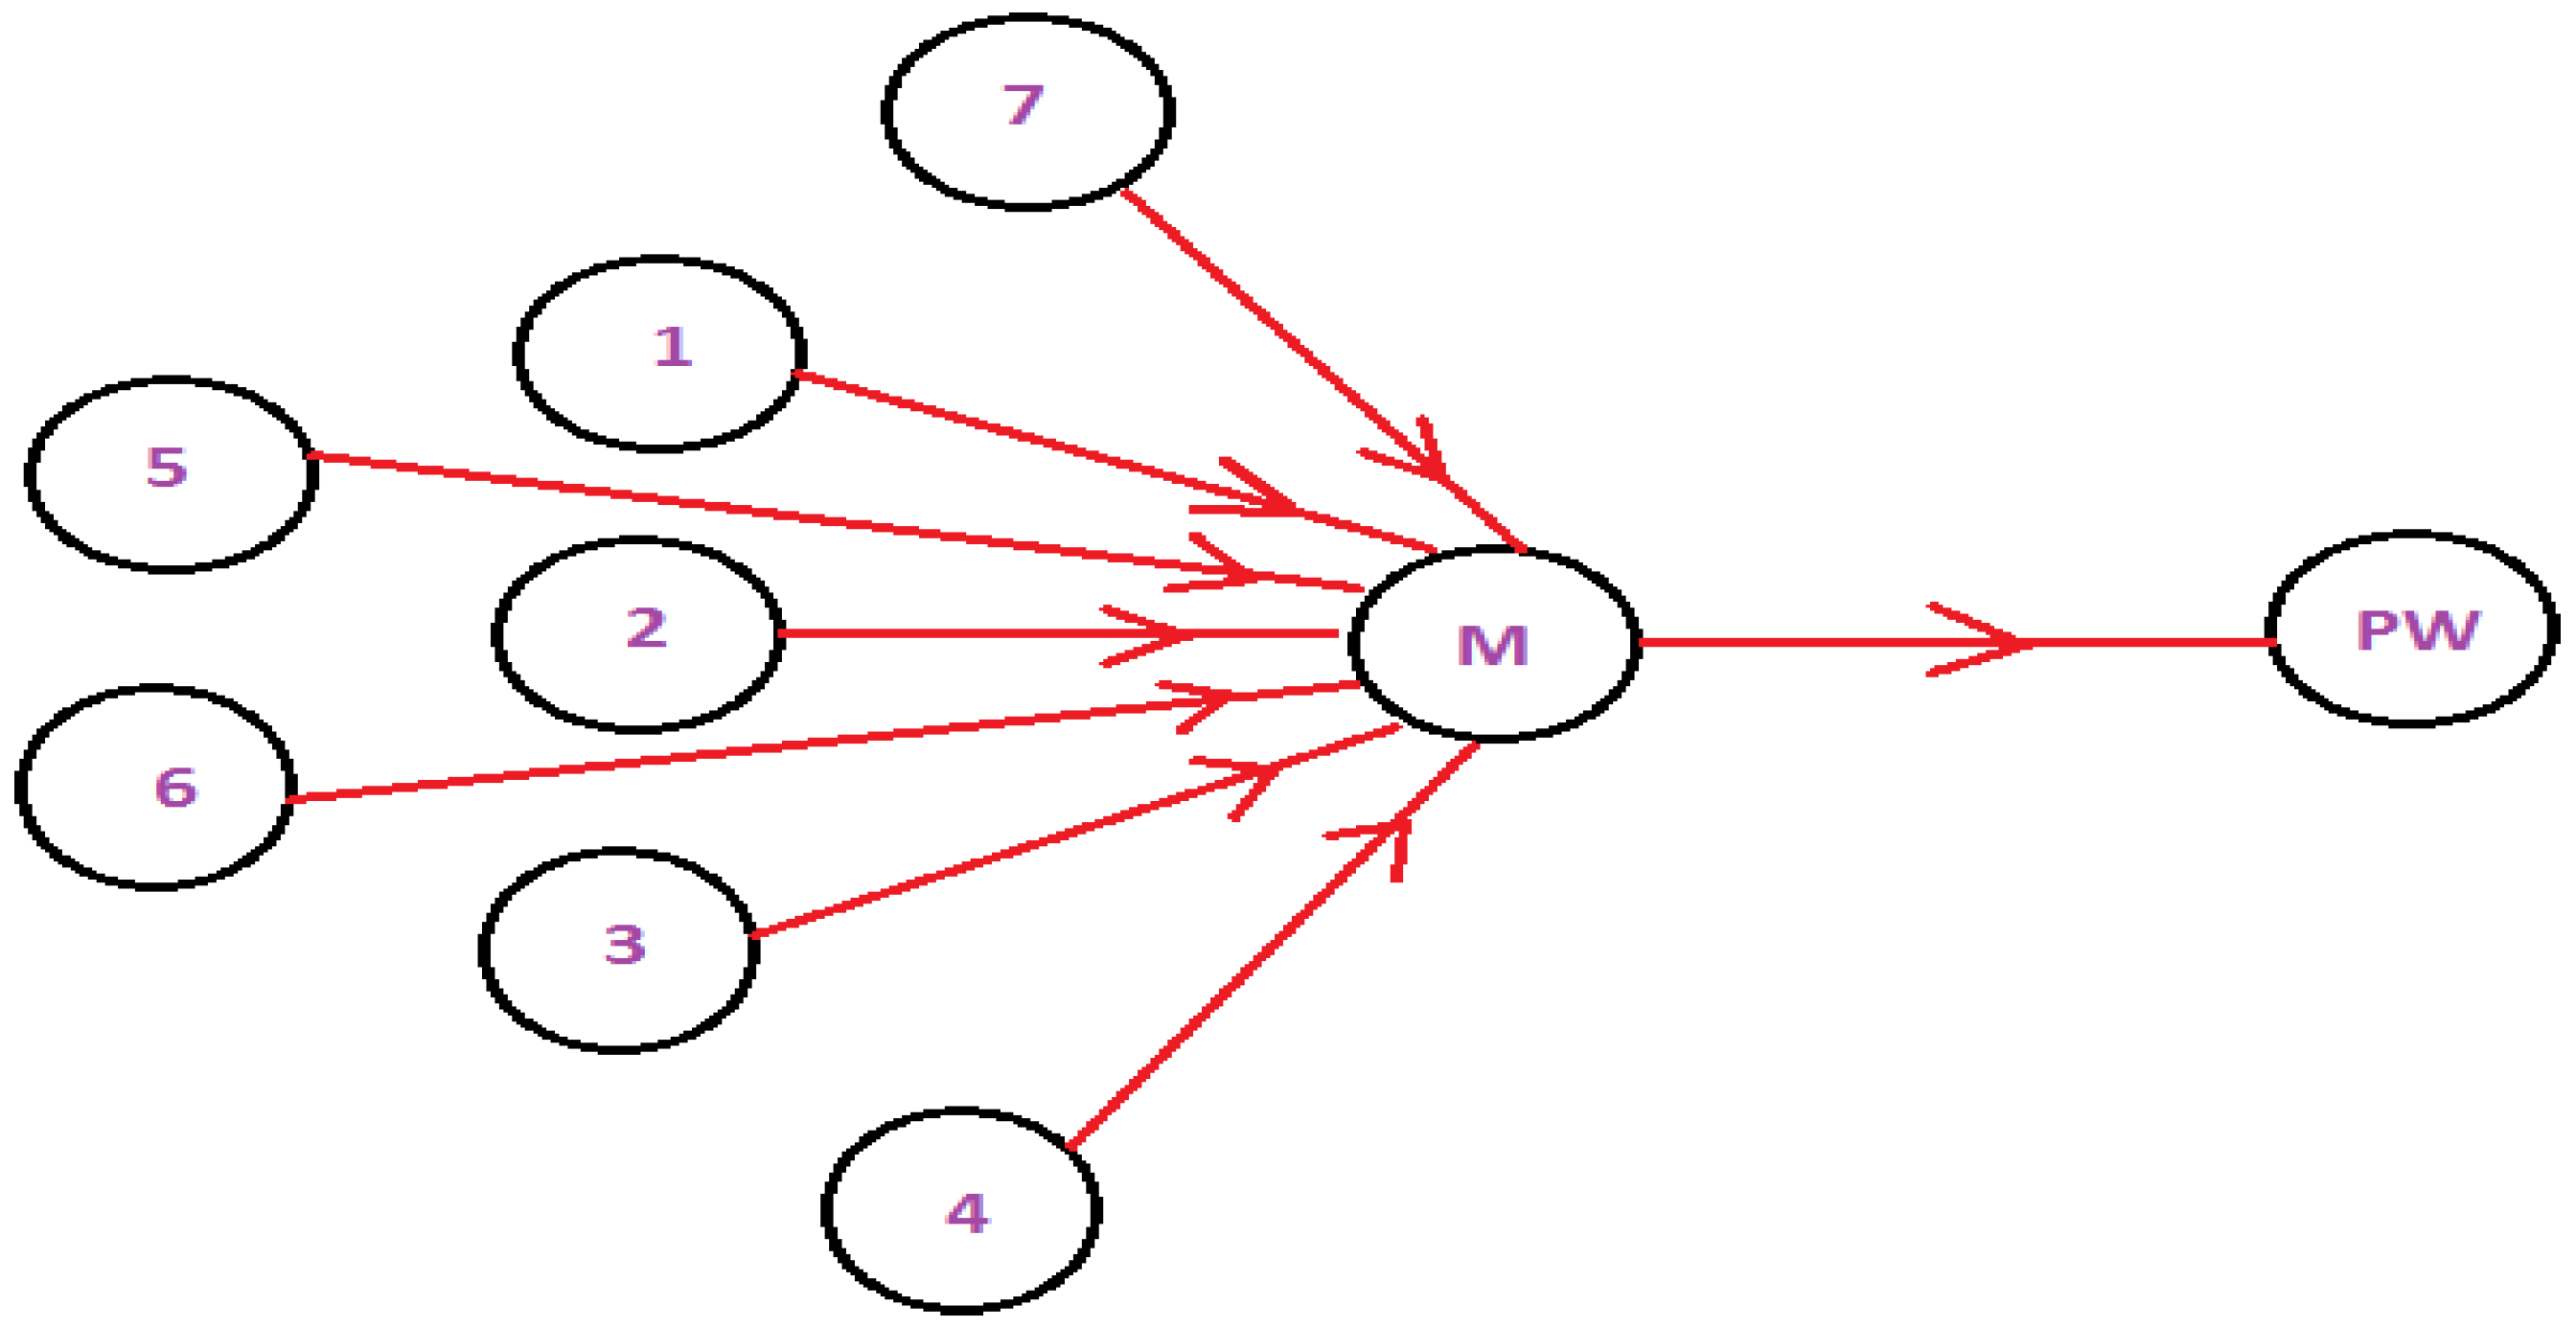
4.1. “Bottlenecks” in the Production System

The bottleneck in production and project management is one of the processes in the process chain that limits the ability and capacity of the entire chain. As a result of the bottleneck, there is stagnation in production, surplus supply, pressure from customers, or low morale among employees. There are both short and long-lasting bottlenecks. Short-term bottlenecks are temporary and are usually not a significant problem. An example of a short-term bottleneck can be a qualified employee who will use a few days off. Long-term bottlenecks occur all the time and can significantly slow down production. An example of a long-term bottleneck is a situation in which the machine is not efficient enough. On the carousel, one of the more important production processes has a total of 10 workstations, called “tables”. Three are used only for backfilling forms (charging stands 1–3), another three are used only for undressing (position dismantling 1–3), and the remaining four perform a hybrid function and are used both for charging and dismantling forms (positions 4–7). At the maximum occupancy of employees, the discs leave seven positions heading to the press. Just before the washer, there is a so-called “bottleneck” because only one thread leads to the press through the washer. The described situations are presented using the diagram (Figure 5) or with the help of a graph (Figure 6). The capacity must be as high as possible. When a washer fails or the press, the whole production has production downtime and the performance decreases [64,65]. The whole department is directly or indirectly dependent on the work efficiency of the water press machine. Each technical and weekly study necessary for cleaning and lubrication of the water press cork generates large losses that must be taken into account in the estimated production capabilities.
The analysis of the environment shows that this position cannot be bypassed. You can only improve systems that currently operate.

4.2. Standard 5S in the Analysed Company

The implementation of the 5S standard in a systematic way has long-term measurable benefits. In the final stage, these small changes lead to the optimisation of processes and obtain the desired results. The 5S audit is a set of activities consisting of comparing the present state with the originally defined standards. Table 1 presents a fragment of the audit by the authors.
A 5S audit was carried out in the analysed company to optimise the production of TS fittings (industry name characterised by T shape). The purpose of the audit was to build the best work organisation, effectively use workplaces, supplement the shadow board, and perform an analysis of performance losses, which is the problem, and attempt to eliminate them. The audit took place in positions 5 and 6, intended for the production of TS-type fittings. Audit goal: producing seven pieces of TS fittings on each change from each position. The effects of the workshop are presented in Table 2. The described causes of problems come from errors in the course of production.
As part of the conducted research, new aspects were obtained in the analysed production plant, i.e., the following:
  • Building awareness among employees of what 5S is;
  • Promoting the benefits of reorganising space and eliminating waste by improving the identification of work subjects and dividing them into unnecessary, necessary, and those that may be useful. The campaign of red cards allowed to dispel doubts about whether a given element can be thrown out, how to utilise it, where to transfer it, what amount is used, and what is the frequency of its use;
  • Diagnosis of the area of the problem and the introduction of remedial activities, e.g., by determining the uniform transport routes regarding tool management, an increase in transport area was obtained, a better possibility of travelling to individual production sections, unnecessary items and parts were eliminated, thanks to which the freedom of movement and the quality of work of machine operators increased. The tools were arranged on top, within reach, to eliminate all unnecessary movements. As part of this operation, this was improved: determining standard places for downloading and putting off parts, naming and coding of elements were unified, effective identification of parts, labels, and other markings were implemented; other elements of visual management (shadow boards, border lines, layout fields, etc.) were also introduced. In addition, a scheme of downloading items by the principles of ergonomics and work safety (heavy items—on the lower shelves or the floor, lighter elements—in the higher zones of storage spaces, items used most often—possible—within reach of the hands);
  • The cleanliness of machines, equipment, and workplaces has been improved by introducing instructions for cleaning positions and entering this postulate into the duties of employees;
  • All necessary position instructions, cleaning instructions, 5S maps, and state visualisations have been introduced and are desirable. The One Point Lesson and the additional visualisations and standards aim to maintain the effects of previous steps and contribute to a reduction in the time of searching and performing unnecessary movements related to reaching for tools, increasing the level of organisation of operators, increasing the comfort of the work performed, arousing a sense of aesthetics, increasing the work of operators, and making the essence of continuous improvement reduction in production costs;
  • The possibility of increasing employee competencies by introducing workshops and training;
  • Improving the implementation of production activities by establishing a team and a project leader.

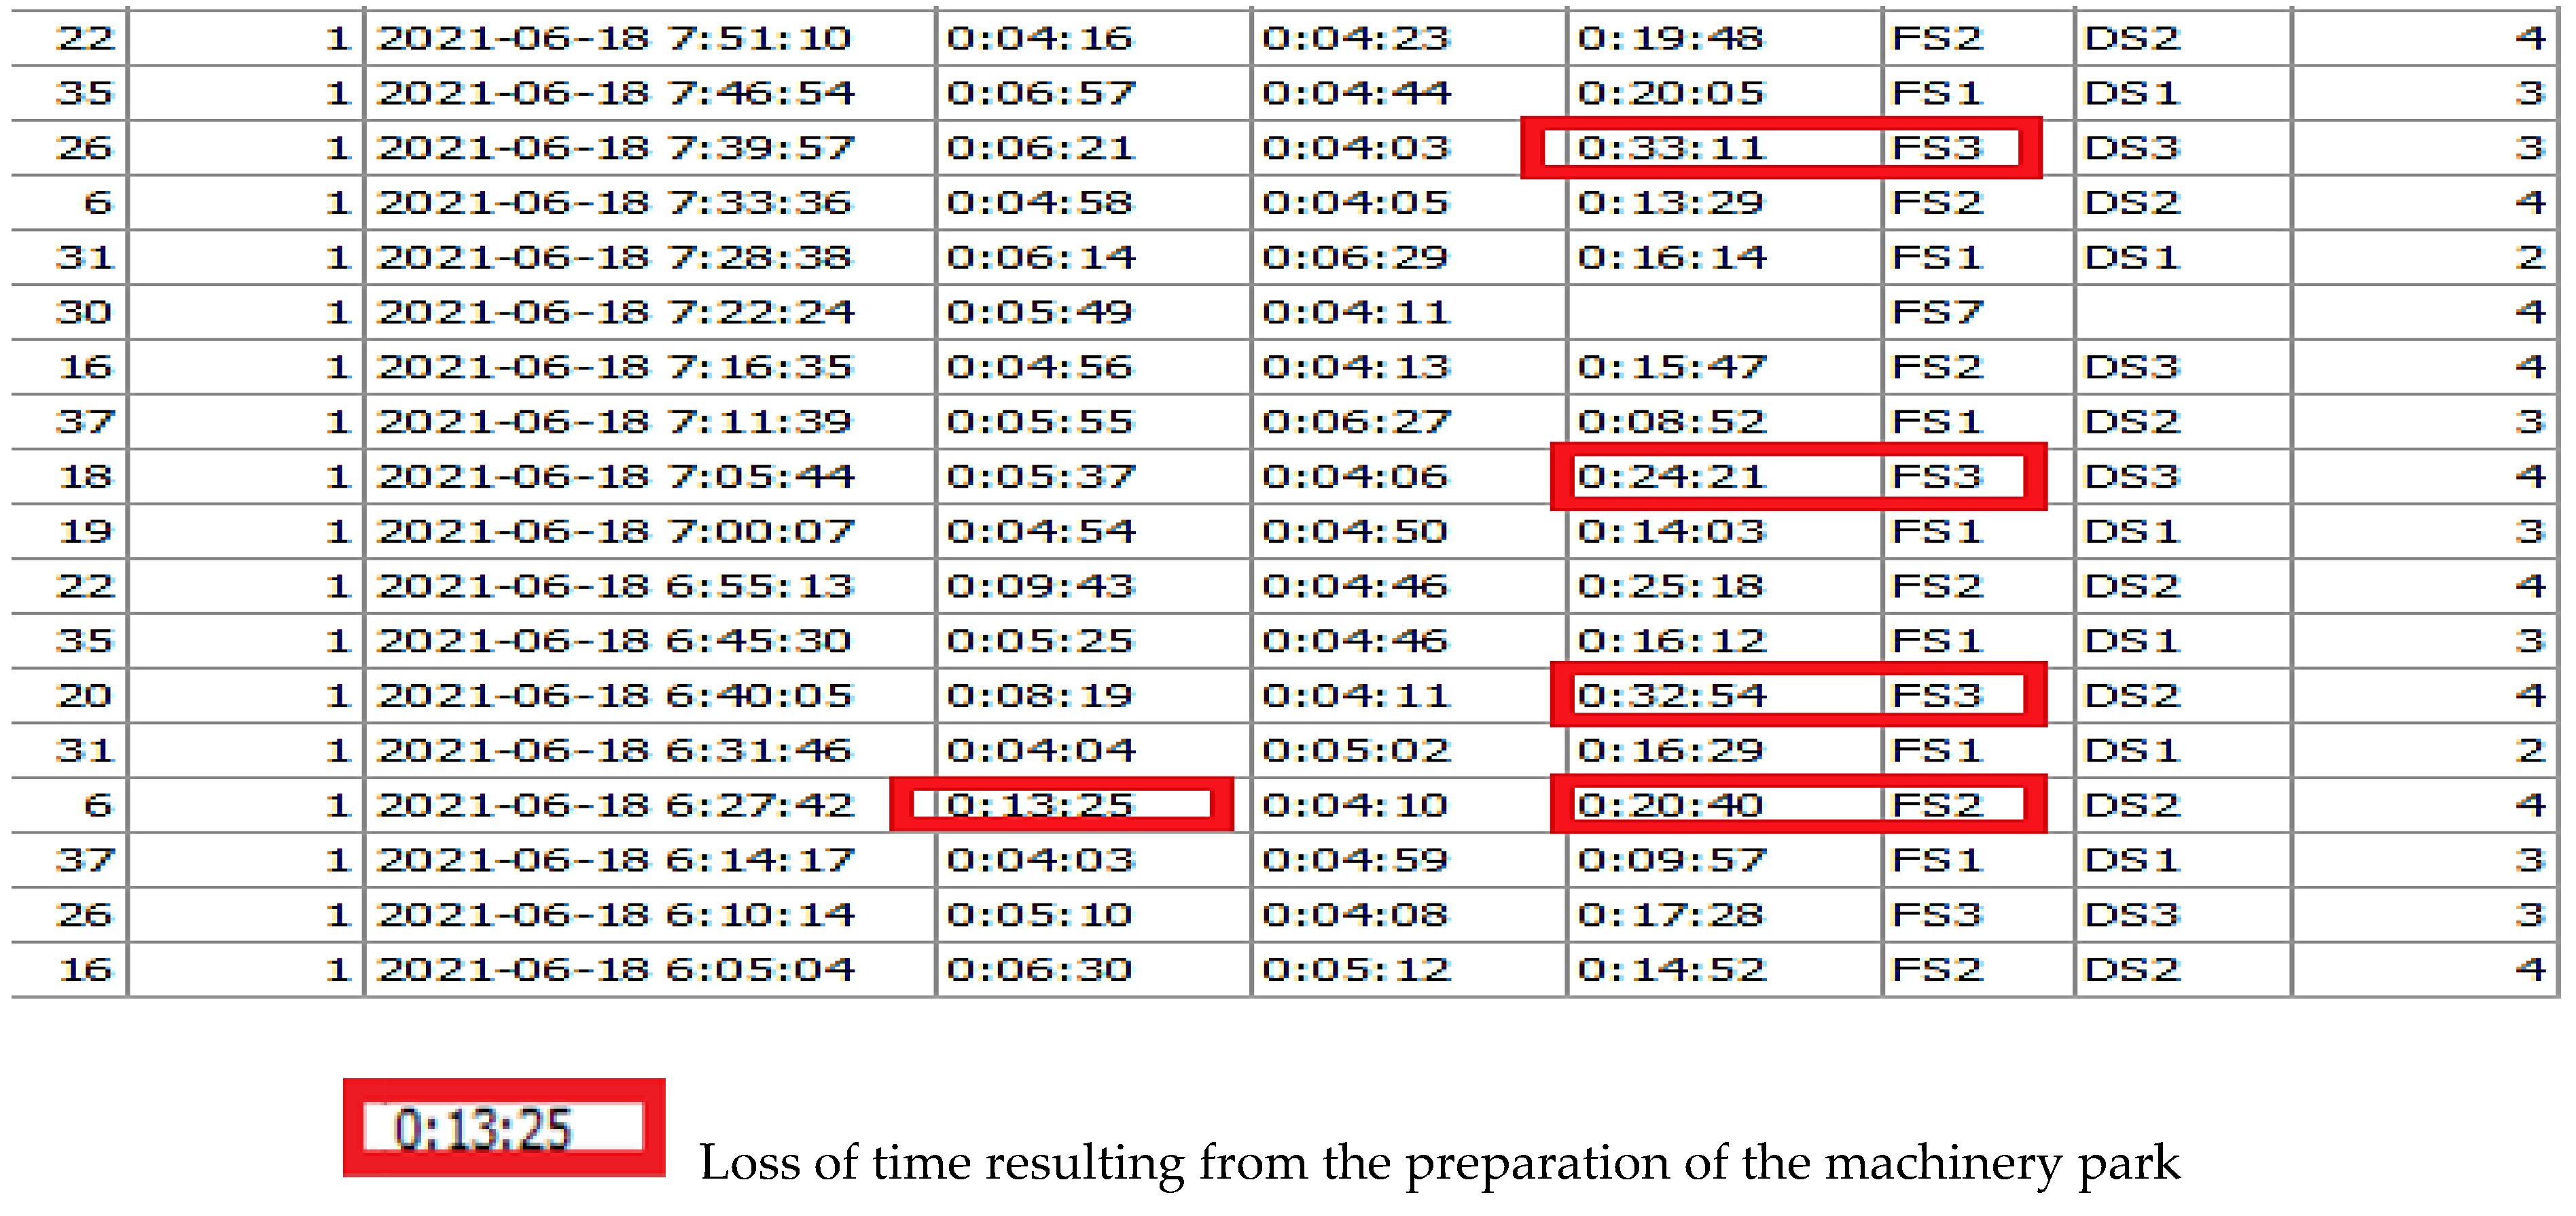
4.3. Analysis of Selected Materials as Part of the Uric

Based on the parameters, such as table number, cycle time, backfilling time, and the number of pieces on the plate, it was found that it was a TS-type fitting. It was also noticed that at the beginning of the change, the time of the burden of the fitting is somewhat elongated. This is an optimisation problem to improve to use of this time at the turn of production changes. However, for qualitative reasons, the operator should not start pouring another art, knowing that they will not be able to finish it by the end of their shift, but there are other possibilities, such as preparing mixes or cubes needed for production. At the time when operators send TS after each other, they must follow the procedures [67]:
-
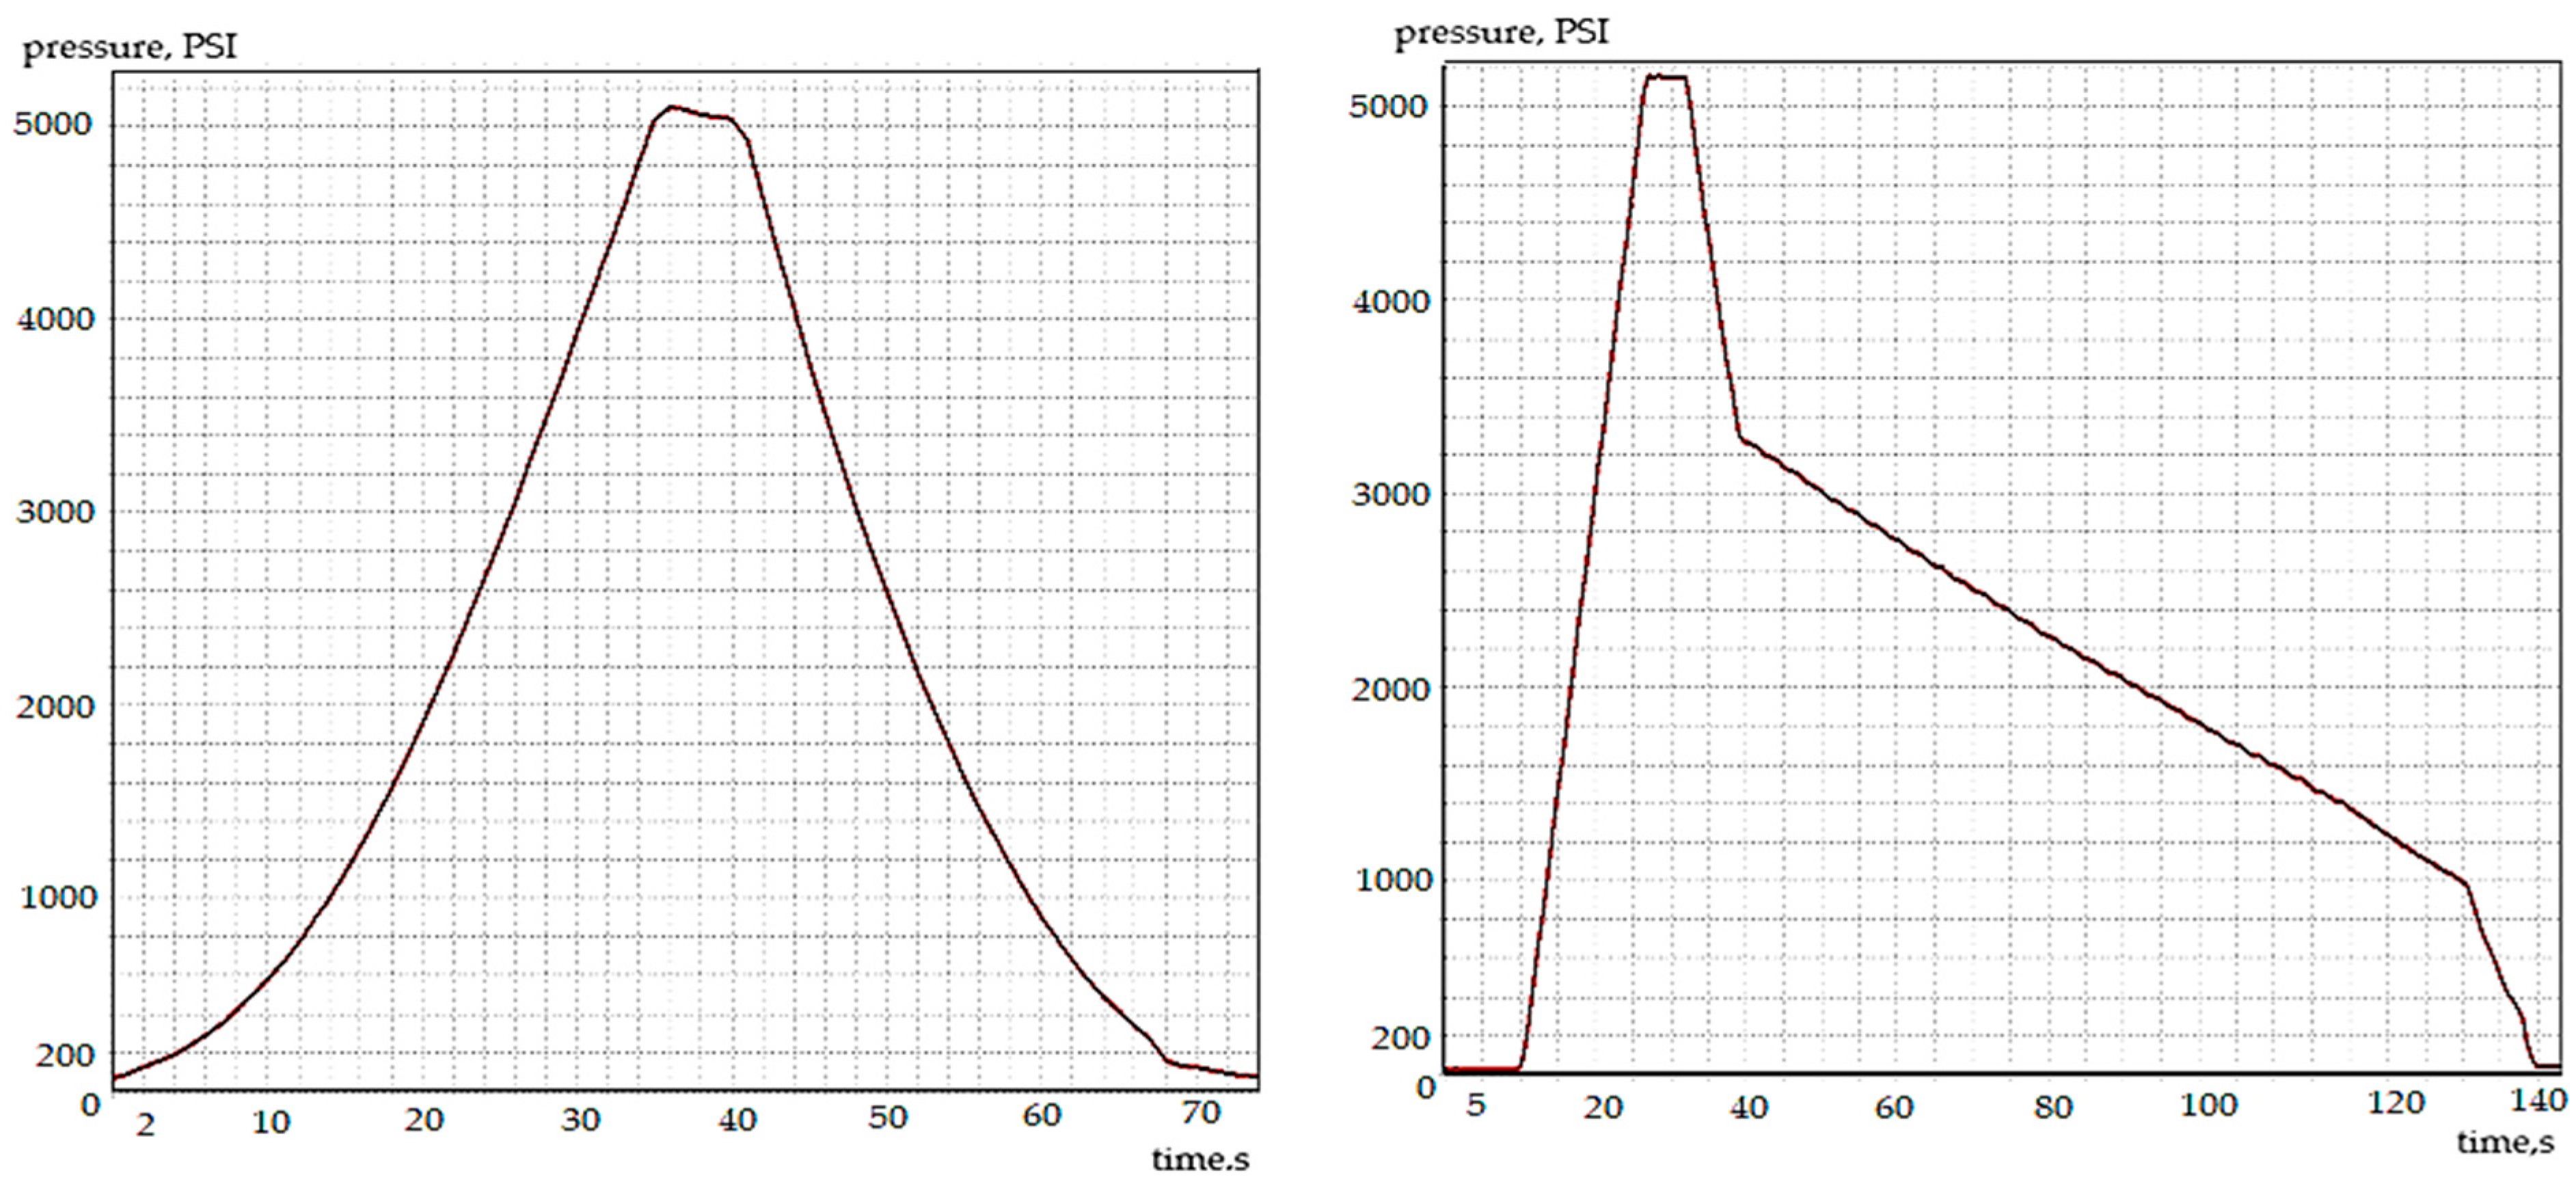
Both ironings are at free decompression, which is tantamount to extending the time of both cycles. At that time, operators from charging positions 1 to 3 should also send their discs.
-
At the time of the second ironing cycle of TS, operators in undressing positions have nothing to demolish. At this time, an embolism is created in front of the press—the situation of the asynchronous stream appears when operators have too little work to do or have too much of it.
After a few discs, if there is a long undressing period, the embankment will be dismantled, which in turn leads to embolism before the press. To prevent such a situation between operators, there must be communication. It is best if two Sleep Cobs enter the press between TS. A bottleneck with high-profile forms, which are very time-consuming, is also a bottleneck. Some forms fall asleep for a long time, others undress for a long time, which creates the phenomenon of asynchronous stream production. Asynchronous stream, where the times of performing individual activities are different, are not equal, nor are they multiple times of other operations. Different workstations are differently burdened (while some workstations are completely burdened with downtime), as a result of which breaks are formed, which lead to the disturbance of the production process. Therefore, when the embolism is made for undressing, and operators from charging positions 1–3 do not have anything for backfilling, they go to the undressing positions for help. While the plate can be dismantled by many operators, only one operator is assigned to fall into one position. Therefore, when the situation is inverse and the embolism is made during backfilling, you have to wait patiently. The most experienced operators must work in charging positions 1–3, not only for performance, but also for quality reasons. Figure 7 presents a fragment of the work and carousel parameters.
Analysis of parameters showed that two albums were ready for transmission. The operator from position No. 1, due to the short technological process, covered the disc in 9 min 57 s. After pressing three cycles, a problem appeared, because the operator on Table 2 had a CD that took 20 min 40 s, and the operator on stand 3 sent the disc after 32 min 54 s. In practice, it means 7 min of loss. Of course, in positions 2 and 3, there were more demanding forms, but 32 min is a bit too long for the implementation of one album. To this end, tests were carried out to check the optimisation of the machine. The optimisation results are shown in Figure 8.
Figure 7 observes a 5 s support above 5000 [PSI] = 34.5 [MPa]. This is a very important quality aspect where the best compaction of the mix inside the forms occurs. This is a constantly monitored process. It was also noticed that the time of ordinary decompression ranges in the range of 50–80 [s], while at free decompression, this time is 140–160 [s]. The cycle time is from 4 to 5 min and 5.5–6.5 min in the case of ironing on free decompression. So, about 3 min is the remaining part of the cycle. The authors propose a solution by shortening the drying time on the machine. For this purpose, install the sensors recording the disc just before the washer, but in such a way that they register the disc only when there is no plate in the pusher site, or as an additional sensor, recording two plates forward. The proposal of this solution is presented in Figure 9.

4.4. Optimisation of the Production Process Using the OEE Indicator

Elements of the OEE indicator and individual losses during the production process are shown in Figure 10.
Availability is expressed as a relationship between working time, i.e., time devoted to the production of products, until the net operational time, covering the time of working change, reduced by planned downtime. To calculate this parameter, information on delays during production, which was calculated on the example of three working changes presented in Figure 3, as well as collected data on failure, is necessary. The journal with a list of failures is presented in Figure 11.
Typical cyclically recurring failures include the following: missing carriage, table failure, carousel failure, press failure, system failure, crane failure, and screw failure.
All failures that start with one (1.1; 1.2; 1.3; 1.4) are failures that require the intervention of maintaining traffic as soon as possible due to the fact that these are a breakdown of production, i.e., press failure, carousel failure, system failure, as well as a pusher or hook failure. Only those failures that caused direct downtime in production were taken into account to calculate the availability parameter.
Performance—currently, the automation of the process of obtaining production data is a standard in most enterprises in Poland. Many solutions allow real-time data to be entered by production workers using barcode readers or properly configured touch terminals, e.g., tablets. The dynamically developing IoT (Internet of Things) and the concept of Industry 4.0 mean that more and more often, you can also find solutions based on obtaining data directly from machines using appropriately programmed sensors or PLC (Programmable Logic Controller) [68]. Similarly, the situation with the efficiency of the press looks like this. To be able to reward employees just for the performance of the work performed, an employee login system was proposed at each working station using work cards. For this purpose, a system of performance scales is used for any type of pattern on the plate. With TS fittings, an experienced operator can produce 5–7 one-on-one working changes depending on the pattern. Due to the long technological process, this type of fitting has the highest performance weight. On the other hand, there are LS fittings (industry name characterised by an L shape), which usually consist of one or two mixtures, and the technology makes it easy to fall asleep because the mixtures of 95% are made in silos, not barrels, which does not require a lot of work and time. The described situation is best illustrated by the performance of 18 June 2021, which is presented in Table 3.
Table 3 presents a discrepancy between the performance on the press and the OEE indicator, which can be seen in the example of the first change. It can also be seen that even though change 3 produced more pieces and made more cycles than change 1, the performance of change 1 is 10% higher—this is directly related to the availability of employees on the press. Based on the information, it was noted that change 2 made its working change by three cycles more than change 1, and yet the number of pieces produced was seven fewer. In this case, there is an irregular number of forms on the disc (1 cycle = 1 CD; 1 CD ≠ 1 form). However, performance on the press has nothing to do with optimisation. It is only a method that allows you to reward employees fairly—it also allows you to detect which change works most effectively and which must be improved. This is information that is necessary for effective and best management. Efficiency based on OEE—this performance was measured to take into account all slowdowns in the machine or carousel. The OEE performance indicator aims to demonstrate where and how much time has been lost to unplanned stops, but the indicator shows not loss but potential possibilities. Where you can improve, improve something. The main factor for the performance of a machine is determining the target production, which is the number of products that, at the assumed maximum speed of the machine, could be performed, and the decrease in performance, i.e., all factors that make the production work slower than the maximum speed at which it can work. It includes small breaks, as well as slow cycles related to, e.g., a long time, or with the transfer of a change.
Quality—expressed as the ratio of good production, i.e., products that meet the assumptions of quality for real production. Loss of quality is a waste of time because the machine wasted time making a defective product. The amount produced with deficiencies is given, i.e., the gross amount. Whether the machine made a good or bad product, it had to devote time to making it. The situation is slightly different with the water press machine because it does not generate any deficiencies. The deficiencies that appear during the course of production are deficiencies generated only by operators or for purely technological or operational reasons, such as poorly tightened cork, damaged tools, or a leaky form, which caused art to leave the wet machine, or a form covered with an inappropriate mixture. These situations, yes, generate deficiencies, but the reason is not the machine. The machine works under isostatic pressure. Even if it hangs during decompression, it does not have a major impact on the quality of the compact because the pressure has done its work, or will do it after the intervention of the authorised person—this is already a downtime associated with the failure included in the availability parameter.

Calculation of the OEE Indicator

Data from 61 business days from May and June 2021 were examined and analysed. The method of data calculations, such as the losses suffered in the course of production and the average cycle time calculated individually for a working change, on the example of one day. The obtained data from the calculations allowed for calculating the parameters of availability, efficiency, and quality necessary to calculate the OEE indicator. At a later stage of work, a list of results for all days was presented for analysis. Table 4 presents a fragment of the number of cycles, time losses incurred, and the average data cycle time for the analysed company.
The standard time of a single cycle ranges from 4 to 5 min. The exception is TS fittings, whose ironing is free decompression. These types of fittings are ironed between 5.5 and 6 min. In the further part of the work, calculations for three changes were made. Examples of calculations for change 1 are presented below.
Change 1:
From among 85 cycles, those whose ironing time exceeded 5 min, i.e., above the standard (pink group to the right—“out”), as well as a break (30 min), which was not taken into account. The exception is cycled from the green group—these are TS-type fittings, the ironing of which took place at free decompression. From these cycles, and from all others, the arithmetic average was calculated, which was 4 min 27 s per cycle (brown colour). All cycles (yellow) above this border have been distinguished. The surplus of times was added together with the cycles from the pink group. The following result was obtained: 28 min 58 pp. They sometimes slow down production. It was also checked in the alarm diary that there was no failure that day.
OEE indicator:
Availability:
A = (APT/PBT)·100
Failures = 0 min Break = 30 min
Downtime = 28 min 58 s ≈ 29 min
PBT = 480 min − 30 min = 450 min (planned machine working time)
APT = 450 min − 29 min = 421 min (real working time of the machine)
A = (421/450)·100% = 93.5%
Efficiency:
E = (PRI·PQ/APT)·100%
PRI = 4 min 27 s = 4.45 min APT = 421 min PQ = 85 cycles
E = (4.45·85/421)·100 = 89.8%
Quality:
Q = (GQ/PQ)·100%
GQ = 85 cycles PQ = 85 cycles Q = 85/85· 100 = 100%
OEE = A·E·Q·100%
OEE = 0.935·0.898·1.0·100% = 84%

4.5. Analysis of the Results of Optimisation of the Production Process

Table 5 presents a statement of the OEE indicator with the efficiency on the press, number of cycles, and attendance for the research month of May 2021.
OEE indicator for each working change in May 2021, and the OEE combination with the efficiency of the press are shown successively in Figure 12 and Figure 13. In the calculation of the indicator, the value “0” was not taken into account; it is a technological break lasting 8 h associated with cleaning workstations.
In the OEE list with performances (Figure 11), a large relationship was noticed between these parameters. Only twice has OEE exceeded the level of performance on the press, which usually has a higher value. Two opposite jumps in the chart around changes 67 and 90 in a given month (performance much higher than OEE) were also analysed. It was noticed that in both cases, these jumps may be directly related to low attendance—both changes had seven operators. Based on May 2021 (Table 5). Statistical data for the main parameters contained in this table were developed, and the results are presented in Table 6.
Through the calculations of the OEE indicator based on data from May 2021. It has been observed that the two changes (grey and blue) are significantly different from the other two changes (brown and blue)—about a 10% difference in results. It was also observed that after calculating the performance on the press, the brown change levelled with the performance of blue and grey changes. This is because the performance on the press includes some parameters that OEE parameters are not able to embrace. The results of performance parameters on the press are more individual, based on a carefully thought-out and detailed analysis of the focused strike on the press. It was assumed that the reason for the low OEE indicator of the brown change is the low turnout of operators, and this may lie here (the lowest attendance of the three changes—8.7 employees for a working change). It was also noticed that after calculating the performance on the press, the blue change, although it noted an increase in efficiency relative to OEE, still clearly deviates from the remaining three changes. In this case, you should take a closer look at this change. There is a hypothesis that perhaps the problem lies in failures, which appeared much more often on the change in blue than on other working changes. Communication between the employee area (Master), Master–Manager, and Work Manager is very important. Talks about current problems in the press, about what works well, and about what does not work as it should. Perhaps the reason for low performance may be seemingly prosaic problems. The analysis took into account 31 days, 92 working days, and three basic parameters: the number of people needed, the number of required cycles, and the percentage of performance at the production of refractory products. Table 7 and Table 8 present conditions for OEE > 85% for May 2021.
Based on statistical data from two months (May and June 2021), it was calculated that to maintain the OEE World Class standard, the following conditions must be met [18]:
-
There must be fewer than 10.6 employees available (11 operators);
-
The number of cycles alternately cannot be less than 84.9 = 85 cycles;
-
The performance must be at a minimum level of 93.7%.
To optimise the OEE indicator as part of Industry 4.0, the authors recommend the implementation of the following techniques at the analysed plant: predictive maintenance of movement, process automation, remote monitoring, and data analysis. Industry techniques 4.0 under OEE include the following:
  • Predictive maintenance:
The use of sensors and AI to monitor the condition of real-time machines, which allows you to precisely predict failure and plan maintenance before problems, minimising downtime.
  • Process automation:
Automation of operations such as packaging, storage, sorting, and transport allows you to reduce downtime related to human work and improve the precision and efficiency of production processes.
  • Remote monitoring and data analysis:
Remote monitoring of machines and processes allows you to quickly detect anomalies and identify potential problems before failure, which allows for faster reaction and minimization of downtime.
  • Real-time data analytics:
Real-time data analysis allows a better understanding of the causes of downtime, identifying areas requiring optimisation and making accurate decisions regarding resource management and production planning.
  • Lean manufacturing and digital transformation:
The implementation of lean manufacturing methods in combination with a digital transformation allows you to identify and eliminate waste, optimise processes, and improve the efficiency of machines.
  • Using ERP and MES systems:
ERP (Enterprise Resource Planning) and MES (Manufacturing Execution System) systems allow you to integrate data from various production areas, improve information flow, and better manage production processes.
  • Virtual and augmented reality (VR/AR):
The use of VR/AR technology for staff training, visualisation of production processes, and remote technical support allows you to reduce error risk, improve work quality, and increase efficiency.

5. Conclusions

Overall Equipment Effectiveness is a key performance indicator that allows for the identification and elimination of losses in production processes. It contains information on machine availability, their utilisation, and production quality. It also allows for the analysis and evaluation of the existing machinery park—the effect of its implementation is the improvement of the efficiency of machine utilisation. Its improvement through automation, TPM, designing machines with maintenance in mind, and the integration of Industry 4.0 technologies leads to a significant increase in production efficiency. Manufacturing companies should constantly strive to improve their KPI, using the latest technologies and management methods. Investing in automation, employee training and regular safety audits, and machine maintenance are key elements that can contribute to achieving a high level of OEE and maintaining market competitiveness. The minimum value of the OEE indicator is considered to be 60%, while an OEE indicator value exceeding 80% is considered satisfactory. A high OEE indicator means that production processes are very effective and efficient, which translates into increased company profits and customer satisfaction. On the other hand, a low OEE indicator indicates problems in the production process that should be carefully analysed and eliminated to increase production efficiency and effectiveness. The results of the OEE indicator calculations for the analysed production plant indicate that it is low due to the small number of employees and appropriately specialised equipment. To improve the OEE indicator, it will be necessary to take measures to reduce the impact of employee absences on the production process. For example, you can consider increasing the number of employees who can replace those absent on a given day. It is also worth taking care of better work organisation so that the work is evenly distributed among all employees and that everyone has clearly defined tasks and goals to achieve. Continuous improvement of the machine management process allows the company to increase production efficiency, eliminate losses, and generate higher revenues. In improving the process of managing the infrastructure of the company’s operations, it is important to carry out appropriate measurements of their effectiveness and efficiency, which can help improve the quality of the products obtained. The improvement process should be based on the use of appropriate tools and methods that increase the efficiency of the entire system. The analysed company underwent a series of modernisations, and the obtained efficiency indicator is the result of many years of work. Therefore, the obtained result is generally satisfactory (efficiency indicator 87.9%, before modernisation 57.4%). Nevertheless, in today’s world, companies are required to continuously improve and refine their production activities. The proposal of actions to improve them and bring them closer to the standards in force in Europe will constitute the next stage of the authors’ research.
The implementation of OEE in manufacturing companies is associated with many challenges, such as the following:
  • Integration of new technologies with existing systems;
  • The need for training for staff;
  • Management of large amounts of data;
  • Maintaining a high level of motivation among employees.
The future is associated with the further development of technologies such as artificial intelligence, big data, and machine learning. These technologies will enable even more accurate monitoring of production processes and more precise optimisation of OEE.

Author Contributions

Conceptualisation, M.N. and W.L.; methodology, M.N. and W.L.; software, M.N. and W.L.; validation, M.N.; formal analysis, M.N. and W.L.; investigation, M.N. and W.L.; resources, M.N.; data curation, M.N. and W.L.; writing—original draft preparation, M.N. and W.L.; writing—review and editing, M.N. and W.L.; visualisation, M.N.; supervision, W.L.; project administration, M.N. and W.L. All authors have read and agreed to the published version of the manuscript.

Funding

This research received no external funding.

Institutional Review Board Statement

Not applicable.

Informed Consent Statement

Not applicable.

Data Availability Statement

Data are contained within the article.

Conflicts of Interest

The author declares no conflict of interest.

References

  1. Maté, A.; Trujillo, J.; Mylopoulos, J. Specification and derivation of key performance indicators for business analytics: A semantic approach. Data Knowl. Eng. 2017, 108, 30–49. [Google Scholar] [CrossRef]
  2. Baghbani, M.; Iranzadeh, S.; Bagherzadeh Khajeh, M. Investigating the relationship between RPN parameters in fuzzy PFMEA and OEE in a sugar factory. J. Loss Prev. Process Ind. 2019, 60, 221–232. [Google Scholar] [CrossRef]
  3. Ghafoorpoor Yazdi, P.; Azizi, A.; Hashemipour, M. A Hybrid Methodology for Validation of Optimisation Solutions Effects on Manufacturing Sustainability with Time Study and Simulation Approach for SMEs. Sustainability 2019, 11, 1454. [Google Scholar] [CrossRef]
  4. Ng, K.C.; Chong, K.E. A framework for improving manufacturing overall equipment effectiveness. J. Adv. Manuf. Technol. 2018, 12, 383–400. [Google Scholar]
  5. Alzubi, E.; Atieh, A.M.; Abu Shgair, K.; Damiani, J.; Sunna, S.; Madi, A. Hybrid Integrations of Value Stream Mapping, Theory of Constraints and Simulation: Application to Wooden Furniture Industry. Processes 2019, 7, 816. [Google Scholar] [CrossRef]
  6. Abd Rahman, M.S.; Mohamad, E.; Abdul Rahman, A.A. Enhancement of overall equipment effectiveness (OEE) data by using simulation as decision-making tools for line balancing. Indones. J. Electr. Eng. Comput. Sci. 2020, 18, 1040–1047. [Google Scholar] [CrossRef]
  7. Dresch, A.; Veit, D.R.; de Lima, P.N.; Lacerda, D.P.; Collatto, D.C. Inducing Brazilian manufacturing SMES’ productivity with Lean tools. Int. J. Product. Perform. Manag. 2019, 68, 69–87. [Google Scholar] [CrossRef]
  8. Daneshjo, N.; Malega, P.; Pajerská, E.D. Production Efficiency in Company with Small Series Production. TEM J. 2019, 8, 1118–1126. [Google Scholar] [CrossRef]
  9. Martinez, F. Process excellence the key for digitalisation. Bus. Process Manag. J. 2019, 25, 1716–1733. [Google Scholar] [CrossRef]
  10. Braglia, M.; Gabbrielli, R.; Marrazzini, L. Overall Task Effectiveness: A new Lean performance indicator in engineer-to-order environment. Int. J. Product. Perform. Manag. 2019, 68, 407–422. [Google Scholar] [CrossRef]
  11. Dunn, T. OEE Effectiveness. In Manufacturing Flexible Packaging; Elsevier: Amsterdam, The Netherlands, 2015; pp. 77–85. [Google Scholar]
  12. Thiede, S. Advanced energy data analytics to predict machine overall equipment effectiveness (OEE): A synergetic approach to foster sustainable manufacturing. Procedia CIRP 2023, 116, 438–443. [Google Scholar] [CrossRef]
  13. Febianti, E.; Safitri, K.D.; Kulsum, K.; Kurniawan, B.; Ferdinant, P.F.; Setiawan, H. Measurement of effectiveness of food processing machine through overall equipment effectiveness (OEE). J. Ind. Serv. 2022, 8, 46–52. [Google Scholar] [CrossRef]
  14. Sathler, K.P.B.; Salonitis, K.; Kolios, A. Overall equipment effectiveness as a metric for assessing operational losses in wind farms: A critical review of literature. Int. J. Sustain. Energy 2023, 42, 374–396. [Google Scholar] [CrossRef]
  15. Domingo, R.; Aguado, S. Overall Environmental Equipment Effectiveness as a Metric of a Lean and Green Manufacturing System. Sustainability 2015, 7, 9031–9047. [Google Scholar] [CrossRef]
  16. García-Arca, J.; Prado-Prado, J.C.; Fernández-González, A.J. Integrating KPIs for improving efficiency in road transport. Int. J. Phys. Distrib. Logist. Manag. 2018, 48, 931–951. [Google Scholar] [CrossRef]
  17. Mousavi, A.; Siervo, H.R.A. Automatic translation of plant data into management performance metrics: A case for real-time and predictive production control. Int. J. Prod. Res. 2017, 55, 4862–4877. [Google Scholar] [CrossRef]
  18. Contini, G.; Peruzzini, M.; Bulgarelli, S.; Bosi, G. Developing key performance indicators for monitoring sustainability in the ceramic industry: The role of digitalisation and industry 4.0 technologies. J. Clean. Prod. 2023, 414, 137664. [Google Scholar] [CrossRef]
  19. Samatemba, B.; Zhang, L.; Besa, B. Evaluating and optimising the effectiveness of mining equipment; the case of Chibuluma South underground mine. J. Clean. Prod. 2020, 252, 119697. [Google Scholar] [CrossRef]
  20. Cheah, C.K.; Prakash, J.; Ong, K.S. An integrated OEE framework for structured productivity improvement in a semiconductor manufacturing facility. Int. J. Product. Perform. Manag. 2020, 27, 1081–1105. [Google Scholar] [CrossRef]
  21. Putz, M.; Koriath, H.J.; Kuznetsov, A.P. Resource consumption classes of machine tools. MM Sci. J. 2019, 2019, 3301–3309. [Google Scholar] [CrossRef]
  22. Tham, K.D.; Madni, A.M. Sox Compliance with OEE, Enterprise Modelling and Temporal-ABC. Intell. Autom. Soft Comput. 2018, 24, 17–26. [Google Scholar] [CrossRef]
  23. Kampa, A.; Gołda, G. Modelling and simulation method for production process automation in steel casting foundry. Arch. Foundry Eng. 2018, 18, 47–52. [Google Scholar]
  24. Ghafoorpoor Yazdi, P.; Azizi, A.; Hashemipour, M. An Empirical Investigation of the Relationship between Overall Equipment Efficiency (OEE) and Manufacturing Sustainability in Industry 4.0 with Time Study Approach. Sustainability 2018, 10, 3031. [Google Scholar] [CrossRef]
  25. Perez Loaiza, R.E.; Olivares-Benitez, E.; Miranda Gonzalez, P.A.; Guerrero Campanur, A.; Martinez Flores, J.L. Supply chain network design with efficiency, location, and inventory policy using a multiobjective evolutionary algorithm. Int. Trans. Oper. Res. 2017, 24, 251–275. [Google Scholar] [CrossRef]
  26. Trattner, A.; Hvam, L.; Haug, A. Why slow down? Factors affecting speed loss in process manufacturing. Int. J. Adv. Manuf. Technol. 2020, 106, 2021–2034. [Google Scholar] [CrossRef]
  27. Foulloy, L.; Clivillé, V.; Berrah, L. A fuzzy temporal approach to the Overall Equipment Effectiveness measurement. Comput. Ind. Eng. 2019, 127, 103–115. [Google Scholar] [CrossRef]
  28. Sonmez, V.; Testik, M.C.; Testik, O.M. Overall equipment effectiveness when production speeds and stoppage durations are uncertain. Int. J. Adv. Manuf. Technol. 2018, 95, 121–130. [Google Scholar] [CrossRef]
  29. Zennaro, I.; Battini, D.; Sgarbossa, F.; Persona, A.; De Marchi, R. Micro downtime: Data collection, analysis and impact on OEE in bottling lines, the San Benedetto case study. Int. J. Qual. Reliable. Manag. 2018, 35, 965–995. [Google Scholar] [CrossRef]
  30. Fekri Sari, M.; Avakh Darestani, S. Fuzzy overall equipment effectiveness and line performance measurement using artificial neural network. J. Qual. Maint. Eng. 2019, 25, 340–354. [Google Scholar] [CrossRef]
  31. Yılmaz Eroğlu, D. Systematization, implementation and analyze of overall throughput effectiveness calculation in finishing process of weaving industry. Text. Appar. 2019, 29, 121–132. [Google Scholar] [CrossRef]
  32. Roda, I.; Macchi, M. Factory-level performance evaluation of buffered multi-state production systems. J. Manuf. Syst. 2019, 50, 226–235. [Google Scholar] [CrossRef]
  33. Nakhla, M. Designing extended overall equipment effectiveness: Application in healthcare operations. Int. J. Manag. Sci. Eng. Manag. 2018, 13, 227–236. [Google Scholar] [CrossRef]
  34. Aleš, Z.; Pavlů, J.; Legát, V.; Mošna, F.; Jurča, V. Methodology of overall equipment effectiveness calculation in the context of industry 4.0 environment. Eksploat. Niezawodn. 2019, 21, 411–418. [Google Scholar] [CrossRef]
  35. Annamalai, S.; Suresh, D. Implementation of total productive maintenance for overall equipment effectiveness improvement in machine shop. Int. J. Recent Technol. Eng. 2019, 8, 7686–7691. [Google Scholar]
  36. Pinto, M.M.O.; Goldberg, D.J.K.; Cardoso, J.S.L. Benchmarking operational efficiency of port terminals using the OEE indicator. Marit. Econ. Logist. 2017, 19, 504–517. [Google Scholar] [CrossRef]
  37. Aria, M.; Cuccurullo, C. Bibliometrix: An R-tool for comprehensive science mapping analysis. J. Informetr. 2017, 11, 959–975. [Google Scholar] [CrossRef]
  38. Shahin, A.; Isfahani, N.G. Estimating overall equipment effectiveness for continuous production lines: With a case study in Esfahan Steel Company. Int. J. Serv. Oper. Manag. 2015, 21, 466–478. [Google Scholar] [CrossRef]
  39. Hwang, G.; Lee, J.; Park, J.; Chang, T.W. Developing performance measurement system for Internet of Things and smart factory environment. Int. J. Prod. Res. 2017, 55, 2590–2602. [Google Scholar] [CrossRef]
  40. Kardas, E.; Brožova, S.; Pustějovská, P.; Jursová, S. The Evaluation of Efficiency of the Use of Machine Working Time in the Industrial Company—Case Study. Manag. Syst. Prod. Eng. 2017, 25, 241–245. [Google Scholar] [CrossRef]
  41. Chang, T.W.; Cho, E.; Jun, J.H.; Ahn, H. Implementation of smart factory for sme: Focusing on data acquisition and monitoring. ICIC Express Lett. Part B Appl. 2019, 10, 551–558. [Google Scholar]
  42. Alvarado, L.; Grimaldo Quispe, C.R. Method for optimising the production process of domestic water tank manufacturing companies. Int. J. Eng. Res. Technol. 2018, 11, 1735–1757. [Google Scholar]
  43. Durán, O.; Durán, P.A. Prioritisation of Physical Assets for Maintenance and Production Sustainability. Sustainability 2019, 11, 4296. [Google Scholar] [CrossRef]
  44. Bhattacharjee, A.; Roy, S.; Kundu, S.; Tiwary, M.; Chakraborty, R. An analytical approach to measure OEE for blast furnaces. Ironmak. Steelmak. 2019, 47, 540–544. [Google Scholar] [CrossRef]
  45. Niekurzak, M.; Lewicki, W.; Coban, H.H.; Bera, M. A Model to Reduce Machine Changeover Time and Improve Production Efficiency in an Automotive Manufacturing Organisation. Sustainability 2023, 15, 10558. [Google Scholar] [CrossRef]
  46. Sharma, R. Overall equipment effectiveness measurement of TPM manager model machines in flexible manufacturing environment: A case study of the automobile sector. Int. J. Product. Qual. Manag. 2019, 26, 206–222. [Google Scholar] [CrossRef]
  47. Khisamova, E.D.; Kodolova, I.A.; Kucherbaeva, A.A. Impact of Lean Technology on Overall Equipment Effectiveness. HELIX 2019, 9, 5159–5164. [Google Scholar] [CrossRef]
  48. Daniewski, K.; Kosicka, E.; Mazurkiewicz, D. Analysis of the correctness of determination of the effectiveness of maintenance service actions. Manag. Prod. Eng. Rev. 2018, 9, 20–25. [Google Scholar]
  49. Mikulik, J.; Niekurzak, M. Assessment of the Profitability of a Photovoltaic Installation Cooperating with Energy Storage Using an Example of a Medium-Sized Production Company. Energies 2024, 17, 4740. [Google Scholar] [CrossRef]
  50. Singh, J.; Singh, H.; Sharma, V. Success of TPM concept in a manufacturing unit—A case study. Int. J. Product. Perform. Manag. 2018, 67, 536–549. [Google Scholar] [CrossRef]
  51. Dadashnejad, A.-A.; Valmohammadi, C. Investigating the effect of value stream mapping on overall equipment effectiveness: A case study. Total Qual. Manag. Bus. Excell. 2019, 30, 466–482. [Google Scholar] [CrossRef]
  52. Al-Refaie, A.; Abbasi, G.; Al-shalaldeh, H. Lean and agile practices to improve the performance of the filling process via simulation and data envelopment analysis. SN Appl. Sci. 2019, 1, 1131. [Google Scholar] [CrossRef]
  53. Canizo, M.; Conde, A.; Charramendieta, S.; Minon, R.; Cid-Fuentes, R.G.; Onieva, E. Implementation of a large-scale platform for cyber-physical system real-time monitoring. IEEE Access 2019, 7, 52455–52466. [Google Scholar] [CrossRef]
  54. Niekurzak, M.; Lewicki, W.; Wróbel, J. Efficiency Assessment of the Production of Alternative Fuels of High Usable Quality within the Circular Economy: An Example from the Cement Sector. Sustainability 2024, 16, 8762. [Google Scholar] [CrossRef]
  55. Nwanya, S.C.; Udofia, J.I.; Ajayi, O.O. Optimization of machine downtime in the plastic manufacturing. Cogent Eng. 2017, 4, 1335444. [Google Scholar] [CrossRef]
  56. Gołda, G.; Kampa, A.; Paprocka, I. Analysis of human operators and industrial robots’ performance and reliability. Manag. Prod. Eng. Rev. 2018, 9, 24–33. [Google Scholar]
  57. Rahman, M.M.; Ahmed, R.; Mashud, A.H.M.; Malik, A.I.; Miah, S.; Abedin, M.Z. Consumption-Based CO2 Emissions on Sustainable Development Goals of the SAARC Region. Sustainability 2022, 14, 1467. [Google Scholar] [CrossRef]
  58. Mio, C.; Costantini, A.; Panfilo, S.J.C. Performance measurement tools for sustainable business: A systematic literature review on the sustainability balanced scorecard use. Corp. Soc. Responsib. Environ. Manag. 2022, 29, 367–384. [Google Scholar] [CrossRef]
  59. He, F.; Shen, K.; Lu, L.; Tong, Y. Model for improvement of overall equipment effectiveness of beerfilling lines. Adv. Mech. Eng. 2018, 10, 168781401878924. [Google Scholar] [CrossRef]
  60. Supriyanto, H.; Mokh, S. Performance evaluation using lean six sigma and overall equipment effectiveness: An analysis tool. Int. J. Mech. Eng. Technol. 2018, 9, 487–495. [Google Scholar]
  61. Lewicki, W.; Koniuszy, A.; Niekurzak, M.; Stefanowicz, K. Assessment of Parameters Affecting the Efficiency of Production Processes Including Barriers and Perspectives of Automation in a Real Manufacturing Environment. Appl. Sci. 2025, 15, 3092. [Google Scholar] [CrossRef]
  62. Basak, S.; Baumers, M.; Holweg, M.; Hague, R.; Tuck, C. Reducing production losses in additive manufacturing using overall equipment effectiveness. Addit. Manuf. 2022, 56, 102904. [Google Scholar] [CrossRef]
  63. Crawford, J.; Cifuentes-Faura, J. Sustainability in Higher Education during the COVID-19 Pandemic: A Systematic Review. Sustainability 2022, 14, 1879. [Google Scholar] [CrossRef]
  64. Abreu, M.F.; Alves, A.C.; Moreira, F. Business Overall Performance and Sustainability Effectiveness: An Indicator to Measure Companies’ Lean–Green Compliance. Sustainability 2024, 16, 4508. [Google Scholar] [CrossRef]
  65. Les, A.; Morella, P.; Lambán, M.P.; Royo, J.; Sánchez, J.C. A New Indicator for Measuring Efficiency in Urban Freight Transportation: Defining and Implementing the OEEM (Overall Equipment Effectiveness for Mobility). Appl. Sci. 2024, 14, 779. [Google Scholar] [CrossRef]
  66. Gomaa, A.H. Maintenance 4.0: Optimizing Asset Integrity and Reliability in Modern Manufacturing. Int. J. Inven. Eng. Sci. (IJIES) 2025, 12, 18–26. [Google Scholar] [CrossRef]
  67. Dobra, P.; Jósvai, J. Cumulative and Rolling Horizon Prediction of Overall Equipment Effectiveness (OEE) with Machine Learning. Big Data Cogn. Comput. 2023, 7, 138. [Google Scholar] [CrossRef]
  68. Zehra, K.; Mirjat, N.H.; Shakih, S.A.; Harijan, K.; Kumar, L.; El Haj Assad, M. Optimizing Auto Manufacturing: A Holistic Approach Integrating Overall Equipment Effectiveness for Enhanced Efficiency and Sustainability. Sustainability 2024, 16, 2973. [Google Scholar] [CrossRef]
Figure 1. Block diagram of the production process.
Sustainability 17 04779 g001
Figure 2. Diagram of connecting production processes.
Sustainability 17 04779 g002
Figure 3. Carousel work scheme.
Sustainability 17 04779 g003
Figure 4. Parameters of water press ironing: (1) CD with a ready-covered form, (2) placing water and decompression, (3) drying after decompression.
Sustainability 17 04779 g004
Figure 5. Location of the bottleneck. The “1–7” workstations; “M”—washer; “PW”—water press.
Sustainability 17 04779 g005
Figure 6. A bottleneck diagram is located on a carousel in front of a washer and a water press machine. The “1–7”—workstations; “M”—washer; “PW” water press.
Sustainability 17 04779 g006
Figure 7. A fragment of the machine and carousel operating parameters at the beginning of the change.
Sustainability 17 04779 g007
Figure 8. Pressure course in free decompression.
Sustainability 17 04779 g008
Figure 9. Proposal for the location of the sensor and selection of the setting of the water press drying time in the carousel diagram.
Sustainability 17 04779 g009
Figure 10. OEE indicator components.
Sustainability 17 04779 g010
Figure 11. List of failures on 1–10 May 2021.
Sustainability 17 04779 g011
Figure 12. The OEE chart for each working shift in the state of May 2021.
Sustainability 17 04779 g012
Figure 13. A list of OEE with press efficiency.
Sustainability 17 04779 g013
Table 1. Fragment of guidelines from the 5S audit questionnaire [65].
CategoryAspect
1. Selection:
Separation of the required items from the unnecessary items
The workplace only has the needed equipment and tools.
The workplace only needed spare parts, materials, and production in progress.
There are only the necessary documents in the workplace. Outdated or, for other reasons, no longer needed posters are removed.
Information, advertisements, reports, etc., are removed from the workplace.
There are no unnecessary elements on the stairs.
Safety hazards are under control (water, oil, chemicals). Pedestrian crossings, gravel roads, and equipment are cleared.
An emergency is not planned.
2. Systematics:
Assigning a place to the necessary object, tools
Everything has its place in this place
Firefighting hoses, fire extinguishers, and other emergency equipment can be found in visible and properly marked places.
Areas requiring the use of personal protection measures are marked.
Places for pallets, production in progress, materials, forklifts, devices, waste, and red containers are clearly marked.
The tools have their designated storage location within the operator’s range. The place is properly marked; it is easy to see the lack of a tool. Shadow boards are in accordance with the standard.
Items are stored in place right after use.
3. Cleaning:
Regular cleaning of the workplace, machines, and their surroundings.
Cleaning is checking
Cleanliness, ways to maintain cleanliness, and order
Floors, walls, and stairs are clean, not greasy. No scattered materials, spilled water, or oil.
Working surfaces (machines, countertops, furniture, and other equipment, including electric mailboxes) are clean, unobstructed, and undelivered.
Tools and documents are clean and—if possible—
stored in a way that protects them from dirt and damage.
All personal protective equipment is maintained in proper sanitary and technical condition.
Cleaning equipment is properly stored and ready for use, if necessary.
4. Standardisation:
Defining the principle and developing standards so that previous activities become a habit
Maintaining and monitoring the first three categories
There is a 5S table. It is entitled, clean, and ordered,
The information on it is valid.
All important working instructions are developed and visible.
The 5S standard was developed for the area.
Control lists/schedules for all cleaning and maintenance works are developed.
Quantitative restrictions are visible.
5. Self-improvement:
Fixing standards and their continuous improvement
Respect for the rules and improvement
All employees are trained in the range of 5S.
Changes/daily and weekly 5S checks take place regularly.
5S audits are carried out as planned.
The results of the previous audit are hung, clearly visible to the whole team. Actions are carried out on time.
S5 improvements are proposed and implemented (resulting from the audit).
Table 2. Optimisation of TS-type fittings.
NoCausesSolutionsActionsPerson Responsible
1Common tools for several operators.Delivery of the mix with the sito set + mug + bucketTo be doneMaster
2A lid was not cleaned after the previous change.Cleaning the dent—routine by the procedureTo be doneOperator/Master/leader
3Lubrication of components is made individually, not from two parts at once.Painting two parts at the same timeTo be doneOperator/Master/leader
4Inadequate cup—there was no mixing.Mix at the position, checking the possibility of extending the track + transferring the shelf.Long-term planProduction Coordinator
5Cubes for mash.We make the dimensions we want to have in 3D if we order the ok formLong-term planTechnologist
6A waste of time looking for a mix.Mix at the position, checking the possibility of extending the track + transferring the shelfLong-term planTechnologist
7Tool failure.Schedule checking tools at the descent from the carouselTo be doneToolbox
8Fitting.Adaptation of the helperLong-term planSteering wheel
9CD travel time.Checking if the carousel is treated as a priority TSTo be doneProduction Coordinator
10Table work.Between four and five, there is a big difference—four walks faster, and the times need to be checkedTo be doneProduction Coordinator
11No appropriate mugs.Intermediate change + test laboratoryLong-term planTechnologist
12No materials are helpful for the position.Workshop 5STo be doneMaster
13No marking on the Mandril pressing for pressing mats.Mat height determinationTo be doneToolbox/Technologist
14No prior preparation of mixes and cubes.The helper is preparing for three cubes, receives TS, rubs, and dresses in sacks.Long-term planSteering wheel
15Incomplete standard of work.Checking SIPS updates, e.g., tapeTo be doneTechnologist
16No instructions on how to set the ankles—the operator tried to put on four pieces of centring cubes, and there should be two.Charging instructions, list for tool scrapers,Long-term planToolbox
17A high percentage of waste in the process is mainly due to unnecessary movements.Workshop 5STo be doneMaster
18Lack of appropriate tools is described.Workshop 5STo be doneTechnologist
19Lack of visible
plan for the implementation that remained.
Workshop 5STo be doneTechnologist
20Waiting too long for a plate.Workshop 5STo be doneProduction Coordinator
21Tape dispenser.Dispenser testsTo be doneMaster
22Marking the places where it is to be shortened with a band.Adding explanatory inscriptionsTo be doneTechnologist
23Marking of the centring cubes: up and down.Marking of the top-centres to the bottom-colour + information to SIPTo be doneTechnologist
24Form trip switch to the pedal.Replacement of foot protection with fullTo be doneTechnologist
25Project change forms.Installation of double exits to compressed airTo be doneTechnologist
Ergonomics of fastening tools (lighter, smaller shape, different construction), lifting holderLong-term planProduction Coordinator
Determining the standard for starting the press. Performance by the press test techniqueTo be doneMaster
Source: Based on own study [66].
Table 3. List of performance on the press with the OEE indicator of 18.06.2021.
ChangeNumber of PiecesNumber of CyclesNumber of EmployeesProduction Stopping Failures, minPress Performance, %OEE,%
1 252756 + 3·0.5 = 7.54.18101.9278.9
2245788 + 3·0.5 = 9.59.5789.4784.6
3263809 + 1·0.5 = 9.57.22 + 2.17 + 0.5 = 9.8991.9790.6
Table 4. A fragment of the table of the number of cycles, time losses incurred and the average time of the cycle of data from the company of 1 May 2021.
01-May-21
Change/Number of CyclesChange/Number of CyclesChange/Number of Cycles
1/852/733/81
LossCycle TimeOutLossCycle TimeOutLossCycle TimeOut
Falsehood00:04:04 Falsehood00:04:01 00:10:47 00:15:24
Falsehood00:04:01 Falsehood00:04:17 Falsehood00:04:20
00:05:4700:10:1400:02:24 00:06:45Falsehood00:04:17
Falsehood00:04:15 00:05:09 00:09:30Falsehood00:04:19
Falsehood00:04:11 00:01:16 00:05:37Falsehood00:04:15
Falsehood00:04:13 00:09:50 00:14:11Falsehood00:04:16
TS00:05:44 00:00:0800:04:29 TS00:05:37
TS00:05:4000:02:18 00:06:3900:00:25 00:05:02
Falsehood00:04:10 Falsehood00:04:13 TS00:07:47
Falsehood00:04:10 00:00:1100:04:32 Falsehood00:04:14
00:00:3200:04:59 00:05:55 00:10:16Falsehood00:04:24
Falsehood00:03:58 00:01:15 00:05:3600:04:40 00:09:17
00:00:5100:05:1800:00:1200:04:33 Falsehood00:04:08
Falsehood00:04:27 00:00:0900:04:3000:00:50 00:05:27
7Falsehood00:04:24 00:07:5400:12:15Falsehood00:04:14
Falsehood00:03:53 00:01:0300:05:24Falsehood00:04:13
Falsehood00:04:18 00:00:4200:05:03Falsehood00:04:08
Falsehood00:04:09 00:01:2100:05:4200:00:25 00:05:02
Falsehood00:03:58 00:03:3800:07:59Falsehood00:04:14
Falsehood00:04:14 00:06:0800:10:2900:01:36 00:06:13
00:00:3900:05:0600:01:1300:05:34Falsehood00:04:23
Falsehood00:04:10 00:00:1600:04:37 00:03:38 00:08:15
00:00:0100:04:28 00:00:0500:04:26 00:00:25 00:05:02
TS00:05:30 00:03:02 00:07:23Falsehood00:04:18
Table 5. List of the OEE indicators with press efficiency, number of cycles, and attendance.
May Number of CyclesOEE (%)Efficiency, %
Number of People on the Change (in the Number of People on Overtime)Change About the DayChange About the DayChange About the Day
GreyBrownBluePurpleDay123123123
108(2) 918573818470.483.190.3113.185.8
1014(5) 10287458390.651.485.8101.674.9100.6
9 810383708887.573.789.1109.796.8107
8117468726969.477.471.8103.276.8113.8
1077 553636658.464679196.3122.3
10810 633818834.283.690.780.589.298.3
99 10782907986.592.183.6106.6101.795.2
10,5 118884707287.572.17986105.989.9
11910973817878.183.583.291.492.784.9
11991070658480.369.788.9897674.6
101011(1) 118075668480.774.383.485.181.5
119 10127479797884.880.885.583.697.9
10 8101378837082.486.872.49497.8105.6
11 9111482867984.789.781.186.189.597
810111586748388.876.583.990.2104.795.1
1098 1672677780.472.481.197.4100.3116.5
108 111776657181.769.575.888.888.275.5
108 101879608183.66483.996.494.389.5
10 9101982677485.171.683.297.395.887.3
XXX9112005181055.687.5068.192.2
989 2166786273.88276.39089.2100.8
1198 2273677881.670.792.99488.386.5
118 1023748487809291.8102.892.692.5
11 11102486808785.286.389.993.194.587.1
91192579807675.2848375.993.392.9
910102642877662.991.284.136.395.496.3
10910 2777846879.49275.780.294.988.5
117 112880796486.584.758.380.478.5103.1
11 9112991826196.390.570.288.885.670.1
14(6) 8113086596491.564.268.989.460.380.3
810113185636693.870.57492.862.172.7
Table 6. General statement of analysed data for May 2021.
The average number of people10.28.79.310
The sum of the cycles1810148716331927
Average number of cycles78.767.67180.3
Medium OEE84.272.176.684.7
Average performance92.692.185.292.1
Table 7. Conditions for OEE > 85%—May 2021.
Average attendance/change for OEE > 85%10.4
Average number of cycles/change for OEE > 85%84.3
Average performance, %/change for OEE > 85%93.1
Table 8. The final result of the optimisation.
Average turnout/change for OEE > 85%10.6
Average number of cycles/change for OEE > 85%84.9
Average performance, %/change for OEE > 85%93.7
Disclaimer/Publisher’s Note: The statements, opinions and data contained in all publications are solely those of the individual author(s) and contributor(s) and not of MDPI and/or the editor(s). MDPI and/or the editor(s) disclaim responsibility for any injury to people or property resulting from any ideas, methods, instructions or products referred to in the content.

