Abstract
Manufacturing organisations face increasing pressure to assess and report their sustainability performance, particularly with the introduction of the European Sustainability Reporting Standards (ESRS). This paper presents a novel sustainability assessment framework that integrates ESRS guidelines with the Analytic Hierarchy Process (AHP) to provide a comprehensive evaluation methodology for manufacturing organisations. The framework addresses the limitations of existing approaches by systematically incorporating standardised sustainability indicators while enabling precise weighting of their relative importance. Through a structured approach, the framework evaluates environmental, social, and governance dimensions using both measurable and non-measurable indicators derived from ESRS guidelines. The methodology includes automated pairwise comparisons and weight calculations, significantly reducing the complexity traditionally associated with multi-criteria decision-making methods. The framework’s effectiveness is demonstrated through its implementation in a manufacturing organisation, where it successfully evaluated 38 sustainability indicators across 10 ESRS-defined subtopics. The case study highlighted areas requiring immediate attention, particularly in water and marine resources management, where performance fell below the established benchmark. This research contributes to both theory and practice by offering manufacturing organisations a structured approach to sustainability assessment that combines regulatory compliance with effective performance evaluation. The framework’s automated nature and integration of standardised reporting requirements make it particularly valuable for organisations transitioning to mandatory sustainability reporting under ESRS guidelines.
1. Introduction
Manufacturing companies are crucial to the economic development of nations, driving industrial growth and contributing significantly to global markets [1]. However, their operations often lead to extensive resource consumption and emissions, particularly in urban areas where 70% of Europe’s population reside. This concentration of manufacturing activities in densely populated regions amplifies their environmental impact, making sustainable practices increasingly critical [2,3].
In response to these challenges, consumer preferences and regulatory frameworks have evolved rapidly. On the one hand, organisations face mounting pressure from environmentally conscious consumers; on the other hand, governments are introducing stricter policies to address the environmental, social, and economic implications of industrial operations [4]. In particular, starting in 2024, about organisations will become subject to the new sustainability reporting standards of the European Union (EU), marking a decisive shift from voluntary to mandatory disclosure [5].
To meet these emerging requirements and stakeholder expectations, manufacturing firms must rigorously evaluate their sustainability performance. This assessment is essential not only for regulatory compliance but also for identifying areas of improvement and guiding strategic decision-making aligned with sustainability objectives [6,7,8]. Beyond regulatory adherence, many companies now view sustainability as an integral part of their long-term competitiveness. Initiatives such as adopting renewable energy, recycling programmes, and waste reduction practices reduce environmental footprints and improve brand reputation and stakeholder trust [9]. Complementary methodologies such as Green Lean Six Sigma (GLS) further support efficiency improvements, emission reductions, and economic resilience [10].
Despite the growing importance of sustainability, the literature on comprehensive assessment frameworks remains fragmented. Although various studies propose parameters and Key Performance Indicators (KPIs) for evaluating sustainability performance [1,11,12], existing methods show clear limitations. Index-based approaches, for example, often assign equal weights to all indicators, oversimplifying the complexity of sustainability dynamics in manufacturing contexts [13]. This is particularly problematic given the increasingly intricate regulatory environment defined by the European Sustainability Reporting Standards (ESRS) [14]. Moreover, while some authors have integrated multi-criteria decision-making methods into sustainability assessments, these attempts frequently lack systematic alignment with standardised reporting frameworks, limiting their practical applicability in real-world settings [15].
In addition, recent developments in Industry 4.0 highlight the potential of advanced automated approaches to assessing operational performance in manufacturing contexts [16,17,18,19,20]. Moreover, systemic analyses illustrate how Industry 4.0 and digital transformation impact the triple bottom-line of sustainability, reinforcing the need for integrated evaluation frameworks [21,22].
This study aims to overcome these gaps by presenting an innovative framework that reconciles regulatory compliance with effective sustainability management. Central to this approach is integrating the ESRS guidelines into the selection and structure of sustainability indicators, ensuring coherence with current requirements while maintaining analytical rigour. We enhance this integration with the Analytic Hierarchy Process (AHP), which enables the development of a weighted hierarchy of factors that accurately reflects their relative importance. In addition, the proposed framework automates key steps in the evaluation process, reducing complexity without sacrificing detail. This combination of standardisation, methodological rigour, and automation provides organisations with a practical tool to assess their performance, pinpoint areas for improvement, and make informed decisions that harmonise environmental responsibility with operational effectiveness.
The remainder of the paper is organised as follows. Section 2 examines the ESRS and the AHP, establishing the theoretical basis for the proposed framework. Section 3 outlines the proposed methodology and the development steps of the framework. Section 4 illustrates its practical implementation through a case study in a manufacturing firm, presenting both the application process and the resulting insights. Finally, Section 5 discusses the implications of the findings and suggests future research directions.
2. Methods and Related Work
The development of a comprehensive sustainability assessment framework requires a thorough understanding of both current regulatory standards and established methodological approaches. This section examines three key elements that form the basis of the proposed framework. First, we analyse the ESRS, the regulatory framework that defines sustainability reporting requirements for EU organisations. This analysis is essential, as the ESRS provides the structural basis for indicator selection and categorisation in the proposed framework. Second, we explore the AHP, the methodological tool that enables systematic weighting and evaluation of sustainability indicators.
2.1. European Sustainability Reporting Standards (ESRS)
The ESRS, developed by the European Financial Reporting Advisory Group (EFRAG) and approved by the European Commission, establish a cohesive, mandatory framework for sustainability reporting across the EU. Applicable to large enterprises and Small and Medium-sized Enterprises (SMEs), these standards align closely with the EU’s objective of becoming climate-neutral by 2050 [14]. Designed to align closely with the EU’s ambitious sustainability objectives, ESRS promotes transparency, accountability, and comparability in reporting practices. These standards are integral to achieving the broader goals of the European Green Deal, which aims to make Europe the first continent to be climate neutral by 2050 [23].
One of ESRS’s key objectives is to integrate Environmental, Social, and Governance (ESG) factors into organisational strategic planning. Incorporating ESG into decision-making processes helps businesses move from traditional models to more sustainable practices where climate resilience, social justice, and good corporate governance become central elements. This integration enables companies to assess not only their environmental and social impacts but also their risks and opportunities in the face of global challenges such as climate change and resource depletion.
ESRS plays an essential role in ensuring compliance with EU regulations and enhancing the validity and reliability of information. By providing harmonised metrics, ESRS not only facilitates compliance with EU regulations but also supports stakeholders, investors, regulators, and consumers in accessing comparable and credible sustainability data. This harmonisation is crucial for integrating ESG considerations into strategic decision-making and unlocking sustainable finance opportunities. In addition, ESRS provide harmonised and universal measurement and reporting methods, bridging information gaps between companies, industries, and countries. Such unified approaches become particularly relevant in a globalised economy, as international supply chains and investment flows require standardised sustainability metrics. Companies implementing ESRS are empowered to comply and signal their commitment to responsible and sustainable business practices.
Another important feature of ESRS is their ability to transform corporate culture. These standards provide a structured methodology for assessing and managing ESG impacts, encouraging companies to innovate. Organisations are incentivised to adopt technologies that reduce carbon footprints, improve energy efficiency, and promote a circular economy. This approach helps not only to identify areas for improvement but also to strengthen companies’ competitive position in the marketplace.
Among global sustainability frameworks, the ESRS exhibits significant alignment with the Global Reporting Initiative (GRI), sharing many of the requirements [24]. However, the ESRS have features that set them apart from other standards, including the GRI. They are adapted to the European context and consider specific regional conditions, including legal, environmental, and social features. Unlike the voluntary GRI framework, the ESRS is mandatory and a powerful tool for achieving the EU’s climate and social goals. It was developed with input from various European stakeholders, including non-governmental organisations, industry, and regulators. This ensures that the ESRS reflects regional priorities and needs while remaining universal across sectors.
ESRSs also play an important role in integrating the United Nations’ Sustainable Development Goals (SDGs) into corporate strategies. They help companies go beyond simply meeting regulatory requirements, turning their activities into active contributions to global goals. ESRS is creating a more responsible marketplace where consumers, investors, and regulators have access to transparent, reliable, and comparable information. This, in turn, contributes to building trust and developing a more equitable and sustainable economic system.
Ultimately, ESRSs are becoming not only a regulatory tool but also a strategic enabler for the transformation of the business environment in Europe. They provide companies not only with guidance on how to assess their impact but also with a platform to create new opportunities, build trust, and increase resilience in the face of global challenges. This approach enables European businesses to become a global role model for sustainability.
The ESRS framework encompasses various measurable and non-measurable indicators. In addition to disclosing the current sustainability impacts, the ESRS requires a statement on the future goals and organisational strategies for the short-term, mid-term, and long-term. ESRS consists of four main parts [25], including general information and environmental, social, and governance information (Figure 1).
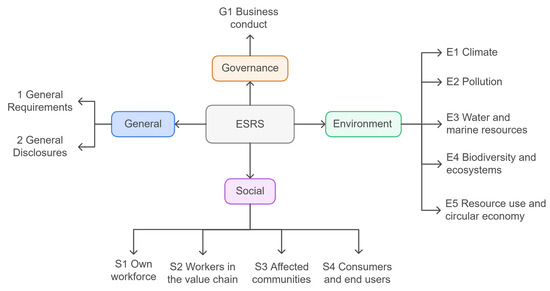
Figure 1.
Structure of the ESRS.
The General category forms the basic reporting framework, including general requirements and disclosures that serve as the basis for the entire ESRS system and apply to all organisations that adhere to the standards. The Environment category covers five key areas, including climate change (E1), pollution (E2), water and marine resources (E3), biodiversity and ecosystems (E4), and resource use and the transition to a circular economy (E5), highlighting the priority of minimising environmental impacts. The Social category is divided into four areas, assessing the impact of organisations on their staff (S1), workers in the value chain (S2), affected communities (S3), and consumers and end users (S4), allowing the social dimensions of sustainability to be taken into account. The Governance category focuses on business behaviour (G1), encompassing corporate culture, ethical standards, and governance mechanisms, ensuring compliance with sustainability principles and improving corporate accountability. The nominated ESRS categories and related indicators are structured in Table 1. In this study, we focus on the Environmental, Social, and Governance categories, omitting the General category since it primarily provides overarching guidelines rather than discrete, quantifiable indicators. Concentrating on dimensions E, S, and G aligns with our objective to establish a quantifiable ESRS-compliant sustainability assessment.

Table 1.
ESRS sustainability structure [25,26].
For ease of analysis, the ESRS structure is divided into sub-topics and sub-sub-topics, allowing for a more precise and detailed consideration of the main aspects of environmental, social, and governance reporting. This hierarchy facilitates data systematisation and is required for pairwise comparisons under AHP. The four-level hierarchical structure is shown in Figure 2. Furthermore, as an example, Figure 3 provides an example of how hierarchical structure is established, starting from the goal to the indicator level for one subtopic, i.e., resource use and circular economy (E5).
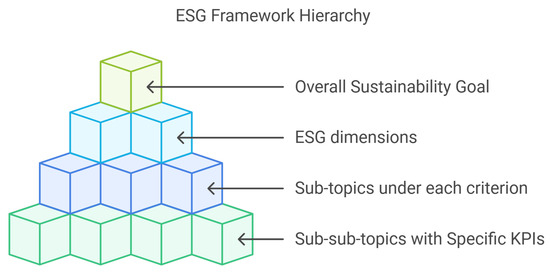
Figure 2.
ESG framework hierarchy.
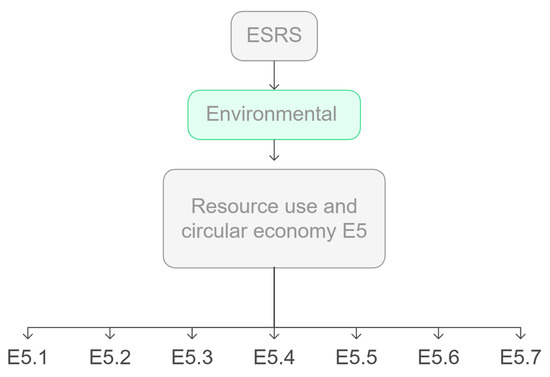
Figure 3.
Example hierarchical structure for subtopic E5.
The first dimension of the ESRS structure, i.e., the environmental information, consists of five sub-topics (E1–E5), which are further subdivided into 43 sub-sub-topics (metrics or indicators) [27]. It contains information on adaptation, mitigation, greenhouse gas emissions, soil, air, and water pollution, metrics for the use of water resources, and the amount of water discharged into the oceans. It also includes information about the impact of land desertification, land degradation, species, total waste, and waste management. The social information comprises four sub-topics (S1–S4) and 21 sub-sub-topics. It comprises information about individuals or groups of individuals relevant to the organisation, including their workers or workers in the value chain. It also encompasses information about end users of the products and all affected communities. The last part of the ESRS structure, i.e., the governance, has one sub-topic and four sub-sub-topics and discloses the framework adopted by the organisation for identifying, investigating, and reporting violations of the code of conduct. It also reports information on the protection of whistle-blowers and the prevention of corruption and bribery. These three dimensions include ten sub-topics and 68 sub-sub-topics, referred to as metrics or indicators (Figure 1).
This subdivision of ESRS simplifies the structure, providing clarity and convenience in data collection, analysis disclosure, and further computation.
2.2. Analytical Hierarchy Process for Sustainability Assessment
The AHP is a widely used multi-criteria decision-making method that structures complex evaluations into hierarchical levels. Developed by Thomas Saaty [28], AHP structures complex problems hierarchically, breaking them into simpler and more manageable components. This hierarchical organisation facilitates systematic pairwise comparisons, in which decision-makers assign relative weights to criteria based on their importance [29]. This capability is particularly useful in contexts where trade-offs are necessary, such as balancing the environmental impacts of a project against its economic benefits or reconciling short-term corporate profits with long-term sustainability goals.
In recent years, AHP has become an important tool for integrating sustainability into corporate strategies, especially within ESG analyses—environmental, social, and governance responsibility [30]. The methodology provides not only a comparison of priorities but also a consideration of their interrelationships. In the environmental context, it helps to assess the effectiveness of measures to reduce carbon emissions, rationalise resource use, and reduce environmental impacts. In the social sphere, AHP identifies how labour practices, equity, and community engagement affect the long-term goals of the business. On the governance side, the method supports analyses of corporate transparency, anti-corruption, and ethical standards. AHP integrates all three aspects of ESG into a single framework, contributing to the formation of holistic strategies.
Previous studies have applied AHP to prioritise renewable energy solutions, evaluate circular economy strategies, and assess supplier sustainability. For example, it has been used to prioritise renewable energy projects by weighing criteria such as cost, energy efficiency, and ecological impact [31]. Similarly, in transitioning to a circular economy, AHP helped to evaluate strategies based on their potential to reduce waste, improve resource efficiency, and drive economic viability [32]. In addition, organisations use AHP to assess the sustainability of suppliers, incorporating both quantitative metrics and qualitative assessments into the decision-making process [33].
Despite its robustness, AHP can be challenged by subjective inputs and potential inconsistencies in expert judgments. Recent advances, such as the integration of fuzzy logic [34] or other uncertainty management techniques [35], enhance the reliability of AHP, allowing for more confident application in contexts where qualitative evaluations play a key role. By combining AHP with the ESRS framework, we establish a systematic method to weigh and integrate ESG indicators, resulting in a customised sustainability index. This integrated approach supports compliance with evolving EU reporting standards and offers organisations a practical, data-driven tool to identify improvement areas, guide strategic decisions, and improve overall sustainability performance.
3. The Proposed ESRS-AHP Integrated Sustainability Assessment Framework
The importance of a structured approach to assessing sustainability in manufacturing has been highlighted, pointing out the limitations of existing methodologies and the potential offered by integrating ESRS and AHP. Although the ESRS provides a standardised set of sustainability indicators and reporting guidelines, the AHP offers a systematic method to weigh and prioritise these indicators according to their relative importance. By merging these two components, the proposed framework ensures that the resulting Sustainability Index (SI) not only complies with regulatory requirements but also accurately reflects the strategic objectives and context-specific needs of the organisation under evaluation.
The rationale behind this integration is two-fold. First, the ESRS serves as a reference point that ensures that the assessment covers all critical dimensions, environmental, social, and governance, and is aligned with the latest EU regulations and stakeholder expectations. Second, the AHP supports informed decision-making by assigning meaningful weights to a hierarchy of criteria and sub-criteria. This approach avoids the common pitfall of equal weighting, which often oversimplifies complex sustainability challenges. Instead, our framework acknowledges that some indicators may be more relevant than others, depending on corporate priorities, industry-specific factors, and performance benchmarks.
Figure 4 provides an overview of the proposed framework. The process begins with the definition of a high-level sustainability objective, from which the main ESG dimensions are derived and further broken down into sub-topics and specific indicators (Section 3.1). This is followed by a hierarchical structuring of the ESG dimensions and indicators, to which the AHP method is applied for weight determination. The data of the measurable and qualitative indicators are then collected and normalised to ensure comparability (Section 3.2). The AHP-based weight determination process follows, allowing experts to perform pairwise comparisons and assign relative importance to different hierarchy elements (Section 3.3). Consistency checks are performed to validate the reliability of expert judgments before aggregating weighted indicators into a single SI, providing a clear picture of organisational sustainability performance (Section 3.4). Finally, we introduce a software application that automates and streamlines the entire process, providing a user-friendly interface, data visualisation tools, and adaptability to different data sets and evolving standards (Section 3.5).
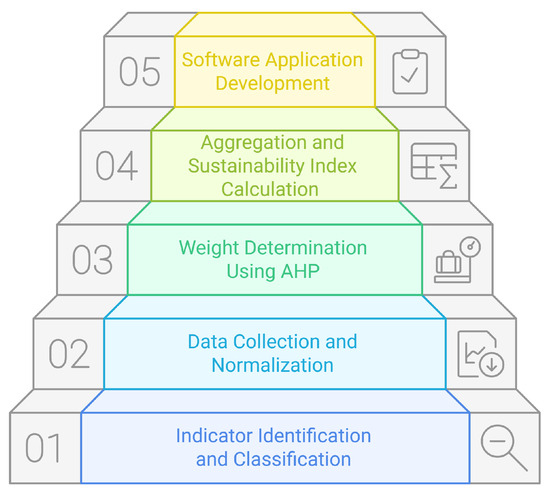
Figure 4.
Phases of the proposed ESRS-AHP assessment framework.
By transforming heterogeneous data into a structured hierarchy of weighted indicators, the ESRS-AHP framework provides a snapshot of an organisation’s sustainability status and a roadmap for continuous improvement. Once the SI is calculated, decision-makers can pinpoint specific ESG domains or subtopics that fall short of desired benchmarks, thereby identifying clear areas for intervention. This level of transparency and objectivity allows organisations to move beyond simple compliance, using the SI as a strategic compass to guide policy adjustments, resource allocation, and long-term planning. In the following sections, we apply our framework to a real-world case study, demonstrating how the resulting insights can be leveraged to refine sustainability strategies and enhance overall performance.
3.1. Indicator Identification and Classification
ESRS provides a comprehensive set of indicators in three dimensions; that is, environment, social, and governance [25]. However, the selection criteria of a KPI depend on its relevance, actionability, and stakeholder inclusiveness. A selected KPI should provide strategic insights to the managers [36]. It should provide information about its future impacts, current status, and direction, helping the organisation in their strategic decision-making. The study [25] summarises 68 indicators (Table 1) under three dimensions of sustainability, i.e., environment, society, and governance, as suggested by ESRS guidelines [26].
Once the KPIs were selected, they were classified into two categories: measurable and non-measurable indicators:
- Measurable KPIs are those that rely on quantitative data, which can be collected from the organisation’s databases or reports. These indicators provide objective, numerical insights into performance, such as total water consumption, total water recycled, or total water restored.
- On the other hand, non-measurable KPIs are qualitative in nature and often require management assessments or expert judgments. These indicators reflect aspects of sustainability that cannot be easily quantified, such as freedom of expression or social inclusion and ethical marketing.
3.2. Data Collection and Normalisation
The data used for the analysis were collected through a combination of direct measurement and managerial assessments. Specifically, measurable indicators were derived directly from organisational records, ensuring accuracy and consistency with the actual operations. In contrast, non-measurable indicators were assessed subjectively by industry managers, who provided scores based on their professional judgment. These scores, typically assigned on a scale from 0 to 10, allowed for the inclusion of qualitative aspects that are not easily quantifiable.
To integrate these diverse indicators into a unified framework, normalisation techniques were employed to standardise the data. Normalisation converts values with different units and scales into dimensionless quantities, enabling their aggregation into a single sustainability score. Among the various normalisation methods discussed in the literature [27], such as worst–best case, benchmark normalisation, and expert judgment, the choice of technique was guided by the nature of the data and the characteristics of each indicator, i.e., unit of the indicator and range of data. For this study, the worst–best case and benchmark normalisation methods were selected based on their suitability for the metrics involved.
The worst–best case normalisation approach defines the scale by establishing the worst and best possible scenarios for each indicator. For example, in the case of water recycling, the worst-case scenario is 0% recycling, which corresponds to a normalised score of 0. Conversely, achieving 100% recycling represents the best-case scenario and is assigned a normalised score of 10. This method provides a clear and intuitive way to quantify the relative performance of an indicator based on its potential impact. In contrast, benchmark normalisation calculates normalised values by comparing actual measurements with predefined reference points or benchmarks. These benchmarks can be derived from industry standards, regulatory thresholds, or the average performance within the sector. This method ensures that the evaluation reflects both absolute and relative performance, offering a nuanced perspective on how each indicator measures up to established expectations.
To ensure comparability and objectivity across different assessments using this framework, the selection process for benchmark values should be transparently documented and justified, ideally relying on established industry standards, regulatory thresholds, or statistically relevant peer group performance data where available. Together, these normalisation techniques provide a robust framework for analysing and aggregating indicators, enabling a comprehensive assessment of sustainability performance.
3.3. Weight Determination Using AHP
The process of determining weights in AHP begins with pairwise comparisons of items at each level of the hierarchy. For assigning the weights to the different indicators, many scholars used equal weights for the initial sustainability assessment. However, assigning equal weights does not reflect the actual situation. The AHP has been widely used in assigning weights to different indicators and making Multi-Criteria Decision-Making (MCDM). Experts rate the relative importance of items using the Saaty [28] scale, where values from 1 to 9 reflect the degree of preference of one item over another. For example, a value of 1 indicates equal importance of the items, whereas 9 indicates an absolute preference of one item over another. The results of pairwise comparison are recorded in a square matrix of order n:
where
Here, n is the number of items under the same parent node.
The pairwise judgment is based on the parent node; in this case, it was ‘Environment (E)’. We have and thus a matrix (Table 2). This pairwise comparison is done for all the hierarchical levels and all the parent nodes. Table 3 shows the description of each scale value.
Table 2.
Pairwise comparison at level 2.
Table 3.
Pairwise comparison scale [37].
After the square matrix of pairwise comparisons is constructed, the weights for each element are calculated. First, for each column of the matrix, the sum of all its values is calculated, which is necessary for further normalisation. Then, each value in the column is divided by the corresponding sum to bring the data to a proportional form that reflects their relative importance. The average value for each row of the matrix is then calculated, which becomes the weight of the item, representing its relative importance. This process translates the qualitative expert judgements into quantitative data, which are used in the next stages of the analysis to determine the final SI.
When we make pairwise comparisons in real-world scenarios, it is almost impossible to completely avoid errors in judgment. These small mistakes can lead to inconsistencies in the decision-making process, especially in MCDM frameworks. To evaluate how consistent the judgments are within a matrix, we use a metric called the Consistency Ratio (CR). This ratio is calculated with the following formula:
The RI, or Random Index, is a value that reflects the average Consistency Index (CI) for a randomly filled matrix. The exact value of RI depends on the size, or order, of the matrix, and these values are listed in Table 4. To ensure reliable results, a CR of less than 0.1 is generally accepted as a threshold for consistency [38].
Table 4.
Tabulated Random Index (RI) values for different matrix orders from Saaty [28].
Now, we calculate the CI using the following formula:
Here, n is the number of criteria (the matrix order), and is the largest eigenvalue of the comparison matrix. Together, these metrics help us understand and improve the reliability of the decision-making process.
3.4. Aggregation and Sustainability Index Calculation
The Sustainability Index () calculation process is a sequential aggregation of data at all levels of the hierarchy. This process takes into account normalised indicator values and weights, allowing information to be aggregated from the level of individual indicators to the level of the organisation as a whole. This approach ensures transparency and systematicity, ensuring that each element of the hierarchy contributes to the final indicator according to its importance.
After assigning weights to the elements at each hierarchical level and normalising the indicators’ values, the final step is to aggregate the SI. The aggregation procedure starts from the indicators’ level and eventually moves towards the final SI at the organisational level. Starting from the lowest level, the sustainability score for the parent sub-topic is calculated using the following equation:
Here, is the subtopic score, is the normalised indicator value, is the indicator weight, and n is the total number of indicators associated with the subtopic. This formula ensures that the contribution of each indicator is correctly accounted for by weighting them according to their relative importance.
After obtaining the sustainability score at the sub-topic level, they are aggregated to produce values at the level of the main sustainability dimensions (next higher level): Environmental (E), Social (S), and Governance (G). These dimensions combine subtopics within each of the ESG’s core areas using the following formula:
- -
- Environmental (E):
- -
- Social (S):
- -
- Governance (G):
In these formulas, , , and represent subtopic weights for environmental, social, and governance dimensions, respectively, and , , and represent subtopic-level sustainability scores for each dimension. Thus, the formulas make it possible to combine all dimension-specific subtopic information into summary indices E, S, and G.
In the last step, the final is calculated by combining the values of E, S, and G based on their relative importance to the organisation. The final formula is as follows:
Here, , , and represent the weights of the main dimensions: environmental, social, and governance. This formula allows us to combine all levels of the hierarchy into a single metric reflecting the overall level of sustainability of the organisation.
As we used 5 as a baseline value during normalisation, sustainability index values can be interpreted using the following qualitative thresholds: values below 5 are considered ‘poor’; values; between 5.00 and 7.99 are considered ‘satisfactory’; and values between 8.00 and 10.00 are considered ‘good’. The threshold value of 5 was chosen based on the company’s historical performance and validated through discussions with domain experts. Furthermore, the 0–10 scale and the use of mid-range reference values are consistent with practices commonly adopted in the sustainability assessment literature [13,27].
Thus, the proposed methodology provides a rigorous and systematic approach to calculate the SI. The formulas at each level reflect the relationship between the normalised indicator values, their weights, and their overall contribution to the final index. This process allows both quantitative and qualitative data to be taken into account, providing a reliable tool for analysing and making strategic decisions on sustainable development.
3.5. Software Application Development
The developed software application for assessing the sustainability of organisations is based on a MySQL database, which is organised in a hierarchical structure that complies with ESRS standards. This structure includes three main tables: ‘esrs’, ‘sub-topic’, and ‘sub-sub-topic’. These tables allow data to be organised at different levels of the hierarchy and provide the necessary basis for performing the AHP.
- ‘esrs’ table: Each row represents a unique ESRS standard and its associated topic. These tables represent the dimension level of the hierarchical structure, i.e., environment, society, and governance.
- ‘sub-topic’ table: Sub-topics are specific areas or components within a particular ESRS. For example, there are five sub-topics for the environmental dimension (E1–E5), four for the social (S1–S4), and one for the governance (G1).
- ‘sub-sub-topics’ table: This table contains sub-sub-topics, which are the lowest-level components (indicators) under each sub-topic. Additionally, it can link to the related Audit Report (AR) and a question for more detailed evaluation or reporting.
The ‘esrs’, ‘sub-topic’, and ‘sub-sub-topic’ tables are populated with data from external sources such as an Excel document, which provides detailed information on each ESRS, its sub-topics, and sub-sub-topics. Further, the system uses the AHP methodology to make pairwise comparisons between different elements at each hierarchical stage. This simplifies the evaluation process, improving accuracy and consistency in sustainability analyses. Normalised data and calculated weights are used to calculate the SI at each level of the hierarchy, starting with indicators and ending with an overall index for the entire organisation.
An important part of the application’s functionality is the ability to not only process the data, but also to visualise the results. The system provides the user with graphical representations of the calculated weights and indices, which helps to better understand the relative importance of different indicators and subtopics. This makes the evaluation process more transparent and intuitive for users.
In addition, the application supports flexibility in working with different datasets. It can be easily adapted to work with different reporting standards, making it a versatile tool for analysing sustainability. The system also allows users to make adjustments to the data and weights, enabling re-calculations to take into account changed conditions or requirements.
The final functionality of the application provides organisations with a powerful tool for systemic sustainability analysis. The application not only reduces labour costs and eliminates errors associated with manual processes but also enables more informed decisions based on accurate and structured data.
4. Case Study and Results
This sustainability assessment was carried out on a European polymer flooring company whose name has been withheld to ensure confidentiality in accordance with the data access agreement. The organisation is a major player in the industry, specialising in the development of innovative and sustainable flooring solutions. The focus is on product sustainability, including the use of recycled materials, improved energy efficiency, and reduced emissions during production.
Operating within the European Union places strict requirements on the company to comply with labour laws, environmental regulations and corporate governance standards. This creates a favourable environment for the integration of ESRS standards, as most of the provisions related to human rights and labour are already implemented in the company’s operations. Nevertheless, the sustainability assessment was aimed at identifying additional opportunities for improvement in the areas of environment, social responsibility, and corporate governance.
Following the methodological steps in Section 3, and to better understand the proposed approach, a detailed and step-by-step procedure is explained for calculating a manufacturing organisation’s SI.
4.1. Step 1: Indicator Identification and Classification
As mentioned in the previous sections, the approach followed the ESRS guidelines for selecting and structuring the KPIs, i.e., three dimensions, ESG and 10 subtopics (E1–E5, S1–S4, G1). The final inclusion and exclusion of KPIs followed the criteria mentioned in Section 3.1, i.e., relevance and actionability. For example, the case study organisation does not use a ‘nature-oriented area’; therefore, it is not included. Also, the indicators related to radioactive waste have not been used due to their irrelevance in the organisation’s context. A total of 38 indicators were selected, and a hierarchical structure was developed, as shown in Table 5. This organisation enabled the next analysis stage, which involved automating pairwise comparisons and calculating weights to determine an SI. These 38 indicators have been classified into 9 non-measurable indicators (S1.3, S2.1, S3.2, S4.1, S4.2, S4.3, S4.4, G1.3, and G1.4) and 29 measurable indicators.
Table 5.
Summary of indicators and measured values.
4.2. Step 2: Data Collection and Normalisation
Data collection was carried out in two phases. For the measurable indicators, for example, water consumption (E3.1), the values have been taken from the organisational database. Management has provided the values of the non-measured indicators based on their judgments. For such indicators, the management directly assessed their performance on a scale of (0–10) and assigned a value, which was later used in the aggregation of overall SI; for example, secure payment methods (G1.4) and ethical marketing (S4.4). As the non-measurable indicators do not have quantifiable numbers at this stage, they are presented by ‘-’ in the “measured value” column of Table 5.
Particular attention was paid to stakeholder engagement. As the company specialises in the production of polymer flooring, key stakeholders involved in the data collection process include management representatives, production staff, sustainability experts, raw material suppliers, and regulatory compliance officers. The management representatives provided strategic insights and self-assessments for non-measurable indicators, while the production staff contributed operational data related to resource consumption and efficiency. Sustainability experts ensured that environmental and social aspects were accurately reflected in the dataset. Raw material suppliers played a crucial role in providing data on material sourcing and recyclability, while regulatory compliance officers ensured that reported figures aligned with industry standards and legal requirements.
All indicator values were normalised on a scale of 0 to 10 to eliminate heterogeneity in the data. This study used two normalisation techniques: the best–worst case method and benchmark normalisation. The choice of the best–worst case method is obvious for the indicators having a value within the specified range. The choice of benchmark normalisation helps to obtain insights into the contextual sustainability performance of the organisation by comparing the indicators with the industrial reference values, which can be a good starting point for sustainability improvements. As mentioned in Section 3.2, these benchmarks can be derived from industry thresholds and regulatory frameworks. However, for this case study, the benchmarks have been derived from the organisation’s historical performance data as a starting point for its sustainability assessment. Comparing current organisational performance with its historical performance as a benchmark provided contextual relevance and consistency for the initial application of the sustainability assessment framework.
A value of 5 was used as the base value for normalisation relative to the benchmark. The normalised value is calculated using the formula:
If an indicator has a negative impact on sustainability (e.g., a lower value is better for sustainability), the normalised value is calculated as follows:
The ‘best–worst case’ method is used for indicators whose values fall within a certain range. For example, the share of renewable energy ranges from 0% to 100%, where 0 is the worst case, and 10 is the best case. This allows the data to be effectively normalised and assigned values based on their impact on sustainability.
Normalising the data allows all indicators to be considered on a single scale, which simplifies further aggregation and calculation of the SI. It must be noted that non-measurable indicators do not need to be normalised, as the management already assigned a score between 0 and 10 based on their self-assessment. Table 6 shows the respective normalised values against all the indicators.
Table 6.
Comprehensive table of sustainability scores at the sub-topic level.
4.3. Step 3: Weight Determination Using AHP
Pairwise comparisons were made by experts, including industry professionals and researchers, to assign weights to the elements. In particular, a pool of 39 experts was involved: 11 professors and associate professors, 4 researchers, 8 senior managers, and 16 deputy managers. The experts were selected from academia and from companies operating in the manufacturing industry, all with demonstrated expertise in sustainability, ESG integration, and regulatory compliance. The academic participants represented various disciplines, including engineering and economics, which allowed us to cover both technical and managerial dimensions of the evaluation process. All of these experts were considered as a single group, and their judgments were aggregated to reduce individual bias. The reliability of the AHP coefficients was kept in check by the consistency ratio. This consistency check is further explained in the same section.
Since several indicators, particularly in the social and governance dimensions, rely on subjective expert judgment, specific attention was devoted to the verification of such data. The case company is based in the EU and complies with the ESRS, which mandates external audits of sustainability disclosures. This regulatory context incentivises companies to avoid misrepresentation or selective reporting. In fact, it is often the case that companies adopt a conservative, self-critical approach in their internal assessments out of concern for reputational or legal consequences during audit. This internal pressure increases the credibility of the subjective weights used. Nonetheless, future improvements could include additional triangulation methods such as external ESG audits, stakeholder consultations, or third-party benchmarking.
The corresponding tables in the application have been populated in the light of these judgments by the experts, and the application calculates the relative weights at each level of the hierarchy. The experts were asked to revise their judgments in case of inconsistent pairwise comparisons. For example, a pairwise comparison with consistency ratio calculation for the elements under the sub-topic of climate change (E1) is shown in Table 7.
Table 7.
Table of climate change (E1) relationships.
Normalising the columns of the matrix and calculating the mean values of the rows allows the indicator weights to be determined. Table 8 shows the final indicator weights for the climate change subtopic.
Table 8.
Weights of the indicators under the sub-topic of climate change (E1).
The maximum eigenvalue and the calculated consistency indices are used to evaluate the consistency of the pairwise comparison matrix. The maximum eigenvalue is defined as the value satisfying the following equation:
where A is the matrix of pairwise comparisons and w is the normalised vector of weights. For this example:
Based on , the CI is calculated using the following formula:
The final consistency check uses CR, which is defined as the ratio of CI to the :
Since the value of , the matrix of pairwise comparisons is considered consistent. Similarly, all the metrics at the level of the indicator have been subjected to the pairwise comparison for their respective weights assignment (Table 6).
4.4. Step 4: Sustainability Index Calculation
As part of the research, the Sustainability Index (SI) was calculated for the analysed company. The calculations were carried out in accordance with the proposed methodology, starting from the level of indicators and going up to the level of ESG subtopics and dimensions. At each level, data were aggregated, taking into account normalised indicator values and their weights.
At the indicator level, subtopic sustainability values () were calculated using the weighted sum of the normalised data. The results obtained at the subtopic level are presented in Table 6.
Next, calculations were performed for ESG dimensions (E, S, G) using subtopic values and their weights:
In the final step, the three dimensions were combined to obtain the overall SI of the company using the following formula:
The totals for each dimension (E, S, G) and the overall are shown in Table 9. These results provide a comprehensive view of the organisation’s level of sustainability and provide a basis for further analysis. A discussion of the results and identification of key areas for improvement is presented in the next section.
Table 9.
Sustainability index breakdown.
4.5. Results and Analysis
A radar chart (Figure 5) shows the organisational sustainability performance at the sub-topic and dimension levels. The organisational sustainability performance seems satisfactory in the dimensions of social (7.73) and governance (9.58). However, the environmental (6.52) performance is close to the baseline value, i.e., five and needs improvements. At the sub-topic level, the organisation needs immediate improvements for water and marine resources (E3), as their sustainability score (3.67) is less than the set benchmark. The organisation may have moderate improvements in the sub-topics of climate change (E1) and biodiversity and ecosystem (E4), as they are also just slightly above the benchmark value, i.e., (6.04) and (6.44), respectively. Similarly, the compiled Table 6 and Table 9 provide insights into the areas of improvement even at the level of the indicators. Overall, the organisational SI of 8.13 suggests the satisfactory performance of the organisation, as it is above the benchmark value.
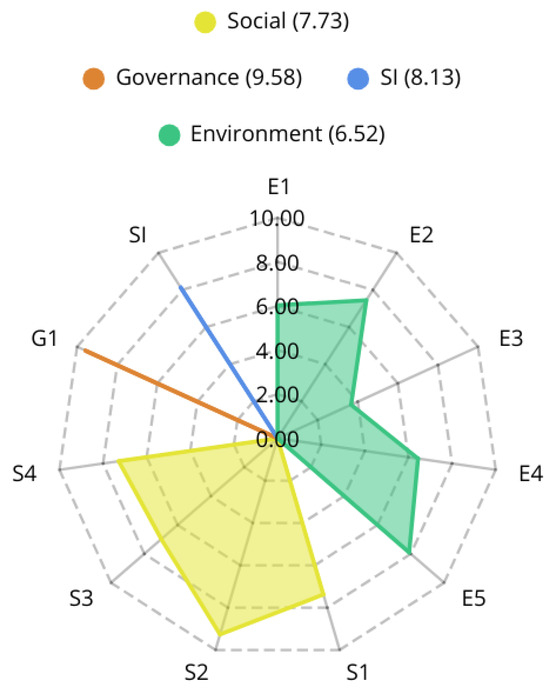
Figure 5.
Sustainability radar chart.
4.6. Local Robustness and Sensitivity Analysis
To verify the robustness of the Sustainability Index (SI = 8.13) against small changes in the top-level ESG dimension weights, we conducted an analysis in which each weight is perturbed by ±10% and then renormalised ().
The original weights are:
with dimension scores:
yielding
After varying each weight by ±10% and renormalising, we obtain the following SI values (Table 10). Even a 10% shift in any single dimension weight changes the SI by no more than ±0.07 (less than 1% of its value), confirming the stability of the index against small weighting uncertainties.
Table 10.
Sensitivity of the overall SI to ±10% perturbations in top-level ESG weights.
This analysis confirms the stability of the overall SI against moderate variations in the top-level dimension weights. A more extensive multi-level sensitivity analysis, exploring the impact of weight variations at the sub-topic and indicator levels, could be a subject for further research to investigate the model’s robustness across the entire hierarchy.
4.7. Discussion
This section contextualises our methodological choices and interprets the case study results to derive managerial insights and implications for future research.
While alternative multi-criteria decision-making methods—such as TOPSIS [39], Fuzzy-AHP [30], or DEA [40]—could have been applied, the AHP emerged as the most fitting for three main reasons. First, AHP’s hierarchical decomposition aligns directly with the multi-level structure of ESRS criteria, preserving granular regulatory details that would otherwise collapse into a single-layer model as would be necessary with methods like TOPSIS. Second, AHP’s transparent pairwise comparisons simplify stakeholder understanding and software implementation, avoiding the additional calibration complexity required by Fuzzy-AHP’s linguistic variables. Third, unlike DEA, which excels at relative efficiency analysis but lacks explicit weighting mechanisms, AHP embeds regulatory priorities quantitatively, ensuring that strategic sustainability goals dictated by ESRS carry the correct emphasis.
The case study demonstrates the effectiveness of the proposed ESRS-AHP sustainability framework, offering clear and structured information on sustainability performance within the analysed organisation. The aggregated sustainability index of 8.13 indicates good overall sustainability management; however, a detailed examination of each dimension reveals areas for critical reflection. Despite achieving a reasonable overall score (6.52), the environmental dimension exhibited notable weaknesses, especially within the climate change subtopic (6.04). Here, the relatively low proportion of the utilisation of renewable energy stands out as an immediate strategic concern. This suggests that, although the organisation complies with basic regulatory demands, it might not yet strategically prioritise long-term climate risk management. Managers should interpret this finding as a prompt to reconsider investment in sustainable energy sources, moving from a compliance-driven approach to a strategic proactive approach.
In contrast, the dimensions of social (7.73) and governance (9.58) demonstrated considerably higher scores, reflecting a commendable commitment to responsible business conduct and workforce management. However, the markedly strong performance observed in these areas requires careful consideration. High scores in governance indicators, such as the absence of reported incidents of corruption or unethical behaviour, may indeed represent genuine organisational integrity. However, these results are derived mainly from self-assessments, potentially subject to inherent managerial biases. Such biases could unintentionally inflate scores, particularly in sensitive areas such as governance or ethical practices, due to social desirability or reputational considerations.
Similarly, consistently high social dimension scores, particularly regarding workforce welfare and value chain management, could reflect genuine organisational strengths rooted in EU regulatory compliance. However, the subjective nature of qualitative indicators, assessed directly by organisational stakeholders, raises legitimate concerns about potential biases or overly optimistic self-perceptions. Managers and stakeholders should approach these high scores with balanced caution. Although positive, these results should ideally be validated through additional objective assessments or third-party audits to ensure reliability and credibility.
Critically examining these findings, the ESRS-AHP framework demonstrates its capacity to highlight not only areas requiring immediate intervention but also the need for careful verification of seemingly excellent results. Its structured weighting method provides transparency in prioritising strategic areas, aiding managers in allocating resources more effectively. However, this case study also underscores a crucial managerial lesson: high self-reported performance in sustainability dimensions should be validated externally to avoid complacency and ensure continuous improvement.
Given these considerations, it becomes essential to assess whether the framework’s results remain robust under variations in expert weighting judgments. To test the stability of our results, we conducted a local sensitivity analysis (Table 10) by varying each top-level ESRS weight by ±10%. The overall SI changed by no more than 0.07 (under 1%, negligible from a decision-making standpoint), and the ranking of priority areas remained unchanged. This high degree of robustness demonstrates that our conclusions do not hinge on precise weight settings, reinforcing confidence in both the diagnostic power and practical reliability of the ESRS-AHP approach.
Such robustness further supports the applicability and generalisability of our approach, including the feasibility of adapting the framework beyond the original European regulatory context. Even though our framework is built on the ESRS, its structure is fully adaptable to other jurisdictions. Indeed, ESRS itself has been designed in strong interoperability with global standards such as the Global Reporting Initiative (GRI) and the International Sustainability Standards Board (ISSB)’s International Financial Reporting Standards (IFRS) Sustainability Disclosure Standards (SDS), facilitating one-to-one mapping of KPIs and disclosure requirements [26]. To apply the model outside Europe, one needs to:
- Replace ESRS benchmarks with region-specific regulatory thresholds or industry percentiles (e.g., U.S. Environmental Protection Agency limits, Asian Development Bank sector benchmarks).
- Map local reporting standards (e.g., Sustainability Accounting Standards Board (SASB), Task Force on Climate-related Financial Disclosures (TCFD), national ESG codes) onto the same hierarchical structure of criteria and sub-topics.
- Engage local experts for pairwise judgments, preserving AHP rigour while capturing cultural and market-specific preferences.
This adaptability means the ESRS-AHP framework can be generalised to any company in the polymer flooring sector (or beyond), whether in North America, Asia, or Latin America. By documenting the source of each benchmark and expert panel constitution, different organisations can replicate the assessment and compare SI scores across countries, thereby supporting truly global sustainability benchmarking.
5. Conclusions
This study has introduced a novel ESRS-AHP sustainability assessment framework, offering a structured and transparent method for organisations to evaluate their compliance with emerging mandatory reporting obligations. By harmonising standardised ESRS indicators with a rigorous multi-criteria decision-making approach, the framework not only identifies the most pertinent ESG criteria for a specific context but also provides a weighted integrative score reflecting the overall sustainability performance of the organisation. The case study revealed specific opportunities for improvement, especially in environmental sustainability, demonstrating the practical ability of the framework to identify strategic weaknesses that traditional compliance-driven methods could overlook.
The key managerial benefit of this structured methodology lies in shifting organisational practice from reactive compliance towards proactive sustainability management. Moreover, the framework promotes transparency, supports comparability across organisations, and ensures strategic alignment of sustainability initiatives with core business objectives.
Notably, this case study highlighted that high self-reported sustainability scores, particularly in governance and social dimensions, require external validation to mitigate potential biases and overly optimistic self-assessments. Managers are advised to interpret high scores with caution and to support qualitative evaluations with objective third-party audits.
The sensitivity analysis conducted confirms the robustness of the framework, showing that small variations in ESG criteria weights do not significantly impact the overall sustainability index. This stability further underscores the practicality and reliability of the ESRS-AHP framework in supporting managerial decision-making. The model’s adaptability beyond European jurisdictions, facilitated by its interoperability with global reporting standards such as GRI and IFRS SDS, positions it as a valuable tool for international application and global sustainability benchmarking.
The results present a promising approach for practitioners and researchers. Further refinement could involve cross-verification of expert input and extending the framework across various industrial sectors and organisational scales. Future studies might also investigate the efficacy of advanced uncertainty modelling methods, such as fuzzy AHP or interval-based assessments, to improve the precision of qualitative evaluations. However, the present work underscores the potential of a robust procedure aligned with ESRS that meets regulatory imperatives and supports strategic sustainability objectives, thus laying the basis for continuous improvement and long-term value creation. Therefore, future research may focus on a more structured and quantifiable way to assess the non-measurable indicators to determine the exact sustainability of an organisation.
Author Contributions
Conceptualization, V.P., R.R. and A.R.; Methodology, K.A., V.P. and A.R.; Validation, A.R.; Formal analysis, V.P. and A.R.; Investigation, M.G.M. and V.P.; Resources, R.R.; Data curation, K.A.; Writing—original draft, K.A., M.G.M., V.P. and A.R.; Visualization, M.G.M.; Supervision, R.R.; Funding acquisition, R.R. All authors have read and agreed to the published version of the manuscript.
Funding
This work has been realized with financial support by the European Regional Development Fund within the Operational Programme ‘Bulgarian National Recovery and Resilience Plan’, Procedure for direct provision of grants ‘Establishing of a network of research higher education institutions in Bulgaria’, under the Project BG-RRP-2.004-0005 ‘Improving the research capacity and quality to achieve international recognition and resilience of TU-Sofia’.
Institutional Review Board Statement
Not applicable.
Informed Consent Statement
Not applicable.
Data Availability Statement
Data available on request due to restrictions.
Conflicts of Interest
The authors declare no conflicts of interest.
References
- Saad, M.H.; Nazzal, M.A.; Darras, B.M. A general framework for sustainability assessment of manufacturing processes. Ecol. Indic. 2019, 97, 211–224. [Google Scholar] [CrossRef]
- Environment Agency (EEA). Exceedance of Air Quality Standards in Europe. 2018. Available online: https://www.eea.europa.eu/en/analysis/indicators/exceedance-of-air-quality-standards (accessed on 30 March 2025).
- Rozhok, A.; Storozhenko, A.; Valiaeva, A.; Sushchev, S.; Ugarov, A.; Revetria, R. Requirements for the automated monitoring system to reduce environmental risk during operation of trunk pipelines. IOP Conf. Ser. Earth Environ. Sci. 2021, 864, 012049. [Google Scholar] [CrossRef]
- Thirupathi, R.; Vinodh, S.; Dhanasekaran, S. Application of system dynamics modelling for a sustainable manufacturing system of an Indian automotive component manufacturing organisation: A case study. Clean Technol. Environ. Policy 2019, 21, 1055–1071. [Google Scholar] [CrossRef]
- Tuntland, Ø. Readiness Assessment for the Transition into Meeting New Requirements of the European Sustainability Reporting Standards. Master’s Thesis, University of Illinois Springfield, Springfield, IL, USA, 2023. [Google Scholar]
- Sala, S.; Ciuffo, B.; Nijkamp, P. A systemic framework for sustainability assessment. Ecol. Econ. 2015, 119, 314–325. [Google Scholar] [CrossRef]
- Song, Z.; Moon, Y. Sustainability metrics for assessing manufacturing systems: A distance-to-target methodology. Environ. Dev. Sustain. 2019, 21, 2811–2834. [Google Scholar] [CrossRef]
- Kandasamy, J.; Venkatesh, B.; Sakthivel, A.R. Sustainability Assessment of Organizations Based on the Orientations of Product Sustainability. In Progress in Sustainable Manufacturing; Springer: Berlin/Heidelberg, Germany, 2023; pp. 45–69. [Google Scholar]
- Dutta, H. Introduction to Sustainable Manufacturing. In Management and Industrial Engineering; Springer: Singapore, 2023; pp. 1–10. [Google Scholar] [CrossRef]
- Nagadi, K. Implementation of green, lean and six sigma operations for sustainable manufacturing: A review. Int. J. Prod. Manag. Eng. 2022, 10, 159–171. [Google Scholar] [CrossRef]
- Kaldas, O.; Shihata, L.A.; Kiefer, J. An index-based sustainability assessment framework for manufacturing organizations. Procedia CIRP 2021, 97, 235–240. [Google Scholar] [CrossRef]
- Singh, R.K.; Murty, H.R.; Gupta, S.K.; Dikshit, A.K. An overview of sustainability assessment methodologies. Ecol. Indic. 2012, 15, 281–299. [Google Scholar] [CrossRef]
- Huang, A.; Badurdeen, F. Metrics-based approach to evaluate sustainable manufacturing performance at the production line and plant levels. J. Clean. Prod. 2018, 192, 462–476. [Google Scholar] [CrossRef]
- Hummel, K.; Jobst, D. An overview of corporate sustainability reporting legislation in the European Union. Account. Eur. 2024, 21, 320–355. [Google Scholar] [CrossRef]
- Ferdous, J.; Bensebaa, F.; Milani, A.S.; Hewage, K.; Bhowmik, P.; Pelletier, N. Development of a Generic Decision Tree for the Integration of Multi-Criteria Decision-Making (MCDM) and Multi-Objective Optimization (MOO) Methods under Uncertainty to Facilitate Sustainability Assessment: A Methodical Review. Sustainability 2024, 16, 2684. [Google Scholar] [CrossRef]
- Salatiello, E.; Guizzi, G.; Marchesano, M.G.; Santillo, L.C. Assessment of performance in Industry 4.0 enabled Job-Shop with a due-date based dispatching rule. IFAC-PapersOnLine 2022, 55, 2635–2640. [Google Scholar] [CrossRef]
- Guizzi, G.; Vespoli, S.; Grassi, A.; Carmela Santillo, L. Simulation-Based Performance Assessment of a New Job-Shop Dispatching Rule for the Semi-Heterarchical Industry 4.0 Architecture. In Proceedings of the 2020 Winter Simulation Conference (WSC), Orlando, FL, USA, 14–18 December 2020; pp. 1664–1675. [Google Scholar] [CrossRef]
- Marchesano, M.G.; Guizzi, G.; Popolo, V.; Converso, G. Dynamic scheduling of a due date constrained flow shop with Deep Reinforcement Learning. IFAC-PapersOnLine 2022, 55, 2932–2937. [Google Scholar] [CrossRef]
- Vespoli, S.; Guizzi, G.; Gebennini, E.; Grassi, A. A novel throughput control algorithm for semi-heterarchical industry 4.0 architecture. Ann. Oper. Res. 2022, 310, 201–221. [Google Scholar] [CrossRef]
- Salatiello, E.; Vespoli, S.; Guizzi, G.; Grassi, A. Long-sighted dispatching rules for manufacturing scheduling problem in Industry 4.0 hybrid approach. Comput. Ind. Eng. 2024, 190, 110006. [Google Scholar] [CrossRef]
- Popolo, V.; Vespoli, S.; Gallo, M.; Grassi, A. A systemic analysis of the impacts of Product 4.0 on the triple bottom-line of Sustainability. IFAC-PapersOnLine 2022, 55, 1110–1115. [Google Scholar] [CrossRef]
- Popolo, V.; Vespoli, S.; Gallo, M.; Grassi, A. Revolutionizing End-of-Life Product Recovery with Product 4.0: An Examination of Intelligent Products in Industry 4.0. Sustainability 2024, 16, 11017. [Google Scholar] [CrossRef]
- Bäckstrand, K. Towards a climate-neutral union by 2050? The European green deal, climate law, and green recovery. In Routes to a Resilient European Union: Interdisciplinary European Studies; Springer: Berlin/Heidelberg, Germany, 2022; pp. 39–61. [Google Scholar]
- Bais, B.; Nassimbeni, G.; Orzes, G. Global Reporting Initiative: Literature review and research directions. J. Clean. Prod. 2024, 471, 143428. [Google Scholar] [CrossRef]
- Bataleblu, A.A.; Rauch, E.; Cochran, D.S.; Matt, D.T. Impact of European Sustainability Reporting Standards Guidelines on the Design of Sustainable Factories and Manufacturing Systems. In Advances in Manufacturing IV. MANUFACTURING 2024; Springer: Cham, Switzerland, 2024; pp. 237–253. [Google Scholar]
- European Commission. Commission Delegated Regulation (EU) 2023/2772 of 31 July 2023 supplementing Directive 2013/34/EU of the European Parliament and of the Council with Sustainability Reporting Standards. Available online: https://eur-lex.europa.eu/eli/reg_del/2023/2772/oj/eng (accessed on 30 March 2025).
- Shuaib, M.; Seevers, D.; Zhang, X.; Badurdeen, F.; Rouch, K.E.; Jawahir, I. Product sustainability index (ProdSI) a metrics-based framework to evaluate the total life cycle sustainability of manufactured products. J. Ind. Ecol. 2014, 18, 491–507. [Google Scholar] [CrossRef]
- Saaty, T.L. A scaling method for priorities in hierarchical structures. J. Math. Psychol. 1977, 15, 234–281. [Google Scholar] [CrossRef]
- Bhambri, P.; Kautish, S.K. Analytic Hierarchy Process and Business Value Creation. In Using Strategy Analytics for Business Value Creation and Competitive Advantage; IGI Global: Hershey, PA, USA, 2024; pp. 54–77. [Google Scholar]
- Meng, X.; Shaikh, G.M. Evaluating environmental, social, and governance criteria and green finance investment strategies using fuzzy AHP and fuzzy WASPAS. Sustainability 2023, 15, 6786. [Google Scholar] [CrossRef]
- Pathak, S.K.; Sharma, V.; Chougule, S.S.; Goel, V. Prioritization of barriers to the development of renewable energy technologies in India using integrated Modified Delphi and AHP method. Sustain. Energy Technol. Assess. 2022, 50, 101818. [Google Scholar] [CrossRef]
- Fetanat, A.; Tayebi, M.; Shafipour, G. Management of waste electrical and electronic equipment based on circular economy strategies: Navigating a sustainability transition toward waste management sector. Clean Technol. Environ. Policy 2021, 23, 343–369. [Google Scholar] [CrossRef]
- Giannakis, M.; Dubey, R.; Vlachos, I.; Ju, Y. Supplier sustainability performance evaluation using the analytic network process. J. Clean. Prod. 2020, 247, 119439. [Google Scholar] [CrossRef]
- Hashim, M.; Nazam, M.; Abrar, M.; Hussain, Z.; Nazim, M.; Shabbir, R. Unlocking the Sustainable Production Indicators: A Novel TESCO based Fuzzy AHP Approach. Cogent Bus. Manag. 2021, 8, 1870807. [Google Scholar] [CrossRef]
- Omair, M.; Noor, S.; Tayyab, M.; Maqsood, S.; Ahmed, W.; Sarkar, B.; Habib, M.S. The Selection of Sustainable Suppliers by Developing a Decision Support Framework Based on Analytical Hierarchical Process and Fuzzy Inference System. Int. J. Fuzzy Syst. 2021, 23, 1986–2003. [Google Scholar] [CrossRef]
- Nielsen, C. Esg reporting and metrics: From double materiality to key performance indicators. Sustainability 2023, 15, 16844. [Google Scholar] [CrossRef]
- Saaty, T.L. Fundamentals of Decision Making and Priority Theory with the Analytic Hierarchy Process; RWS Publications: Pittsburgh, PA, USA, 1994. [Google Scholar]
- Peng, S.H. Landscape assessment for stream regulation works in a watershed using the analytic network process (ANP). Sustainability 2019, 11, 1540. [Google Scholar] [CrossRef]
- Ibrahim, A.; Kumar, G. Identification and Prioritization of Critical Success Factors of a Lean Six Sigma—Industry 4.0 Integrated Framework for Sustainable Manufacturing Using TOPSIS. Sustainability 2025, 17, 1331. [Google Scholar] [CrossRef]
- Jin, Q.; Chen, H.; Hu, F. Proposal of Industry 5.0-Enabled Sustainability of Product–Service Systems and Its Quantitative Multi-Criteria Decision-Making Method. Processes 2024, 12, 473. [Google Scholar] [CrossRef]
Disclaimer/Publisher’s Note: The statements, opinions and data contained in all publications are solely those of the individual author(s) and contributor(s) and not of MDPI and/or the editor(s). MDPI and/or the editor(s) disclaim responsibility for any injury to people or property resulting from any ideas, methods, instructions or products referred to in the content. |
© 2025 by the authors. Licensee MDPI, Basel, Switzerland. This article is an open access article distributed under the terms and conditions of the Creative Commons Attribution (CC BY) license (https://creativecommons.org/licenses/by/4.0/).