Article

Sustainable Transformation Paths for Value Realization of Eco-Products Empowered by New Quality Productivity: Based on Provincial Panel Data in China

by
Peiran Zhang
and
Hongmin Li
*
College of Economics and Management, Northeast Forestry University (NEFU), No. 28 Wo Hing Road, Harbin 150040, China
*
Author to whom correspondence should be addressed.
Sustainability 2025, 17(11), 4773; https://doi.org/10.3390/su17114773
Submission received: 22 April 2025 / Revised: 16 May 2025 / Accepted: 19 May 2025 / Published: 22 May 2025

Abstract

With the increasing awareness of human environmental protection, eco-products, a green and sustainability resource, are increasingly valued; however, the dynamics that drive the realization of the environmental benefits of the products are poorly understood. Therefore, this study investigates the role of new quality productivity in influencing the realization of eco-product value in China as an example. This study applies the fixed effects model to verify the hypotheses presented in the article through robustness and endogeneity tests, and explores the impact of neoplastic productivity in more depth through heterogeneity and threshold effects tests. This study finds that new productivity has a significant effect on the realization of eco-product value, and there is a non-linear threshold feature, which is still valid after the robustness test; the mechanism analysis shows that the advanced industrial structure and the green technology innovation constitute the main transmission path, while the population urbanization rate plays a positive moderating role; and the test of heterogeneity reveals that the effect of the eastern region and the region with high development of the digital economy is more significant. The results show that the new quality of productive forces provides the core energy to break the dichotomy between ecological protection and economic development, and realize sustainable development in which human beings and nature coexist harmoniously. The conclusions additions are as follows. China should adopt a strategy that differentiates between regions and levels of digital economic development, while paying attention to the threshold effect of environmental protection expenditure and total mechanical power per hectare of crop sown area, in order to promote the efficient development of new quality productivity and provide impetus for the realization of the value of ecological products.

1. Introduction

In the process of globalization since the Industrial Revolution, mankind has created unprecedented material wealth through physical capital accumulation and technological innovation, but the contradiction between the linear growth logic of the traditional productivity paradigm and the limited carrying capacity of ecosystems has become increasingly apparent. Traditional productivity growth focuses primarily on maximizing economic output without accounting for environmental externalities [1], and productivity development has long relied on resource-consuming growth paths, leading to a serious undervaluation of ecological products. Although natural capital such as forests, wetlands, and water flows have key functions such as regulating the climate, purifying the environment, and maintaining biodiversity, they are difficult to be integrated into the mainstream of advancement of society and the economy due to the lack of market-based quantitative means. This mismatch between “hidden ecological value” and “explicit economic value” is essentially a manifestation of the productivity development paradigm lagging behind the needs of the times. Some scholars have argued that the new quality of productivity aims to achieve a harmonious balance between economic growth and environmental protection, thereby promoting a sustainable model of high-quality economic development, and that this unique characteristic has made the new quality of productivity a force for change in the global pursuit of sustainable development [2]. In recent years, China’s pursuit of high-quality economic growth necessitates exploring new productive forces’ capacity to unlock ecological product value—a cornerstone of the ‘Two Mountains’ framework and a catalyst for green, sustainable development. Characterized by digitization, networking, intelligence, greening, and sustainability, the NQP (new quality productivity) [3] can effectively scale up the production productivity of ecological products, reduce resource consumption and environmental pollution, and facilitate the value enhancement and long-term sustainability of ecological products through technological innovation. In parallel, the NQP can also innovate ecological product trading modes, such as developing ecological product e-commerce platforms and exploring the securitization (finance) of ecological products, so as to broaden the channels for enhancing eco-product valuation, and to solve the problem of “difficult to measure, difficult to trade, and difficult to realize” [4]. By enhancing green total factor productivity, NQP is able to effectively control environmental pollution and resource wastage while achieving economic growth, promote green transformation and upgrading of industrial structure, and thus contribute to the steady realization of the sustainable development goals in multiple dimensions, including economic, social, and ecological dimensions [5,6]. In addition, eco-products are a critical basis for maintaining eco-safety and safeguarding mankind. The NQP forces can facilitate the unlocking of sustainable ecological assets’ value, motivate all sectors of society to actively participate in ecological protection and restoration, and initially realize the goal of ecological protection, providing an important guarantee for sustainable development [7]. Advocating for the widespread adoption of eco-friendly production paradigms and sustainable low-carbon living practices will contribute to combating global climate change, building a beautiful world and achieving sustainable human development. Acknowledging the critical role of ecosystems and valuing their outputs is vital to sustaining global ecological systems. Both natural resources and human-processed goods possess measurable economic worth, enabling their integration into policy frameworks that balance conservation, development, and environmental resilience. This study is therefore important for the exploration of development paths for humanity and the world [8]. Moreover, research on the impact of China’s NQP on ES also provides a basis for the development direction of developing countries in the world. However, there are few studies on the direct relationship between the two in the academic world, based on which the NQP for ES fulfillment has its own urgency and necessity for research.

2. Literature Review

2.1. Research on Ecological Products

Eco-products encompass the relationship between supply and demand among humans, which means that they have both natural and social attributes. Consequently, ecological outputs are defined as final goods or services generated through ecosystem functions, serving as essential resources for human utilization and societal development [9]. The fulfillment of ES (ecological product value) is the core proposition of ecological civilization construction and an important hand in promoting high-quality development. Contemporary academic discourse on the operationalization of ES centers is focused on three principal dimensions of inquiry: basic logic, influence factors, and path to fulfillment. First of all, regarding the basic logic of ecological products, a large amount of literature shows that scholars generally believe that ecological products are a collection of resources and services provided by the natural ecosystem including environmentally friendly agricultural and forestry products, which can meet the ecological needs of human beings, improve the ecological environment, and maintain the ecological balance [10]. The academic community generally adopts the definition of the United Nations Millennium Ecosystem Assessment (2005), which is the sum of material goods, regulating services, cultural services, and supporting services that ecosystems provide to humans [11]. The value scope of ecological products has expanded from a single economic value in the early days to a composite value system that includes economic, ecological, and socio-cultural values [12]. The definition of the meaning of ecology products in China is still in its infancy. There are two main definitions of the value of ecology products in the world, one of which considers ecology products to be intangible products that satisfy daily needs, such as air and water [13]. The other definition is more broad. It adds tangible outputs to it, including organic food, green agricultural products, etc. [14]. Relevant scholars have classified eco-products based on supply perspective, service scope, and consumption attributes, respectively [15]. The eco-product value accounting methods have also experienced continuous evolution, and some scholars are committed to expressing eco-product values in monetary terms in order to better measure their economic benefits [16]. Among them, the market value method [17] is to directly use market prices to assess tradable products, but it cannot cover non-market values. The substitution cost approach estimates the value of ecological services in terms of artificial substitution costs and is prone to overestimate or underestimate the actual value [16]. The Conditional Appraisal Value Approach [18] as well as Owuor et al. (2019) used the Prudent Choice Experiment for assessing the non-market mangrove ecosystem services in Mida Creek, Kenya [19]. Secondly, for the study of influencing factors on the value realization of ecological products, it has been suggested that land use affects the realization of the value of ecological product services [20]; in addition, the development and improvement of policy compensation mechanisms are important influencing factors; since the 1990s, several Brazilian states have introduced the concept of fiscal transfers to explicitly compensate municipalities for ecosystem services provided by municipalities benefiting jurisdictions outside municipal boundaries [21], and the ambiguity of property rights to ecological resources is seen as a major obstacle, and clearly defined property rights can reduce transaction costs and facilitate marketization. On the demand side, factors such as green awareness, environmental consumption preference, and overall economic development have a significant impact on farmers’ green production decisions [22]. Therefore, the standards of economic development, the green awareness of the population, and the active degree of the ecological products market all have an impact on unlocking ES. Finally, to enhance the path of ES, based on the strategic perspective of ecological civilization construction, some scholars have systematically constructed the institutional framework and implementation path for realizing the value of ecological products [23]; on this basis, some scholars have focused on the practical needs of the eco-industrialization operation, and explored the diversified practical paths and mechanism innovations for realizing the value of ecological products [24]. It is worth noting that the research team represented by Chan et al. has taken a different approach, focusing on the deep excavation of the cultural value of ecological products and the transformation mechanism research, which provides a new research dimension for the value realization path [25]. Scholars increasingly advocate for advancing eco-industrial systems and nature-based economic models, and accelerate the transformation of industrial greening, digitization, and intelligence [26], meanwhile, to strengthen the government’s guidance to actively establish an ecological compensation mechanism in order to promote the fulfillment of ES.

2.2. Research on New Quality Productive Forces

Within conventional growth frameworks, ecological assets confront systemic barriers—challenges in valuation, collateralization, marketization, and monetization [27], and the transformation channel from green mountains to silver mountains has not yet been fully opened. The emergence of NQP provides a brand emerging idea and solution for cracking this problem. Current scholarly investigations into NQP predominantly address three core dimensions: theoretical frameworks, evaluative metrics, and practical implementations. For the theoretical connotation of NQP, some scholars start from “quality” and believe that the prerequisite for the creation of NQP lies in the innovation of “quality”, and the essence of concept formation lies in “quality”. Regarding the conceptual foundations of new qualitative productivity, researchers emphasize that its emergence is anchored in the innovative attributes of ”quality”, while its theoretical legitimacy stems from normative validation, and its evolution is shaped by systemic structural dynamics [28]. Predominant scholarly discourse analyzes the emergent “new quality” dimensions of productivity through the Marxist framework of productive forces, focusing on three core elements: qualitative advancements in human capital, expanded scope of labor object domains, and technological sophistication in production methods [29]. Some scholars also integrate permeable elements such as new technologies, production organizations, and data with physical elements such as workers, labor objects, and means of production to construct the evaluation system [30]. There are also scholars who construct evaluation systems from technological productivity, digitally-enabled productive transformation, and environmentally sustainable economic development [31]. As for the content of the NQP, some scholars believe that the NQP is to take science and technology innovation as the core driving force, and through the deep integration of digital technology, intelligent technology, and green skill, it is reshaping the way of value cognition, value creation, and value realization of ecology products [32]. This new type of productivity form can not only accurately quantify ES, but also transform ecological advantages into economic advantages through innovative business models and market mechanisms, opening up new methodologies for the fulfillment of ES. Therefore, some scholars propose that the progression path of the NQP is led by pioneering advancements in technological evolution, underlined by digitization and greening, and supported by high-quality talents [33].

2.3. Research on the Relationship Between New Quality Productivity and Ecological Products

The extant literature reflects a robust scholarly discourse on novel productivity paradigms and ecological outputs, encompassing diverse theoretical and applied perspectives; while the research on the relationship between the two is still insufficient, some scholars have analyzed only from the theoretical level [34], and lack of empirical research. Some scholars have conducted empirical analysis, but it is limited to some regions or some industries [35], and lacks a national study. This approach cannot fully understand the behavioral choices made by the state in the paradigm of NQP for fulfillment of ES. It is clear from reading the literature that advanced production technologies brought by NQP can optimize resource utilization, and digital technology making management more transparent and efficient reduces information gap, strengthens strategy implementation, and enhances the ability to integrate resources [36]. Adopting green manufacturing innovations not only curbs pollutant emissions but also fosters regenerative capacities in nature-based outputs [37], which is in line with the current consumer preference for environmentally friendly products. Finally, the NQP can also help ecology products better connect to the target market and maximize value through big data analysis and precision marketing. Consequently, this study aims to reflect the impact of the NQP on eco-products by quantifying their economic benefits; we believe that the NQP will positively affect the capitalization on ecosystem service value. This study comprehensively applies the market value method and the equivalent factor method to assess ES and quantifies the level of NQP through an “input-process-output” lens [24]. This approach not only captures the external attributes of NQP but also elucidates the formation of its constituent elements and their interactive processes, enabling a more profound measurement of its developmental trajectory. Subsequently, a regression analysis is constructed to explore causal relationships, and robustness and endogeneity checks are performed to validate the reliability of the research findings.
This research presents four distinct contributions that advance current scholarly understanding: First, the market value method and the equivalent factor method are comprehensively applied to measure the physical ES and the value of services, so as to obtain gross ES, which contributes to the quantitative level for the sustainable development of the world and mankind and quantifies the economic value of ecological products to a certain extent. The second is to use new research perspectives to calculate the NQP and apply it to econometric analysis to verify the reliability of its classification criteria which provides the world with a new way of thinking for understanding and analyzing NQP. Third, we evaluate the value of ecological products and the level of NQP across provinces, and illustrate how NQP positively contributes to the fulfillment of ES at the national level. We provide ideas and development paths for the sustainable development of the world economy. Fourthly, an empirical examination of how new productivity influences the fulfillment of ES is conducted nationwide, providing a more objective demonstration of their relationship and offering insights for the developmental strategies of other developing nations globally.

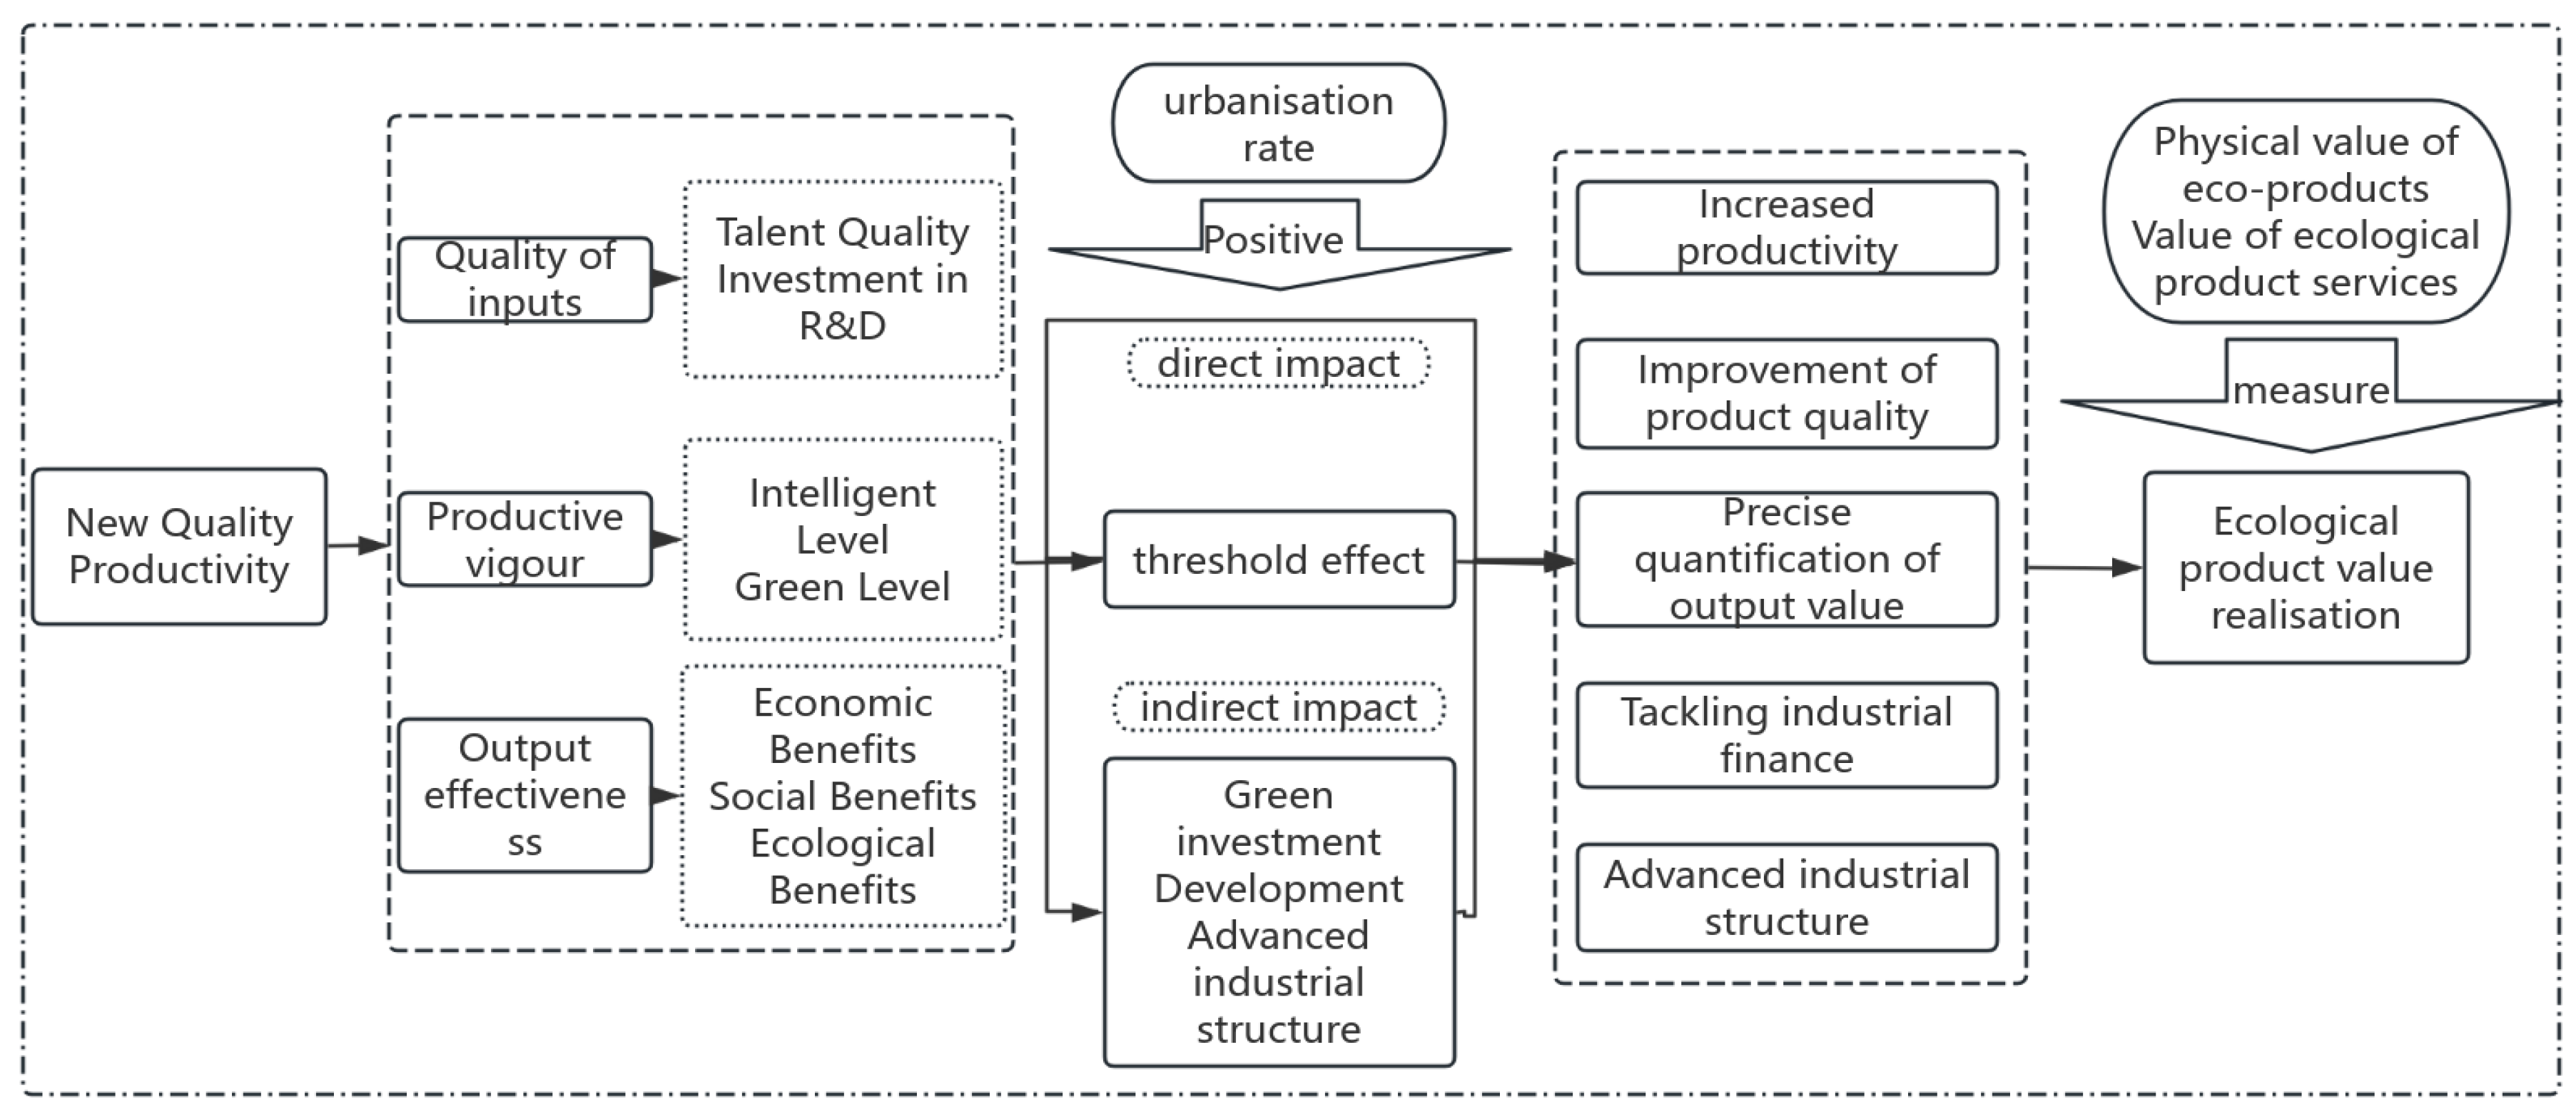
2.4. Theoretical Assumption

This section provides an in-depth analysis of the intrinsic connection between the development of NQP and the realization of ES as well as the two paths of influence between NQP and the attainment of ES (Figure 1), and proposes the corresponding research hypotheses.

2.4.1. Development of NQP for the Actualization of ES

NQP is changing people’s traditional perception of ES through advanced technological means. In terms of input quality, the application of satellite remote sensing, the internet of things, big data analytics, and complementary technologies allows us to accurately monitor ecosystem indicators and quantify the provision capacity of eco-products. The decentralization, transparency, and immutability of blockchain technology can be used to achieve true traceability, instant monitoring, and multi-party collaboration in the production of ecological product data [38]. This precise quantitative assessment, together with improved supply chain management brought about by advances in new quality production technologies and the promotion of environmentally friendly production protocols, allows ecology products to gain a more competitive market advantage [39]. It lays the foundation for the market-oriented trading of ecological products. Furthermore, in terms of output, the integration of intelligent technologies enables the convergence of ecological products’ data, industrial, and financial chains, facilitating their value realization and sustainable development. Additionally, advancements in artificial intelligence drive ecological product development and operations into downstream industries, thereby elevating their high-end value and fostering multi-dimensional value realization. [40]. NQP is reconstructing the value creation mode of ecological products. Economic growth needs to rely on the expansion of green production factors represented by data and productivity enhancement [41]. The development of NQP will increase production dynamics to promote the development of green production factors. The application of sustainable technological solutions such as biotechnology and clean energy enhances the quality and value-added aspects of ecology products [42]. Building upon this theoretical foundation, this study develops Hypothesis 1.
Hypothesis 1.
Development of NQP for the actualization of ES.
Hypothesis 2.
NQP contributes to the realization of ES in terms of the quality of inputs, the efficiency of outputs, and productive dynamism.

2.4.2. NQP Promotes the Advanced Industrial Structure and Further Promotes the Fulfillment of ES

New-quality productivity emphasizes the innovative allocation of production factors, especially the extensive application of data factors. The emergence of data as a novel productive asset has permeated every stage of industrial technology development—spanning research, manufacturing, and commercialization—fundamentally reshaping resource allocation paradigms and factor compositions. Technological progression, in turn, acts as the endogenous engine propelling industrial structural transformation [43]. Concurrently, NQP drives the green transition of energy and other production factors, thereby stimulating market demand for advanced materials and intelligent hardware, and fostering industrial transformation and upgrading [44], promoting deeper integration of eco-products and tourism, recreation, culture, and other industries. This integration not only enhances the added ES, but also broadens the avenues for realizing ES. In addition, NQP is the high-quality productivity with the realization of a new supply–demand balance as the starting point. Driven by the new production and demand, the social supply and demand attributes and supply and demand structure present new characteristics, and NQP can meet the social advancement needs in the form of new industries [45]. In addition, NQP embodies digital productivity, and the expansion of the digital economy facilitates efficient resource allocation and the upgrading of industrial structures. Through policy guidance and market mechanisms, emerging industry clusters are being nurtured. For example, China has formed a leading edge in areas such as photovoltaic technology, lithium batteries, and intelligent networked new energy vehicles, and will further lay out new tracks such as quantum technology and life sciences in the future. Through the development of industrial clusters, NQP not only enhances the competitiveness of emerging industries, but also provides new growth points for the high-quality development of the economy. The advancement of new productivity paradigms is contingent upon institutional frameworks, with low-carbon policy instruments accelerating the transition towards sustainable industrial ecosystems [46]. The refinement of policy frameworks and institutional mechanisms establishes robust groundwork for market-driven actualization of ES. Informed by this analytical foundation, Hypothesis 2 is posited as follows.
Hypothesis 3.
NQP promotes the advanced industrial structure and further promotes the fulfillment of ES.

2.4.3. NQP Further Contributes to the Fulfillment of ES by Facilitating the Growth of Green Investments

NQP prioritizes innovation in sustainable technologies and their scalable integration into industrial ecosystems [47], and through differentiated pricing and policy guidance, funds are precisely invested in new energy technologies, energy-saving and environmentally friendly processes, and other key areas [48]. As advanced productivity paradigms evolve, the influence of regional environmental governance on corporate eco-centric capital allocation becomes increasingly pronounced [49]. The development of NQP promotes the development of green investment, and in addition, green investment has the dual functions of “green” and “investment”, which is crucial to reducing pollution, improving the environment, and promoting economic development, which can improve environmental quality and resource utilization, thereby promoting the fulfillment of ES [50]. High-quality development requires increased green investment, the financialization of which will further contribute to green total factor productivity [51]. Increased productivity will promote higher product constants, and increased green total factor productivity will promote the materialization of ecology product values. In addition, based on signaling theory, it is argued that by utilizing green finance, China’s environmental enterprises and the government have effectively demonstrated their commitment to sustainable development to stakeholders, including investors and consumers, and stimulated their enthusiasm for investing in ecological products [52]. Building upon the preceding analysis, Hypothesis 3 is formally presented as follows.
Hypothesis 4.
NQP further contributes to the fulfillment of ES by facilitating the growth of green investments.

2.4.4. Urbanization-Driven Demographic Shifts Act as a Catalytic Mediator, Amplifying the Impact of NQP on the Fulfillment of ES

The role of new productivity depends to a certain extent on the local urbanization level, and the relationship between the two is not unidirectional, injecting new impetus for the fulfillment of the value of ecology products [53]. With the increase in population urbanization rate, cities become a prominent carrier for NQP, the talent concentration caused by urbanization provides high-tech talents for NQP, urbanization brings population concentration and market demand expansion [54], which provides broader sales channels and consumer groups for ecological products, while the urbanization process not only changes the structure of the agricultural population, but also promotes the economic structure from agriculture to agriculture. It also promotes the transformation of economic structure from agriculture to non-agriculture. This transformation promotes the flow of capital and technology, accelerates the modernization of ecological product production, and thus increases the commercial value of ecological goods in market ecosystems [55]. The escalating demand for ecological goods, outstripping supply capacities, has catalyzed technological innovation and industrial transformation. This dynamic not only reinforces the integration of advanced productive forces into eco-centric manufacturing but also elevates both the efficiency and qualitative benchmarks of such outputs. Furthermore, urbanization has promoted the construction of infrastructure and the improvement of public services [56], which has provided a basic guarantee for the growth of NQP, and also offered convenient conditions for the collection, processing, transportation, and sale of ecological products, which has lowered the cost and enhanced the competitiveness [57]. Urbanization promotes the formation of “urban-ecological” functional zoning, which not only reduces ecological occupation through intensive development, but also achieves regional balance through ecological compensation mechanisms. For example, Beijing supports Chengde’s afforestation through carbon trading, forming a cross-regional value compensation model. This spatial optimization not only eases the pressure of urbanization on the ecology, but also provides space for the NQP, forming a virtuous cycle, and realizing the synergy between ecological protection and development through spatial reconstruction. Strategic urbanization advancement, coupled with leveraging its moderating potential, is critical to fostering the co-enhancement of innovation-driven productivity and ecological asset valuation. Drawing from the preceding analysis, Hypothesis 5 is formally introduced as follows.
Hypothesis 5.
Urbanization-driven demographic shifts act as a catalytic mediator, amplifying the impact of NQP on the fulfillment of ES.

3. Materials and Methods

3.1. Data Description

This paper selects 2014–2023 as the research interval and takes 31 provinces and cities in China as the research object; the data of indicators, mediator variables, control variables, moderator variables, and critical variables in the evaluation system of NQP come from the National Statistical Yearbook and the National Industrial Yearbook, the data of land types in the accounting of ecological product value come from the Resource and Environment Science and Data Centre of the Chinese Academy of Sciences, and the data of various types of ecological products are from the provincial statistical yearbook, and the data of various types of ecological products and the number of cultivation in each category come from the provincial statistical yearbook. A few missing data were supplemented by trend extrapolation and linear interpolation.

3.2. Data Analysis

3.2.1. Baseline Equations

To assess how innovative productivity paradigms affect the valorization of ecological assets, this study constructs a baseline econometric framework:
e s i t = β 0 + β 1 n q p i t + k = 2 n X i t + μ i + λ t + ε i t
n q p i t denotes the horizontal level of NQP development in region t and in period i,   e s i t denotes the level of eco-product value realization in region t and in period i,   X i t denotes the control variable, μ i and λ t represent county and time fixed effects, respectively, ε i t denotes the random interference term, β 0 is a constant term, β 1 and β k are the coefficients to be estimated.

3.2.2. Explanatory Variables

Based on the theoretical analysis of NQP, combined with relevant research results, and comprehensively considering the measurable of variables and data availability, this study develops a multidimensional assessment framework for next-generation productivity metrics, incorporating indicators across three dimensions: resource inputs, operational dynamism, and outcome efficacy, as shown in Table 1. Specifically, resource inputs encompass human capital quality and R&D investment intensity. General Secretary Xi Jinping underscored the following key points: talents are the first resource and an important support for cultivating and developing NQP. R&D input refers to the strength of financial support received by research and experimental development personnel to ensure the benign operation of R&D activities [58]. Therefore, we further selected the number of undergraduates enrolled, the number of patents granted over the total population, and R&D workforce metrics (measured in full-time equivalents) within key industrial sectors which serve as a proxy for human capital caliber, the relationship between government expenditure on education as a percentage of GDP and R&D investment, and the length of fiber-optic cable lines reflecting R&D investment. The advancement of the digital economy has seen digital technologies infiltrate diverse production processes, catalyzing novel R&D paradigms, technical methodologies, and commercial strategies across product design, manufacturing, and sales ecosystems [59], while certain scholars advocate for the persistent pursuit of green production as a means to attain sustainable development of high-caliber, innovative productivity [60]. Therefore, production vitality is quantified by the level of intelligence and greening, and further by the mobile penetration rate to quantify the level of intelligence, electricity consumption, CNY 10,000 of GDP sulphur dioxide emissions, and complete investment in wastewater waste treatment projects to quantify its greening level. NQP is an advanced productivity state in line with the new dynamic concept, and its output effectiveness is judged by whether it can meet the people’s expectations of a life less and less. As the people’s needs for a better life are multidimensional and rich, they often involve economic growth, social welfare enhancement, protecting resources, and optimizing the environment. Consequently, the assessment of output effectiveness is based on economic, social, and ecological gains. The assessment of economic gains relies on specific metrics, including revenue generated from new product sales by industrial firms exceeding a threshold scale and the cumulative volume of telecommunications services. Social benefits are evaluated using the ratio of the urban–rural disposable income gap to GDP and the ratio of medical investment expenditure to provincial GDP. Ultimately, ecological benefits are represented by the total power of machinery per hectare of cultivated land. Finally, the total mechanical power per hectare of sown area reflects the ecological benefits.

3.2.3. Core Explanatory Variables

Ecological offerings, characterized as commodities or services originating from natural ecosystems with inherent environmental properties, are categorized in this investigation according to the framework provided by the Specification for Ecosystem Services Valuation (Provisional), jointly released by China’s National Development and Reform Commission (NDRC) and Statistical Bureau (BOSTAT). The economic worth of material provisions from ecological systems is quantified using market-based pricing models, while the value of ecological regulation and cultural ecosystem services is estimated through the equivalence factor methodology. The comprehensive economic value of these ecological contributions is subsequently determined by integrating these two evaluated components into a unified metric. This integrated metric serves as the comprehensive representation of the total economic value generated by ecological products.
Evaluating the Monetary Worth of Material Goods Originating from Natural Ecosystems
The economic worth of ecosystem-derived material products integrates the values generated by agricultural, forestry, livestock, and fisheries sectors, quantified through market-based valuation principles. The exact formula utilized for this assessment is detailed below:
p i v = i = 1 m E i × p i
i = 1, 2, 3, 4 represent agricultural, forestry, livestock, and fishery products, E i represents the production of product i, and p i represents the price of product i.
Accounting for the Value of Ecological Regulation and Ecological and Cultural Services
The value of ecological regulation services is expressed as the value generated by the ecosystem through natural processes to regulate the environment, such as climate regulation, flood control, water purification, pest control, etc.; the ecosystem provides non-material benefits, such as spiritual enjoyment, aesthetic value, education, and recreational tourism, which represent the value of ecological and cultural services. This paper draws on X to measure the value of ecosystem services embedded in ecological regulation and cultural services through the Equivalent Factor Approach [60], with the following formula:
E = 1 7 k = 1 i Q k p k
V C = E × P
V C i j = e i j × V C
E S V i j = j m A j × V C i j
E S V i = i n E S V I
E signifies the economic worth attributed to a single standardized unit of ecosystem service equivalence; Q k is the crop k yield; P k represents the average price per unit of crop k; 1/7 indicates that the economic value derived from a naturally functioning ecosystem, with no human cost inputs, is one-seventh of the economic value of food production per unit of farmland area. vc represents the economic value of ecosystem services corresponding to one standard equivalent factor of the ecosystem;   V C i j denotes the economic worth associated with ecosystem services i per unit of area for the ecosystem j; and e i j is the base equivalent of ecosystem service i per unit of area for the ecosystem j. A j  denotes the area of ecosystem type j; E S V i j represents the economic worth assigned to the i-th ecosystem service within the j-th ecosystem classification.; E S V i denotes the economic worth attributed to the i-th ecosystem service category.

3.2.4. Control Variables

In order to alleviate the impact of omitted variable bias on the regression results to the greatest extent possible, this paper controls the following variables in the model according to its own research and drawing on previous research on the factors influencing the fulfillment of ES [22,61]. First, the level of economic development (ENP), measured by GDP, across heterogeneous regions reflects the structure of regional variations in socioeconomic advancement, and the improvement of the level of economic development will also give rise to the demand for ecological products from the residents; the green progression model of the local economy will lead to using ecological resources more efficiently. Second, regarding the magnitude of openness to the external environment (OPEN), by choosing the total import and export trade and the ratio of provincial GDP, different regions open to the outside world to different degrees will mold ES to yield achievements. Third, regarding the ecological environment perspective (ENR), using the direct economic loss of natural disasters to indicate that the direct loss of natural resources will reduce the supply of ecological products will weaken the ecosystem service function. Hence, it will pose a negative impact on the fulfillment of ES. Fourth, the intensity of government intervention (GOV), as measured by the ratio of government fiscal expenditure to the provincial GDP for the year, is a crucial factor. The government plays a pivotal role in promoting ecological restoration and protection via financial support and policy guidance, thus laying the foundation for the fulfillment of ES. The fifth dimension is the extent of environmental protection expenditure (GNS), quantified through the ratio of the government’s environmental protection expenditure to the provincial GDP for the year. A rise in environmental protection expenditure is instrumental in alleviating the burden of local environmental pollution, fostering the regeneration of ecological resources, and elevating the quality of the environment. Table 2 outlines the descriptive statistical outcomes for each primary parameter.

3.2.5. Mediating Variable

Based on the above theoretical analysis of the proposed NQP mainly through the promotion of advanced industrial structure and green investments, ES is influenced. In the Formula (1) on the basis of the construction of the mediating effect model to test, the specific model is as follows:
M i t = β 0 + β 1 n q p i t + k = 2 n X i t + μ i + λ t + ε i t
The positive, negative, and significance of β 1 reflect the influence of ES fulfillment on mechanism variables. If the result of β 1 is significant, this paper will combine the existing research and theory to analyze the influence of the mechanism variables on the fulfillment of ES, and then clarify the chain of the mechanism of the advancement of NQP forces through the advanced industrial structure and the development of green investment to influence the fulfillment of ES; otherwise, it means that the hypothesized mechanism of the action is not valid.

3.2.6. Moderating Variables

Based on the above theoretical analysis of the proposed urbanization rate, it plays a moderating role in the development of NQP to promote the realization of ES. On the basis of Equation (1), a model of regulating effect is constructed for testing, and the specific model is as follows:
e s i t = β 0 + β 1 n q p i t + β 2 M i t + β 3 n q p i t M i t + k = 2 n X i t + μ i + λ t + ε i t
M i t is the moderating variable, which is the urbanization rate. Variable n q p i t M i t captures the interactive effect between the moderator and the predictor in the specified model, and β 2 and β 3 are the corresponding regression coefficients, where β 3 is used to measure the difference in the impact of NQP on the realization of the value of the ecological product under the moderating effect.

3.2.7. Threshold Variables

According to the theoretical analysis framework, the impact of NQP on the realization of ES may vary depending on GNS and HACPMD. In order to test whether there is a non-linear relationship between NQP and ES, a threshold effect model is constructed as follows:
e s i t = β 0 + α 1 n q p i t × I ( q i t δ ) + α 2 n q p i t × I ( q i t > δ ) + k = 2 n X i t + μ i + λ t + ε i t
where q i t and δ represent the threshold variable and the threshold to be estimated, respectively; I(.) takes the value of 1 or 0 depending on the truth of the expression in parentheses. The parameters α 1 and α 2 represent the multiplicative effects between the predictor variable and the threshold value, with each coefficient corresponding to distinct interaction components in the model.

4. Results and Discussion

4.1. Data Testing

The quality of the data will affect the reliability of the statistical model, the validity of the statistical inferences, and the scientific validity of the conclusions, so the data will be subjected to a unit root test as well as a multicollinearity test. As shown in Table 3 and Table 4, the VIF values are less than 5 indicating that there is no problem of covariance, and the unit root test shows that the p-value is less than 0.1, indicating that the data are smooth.

4.2. Benchmark Regression

This study tests whether the NQP can promote the fulfillment of ES according to Equation (1). A Hausman specification test was conducted prior to regression analysis, yielding a p-value of 0. This result provides strong evidence against the null hypothesis, warranting the implementation of a fixed-effects model. This study proceeds by applying logarithmic transformation to all explanatory variables, with the corresponding estimation results documented in Table 5. In the baseline model specification—which includes core explanatory variables while controlling for entity- and time-invariant characteristics through two-way fixed effects—the coefficient for NQP emerges as statistically significant at the 1% level. This finding underscores the positive contribution of NQP advancements to the fulfillment of ES. Column 2 is regressed on column 1 with the addition of control variables and shows that the sign and significance of the coefficient of ES fulfillment remain unchanged. This result tentatively supports Hypothesis 1, which states that NQP development promotes ES fulfillment. In columns three to five, regression results are reported with respect to the effect of the three dimensions of NQP on ES fulfillment. Notably, the coefficients of input quality, production dynamism, and output effectiveness are significantly positive at a minimum significance threshold of 10 percent. Initially, with respect to input quality, NQP accentuates the deployment of green and low-carbon technologies and the judicious allocation of production factors. Through the introduction of modern technologies, should this be accomplished, this may enhance the efficiency of resource allocation, mitigate environmental harm, and furnish superior inputs for the creation of eco-friendly products. For instance, integrating advanced data analytics and IoT-driven monitoring systems into agricultural workflows can streamline operations, yielding productivity gains while reducing ecological strain. The ameliorated quality of inputs fosters the enhancement of production vitality. In the context of production vitality, NQP catalyzes the transformation and upgrading of traditional industries and stimulates the innovation vitality of ecological industries. Through scientific and technological innovation and industrial integration, the production mode of ecological products has transformed from the traditional high-energy consumption and pollution to greening and intelligence. For example, NQP in agriculture has not only enhanced the supply capacity of ecological agricultural products, but also expanded the path of realizing the value of ecological products through the development of new modes such as ecological agriculture and intelligent agriculture. To conclude, in the context of output effectiveness, NQP has significantly augmented the market competitiveness and added-value capacity of eco-products via the optimization of production workflows and the improvement of product quality. For example, through ecological products certification and brand building, it has enhanced the market recognition and price premium of ecological products. In parallel, NQP has further streamlined the market realization trajectory of ES by propelling the amelioration of the ecological product trading mechanism.

4.3. Endogeneity Treatment

Notwithstanding the implementation of two-way fixed effects and the addition of control variables in the prior section to attenuate the estimation bias arising from measurement errors and omitted variables, the endogeneity problem persists and cannot be avoided. On the one hand, although the advancement of NQP facilitates eco-product development, the latter, in turn, drives the advancement of NQP through fostering technological innovation, optimizing resource allocation, enabling digital transformation, and enhancing human resources and scientific–technological support. This gives rise to a bidirectional causality issue. On the other hand, considering the vast and convoluted set of variables affecting the fulfillment of ES, it is probable that omitted variables exist, which have an impact on both the fulfillment of ES and the development of NQP. In order to eliminate model endogeneity as much as possible, this paper adopts the instrumental variable method to solve the problems of two-way causality and omitted variables to ensure the results are robust, and uses two-stage least squares regression. In the process of selecting instrumental variables, we initially drew inspiration from Song’s [50] approach to constructing instrumental variables. We posit that NQP in a lagged period is less susceptible to the reverse influence of the current-period realization of ES, thus fulfilling the exogeneity condition for instrumental variables. Additionally, there exists a certain degree of correlation between lagged NQP and current NQP, which satisfies the correlation requirement for instrumental variables. Thus, this instrumental variable theoretically satisfies the conditions of relevance and exclusivity. Secondly, the number of fixed telephone sets per 10,000 people in 1984 is chosen as the instrumental variable, which meets the relevance requirement. In addition, with the popularity and application of mobile Internet technology, the importance of traditional telecommunication equipment such as fixed telephone in ecosystem product capitalization has been greatly reduced, and its contribution to the fulfillment of ES value is almost negligible, thus meeting the requirement of exclusivity. Given that the 1984 fixed telephone density per 10,000 people constitutes cross-sectional data unsuitable for direct inclusion in a panel instrumental variable model, building on Shun’s methodological framework [51], we construct an instrumental variable (IV) for provincial new-quality productivity indices using the log-transformed product of two measures: 1984 fixed-line telephone density (per 10,000 inhabitants) and the prior-year national Internet user count. This approach addresses the identified limitation by leveraging historical infrastructure data as a proxy for technological development trajectories. Thirdly, the lagged one-period explanatory variable and the interaction term of fixed telephones with the number of Internet users in China in the previous year are both included in the model as instrumental variables [62]. Table 6 presents the regression results, showing that coefficients for ES realization are positive and statistically significant at the 10% level or higher. Standard diagnostic tests confirm the absence of weak instruments or identification issues, while over-identification tests validate the exogeneity of the constructed instrumental variables. The results confirm that NQP exerts a meaningful positive association with the regression outcomes, suggesting that endogenous bias does not substantially compromise the coefficient estimates. In summary, after overcoming the possible endogeneity problem, the results remain robust, further confirming the plausibility of Hypothesis 1.

4.4. Robustness Test

In order to validate the results of this study, we first conducted a heteroskedasticity test and found that the p-value was greater than 0.1, indicating that there was no heteroskedasticity, and then we used four different methods to assess the robustness of the model. The first is to replace the explanatory variables [63]. The level of NQP measured by principal component analysis is used as the explanatory variable in the regression, with the purpose of testing whether the promotion effect brought by NQP development depends on its specific measure. The second is to exclude municipalities [64]. Since the development of the capital city is better than other cities in the same region and there is a policy bias, we exclude the four municipalities from the sample, and the third is to change the time span of the sample [65]; considering that the 2020 epidemic may have an impact on the value of ecological products, we exclude the 2020–2021 sample, and then rerun the regression. Fourth, after applying 1% bilateral shrinkage to the explanatory variables (as per Treatment [56]), the Table 7 shows that NQP development significantly impacts ES realization at a minimum of 10% significance, with consistent coefficient directions across core explanatory variables, thereby reinforcing the robustness of prior conclusions.

4.5. Mechanism Test

4.5.1. The Mediating Role of NQP Development in Realizing ES

On the basis of the previous verification that NQP has a significant role in the fulfillment of ES, this part further explores the mechanism by which NQP affects the fulfillment of ES from the promotion of advanced industrial structure and the promotion of the development of green investment, respectively. Drawing on the idea of the mechanism test of Jiang [66], the explanatory variable of ES fulfillment in model 1 is replaced by a mechanism variable, which specifically represents industrial structure upgrading and green finance, and other variables are set in the same way as in model 1.
NQP Promotes the Advanced Industrial Structure
Building on prior literature and theoretical insights, we hypothesize that advanced industrial structures influence regression outcomes. To operationalize this concept while ensuring data smoothness, we adopt the approach proposed by Yang [58], calculating the logarithmic ratio of tertiary to secondary industrial output values as a proxy for industrial sophistication. Column 2 of Table 8 shows that NQP positively promotes industrial structure advancement at the 5% significance level, while the relationship between industrial structure advancement and ES realization can be elaborated from two aspects: firstly, industrial structure advancement promotes the green transformation of industries, reduces the over-exploitation of natural resources and environmental pollution, and provides a basic guarantee for the sustainable fulfillment of ES. For example, through the development of ecology agriculture, ecology tourism, forest economy, and other green industries, it not only protects the ecological environment, but also enhances the market competitiveness of ecological products. Secondly, the advanced industrial structure enhances the development efficiency and quality of eco-products through technological innovation and digital application. For example, non-static surveillance and management of ecological products using big data and internet of things technology can achieve the precise development and efficient use of ecological products. Meanwhile, the construction of digital platforms has broadened the channels for trading eco-products and promoted their market trading.
NQP Promotes the Development of Green Investment
According to the previous literature and theoretical analysis, green investment, as a tool to support the growth of NQP, promotes the accelerated formation and landing of NQP through the provision of financial products and services. This paper draws on Li’s approach to quantify green investment using the ratio of completed industrial pollution control investments to GDP [67]. As evidenced in Column (4) of Table 8, innovation-driven productivity paradigms demonstrate statistically significant catalytic effects (p < 0.01) on sustainable capital allocation, with the ecological service fulfillment mechanism operating through three distinctive pathways, as delineated below: firstly, green finance provides financial support for the advancement and protection of eco-products through the provision of financial instruments and services. For example, tools such as green credit, green bonds, and green funds can effectively alleviate the matter of difficult financing of ecological projects and facilitate the transformation of ecological products from resources to assets. Secondly, increased green investment can improve green total factor productivity, thus promoting the fulfillment of ES. In addition, the implementation of green investment policies can lead social capital to the ecological field and facilitate the market fulfillment of ES. At the same time, the development of green investment also facilitates green technological innovation, providing technical support for the fulfillment of ES. Existing research demonstrates that green investments effectively strengthen enterprises’ green technological innovation capabilities. By mitigating funding limitations, diversifying risk exposure, and improving resource management efficiency, these investments facilitate the development and deployment of green technologies. These technological advances not only enhance the performance and quality of eco-products, but also further expand value streams for environmental products.

4.5.2. The Moderating Effect of the Development of NQP on the Fulfillment of ES

The previous section verified the significant contribution of developing new productivity to the fulfillment of ES value, and the mediating role played by green finance and the advanced industrial structure. This section further explores the positive moderating effect of urbanization rate on ES through the advancement of NQP.
This paper draws on Yang [68] to quantify the urbanization rate using the ratio of urban population to total population, and Table 8 shows that the interaction term between the moderating variable and the explanatory variable is significant at the 5% level, which proves that the urbanization rate acts as a positive moderator in the influence of NQP on the realization of ecological products value. Cities are knowledge- and technology-intensive areas, and in the context of urbanization, high-quality talents, scientific research institutes, and high-tech enterprises cluster in cities, forming the agglomeration effect of innovation resources. At the same time, cities are the main gathering place of economic activities. In the process of urbanization, production factors such as population, capital, and technology are concentrated in cities, forming scale effect and agglomeration effect. Urbanization thus serves dual catalytic functions in productivity transitions: as a geographical platform enabling the spatial configuration of advanced productive systems, while concurrently cultivating institutional ecosystems conducive to technological and organizational innovation. In addition, urbanization also creates conditions for the fulfillment of ES by expanding the market demand, improving the infrastructure and optimizing the allocation of resources. As the urbanization rate increases, the demand for high-quality ecological products from the urban population will increase, and the expansion of the market size will further motivate corporate investment in research, development, and production of ecological products.
Table 8. Mechanism test.
Mediated EffectsModerating Effect
(1)(2)(3)(4)(5)
ESinduESGlnES
NQP9779.816 ***0.046 *9779.816 ***0.003 ***0.500 ***
M i t
n q p i t M i t
(3.29)(2.02)(3.29)(3.19)(0.174)
0.205
(0.304)
0.610 **
(0.249)
_cons29,238.949 ***0.994 ***29,238.949 ***0.002 ***9.556 ***
(7.34)(60.72)(7.34)(2.97)(0.237)
N310310310310310
R20.950.9390.950.6370.753
adj. R20.9420.9280.9420.5750.709
control variableyesyesyesyesyes
time fixed effectyesyesyesyesyes
provincial fixed effectsyesyesyesyesyes
Standard errors in parentheses *** p < 0.01, ** p < 0.05, * p < 0.1.

4.6. Heterogeneity Analysis

4.6.1. Analysis of Regional Heterogeneity

This study shows that China’s economic structure and natural resource endowment are different, so the market condition of ecology products and the level of NQP are also different. As a result, the impact of NQP on the fulfillment of ES is affected, and this paper conducts a heterogeneity test for different regions. Drawing on Wu’s [69] test for the eastern and central–western regions, the first two regions to carry out the test of inter group differences, the test shows that the p-value is 0.001, so then at the 1% level the impact of NQP on the realization of ES in different regions shows a significant difference. The regression analysis yields divergent regional dynamics:as shown in Table 9 central–western provinces exhibit statistically significant positive coefficients (p < 0.01) for innovative productivity paradigms’ enhancement of ES, whereas eastern regions demonstrate directionally favorable but statistically insignificant associations at conventional thresholds. Thus, it is analyzed that advanced productive forces in the eastern region are higher and develop faster, but its industrial structure is already more mature, and the marginal effect of ES realization is relatively small. The eastern region is dominated by financial, scientific, technological, and high-end manufacturing industries, with a high concentration of resources and factors, but the potential for bringing about the value of ecological products is relatively limited, relying more on the spontaneous promotion of market mechanisms and technological innovation. In contrast, although the overall level of NQP in the central and western regions is relatively low, it is growing at a faster rate and has a greater potential for improvement. These regions, with the support of national policies, such as the Western Development and Central Rise Strategies, are constantly optimizing their industrial structure and promoting the combination of resource development and ecological protection. In addition, the central and western regions have rich natural resources, which provide a material basis for the fulfillment of ES, while policy support and input of factor resources further promote the manifestation and commercialization of ES. Interior provinces demonstrate strategic prioritization of bio-industrial cluster development and eco-innovation initiatives during next-gen productivity transitions, thereby establishing catalytic pathways for nature-based asset valorization. For example, through the development of forest economy, ecology tourism, and other industries in the western region, ecological advantages have been transformed into economic advantages, which have catalyzed substantial appreciation in the economic valuation of sustainable biophysical assets. While eastern provinces exhibit robust advancement in next-generation productive systems, the marginal returns on nature-based asset valorization demonstrate diminishing trajectories. Conversely, interior regions manifest amplified ecosystem service synergies under dual institutional reinforcement and biophysical capital endowments, wherein innovation-driven productivity frameworks yield disproportionately higher ecological service coefficients.

4.6.2. Analyzing Heterogeneity in Levels of Digital Economic Development

Disparities in digital development levels generate heterogeneity in how NQP influences regression outcomes; this paper draws on Song [70] to classify Beijing, Tianjin, Liaoning, Shanghai, Jiangsu, Zhejiang, Anhui, Fujian, Shandong, Henan, Hubei, Guangdong, and Sichuan as high-level areas of the digital economy, and the other provinces and regions as low-level areas of the digital economy. First of all, regarding the high level of the digital economy and low-level areas to test the difference between the groups, the test shows that the p value is 0.000, so at the 1% level, the advancement level of NQP on the fulfillment of ES in the different levels of digital economy development show significant differences. Statistical analysis demonstrates a nuanced relationship between NQP and ES fulfillment, moderated by regional digital economic development levels. Specifically, in regions with less-developed digital economies, the advancement of NQP exhibits a positive association with ES fulfillment at the 10% significance threshold. Conversely, for regions at more advanced digital economic stages, the hypothesis positing a similar positive effect fails to achieve statistical significance at the same threshold. This suggests that while productivity improvements may enhance ES outcomes in digitally underdeveloped areas, the relationship becomes attenuated in contexts with mature digital infrastructure. The reason for this phenomenon may be that regions with low levels of digital economy development are usually in the early stage of economic transformation, where traditional industries dominate, resource use efficiency is low, and ecological environment pressure is high. In these regions, the development of NQP is often centered on technological innovation and green transformation, which can significantly improve resource efficiency and reduce environmental pollution, thus directly contributing to the realization of ES. Since the market for ecological products in these regions is not yet mature, the introduction of NQP can quickly fill the market gap and bring obvious economic and ecological benefits, so the positive impact of NQP on the fulfillment of ES is more easily observed at the 10% significance level. In contrast, regions with high levels of digital economy development have usually completed initial economic transformation, with a more diversified industrial structure and higher levels of resource utilization efficiency and environmental governance. In these regions, the development of NQP may have entered a mature stage, and its marginal effect on the fulfillment of ES gradually diminishes. In addition, the market for ecological products in high-level regions is relatively mature and market competition is intense, and further innovations in NQP may face higher technical barriers and market thresholds, resulting in its contribution to the fulfillment of ES no longer being significant. Therefore, the hypothesis of the positive impact of NQP on the economic actualization of environmental assets may not be accepted in high-level regions at the 10% significance level. In addition, the policy environment and market mechanism in high-level areas of digital economy development may be more complete, and the fulfillment of ES does not only depend on the development of NQP, but may also be influenced by multiple factors such as policy support, market demand, and consumer preference. The multifaceted interplay among these variables can obscure the straightforward causal link between productivity advancements and eco-product value actualization. This dynamic relationship may erode the measurable positive outcomes to the point where they no longer register statistical significance.

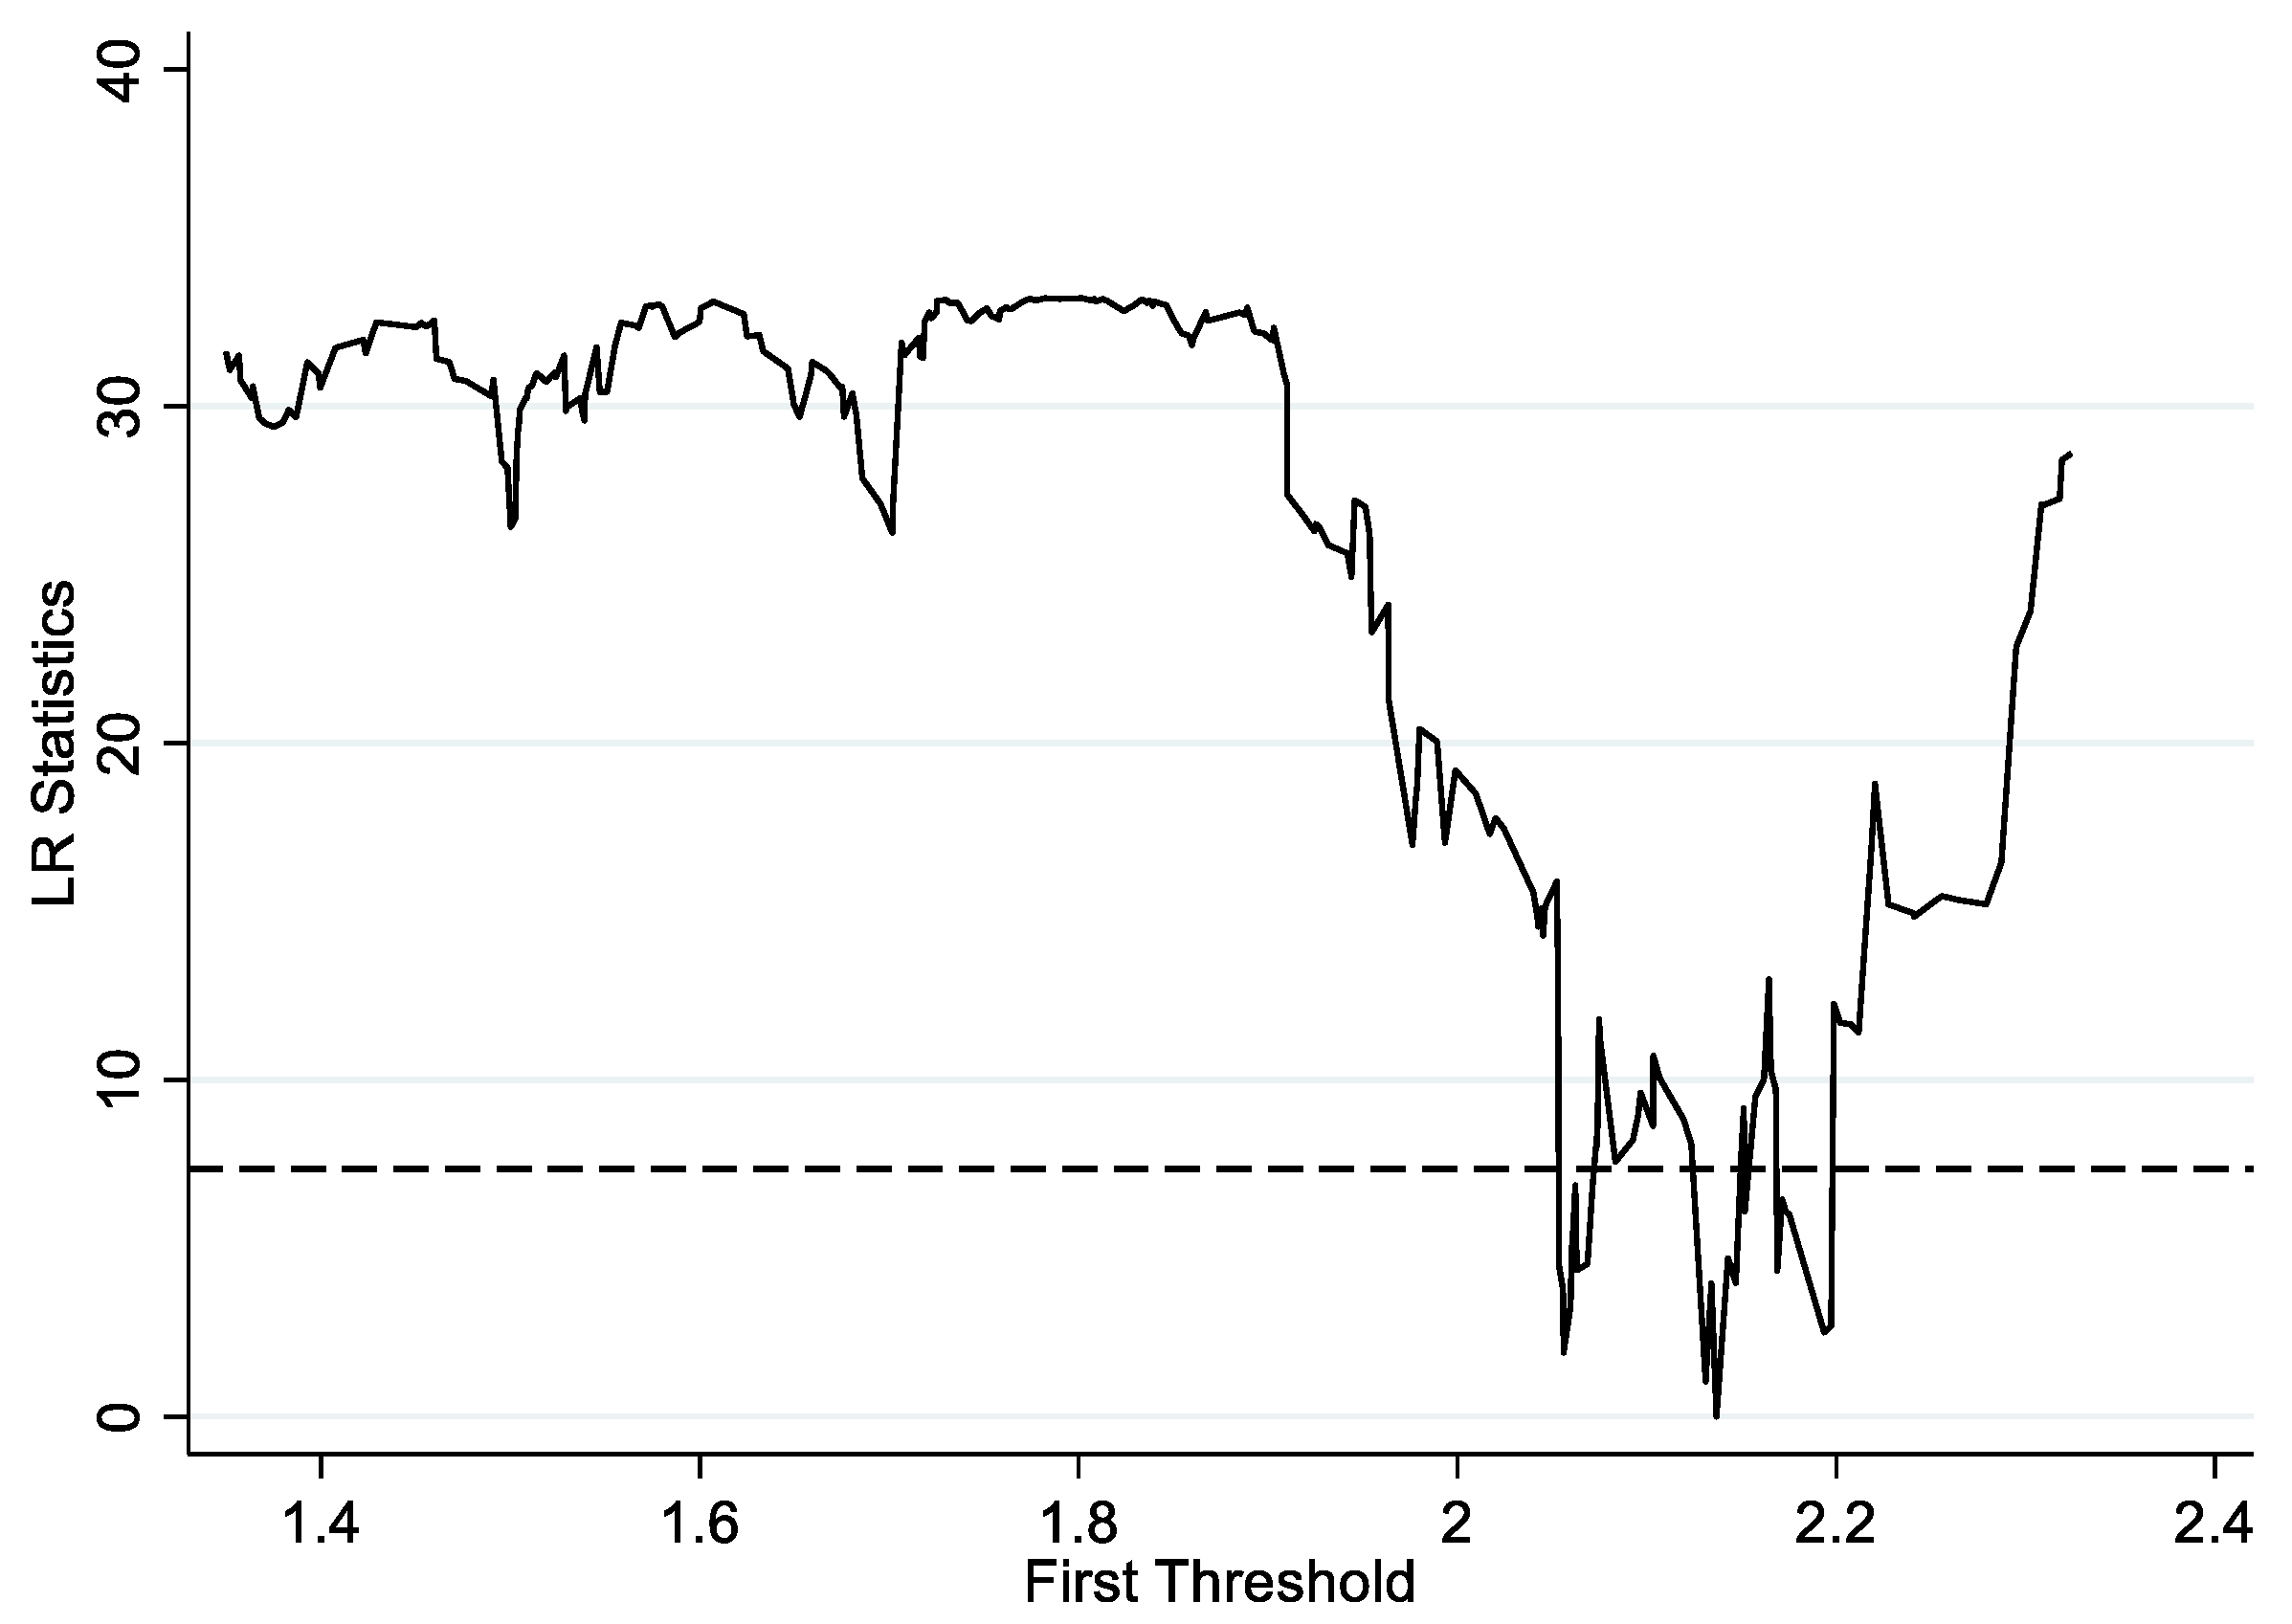
4.7. Analysis of Threshold Effect

Through reading the literature, it can be seen that there is a non-linear relationship between the new quality productivity and the value of forestry ecological products in the relevant research [71]; through the analysis above, it can be seen that there is regional heterogeneity in the realization of the value of ecological products by new quality productivity, and there are differences in the level of development of the policies and mechanisms in different regions, and based on the empirical data of the OECD, it can be seen that there is a threshold in the maturity level of technology, according to which we will carry out the threshold effect test to verify the potential non-linear relationship between the two. In this paper, the Bootstrap self-sampling method is used to repeat the sampling 500 times to test the single and double thresholds [72], and to obtain the F statistics and p value of each threshold, and Table 10 outlines the key findings from the tests.
After testing of single threshold and double threshold, it was found that the p-value was less than 0.1 which passed the test; therefore, a double-threshold test was performed and found that the p-value was greater than 0.1 and did not pass the double-threshold test. In addition, through the single-threshold effect plot shown in Figure 2 and Figure 3, it can be seen that the nadir is smaller than the standard dotted line, so the threshold is real. Therefore, government expenditure on environmental protection and total mechanical power per hectare of sown area of crops (kW/ha) were identified as having single-threshold characteristics with thresholds defined as 0.0512 and 2.1367.
Table 11 shows that when the level of government environmental protection expenditure and the total mechanical power per hectare of crop sowing area is less than and greater than the first threshold, quality-enhanced productivity demonstrates a substantial constructive association with ecosystem service delivery outcomes. When the level of government environmental protection expenditure is greater than the first threshold, the positive impact increases significantly, and when the total mechanical power per hectare of crop sowing area is greater than the first threshold, the positive impact is reduced, and the reason should be that for the level of government environmental protection expenditure, the increase in environmental protection cost promotes the improvement of the ecological industry chain from planting to processing to marketing. The reason should be that when the government environmental protection expenditure level is increased to promote the improvement of the ecological industry chain, planting, processing, and sales of all links have been improved. An integrated supply chain system enhances both the profit margins of eco-friendly products and consumer perception of their value, ultimately driving their successful commercialization. In the meantime, the large-scale environmental protection investment also conveys the government’s clear signal of strengthening ecological protection, guiding the market and social capital to invest more in the ecological field, further amplifying the positive effect of NQP on the fulfillment of ES. When the total mechanical power per hectare of crop sown area exceeds a certain threshold, excessive mechanization may lead to a series of negative effects. Initial concerns arise from over-compaction caused by heavy machinery, which disrupts soil integrity and nutrient availability. These conditions subsequently compromise plant development quality and diminish the economic worth of sustainable agricultural outputs. Second, over-reliance on mechanical power may increase energy consumption and carbon emissions, which is contrary to the sustainable development concept of ecology agriculture. In addition, excessive use of machinery may reduce biodiversity and disrupt the ecological balance, further weakening the value of ecological products.

5. Conclusions and Recommendations

5.1. Conclusions

Taking 31 provinces and cities in China (except Hong Kong, Macao, and Taiwan) as the research objects, this paper constructed an integrated evaluation system of NQP and measured its development level based on the entropy law, and explored the impact of NQP on the fulfillment of ES and its mechanism of action. It is found that the development of NQP can significantly facilitate the fulfillment of ES, and this conclusion remains robust after overcoming the endogeneity problem. Specifically, NQP provides important support for the fulfillment of ES by promoting industrial structure upgrading and green financial development. The urbanization rate plays a positive moderating role in the course of NQP contributing to the realization of ecological products value. In addition, the analysis of regional heterogeneity shows that the promotion implication of new productivity on the fulfillment of ES is more significant in the central and western regions, but not in the eastern region. This difference mainly stems from the fact that the maturity of the industrial structure in the eastern region is higher, and the marginal effect of the fulfillment of ES is limited, whereas in the central and western regions, under the dual role of policy support and resource endowment, there is more potential for the advancement of NQP and more space for the fulfillment of ES. In terms of digital economy heterogeneity, the impact of NQP on the fulfillment of ES is significant in provinces with a lower level of digital economy development, while it is not significant for provinces with a higher level, and this disparity primarily stems from development priorities in less digitally advanced regions, where emerging productivity paradigms prioritize clean technology innovation and sustainable industrial transitions. These strategic focuses enhance resource efficiency and minimize environmental degradation, creating direct pathways to monetize eco-friendly outputs. In provinces with a high level of digital economy development, new productivity is more mature, and further innovation of new productivity may face higher technical barriers and market thresholds, resulting in the promotion of ecological product value realization being no longer significant. Finally, further analyses show that government environmental expenditure and total mechanical power per hectare of sown area play a single-threshold effect in the impact of NQP on the realization of ecological products value. Through the innovation of technology, industry, and production methods, new quality productivity promotes the advanced industrial structure and green investment development, further promoting the realization of the value of eco-products, and this process is highly consistent with the goals of sustainable development, such as the efficient use of resources, environmental protection, and social equity. Therefore, new quality productivity is not only the driving force for the realization of ecological product value, but also the key support for sustainable development.

5.2. Recommendations

First, differentiated policy design should be strengthened to address the development level of NQP and the potential for realizing ES in different regions and at different levels of digital economy development [73]. The eastern region should further promote the development of new quality productivity in the direction of high-end and intelligent, and enhance the efficiency of ecological product value realization, while the central and western regions should increase policy support, improve infrastructure construction, promote the in-depth integration of NQP and ecological industries, give full play to the advantages of resources, and maximize the value of ecological products. For provinces with a high level of digital economy development, they should further promote the diversification of industrial structure, promote the improvement of resource utilization efficiency, and pay attention to the government’s environmental protection expenditure, so as to expand the market of ecological products by influencing the consumers’ psychology and thus promote the realization of ES. For provinces with a lower level of digital economy development, it is necessary to continue to deepen productivity reform, develop NQP, reduce environmental pollution, and promote the further improvement of the ecological product market.
Secondly, it has strengthened the upgrading of the industrial structure by implementing a ‘one enterprise, one policy’ technological transformation program for high-energy-consuming industries, guiding enterprises to adopt intelligent monitoring systems and low-carbon production processes through financial subsidies and tax exemptions, and establishing a green supply-chain certification system [74]. Green Manufacturing Demonstration Zones have been set up in industrial clusters in Beijing, Tianjin, Hebei, and the Yangtze River Delta, providing centralized clean energy supply and waste recycling infrastructure support to enterprises in the zones. Focus on new energy, bio-based materials, ecological restoration technology, and other fields, the establishment of national-level ‘green technology incubation bases’, and tax incentives for breakthrough technologies. Implement the ‘ecological products +’ industrial integration project, and support new modes such as ‘eco-agriculture + digital traceability’, ‘eco-tourism + blockchain authentication’, and other new modes in ecologically resource-rich areas, so as to enhance the premium capacity of eco-products. Support new modes such as ‘eco-agriculture + digital traceability’, ‘eco-tourism + blockchain authentication’, etc., in ecologically resource-rich areas, so as to enhance the premium capacity of ecological products. Cultivate the ecological development of strategic emerging industries.
Thirdly, give full play to the role of green investment [63], improve the multi-level green capital market, allow ecological restoration enterprises to raise funds through ‘future income right ABS’, and pilot the issuance of REITs using the expected income from forest carbon sinks as the underlying asset. Promote commercial banks to develop ‘green investment-linked loans’, and activate the participation of social capital through policy preferences. Build mechanisms such as a ‘double-lever’ fiscal and tax incentive system and green investment risk mitigation mechanism to strengthen policy incentives and risk prevention and control.
Lastly, to optimize the regulatory function of the urbanization process, in areas with high urbanization rates, the experience of the ‘digital twin city’ of Xiongan New Area should be promoted, and an intelligent management system covering energy, transportation, and buildings should be constructed to achieve the dynamic and optimal allocation of ecological resources. An early warning platform for the ecological carrying capacity of cities and towns will be set up to automatically match the demand for ecological infrastructure expansion according to the scale of population inflow. By promoting the urbanization process, it will promote the positive adjustment of ecological products by the new quality of productive forces.

Author Contributions

Conceptualization, H.L.; methodology, P.Z.; software, P.Z.; validation, P.Z.; formal analysis, P.Z.; investigation, H.L.; resources, H.L.; data curation, P.Z.; writing—original draft preparation, P.Z.; writing—review and editing, H.L.; visualization, P.Z.; supervision, H.L.; project administration, H.L.; funding acquisition, H.L. All authors have read and agreed to the published version of the manuscript.

Funding

Young Scientist Fund of the National Natural Science Foundation of China (Grant No. 72201054) and Excellent Young Scientist Fund of Natural Science Foundation of Heilongjiang Province of China (Grant No. YQ2022G001).

Institutional Review Board Statement

Not applicable.

Informed Consent Statement

Not applicable.

Data Availability Statement

Data will be made available on request.

Acknowledgments

Our deepest gratitude goes to the editors and reviewers for their careful work and thoughtful suggestions that have helped improve this paper substantially.

Conflicts of Interest

The authors declare that they have no known competing financial interests or personal relationships that could have appeared to influence the work reported in this paper.

Abbreviations

The following abbreviations are used in this manuscript:
NQPnew quality productivity
ENPlevel of economic development
OPENlevel of openness to the outside world
ENRecological environment perspective
GOVdegree of government intervention
GNSlevel of environmental protection expenditure
ESecological product value
INDUadvanced industrial structure
Ggreen investment
HACPMDtotal mechanical power per hectare of sown area of crops
CNSgovernment expenditure

References

  1. Tenaw, D. Green and traditional productivity growth with natural capital: The role of resource depletion, environmental damages and sectoral composition. Resour. Policy 2025, 103, 105544. [Google Scholar] [CrossRef]
  2. Yue, S.; Bajuri, N.H.; Khatib, S.F.A.; Lee, Y. New quality productivity and environmental innovation: The hostile moderating roles of managerial empowerment and board centralization. J. Environ. Manag. 2024, 370, 122423. [Google Scholar] [CrossRef] [PubMed]
  3. Lu, C.; Wu, Q.; Chen, J. Connotative Characteristics, Generation Mechanism and Enhancement Path of Agricultural New Quality Productivity. Shanxi Agric. Econ. 2025, 5, 10–12. [Google Scholar]
  4. Zeng, X.; Yu, D. Problems faced in realising the value of ecological products and suggestions for countermeasures. China Ecol. Civiliz. 2023, 6, 24–28. [Google Scholar]
  5. Song, X.; Irfan, M.; Alnafrah, I.; Hao, Y. Economic policy uncertainty and carbon neutrality in China: Do sustainable energy and eco-innovation make a difference? Sustain. Dev. 2024, 32, 4057–4070. [Google Scholar] [CrossRef]
  6. Dagestani, A.A.; Alnafrah, I.; Smutka, L.; Bilan, Y.; Chen, P. Greenwashing and stakeholder theory in China: An empirical evidence of corporate social responsibility and firms performance. Environ. Dev. Sustain. 2024, 1–26. [Google Scholar] [CrossRef]
  7. Zhang, Q.; Shen, X.; Shen, C.; Chen, Y.; Su, B.; Yin, Q.; Zhou, S. Integration of land ecological consolidation and ecosystem product value realization: A case from the Yangtze riverside industrial park in Changzhou, China. J. Environ. Manag. 2024, 353, 120120. [Google Scholar] [CrossRef] [PubMed]
  8. Zhu, M.; Zhang, X.; Elahi, E.; Fan, B.; Khalid, Z. Assessing ecological product values in the Yellow River Basin: Factors, trends, and strategies for sustainable development. Ecol. Indic. 2024, 160, 111708. [Google Scholar] [CrossRef]
  9. Yang, S.; Zhou, L.; Zhang, P.; Fang, S.; Li, W. Evaluating the spillover value of ecological products from urban rivers eco-restoration: A quasi-natural experiment in Wuhan, China. Ecol. Indic. 2023, 156, 111095. [Google Scholar] [CrossRef]
  10. Gao, X.; Zheng, H.; Ouyang, Z. Research on the Vision, Objectives, and Pathways to Realize the Eco-Product Value. Nat. Resour. Econ. China 2023, 36, 50–55. [Google Scholar]
  11. Costanza, R.; d’Arge, R.; de Groot, R.; Farber, S.; Grasso, M.; Hannon, B.; Limburg, K.; Naeem, S.; O’Neill, R.V.; Paruelo, J.; et al. The value of the world’s ecosystem services and natural capital. Nature 1997, 387, 253–260. [Google Scholar] [CrossRef]
  12. Cooper, N.; Brady, E.; Steen, H.; Bryce, R. Aesthetic and spiritual values of ecosystems: Recognising the ontological and axiological plurality of cultural ecosystem ‘services’. Ecosyst. Serv. 2016, 21, 218–229. [Google Scholar] [CrossRef]
  13. Brown, T.C.; Bergstrom, J.C.; Loomis, J.B. Defining, valuing, and providing ecosystem goods and services. Nat. Resour. J. 2007, 47, 329–376. [Google Scholar]
  14. Boyd, J.; Banzhaf, S. What are ecosystem services? The need for standardized environmental accounting units. Ecol. Econ. 2007, 63, 616–626. [Google Scholar] [CrossRef]
  15. Pan, J. Attributes of ecological products and their value traceability. Environ. Sustain. Dev. 2020, 6, 72–74. [Google Scholar]
  16. De Groot, R.; Brander, L.; van der Ploeg, S.; Costanza, R.; Bernard, F.; Braat, L.; Christie, M.; Crossman, N.; Ghermandi, A.; Hein, L.; et al. Global estimates of the value of ecosystems and their services in monetary units. Ecosyst. Serv. 2012, 1, 50–61. [Google Scholar] [CrossRef]
  17. Farley, J. The role of prices in conserving critical natural capital. Conserv. Biol. 2008, 22, 1399–1408. [Google Scholar] [CrossRef]
  18. Loomis, J.; Kent, P.; Strange, L.; Fausch, K.; Covich, A. Measuring the total economic value of restoring ecosystem services in an impaired river basin: Results from a contingent valuation survey. Ecol. Econ. 2000, 33, 103–117. [Google Scholar] [CrossRef]
  19. Owuor, M.A.; Mulwa, R.; Otieno, P.; Icely, J.; Newton, A. Valuing mangrove biodiversity and ecosystem services: A deliberative choice experiment in Mida Creek, Kenya. Ecosyst. Serv. 2019, 40, 101040. [Google Scholar] [CrossRef]
  20. Viglizzo, E.F.; Paruelo, J.M.; Laterra, P.; Jobbágy, E.G. Ecosystem service evaluation to support land-use policy. Agric. Ecosyst. Environ. 2012, 154, 78–84. [Google Scholar] [CrossRef]
  21. May, P.H.; Veiga Neto, F.; Denardin, V.; Loureiro, W. Using fiscal instruments to encourage conservation: Municipal responses to the ‘ecological’ value-added tax in Paraná and Minas Gerais, Brazil. In Selling Forest Environmental Services: Market-Based Mechanisms for Conservation and Development; Pagiola, S., Bishop, J., Landell-Mills, N., Eds.; Earthscan: London, UK, 2002; pp. 173–199. [Google Scholar]
  22. Dong, J.; Chen, J.; Zhang, Y.; Cong, L.; Dean, D.; Wu, Q. Examining the value realization of ecological agricultural products in China: A tripartite evolutionary game analysis. J. Environ. Manag. 2025, 374, 124134. [Google Scholar] [CrossRef] [PubMed]
  23. Zhang, L.; Li, H.Y.D.; Jia, Z.; Wu, F.; Liu, X. Connotation of ecological products and its value realization way. J. Agric. Mach. 2019, 6, 173–183. [Google Scholar]
  24. Li, Y.S. Industrialized operation of ecology and realizing the value of ecological goods. Stud. Social. Chin. Charact. 2018, 4, 84–89. [Google Scholar]
  25. Chan, K.M.; Goldstein, T.S.J. Rethinking ecosystem services to better address and navigate cultural values. Ecol. Econ. 2012, 74, 8–18. [Google Scholar] [CrossRef]
  26. Lin, Y.; Luo, X. The Generative Logic, Theoretical Implications and Practical Paths of Xi Jinping’s Important Discourse on Realizing the Value of Ecological Products. J. Qiqihar Univ. Philos. Soc. Sci. Ed. 2024, 12, 7–12. [Google Scholar]
  27. He, L.; Li, Z. Realization of the Value of Rural Ecological Products: Scientific Connotation, Realistic Dilemma and Breakthrough Strategies. J. Shaanxi Univ. Technol. Soc. Sci. 2025, 43, 13–19. [Google Scholar]
  28. Cen, C.; An, W. The scientific understanding of the four dimensions of “new quality productive forces”—Multidimensional interpretation based on “quality”. J. Hunan Agric. Univ. Soc. Sci. 2025, 26, 44–52. [Google Scholar]
  29. Chu, H.; Niu, X.; Li, M.; Wei, L. Research on the impact of new quality productivity on enterprise ESG performance. Int. Rev. Econ. Financ. 2025, 99, 104009. [Google Scholar] [CrossRef]
  30. Han, W.; Zhang, R.; Zhao, F. The Measurement of New Quality Productivity and New Driving Force of the Chinese Economy. J. Quant. Technol. Econ. 2024, 41, 5–25. [Google Scholar]
  31. Nie, J.; Shen, J.; Chen, Y. The effect of new quality productivity on port sustainability: Evidence from China. J. Sea Res. 2025, 204, 102575. [Google Scholar] [CrossRef]
  32. Gu, P.; Zhang, S.; Liang, C. The Internal Logic and Realization Path of New Quality Productivity Enabling the High-Quality Development of Sports Tourism Industry. Sports World 2025, 1, 25–28. [Google Scholar]
  33. Gao, G.; Li, Y.; Li, J. The Theoretical Origin, Formation Process and Development Path of New Quality Productive Forces. Bus. Econ. 2025, 3, 1–4. [Google Scholar]
  34. Wang, D.; Tan, W.; Wang, H. The Intrinsic Mechanism and Implementation Path of the Value Realization of Rural Ecological Products Empowered by New-Quality Productivity. J. Nanning Norm. Univ. Nat. Sci. Ed. 2024, 41, 97–105. [Google Scholar]
  35. Liao, W.; Zheng, X.; Jiang, L. Impact Mechanism of New-Quality Productive Forces in Forestry on the Efficiency of Forest Ecological Product Value Realization. Sci. Silvae Sin. 2025, 1–19. [Google Scholar]
  36. Xue, R.; Chen, J. ESG performance and stability of New Quality Productivity Forces: From perspective of China’s modernization construction. Int. Rev. Econ. Financ. 2025, 98, 103911. [Google Scholar] [CrossRef]
  37. Sharma, H.; Padhi, B.; Sharif, A.; Bashir, M.F. Striving towards green total factor productivity: A bibliometric and systematic literature review for future research agenda. J. Environ. Manag. 2025, 377, 124639. [Google Scholar] [CrossRef] [PubMed]
  38. Yuan, B.; Wu, F. Application of thermal energy efficiency utilization based on computer technology in green manufacturing blockchain production traceability. Therm. Sci. Eng. Prog. 2024, 54, 102859. [Google Scholar] [CrossRef]
  39. Wang, S.; Zhang, H. Inter-organizational cooperation in digital green supply chains: A catalyst for eco-innovations and sustainable business practices. J. Clean. Prod. 2024, 472, 143383. [Google Scholar] [CrossRef]
  40. Song, M.; Pan, H.; Shen, Z.; Tamayo-Verleene, K. Assessing the influence of artificial intelligence on the energy efficiency for sustainable ecological products value. Energy Econ. 2024, 131, 107392. [Google Scholar] [CrossRef]
  41. Chen, Q.; Chen, B.; Xie, H. Digital Empowering Ecological Product Value Realization: Basic Logic and Typical Paths. China Land Sci. 2023, 37, 116–127. [Google Scholar]
  42. Chen, K. Research on the high quality development of the agricultural economy in the context of new quality productivity. Shanxi Agric. Econ. 2025, 3, 184–186. [Google Scholar]
  43. Zhang, Y.; Ye, A.; Li, T. Can carbon-saving technological advancement promote the clean transformation of industrial structure? Evidence from China. J. Clean. Prod. 2025, 489, 144683. [Google Scholar] [CrossRef]
  44. Li, S.; Wang, W. Theoretical Logic and Practical Path of Chinese Modernization Empowered by New Quality Productivity. Study Explor. 2025, 1, 80–86. [Google Scholar]
  45. Shen, H.; Qin, M.; Li, T.; Zhang, X.; Zhao, Y. Digital finance and industrial structure upgrading: Evidence from Chinese counties. Int. Rev. Financ. Anal. 2024, 95, 103442. [Google Scholar] [CrossRef]
  46. Zhao, K.; Gao, Y.; Liu, X. The impact of environmental regulation on industrial structure upgrading: A case study of low carbon city pilot policy. Energy Policy 2025, 197, 114432. [Google Scholar] [CrossRef]
  47. Liu, Z.; Xv, J.; Wu, F. New Productivity Empowering Carbon Neutrality Performance: Mechanisms and Empirical Test. Environ. Sci. 2025, 1–21. [Google Scholar] [CrossRef]
  48. Zhang, H. Green finance gives new impetus to high-quality economic and social development. People’s Trib. 2024, 23, 72–74. [Google Scholar]
  49. Wang, Y.; Luo, H. Research on the Impact of Regional Environmental Regulations on Green Investment of Heavy Polluting Enterprises—Based on the Regulatory Role of New Quality Productivity. China-Arab. States Sci. Technol. Forum 2025, 3, 8–12. [Google Scholar]
  50. Wu, Y.; Sun, H.; Zhang, L.; Cui, C. Green investment and quality of economic development: Evidence from China. Int. Rev. Financ. Anal. 2025, 103, 104147. [Google Scholar] [CrossRef]
  51. Li, S.; Yin, Y.; Jiao, Z.; Zhao, Q. Financial investment and green development: How does financialization affect green total factor productivity? Financ. Res. Lett. 2025, 78, 107258. [Google Scholar] [CrossRef]
  52. Zhou, Z. Research on the Impact of Green Financial Innovation in the Background of Dual Carbon Goals on Boosting Consumption and National Economic Growth—Take Guizhou Province as an Example. China J. Commer. 2025, 34, 110–113. [Google Scholar]
  53. Shi, R.; Xv, W. Mechanisms and spatial spillover effects of new quality productivity on green innovation efficiency: Empirical evidence from 284 cities at or above the prefecture level in China. China Environ. Sci. 2025, 1–14. [Google Scholar] [CrossRef]
  54. Ming, Q.; Liu, H.; Shi, P. Coupling Coordination between Cultural Tourism Industry and New-Type Urbanization and Its Influencing Factors. Geogr. Geo-Inf. Sci. 2025, 1–10. [Google Scholar]
  55. Lei, X.; Chen, X.; Wang, N.; Wu, J.; Zhang, B. Urbanization and low-carbon transformation in China’s agriculture: An empirical investigation. Energy 2025, 320, 135242. [Google Scholar] [CrossRef]
  56. Yuan, C.; Zhang, B.; Xu, J.; Lyu, D.; Liu, J.; Hu, Z.; Han, Y. Impact of new-type urbanization pilot policy on public service provision: Evidence from China. Cities 2025, 161, 105853. [Google Scholar] [CrossRef]
  57. Li, J.; Li, J.; Zhu, Y. Research on the Impact of New Urbanization Pilot Policy on Population Mobility. Chin. J. Popul. Sci. 2023, 37, 22–34. [Google Scholar]
  58. Li, X.; Zhang, S.; Cheng, G. Spatial Imbalance and Distribution Dynamic Evolution of the Independent Innovation Ability of the Artificial Intelligence Industry in the Three Support Belts. J. Quant. Technol. Econ. 2020, 37, 3–25. [Google Scholar]
  59. Tao, F.; Zhu, P.; Qiu, C. The Impact of Digital Technology Innovation on Enterprise Market Value. J. Quant. Technol. Econ. 2023, 40, 68–91. [Google Scholar]
  60. Xie, G.; Zhang, C.; Zhang, L.; Chen, W.; Li, S. Improvement of the Evaluation Method for Ecosystem Service Value Based on Per Unit Area. J. Nat. Resour. 2015, 30, 1243–1254. [Google Scholar]
  61. Wang, J.; Li, M.; Zhu, H. Research on the Measurement and Influencing Factors of the Value Realization Level of Ecological Products. J. Green Sci. Technol. 2024, 26, 254–260+267. [Google Scholar]
  62. Sun, Y.; Zhang, D.; Liang, Y. Value Realization of Ecological Products and Integrated Urban-rural Development:An Empirical Study Based on Urban-rural Integrated Development Pilot Zones. Stat. Res. 2024, 41, 87–99. [Google Scholar]
  63. Dai, J.; Xiao, Q. Business Environment Optimization, Digital Transformation, and Enterprises’ Green Innovation. Sustainability 2025, 17, 1794. [Google Scholar] [CrossRef]
  64. Tian, Y. Will Informal Institutions Affect ESG Rating Divergence? Evidence from Chinese Confucian Culture. Sustainability 2024, 16, 9951. [Google Scholar] [CrossRef]
  65. Wei, H.; Wang, Y.; Yang, C.; Yu, P. Empirical Analysis of the Role of Digital Agriculture in Enabling Coordinated Development of Ecosystem Services and Human Well-Being: Evidence from Provincial Panel Data in China. Sustainability 2024, 16, 10199. [Google Scholar] [CrossRef]
  66. Jiang, T. Mediating Effects and Moderating Effects in Causal Inference. China Ind. Econ. 2022, 5, 100–120. [Google Scholar]
  67. Li, Y.; Zheng, W.; Jiang, X. Impact of Green Finance on Guangxi’s Carbon Emissions under the “Double Carbon” Goal. Energy Res. Manag. 2025, 1, 100–106. [Google Scholar]
  68. Yang, Q.; Guo, L.; Liu, X. Driving characteristics of the spatial correlation pattern of carbon emissions from provincial transportation in China. China Environ. Sci. 2024, 44, 1171–1184. [Google Scholar]
  69. Wu, J.; Han, C.; Zhang, W. Research on the Impact of Population Aging on Technological Innovation and Economic Growth: Retesting Based on Factor Endowment. East China Econ. Manag. 2023, 37, 103–110. [Google Scholar]
  70. Song, Y.; Sun, W.; He, X. The Impact of Digital Economy on Green Technology Innovation in Manufacturing Industry—Based on the Threshold Effect of Heterogeneous Environmental Regulation. China J. Commer. 2025, 34, 36–42. [Google Scholar]
  71. Li, H.; Zhang, Y.; Tian, G. Evaluation of the mechanism and effect of new quality productive forces in enabling high-quality forestry development. J. Agro-For. Econ. Manag. 2025, 1–13. [Google Scholar]
  72. Gao, X.; Luo, X.; Liu, X. Thresholds to rural energy transition: The multistage effects of urbanization on the rural household energy consumption structure. Energy 2025, 319, 135121. [Google Scholar] [CrossRef]
  73. Ye, L.; Fang, Z. The Impact of New-Quality Productivity on Environmental Pollution: Empirical Evidence from China. Sustainability 2025, 17, 3230. [Google Scholar] [CrossRef]
  74. Yao, Y.; Pan, H. The Effect of Intelligent Development on Green Economy Efficiency: An Analysis Based on China’s Province-Level Data. Sustainability 2025, 17, 678. [Google Scholar] [CrossRef]
Figure 1. Flow chart.
Sustainability 17 04773 g001
Figure 2. HACPMD single-threshold effect plot.
Sustainability 17 04773 g002
Figure 3. GNS single-threshold effect plot.
Sustainability 17 04773 g003
Table 1. Indicator system for the development of NQP at the provincial level.
Level 1 IndicatorsLevel 2
Indicators
Level 3 IndicatorsIndicator PropertiesData Sources
Quality of inputsTalent QualityUndergraduate enrollment+National Statistical Yearbook of China
Number of patents granted over total population+National Statistical Yearbook of China
Full-time equivalent of R&D personnel in industrial enterprises above scale+National Statistical Yearbook of China
Investment in R&DGovernment expenditure on education+National Statistical Yearbook of China
R&D investment+National Statistical Yearbook of China
Length of optical fiber lines+National Statistical Yearbook of China
Productive vigorIntelligent LevelMobile phone penetration rate+National Statistical Yearbook of China
Greening LevelElectricity consumption+National Statistical Yearbook of China
Sulphur dioxide emission of CNY 10,000 GDPNational Statistical Yearbook of China
Complete investment in wastewater treatment projects+National Statistical Yearbook of China
Complete investment in waste gas treatment project+National Statistical Yearbook of China
Output effectivenessEconomic BenefitsSales revenue of new products of industrial enterprises above scale+National Statistical Yearbook of China
Total telecommunications business+National Statistical Yearbook of China
Social BenefitsDisposable income gap between urban and rural areasNational Statistical Yearbook of China
Medical investment ratio of each province to GDP+National Statistical Yearbook of China
Ecological BenefitCrop sown area per hectare+National Industrial Yearbook of China
Table 2. Results of descriptive statistics.
Type of VariableVariable CodeSample SizeMeanStandard
Deviation
MinimumMaximum
Explained VariablesES3109.3910.9856.95211.410
Explanatory VariableNQP3100.580.0910.2170.781
Control VariablesENP3100.2360.18701
OPEN3100.1970.20201
ENR3100.080.11201
GOV3100.1480.16201
GNS3100.1250.12501
Table 3. VIF test.
Table 3. VIF test.
VariableVIF1/VIF
GOV3.0900.323
ENP2.3700.422
GNS2.2700.442
OPEN2.2100.453
ES2.1900.456
ENR1.0300.974
MeanVIF2.190
Table 4. Unit root test.
Statisticp-Value
Unadjusted t−15.1823
Adjusted t −7.86490.0000
Table 5. Benchmark regression results.
(1)(2)(3)(4)(5)
ESESQuality of InputsProductive DynamismEfficiency of Outputs
NQP9965.569 ***9779.816 ***5593.280 ***9967.310 *52148.115 *
(3.13)(3.29)(2.84)(1.85)(1.95)
_cons22,970.028 ***29,238.949 ***32,478.215 ***27,974.392 ***−34.36
(12.93)(7.34)(7.08)(6.61)(0.00)
control variablenoyesyesyesyes
N310310310310310
R20.9480.950.9530.9510.954
adj. R20.940.9420.9450.9430.946
provincial fixed effectsyesyesyesyesyes
time fixed effectyesyesyesyesyes
Standard errors in parentheses *** p < 0.01, ** p < 0.05, * p < 0.1.
Table 6. Endogeneity test.
Lagged One-Period Explanatory VariablesFixed-Line TelephoneLagged One-Period Explanatory Variables and Landline
Telephones
(1)(2)(1)(2)(1)(2)
NQPESNQPESNQPES
iv10.525 *** 0.670 *
(9.33) (1.75)
iv2 2.050 *** 0.469 ***
(5.55) (7.29)
NQP 15,175.647 ** 49,789.605 *** 19,873.851 ***
(2.01) (3.66) (2.66)
Anderson canon. corr. LM statistic75.62232.50078.248
Cragg–Donald Wald F statistic87.00930.85245.409
10% maximal IV size16.3816.3819.93
control variableyesyesyesyesyesyes
time fixed effectyesyesyesyesyesyes
provincial fixed effectsyesyesyesyesyesyes
Standard errors in parentheses *** p < 0.01, ** p < 0.05, * p < 0.1.
Table 7. Robustness test.
Model 1Model 2Model 3Model 4
ESESESES
NQP6887.209 *
(1.93)
10,108.816 ***
(3.10)
9369.624 ***
(3.05)
9828.716 ***
(3.32)
_cons24,486.949 ***28,194.929 ***26,234.979 ***29,268.772 ***
(7.54)(7.09)(6.99)(7.36)
N310270248310
R20.9500.9430.9440.950
adj. R20.9420.9330.9320.942
control variableyesyesyesyes
time fixed effectyesyesyesyes
provincial fixed effectsyesyesyesyes
Standard errors in parentheses *** p < 0.01, ** p < 0.05, * p < 0.1.
Table 9. Heterogeneity test.
Regional HeterogeneityHeterogeneity in the Level of Development of the Digital Economy
(1)
Eastern
(2)
Midwest
(1)
High level
(2)
Low level
NQP1288.06712,738.883 ***−978.3828799.913 *
(0.32)(3.72)(−0.10)(1.99)
_cons19,635.218 ***34,470.459 **23,862.968 ***29,094.028 **
(4.4)(2.28)(5.03)(2.71)
N110190130180
R20.9830.9440.9610.950
adj. R20.9770.9320.9510.939
control variableyesyesyesyes
time fixed effectyesyesyesyes
provincial fixed effectsyesyesyesyes
Standard errors in parentheses *** p < 0.01, ** p < 0.05, * p < 0.1.
Table 10. Estimation results of the number of thresholds.
Threshold
Variable
Number of ThresholdsF-Valuep-ValueNumber of BS10 Percent
Threshold
5 Percent Threshold1 Percent Threshold
HACPMDSingle32.820.024050026.351830.781437.5249
double12.940.420050025.473429.849340.0575
GNSSingle25.820.044050021.314324.870430.9629
double7.240.636050017.152220.735327.8764
Table 11. Threshold regression results.
(1)(2)
LnESLnES
GNS (GNS < 0.0512) 0.335 **
(0.139)
GNS(GNS > 0.0512) 0.635 ***
(0.131)
HACPMD(HACPMD > 2.1367)0.622 ***
(0.129)
HACPMD (HACPMD < 2.1367)0.340 **
(0.137)
_cons9.260 ***9.400 ***
(0.0934)(0.0963)
control variableyesyes
N310310
number of id3131
R20.5610.555
Standard errors in parentheses *** p < 0.01, ** p < 0.05, * p < 0.1.
Disclaimer/Publisher’s Note: The statements, opinions and data contained in all publications are solely those of the individual author(s) and contributor(s) and not of MDPI and/or the editor(s). MDPI and/or the editor(s) disclaim responsibility for any injury to people or property resulting from any ideas, methods, instructions or products referred to in the content.

