Abstract
Corporate environmental, social, and governance (ESG) performance has become an increasingly critical driver of sustainable development. Investigating the impact of ESG performance on corporate green development is of great significance for achieving green transformation and sustainability goals. This study examines the effects and underlying mechanisms of ESG performance on the green development of Chinese A-share listed companies in the agricultural and forestry sectors from 2013 to 2023. The empirical results show that higher ESG performance significantly promotes corporate green development. Further heterogeneity analysis reveals that this effect varies markedly across ownership structures, geographic regions, and levels of ESG rating uncertainty. Mechanism testing indicates that ESG performance fosters green development primarily through three pathways: stimulating green innovation, improving resource allocation efficiency, and enhancing the structure of human capital. In addition, by decomposing green total factor productivity, this study further quantifies the contribution of ESG performance to green growth. These findings offer new insights into the ESG–green development nexus and provide valuable policy implications for the green transformation and sustainable development of agricultural and forestry enterprises.
1. Introduction and Literature Review
Amid increasingly severe global environmental challenges, sustainable development has become a core concern for economies worldwide. The rise of the environmental, social, and governance (ESG) concept has provided both a new direction and evaluation standard for corporate green development [1]. ESG aligns closely with the United Nations’ Sustainable Development Goals (SDGs), serving as a global blueprint for building a more sustainable and inclusive future. The implementation of ESG principles by enterprises not only enhances long-term competitiveness but also contributes to the realization of national and global sustainability targets.
As the world’s largest developing country, China has made substantial progress in ecological civilization and green development in recent years. However, the green transformation of traditional industries—particularly agriculture and forestry—remains fraught with challenges [2]. Listed enterprises in China’s agroforestry sector face a complex array of pressures, including resource constraints, environmental pollution, and ecological degradation. Despite supportive policies from the government, many of these enterprises still experience insufficient internal motivation, technological bottlenecks, and financing difficulties [3]. Moreover, ESG performance in this sector varies considerably, with many firms lagging in environmental responsibility, social contribution, and governance optimization. ESG ratings have emerged as a crucial determinant of enterprise credibility and strategic competitiveness [4,5]. Therefore, it is of great theoretical and practical significance to study the impact of ESG on the green development of listed companies in China’s agricultural and forestry industry.
From a theoretical perspective, existing ESG research has predominantly focused on the financial and energy sectors, while relatively limited attention has been given to traditional industries such as agriculture and forestry [6,7]. Unlike these mainstream sectors, the agroforestry industry combines both economic production and ecological conservation functions. This dual role leads to a green development path that is significantly distinct from that of other industries, particularly in terms of sustainability metrics and impact assessment frameworks [8,9]. Exploring the influence mechanism of ESG on the green development of agroforestry enterprises can help enrich the research framework of ESG theory and green development. From a practical perspective, studying the impact of ESG on the green development of listed enterprises in the agricultural and forestry industry can provide a basis for the government to formulate more targeted policies. For example, it can promote the green transformation of agricultural and forestry enterprises by improving the ESG information disclosure system and optimizing the green financial support system [1,10,11]. Meanwhile, the results of this study can also provide reference for corporate managers to help them optimize ESG practices, enhance green competitiveness, and achieve the goal of sustainable development.
In assessing green development, this paper adopts green total factor productivity (GTFP) as the core indicator. GTFP extends traditional total factor productivity (TFP) by incorporating environmental factors such as energy consumption, pollutant emissions, and resource efficiency into the production function framework. Compared with single-dimensional metrics such as carbon intensity or green patents, GTFP provides a more comprehensive and integrated measure of environmentally adjusted productivity. Theoretically rooted in the growth accounting and production frontier literature, GTFP has gained traction in recent years as a robust tool for evaluating green transition performance, especially in sectors with high environmental externalities [12]. In the context of ESG research, GTFP enables scholars to quantify the environmental and innovation outcomes of corporate ESG practices, linking governance and social responsibility to actual green production efficiency [13]. Therefore, GTFP is well-suited to capture the compound effects of ESG implementation on both economic output and ecological impact in the agroforestry sector.
An extensive amount of literature suggests that ESG performance positively correlates with firm value, financial performance, and investor confidence. High-ESG firms tend to have lower financing costs, greater operational efficiency, and improved reputational capital. However, such studies largely center on finance- and capital-intensive industries, limiting their applicability to resource-dependent sectors such as agriculture and forestry [14,15].
Green innovation plays a vital role in driving corporate sustainability. ESG initiatives have been shown to encourage investment in R&D and environmental technologies, thus serving as catalysts for green innovation [16,17,18]. Yet, most existing works lack an in-depth exploration of the mechanisms through which ESG affects innovation outcomes—especially in sectors where innovation capacity is structurally constrained [19,20,21].
Few studies have addressed ESG implications in agriculture and forestry, despite the sector’s reliance on natural resources and its ecological sensitivity. Agroforestry enterprises operate under a different risk-return logic, where social responsibility and environmental externalities weigh more heavily in decision-making [22]. This research gap underscores the need for industry-specific ESG studies that reflect these distinct characteristics.
While these gaps exist, it is also important to recognize the growing body of evidence affirming the practical value of ESG performance. Recent studies demonstrate that ESG adoption can lead to measurable improvements in corporate innovation and efficiency outcomes. For instance, based on data from Chinese listed companies between 2009 and 2022, ESG performance was found to significantly enhance green innovation—measured by green patent applications—and improve total factor productivity by an average of 1.8% [10]. In global capital markets, ESG scores have also been shown to correlate with financial resilience, particularly in emerging economies where ESG-financial performance correlations exceed 65.4% [23]. According to the Global Sustainable Investment Review (2022), ESG-managed assets reached over USD 30 trillion, underscoring strong investor recognition of ESG’s material importance. These findings reinforce the rationale for further exploring ESG’s effect within resource-sensitive sectors such as agroforestry.
This paper aims to investigate the impact of ESG performance on the green development of listed agroforestry enterprises in China. Specifically, it measures green total factor productivity (GTFP) to assess firm-level green development, and it identifies the mechanisms through which ESG influences this process. The following three main contributions are made:
First, the paper expands the scope of ESG research by focusing on agriculture and forestry—sectors that have received limited scholarly attention despite their ecological and economic importance [24]. Unlike existing studies that emphasize financial or energy enterprises, this research highlights how ESG performance enhances GTFP through improved environmental responsibility, social engagement, and governance practices [25].
Second, this study uncovers the mechanisms through which ESG promotes green development. Beyond verifying the direct effects, it identifies three mediating channels: green innovation, resource allocation efficiency, and human capital structure. Green innovation reflects ESG’s role in fostering technological advancement; resource allocation efficiency addresses the mitigation of factor mismatches; and human capital structure captures the quality of the workforce as an enabler of ESG-driven transformation. The analysis also finds that the environmental and social pillars of ESG contribute more significantly than the governance pillar, offering nuanced insights for policymakers.
Third, the paper employs a rigorous empirical methodology, leveraging panel data from Shanghai and Shenzhen A-share listed agroforestry firms between 2013 and 2023. Fixed-effects models are used to control for firm-level heterogeneity, while instrumental variable techniques address endogeneity concerns. Robustness checks—including alternative ESG score sources (e.g., Bloomberg, SynTao Green Finance) and additional industry-year and region-year fixed effects—enhance the credibility of the findings. A comprehensive heterogeneity analysis further reveals how ESG’s effects vary by ownership structure, geographic region, and rating uncertainty.
2. Theoretical Analysis and Research Hypotheses
2.1. ESG Performance and Corporate Green Development
ESG performance—encompassing environmental, social, and governance dimensions—serves as a critical indicator of corporate sustainability and exerts multidimensional impacts on the green total factor productivity (GTFP) and sustainable development of listed agribusiness and forestry firms [1,10,26]. ESG covers corporate practices related to environmental protection (E), social responsibility (S), and governance effectiveness (G). In the context of agricultural and forestry enterprises, environmental responsibility includes resource conservation, pollution control, and ecological protection; social responsibility emphasizes harmonious relationships with communities and employees; and governance effectiveness ensures the successful implementation of green transitions through transparent decision-making and long-term strategic planning. These three dimensions collectively constitute the driving forces behind corporate green development [27].
Given the high dependence of agricultural and forestry enterprises on natural resources and their sensitivity to environmental changes, ESG practices not only enhance market competitiveness but also promote sustainable development through optimizing resource allocation, driving green innovation, and improving human capital structures [28,29,30]. On the one hand, enterprises with high ESG performance tend to adopt cleaner production technologies and precise resource management to improve resource utilization efficiency; on the other hand, they actively invest in green technology R&D to enhance green innovation capabilities. Additionally, such enterprises focus on fostering a sustainable corporate culture that attracts and retains talent with environmental awareness and skills, thereby optimizing their human capital structure. These three aspects work synergistically to provide a solid foundation for green transformation and long-term development.
ESG exerts a significant direct impact on corporate green development. In the environmental dimension, firms can enhance resource efficiency and reduce environmental costs through the adoption of clean technologies, circular economy models, and low-carbon production methods, thereby improving GTFP [31,32]. For example, reducing pesticide and fertilizer use and promoting ecological farming not only lowers environmental pollution but also enhances the green premium of products, meeting growing consumer demand for sustainable agricultural goods. In the social dimension, engagement in community development and improvement of employee welfare helps cultivate a green brand image and earns long-term stakeholder trust [33,34]. This accumulated trust increases access to green financing and policy support, such as government subsidies and tax incentives, thereby accelerating green development [32,35]. For example, China’s Ministry of Finance and Ministry of Ecology and Environment jointly launched the “Special Fund for Energy Conservation and Environmental Protection” to provide financial support to qualifying firms; the Ministry of Agriculture and Rural Affairs launched “Green, High-Quality, and Efficient Action”, which offers direct subsidies and technical services to ecological farming enterprises; and some local governments implement green tax incentives, such as income tax reductions for certified organic agricultural firms. These policies reduce the financial burden of green transition and strengthen firms’ incentives to invest in sustainability.
In the governance dimension, a robust governance framework ensures effective execution of green strategies. For example, establishing dedicated ESG committees or improving environmental information disclosure mechanisms enhances corporate transparency and accountability, thereby supporting green innovation and risk management [36,37,38]. Moreover, the inherent sustainability attributes of the agricultural and forestry sector further amplify the impact of ESG. Firms certified with ecological or organic labels can command price premiums and achieve product differentiation, gaining competitive advantages in the marketplace. Thus, ESG performance in its three dimensions directly promotes green development through distinct pathways.
Based on the above analysis, the following hypothesis is proposed:
Hypothesis 1.
ESG performance significantly promotes corporate green development.
2.2. Mechanisms Linking ESG Performance and Corporate Green Development
To explore the mechanisms by which ESG performance affects green development, it is essential to distinguish between direct and indirect effects. Direct effects refer to improvements in GTFP stemming from specific practices in environmental, social, and governance dimensions. Indirect effects arise when ESG enhances the implementation of green strategies through green innovation, resource allocation efficiency, and the optimization of human capital structure. The following sections elaborate on these mediating mechanisms.
2.2.1. ESG Performance, Green Innovation, and Corporate Green Development
Corporate green development in the agricultural and forestry sectors may be indirectly driven by ESG-oriented green innovation activities. Green innovation—encompassing both technological and managerial aspects—enhances resource efficiency, reduces ecological damage, and facilitates transitions to environmentally friendly production models [39,40]. These innovations not only contribute to sustainable operations but also strengthen competitive advantages [17,41].
The influence of ESG on green innovation can be explained across three dimensions. Environmentally, firms that prioritize ESG tend to increase R&D investment in green technologies to mitigate ecological impacts and gain market leadership [18,42]. For example, developing water-saving irrigation systems or biological pest control methods reduces environmental dependency and pollution. Socially, fulfilling social responsibilities such as employee training and community engagement enhances social capital and stakeholder collaboration, thus supporting green innovation through access to resources and partnerships [43,44,45]. Collaborations with universities on environmental technologies, for instance, facilitate the commercialization of innovations. In terms of governance, strong governance structures ensure long-term sustainability considerations in decision-making and provide institutional support for implementing green innovation projects [46,47]. For example, establishing a sustainability committee at the board level ensures that green innovation receives strategic attention and resource allocation.
Based on the above, the following hypothesis is proposed:
Hypothesis 2.
ESG performance promotes corporate green development by facilitating green innovation.
2.2.2. ESG Performance, Resource Allocation Efficiency, and Corporate Green Development
ESG may also indirectly affect green development by improving resource allocation efficiency. Enhanced resource efficiency enables firms to minimize waste and environmental impact while supporting the adoption of greener production practices [48,49]. The impact of ESG performance on resource allocation efficiency manifests in multiple ways. Environmentally, firms with strong ESG performance tend to optimize resource use—for instance, precision agriculture techniques can minimize water and fertilizer waste [50,51]. Socially, fulfilling responsibilities such as improving employee conditions and supporting community initiatives enhances workforce satisfaction and productivity, thereby indirectly optimizing resource allocation [48,52]. In governance, effective corporate governance discourages short-termism and supports sustainable decisions, preventing inefficient resource deployment [36,53,54,55]. For example, firms that establish scientific performance evaluation systems can allocate resources more rationally, prioritizing green initiatives [37,45,56]. Hence, ESG enhances internal management and operational transparency, both of which are essential for improving GTFP.
Based on the above, the following hypothesis is proposed:
Hypothesis 3.
ESG performance promotes corporate green development by improving resource allocation efficiency.
2.2.3. ESG Performance, Human Capital Structure, and Corporate Green Development
ESG may also contribute to green development by optimizing the structure of human capital. An optimized human capital structure implies a workforce with stronger environmental awareness and green skills, which is vital for the development and implementation of green technologies [57,58,59]. High-quality human capital is essential for executing green management practices and fostering sustainable growth [60,61]. The influence of ESG on human capital structure is multifaceted. Environmentally, firms with high ESG performance are more likely to attract and retain employees committed to sustainability [62,63,64]. These employees contribute to green innovation and corporate sustainability. Socially, strong performance in social responsibility—through benefits, community involvement, and employee engagement—enhances job satisfaction and loyalty, further improving human capital quality [65,66,67]. From a governance perspective, well-structured corporate governance ensures employee development and skill enhancement through training programs and career advancement pathways [68,69,70,71,72]. Some firms, for example, establish green talent development funds or implement environmental performance evaluation systems to encourage employee participation in green projects and innovation. Thus, firms with superior ESG performance are better positioned to attract, retain, and incentivize green talent, which enhances their capacity for green development [73,74,75].
Based on the above, the following hypothesis is proposed:
Hypothesis 4.
ESG performance promotes corporate green development by optimizing the human capital structure.
Our theoretical framework is clearly shown in Figure 1.
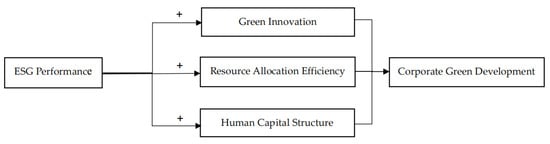
Figure 1.
Theoretical framework.
3. Research Design
3.1. Sample and Data
This study selects agricultural and forestry enterprises listed on the Shanghai and Shenzhen A-share markets from 2013 to 2023 as the research sample. The relevant corporate financial data and industry-specific indicators are primarily sourced from the China Stock Market & Accounting Research (CSMAR) Database. Sample selection is based on the revised 2021 industry classification system by Shenyin & Wanguo (SW), which is widely recognized in Chinese financial and industrial research. According to this classification, agriculture, forestry, animal husbandry, and fishery are categorized under a unified primary industry sector due to their common dependence on natural resources and ecological interactions. Accordingly, this study includes eight subsectors within this broad category: planting, aquaculture, forest cultivation, feed processing, agricultural by-product handling, livestock and poultry farming, veterinary medicine manufacturing, and agricultural services. In addition, considering the pivotal role of agricultural inputs in modern agricultural practices, pesticide and fertilizer producers from the chemical industry are also incorporated into the analytical framework. Although these companies are conventionally classified under the chemical sector, their products are extensively applied throughout the agricultural production chain and play a significant role in advancing sustainable and green agricultural development.
To ensure data quality, this study processed the raw data as follows: (1) retained only firms with normal listing status and excluded samples under special treatment (ST/*ST), such as those experiencing continuous financial losses, insolvency, or other major operational risks as designated by stock exchanges; (2) deleted observations with severe missing values in core variables; (3) refined a limited amount of missing data using linear interpolation, which provides a simple and widely accepted method for estimating missing intermediate values in time series without introducing external assumptions; (4) applied 1st and 99th percentile winsorization to all continuous variables to mitigate the influence of extreme outliers.
In applying the directional distance function with slack variables to measure the Malmquist–Luenberger (ML) productivity index, this study establishes a comprehensive variable system [76,77]. The input factors include labor, capital, and energy. Labor input is represented by the total number of employees, while capital input is measured using the stock of fixed assets, which is estimated through the perpetual inventory method. Energy input is calculated by multiplying the total electricity consumption in the region where the enterprise is located by the ratio of the enterprise’s employees to the total local employed population. The desired output is reflected in the enterprise’s main business revenue, serving as an indicator of economic performance. As for undesired outputs, this study considers three major pollutants typically produced during industrial operations: sulfur dioxide, wastewater, and soot and dust emissions. These pollution indicators are adjusted based on the total emissions of the city where the enterprise operates and the ratio of the enterprise’s employees to the local employment population, thereby approximating the enterprise’s contribution to regional environmental impact.
3.2. Variable Definitions
3.2.1. Dependent Variable
In this study, the green total factor productivity (GTFP) of enterprises is selected as a core indicator to measure the environmental performance of enterprises. Based on the slack variable measurement (SBM) model that includes non-consensual output, it is measured by the Malmquist–Luenberger productivity index (ML index). Specifically, 2013 is taken as the base year (ML = 1), and GTFP in subsequent years is derived by cumulative multiplication of the ML index. Simultaneous measurements also include the Green Technology Efficiency Improvement Index (GEFFCH) and the Green Technology Innovation Index (GTECH), which help further distinguish the contributions of efficiency improvement and innovation activities to green productivity. The Green Technology Efficiency Improvement Index (GEFFCH) indicates the extent to which improvements in technological efficiency contribute to green total factor productivity, reflecting mainly changes in firms’ institutional and managerial innovations. The Green Technology Innovation Index (GTECH) indicates the extent to which shifts in the production frontier have contributed to productivity, reflecting the progress made by firms in utilizing new green technologies and increasing technological investment. This approach is widely adopted in the existing green productivity literature [78,79], ensuring the comparability and robustness of the results.
3.2.2. Independent Variable
The key independent variable is the ESG rating of enterprises. ESG performance is widely regarded as an important factor influencing firms’ long-term sustainability and green productivity [80,81]. ESG initiatives can promote the efficient use of resources, reduce environmental risks, and improve stakeholder trust, all of which contribute to higher GTFP. The CSI ESG evaluation system is selected for its comprehensiveness and localization. It includes three dimensions, 16 categories, and 44 sub-indicators, covering more than 300 items of basic data. Notably, it incorporates localized elements such as regulatory penalty records and information disclosure quality, enhancing its relevance for the Chinese context. The CSI ratings have been applied in recent studies on ESG and firm performance in China [82,83], supporting its validity as a proxy. The ESG and decomposed ESG (E, S, G) data are assigned using the assignment method (i.e., assigning values from 1 to 9 according to the rating results from low to high, respectively) to the ESG and individual E, S, G rating results (AAA-C) of the CSI. To ensure robustness, ESG scores from other mainstream agencies will be used in additional analyses.
3.2.3. Control Variables
To control for firm-level heterogeneity, the model introduces the following control variables based on the existing literature: (1) equity concentration (natural log of the shareholding of the largest shareholder): affects corporate governance and decision-making, which may influence the efficiency of green investments; (2) profitability level (return on total assets ROA): more profitable firms may have greater resources and incentives to invest in green technology; (3) financial leverage (gearing ratio): high leverage may constrain environmental investments due to debt pressure; (4) liquidity level (cash-to-assets ratio): higher liquidity can ease financing constraints for green innovation; (5) valuation metrics (book-to-market ratio): firms with high growth potential (low B/M) may exhibit different ESG behaviors due to market expectations; and (6) the nature of the property rights (dummy variable, with state-owned enterprises taking the value of 1): SOEs may respond differently to environmental policies due to political incentives [84,85].
Detailed definitions of these variables are presented in Table 1.

Table 1.
Definitions of variables.
3.3. Models
3.3.1. Benchmark Model
To examine H1, the following model is used:
where the subscripts and denote firm and year, respectively. represents the green total factor productivity of firm in year , serving as a proxy for the firm’s green development level. is the ESG score of firm in year , reflecting its comprehensive environmental, social, and governance performance in that year, and this study adopts a nine-level scale (1–9 points) to quantify the ESG rating results. is a series of control variables, mainly representing the firm’s financial and equity characteristics. represents year fixed effects; represents individual fixed effects; is the error term; is the intercept term; and and are parameters to be estimated.
3.3.2. Mediating Effect Models
To examine H2–4, Model (2) is constructed as follow:
represents the mediating variable, which is the number of green patents, the factor mismatch index, and the human capital quality index. Other variables and model structure are consistent with Model (1).
3.4. Statistical Analysis
Table 2 presents the descriptive statistics for the core variables. The mean value of green total factor productivity—the dependent variable—is 1.039, with a standard deviation of 0.088, suggesting that while some fluctuations exist among sample firms, their green productivity levels remain relatively stable overall. The independent variable, ESG, has a mean of 3.758 and a standard deviation of 1.017. As the standard deviation accounts for about 27% of the mean, this indicates a moderate level of variation in ESG performance across companies.
Table 2.
Descriptive statistics of variables.
Regarding the control variables, the mean equity concentration is 31.688, with a standard deviation of 13.906, implying that while most firms have relatively concentrated ownership structures, the degree of concentration varies significantly. The average return on total assets is 0.018, with a standard deviation of 0.081, indicating generally low and volatile profitability. The average gearing ratio is 0.462, with a standard deviation of 0.202, reflecting a moderate debt level but considerable variation in financial leverage among firms. The mean cash asset ratio is 0.119, and the standard deviation is 0.084, suggesting that firms, on average, hold low levels of liquid assets, though liquidity differs markedly across companies. The book-to-market ratio averages 0.610, with a standard deviation of 0.221, pointing to a generally low market valuation among the sample firms. Lastly, the mean value of the ownership nature variable is 0.512, with a standard deviation of 0.500, indicating that about half of the sampled companies are state-owned enterprises.
Overall, the research variables demonstrate substantial heterogeneity across the sample, providing a solid empirical foundation for subsequent econometric analysis.
4. Results
4.1. Baseline Regression
Table 3 reports the results of the baseline regression examining the impact of ESG performance on green total factor productivity (GTFP) among Chinese listed companies in the agricultural and forestry sectors. The ESG coefficient is positive and statistically significant at the 1% level across all model specifications, with values ranging from 0.010 to 0.020. This consistent result confirms that firms with better ESG performance tend to achieve higher levels of green productivity, thereby supporting Hypothesis 1 and highlighting the positive role of ESG in promoting sustainable development. These findings are consistent with previous studies that highlight the positive influence of ESG practices on firm performance and sustainability outcomes [86,87].
Table 3.
Baseline regression results.
In addition to the main independent variable, several control variables are included to account for firm-level heterogeneity. Equity concentration shows a significantly negative relationship with GTFP, suggesting that firms with more concentrated ownership structures may have lower green productivity, possibly due to less emphasis on long-term environmental performance. Profitability and financial leverage display inconsistent significance levels across models, indicating that their influence on GTFP may depend on specific firm contexts. Valuation metrics show a positive and significant association in several models, implying that market-valued firms are more likely to pursue green growth. The nature of property rights appears to matter in some specifications, particularly where state-owned enterprises are more aligned with environmental objectives. Finally, the inclusion of industry and year fixed effects in Models (3) through (5) helps control for unobservable factors, and the core result regarding ESG remains robust.
Overall, the regression results provide strong support for the positive relationship between ESG performance and green productivity, and the findings remain consistent after controlling for a range of firm characteristics and fixed effects.
4.2. Endogeneity Issues
When evaluating the impact of corporate ESG performance on green total factor productivity (GTFP), potential endogeneity issues must be addressed. These primarily stem from reverse causality and omitted variable bias. On the one hand, a firm’s green development level may influence its ESG rating—for instance, firms with higher green productivity are more likely to receive favorable environmental scores, which in turn raises their overall ESG ratings. On the other hand, unobserved factors such as corporate governance capabilities, public pressure, or regional environmental policies may simultaneously affect both ESG performance and GTFP, leading to biased estimation results. To address these concerns and achieve causal inference, this study employs an instrumental variables (IVs) approach.
Specifically, we use “ESG fund holdings” as the instrumental variable for corporate ESG performance, measured by both the number of shares held and the market value of holdings. This choice satisfies the relevance condition: ESG funds typically select investment targets based on external ESG ratings or predefined investment criteria, thereby exerting significant influence on a firm’s ESG performance. Moreover, the instrument plausibly satisfies the exclusion restriction. The allocation decisions of ESG funds are largely driven by fund managers’ investment mandates and are unlikely to be directly affected by any individual firm’s production efficiency. Given that ESG funds often pursue long-term investment strategies and rarely engage in firm-level operational interventions, their holdings are unlikely to directly affect the firm’s GTFP. Therefore, ESG fund holdings are theoretically correlated with ESG performance but do not independently affect green total factor productivity, making them a suitable instrument for identifying the causal effect of ESG on green development.
Table 4 reports the results of the instrumental variable regressions. In the first-stage regression, both the number of shares held by ESG funds and the market value of these holdings exhibit a significant positive impact on firms’ ESG performance, with coefficients of 0.010 and 0.008, respectively. Both estimates are statistically significant at the 1% level. This confirms that ESG fund shareholding behavior is an effective predictor of corporate ESG performance, thereby validating the relevance of the chosen instrumental variables. Additionally, the Kleibergen–Paap LM and F statistics are well above the critical thresholds, further supporting the strong correlation between the instrumental variables and the endogenous regressor (ESG) and affirming the validity of the instruments.
Table 4.
Instrumental variable regression results.
In the second-stage regression, the coefficient of ESG on green total factor productivity (GTFP) is 0.040 and remains statistically significant at the 1% level. This coefficient is larger and more significant than that obtained from the baseline regression, indicating that the positive effect of ESG performance on green productivity becomes more pronounced once the endogeneity concerns are addressed. These findings further reinforce the conclusion that firms with stronger ESG performance tend to exhibit superior green productivity outcomes.
4.3. Robustness Test
4.3.1. Replacement of Independent Variables
To ensure the robustness of the empirical results, we replace the original ESG independent variables with ESG data from alternative sources.
First, Bloomberg’s ESG score is employed as the core independent variable. As shown in column (1) of Table 5, the coefficient of ESG remains significantly positive at the 1% level (0.002), indicating that the positive effect of ESG performance on green total factor productivity (GTFP) is robust to the use of different scoring systems. This confirms the general applicability and credibility of the baseline regression results.
Table 5.
Robustness test.
Furthermore, we incorporate the ESG rating data of SynTao Green Finance as an exogenous shock variable to assess the consistency of the findings from a quasi-natural experimental perspective. Specifically, we construct a dummy variable that equals 1 if a firm is included in SynTao’s ESG rating system in a given year and 0 otherwise. As reported in column (2), the ESG coefficient reaches 0.009 and remains significantly positive at the 1% level. This further substantiates the positive role of ESG engagement in promoting green development, from a different analytical angle.
In summary, the use of both Bloomberg and SynTao Green Finance ESG data confirms that this study’s conclusions are not sensitive to a particular ESG rating system, thus reinforcing the robustness and reliability of the results.
4.3.2. Replacement of Fixed Effects
To further verify the robustness of the baseline results, we replace the conventional fixed effects with more granular controls. Specifically, column (3) of Table 5 incorporates industry-year fixed effects, which account for temporal shocks that are specific to individual industries. This control is essential because certain segments of the agricultural and forestry sectors may experience year-specific developments—such as policy incentives or technological innovations—that significantly influence green total factor productivity (GTFP). By controlling for these industry-year variations, the model more precisely isolates the impact of ESG performance on GTFP. The regression results show that the coefficient on ESG remains significantly positive at the 1% level (0.002), reaffirming the positive association between ESG engagement and green productivity, even after accounting for industry-year heterogeneity.
In column (4), province-year fixed effects are introduced to control for regional dynamics that may vary across time. These include differences in provincial environmental regulations, economic development levels, or natural resource endowments, which could influence firms’ green productivity. For instance, some provinces may implement stricter environmental policies in certain years, thereby accelerating green development at the local level. By incorporating province-year fixed effects, we effectively control for such spatiotemporal variations. The results indicate that the ESG coefficient increases to 0.004 and remains statistically significant at the 1% level, highlighting the persistent positive impact of ESG performance on GTFP, independent of regional and temporal confounding factors.
In sum, the robustness checks based on alternative fixed effects specifications provide compelling evidence that the positive relationship between ESG and green total factor productivity is not driven by unobserved industry or regional trends. These findings underscore the consistency and generalizability of the baseline regression results across different analytical dimensions.
4.4. Heterogeneity Analysis
4.4.1. Heterogeneity by Firm Ownership
To investigate whether the impact of ESG performance on green development varies by ownership structure, the sample is divided into state-owned enterprises (SOEs) and non-state-owned enterprises (non-SOEs). Columns (1) and (2) of Table 6 present the regression results for each group.
Table 6.
Heterogeneity analysis.
For SOEs, the ESG coefficient is 0.004 and is statistically significant at the 1% level, indicating that ESG practices play a more prominent role in promoting green total factor productivity (GTFP). This enhanced effect may be attributed to several factors. First, SOEs often bear policy responsibilities and are subject to stricter environmental regulations and disclosure requirements [88]. Second, they tend to benefit from more favorable policy environments and greater access to financing, enabling them to invest more effectively in green technologies and sustainable development initiatives [89].
In contrast, the ESG coefficient for non-SOEs is 0.002 and is significant only at the 5% level, suggesting a weaker but still positive impact. The relatively limited effect may be due to the market-driven nature of ESG adoption in non-SOEs and their disadvantages in accessing policy support and financial resources. As a result, the potential of ESG practices to drive green development is not fully realized in this group. This ownership-related heterogeneity is consistent with prior research suggesting that SOEs are more responsive to government directives and environmental regulations, while non-SOEs face greater market pressures and resource constraints in implementing ESG practices [90]. Other studies have also highlighted that SOEs often receive stronger policy support and enjoy easier access to green financing, enhancing their green innovation capabilities [91].
4.4.2. Heterogeneity by Geographic Location
To explore regional variation, the sample is further divided based on firm registration location into eastern and midwestern subgroups. Columns (3) and (4) of Table 6 report the results.
Firms in the eastern region exhibit a stronger positive relationship between ESG performance and GTFP, with a coefficient of 0.004 that is significant at the 1% level. This suggests that ESG engagement in the east contributes more substantially to green development outcomes. In comparison, the coefficient for firms in the central and western regions is 0.0018 and is only significant at the 10% level, indicating a comparatively weaker effect.
There are several potential reasons for the observed regional heterogeneity. Firstly, differences in resource endowment and the levels of economic development play a key role. The eastern region, characterized by its developed economy and well-established infrastructure, provides firms with a distinct advantage in accessing talent, technology, and capital. These favorable conditions facilitate the effective implementation of ESG-related initiatives, thereby promoting improvements in green total factor productivity [92]. Secondly, the innovation ecosystem in the eastern region is more advanced. Enterprises in this region typically invest more in green technological innovation and sustainable development, which enables them to transform ESG concepts into tangible productivity gains more efficiently [93]. Thirdly, stronger policy support and regulatory enforcement may also contribute. Local governments in the eastern region tend to impose stricter requirements for environmental protection and corporate social responsibility, which increases external pressure on firms to improve ESG performance—ultimately enhancing their green development outcomes [94,95]. This regional divergence aligns with the existing literature indicating that firms in the eastern region benefit from superior infrastructure, innovation ecosystems, and stricter environmental governance, which jointly contribute to stronger ESG impacts on green productivity [96]. Meanwhile, enterprises in the central and western regions often lag due to weaker institutional environments and lower levels of green finance penetration [97].
4.4.3. Heterogeneity by ESG Rating Uncertainty
Given the increasing adoption of ESG practices among firms, concerns regarding the credibility and consistency of ESG ratings have emerged, such as inconsistent evaluation criteria and lack of transparency. To examine the role of rating uncertainty, the sample is divided into two groups based on the stability of ESG scores: low uncertainty and high uncertainty. The results are presented in columns (5) and (6) of Table 6.
For firms with more stable ESG ratings, the coefficient is 0.003 and is significant at the 1% level, indicating that reliable and predictable ESG assessments are conducive to improving GTFP. However, for firms with high rating volatility, the coefficient is only 0.001 and is statistically insignificant, suggesting that uncertainty in ESG evaluation undermines the effectiveness of ESG practices in promoting green development. The Chow test confirms a significant difference between the two groups, with a coefficient gap of −0.015 (p < 0.01), further substantiating the adverse impact of rating uncertainty. This finding supports previous studies emphasizing that high ESG rating volatility reduces the reliability of ESG signals and weakens investor confidence, thereby limiting firms’ access to capital for green development [98]. Prior research has also suggested that consistent ESG assessments can enhance firms’ reputational capital and facilitate long-term investment planning [99].
This inhibitory effect may arise from several mechanisms. First, reduced investor confidence: firms with volatile ESG ratings may be perceived as less trustworthy, leading to lower investment interest and higher risk premiums, which in turn raise financing costs and constrain green innovation efforts [100,101]. Second, inefficient resource allocation: uncertain ESG ratings may prompt firms to adopt more conservative investment strategies, reducing their commitment to sustainable development projects [102]. Third, limited policy support: firms with unstable ESG ratings may struggle to access government incentives and preferential financing, unlike their more consistent counterparts, who are better positioned to secure external support for green initiatives [20,103].
5. Mechanism Analysis and Further Discussion
The benchmark regression results presented earlier have confirmed that ESG performance positively contributes to corporate green development. To further uncover the underlying mechanisms, this section explores the specific pathways through which ESG practices drive green transformation in agroforestry enterprises. In particular, the analysis focuses on three potential channels: the enhancement of green innovation, improvement in resource allocation efficiency, and optimization of human capital structure.
Furthermore, to gain a more nuanced understanding, this study decomposes both the ESG dimensions and green total factor productivity indicators for additional in-depth analysis. This decomposition allows for a clearer identification of the respective contributions of environmental, social, and governance factors, as well as a more refined assessment of the specific aspects of green productivity being influenced.
5.1. Mechanism Analysis
5.1.1. Promoting Green Innovation
Corporate ESG performance contributes to the development of more green products and services by promoting green innovation. This process enhances green total factor productivity and facilitates overall green development.
In this section, the dependent variable is corporate green innovation capability, measured by the logarithm of the total number of green invention patents granted to each firm. The key independent variable is the firm’s ESG performance level. The data for both variables are obtained from the CSMAR database and the China Research Data Service Platform (CNRDS). All other independent and control variables are defined consistently with the previous sections.
The regression results in column (1) of Table 7 show a significant positive relationship between corporate ESG performance and the number of green innovation patents. Specifically, the coefficient estimate for the ESG variable is 1.062, which is statistically significant at the 1% level. This indicates that strong ESG practices play a significant role in enhancing firms’ green technological innovation.
Table 7.
Mechanism analysis.
In terms of the underlying mechanism, firms with a strong ESG orientation tend to increase their investment in R&D for environmentally friendly products and services. Such investments lead to breakthroughs and the industrial application of clean technologies. The resulting innovation is not only reflected in the increased number of green products but also in the optimization of production processes, thereby improving the level of green development.
These findings suggest that ESG practices significantly promote green development through the mediating effect of green innovation. This has important policy implications: by encouraging firms to improve their ESG performance, governments can support the green transformation of sectors such as agriculture and forestry, contributing to the achievement of sustainable development goals. The empirical evidence presented above supports Research Hypothesis 2.
5.1.2. Optimizing the Efficiency of Resource Allocation
Corporate ESG performance can enhance transparency through improved information disclosure, which reduces information asymmetry between firms and external stakeholders. This, in turn, contributes to a more efficient allocation of key production factors, such as capital and labor, by mitigating resource mismatches. In this study, we adopt the standardized capital mismatch index and labor mismatch index as the dependent variables, calculated based on the marginal output elasticity of capital and labor. The data are drawn from the national macroeconomic database, and the model specifications follow those used in the previous literature.
As shown in columns (2) and (3) of Table 7, the regression results indicate that ESG performance is negatively and significantly associated with both capital mismatch and labor mismatch. This suggests that firms with higher ESG scores tend to exhibit lower levels of resource mismatch, pointing to a more efficient allocation of capital and labor inputs. This finding supports the view that ESG engagement not only improves external perception through disclosure but also enhances internal managerial efficiency.
The reduction in mismatch reflects the more rational and optimized use of production factors, which can facilitate green innovation and improve firms’ capacity for sustainable production. Consequently, this mechanism explains how ESG performance contributes to enhanced green total factor productivity (GTFP). These findings lend empirical support to Hypothesis 3 and highlight the role of ESG practices in promoting green transformation. Furthermore, the results provide practical implications for policymakers, suggesting that strengthening ESG-related regulations and incentives can help firms align economic and environmental objectives and promote broader green development.
5.1.3. Optimizing Human Capital Structure
Firms with strong ESG performance typically offer more competitive compensation packages, standardized career development pathways, and favorable working environments, which significantly attract highly educated talent. This, in turn, enhances green innovation capacity and green total factor productivity, promoting corporate green development.
In this study, the proportion of employees with postgraduate and higher degrees is used as the dependent variable, with data sourced from the CSMAR and WIND databases. Other independent and control variables are consistent with previous sections. According to the results in column (4) of Table 6, ESG scores have a significant positive effect on the proportion of highly educated employees, indicating that firms with better ESG performance tend to establish more attractive human resource management systems.
Mechanism analysis suggests these firms generally possess the following characteristics: (1) More competitive compensation systems. Empirical evidence shows that for each one standard deviation increase in ESG score, the average labor remuneration rises by RMB 6740 [104]. Particularly in key positions such as R&D and environmental management, wage premiums are even higher, further attracting top talent. (2) Clear and sustainable career advancement pathways. These firms typically implement standardized performance evaluations, internal promotion mechanisms, and employee training programs, including green technology and leadership development courses, providing clear and structured career development opportunities. (3) Organizational cultures oriented toward sustainability. Emphasizing social responsibility and environmental protection, such firms enhance employees’ sense of belonging and mission, attracting highly educated young talent who seek meaningful work.
These advantages create a strong “siphon effect” for high-caliber talent, and the concentration of highly educated employees produces significant knowledge spillovers, boosting firms’ environmental innovation capacity and further promoting green development. This mechanism analysis provides empirical support for the pathway by which ESG performance drives corporate green development through optimizing human capital structure, thereby confirming Hypothesis 4.
5.2. Further Analysis
This section conducts a more detailed examination by decomposing green total factor productivity (GTFP) into two distinct components, namely, the Green Technology Efficiency Improvement Index (GEFFCH) and the Green Technology Innovation Index (GTECH), in order to assess the channels through which corporate ESG performance influences GTFP. In addition, the independent variable—ESG—is also disaggregated into its three core dimensions, that is, environmental, social, and governance, to evaluate their respective impacts on corporate green development.
5.2.1. Decomposition of GTFP
As shown in Table 8, ESG performance exhibits a statistically significant and positive impact on both green technology efficiency improvement and green technology innovation.
Table 8.
The decomposition of GTFP.
From the perspective of green technology efficiency improvement, this dimension reflects improvements in firms’ environmental management systems and operational mechanisms under existing technological constraints. The empirical results suggest that firms with higher ESG performance tend to demonstrate more effective green management and optimized resource allocation. This implies that ESG practices help enterprises enhance production efficiency without requiring major technological breakthroughs—enabling more sustainable operations within the current technical framework.
In terms of green technology innovation, this dimension captures progress in environmental R&D and the application of green innovations. The results indicate that ESG performance also significantly contributes to technological advancement. Firms committed to ESG development are more likely to invest in green technology research, foster innovation systems, and develop new eco-friendly products and processes. This not only accelerates the creation and diffusion of sustainable technologies but also enhances the overall environmental performance of production activities.
In sum, the findings suggest that ESG practices promote corporate green development through a dual pathway: by simultaneously improving green technology efficiency and stimulating green technology innovation. These results further substantiate the earlier conclusion that ESG engagement is a key driver of green transformation. They also offer theoretical guidance for policymakers: improving firms’ ESG performance can enhance internal management capabilities, boost resource utilization efficiency, and foster the development and adoption of green technologies—ultimately facilitating corporate sustainability and ecological transition.
5.2.2. The Decomposition of ESG
Table 9 presents the regression results following the decomposition of ESG into its three constituent dimensions: environmental, social, and governance. The results in column (1) show that the environmental dimension has a significant positive impact on firms’ green development (coefficient = 0.002, p < 0.01). Specifically, corporate efforts in environmental protection, resource conservation, and pollution control contribute meaningfully to enhancing green development. This finding aligns with the global trend of prioritizing environmental sustainability and demonstrates that environmental investment not only helps enterprises fulfill their social responsibilities but also boosts green productivity through improvements in green technology efficiency and technological progress.
Table 9.
The decomposition of ESG.
Column (2) shows that corporate performance in the social dimension also significantly promotes green development (coefficient = 0.003, p < 0.01). Initiatives such as employee welfare, community engagement, and responsible supply chain management play a crucial role. Strong social performance enhances corporate reputation and employee satisfaction, while also optimizing human capital allocation, thereby fostering green innovation and sustainable production. This evidence further confirms the positive influence of social responsibility investments on green development outcomes.
In contrast, the results in column (3) indicate that the governance dimension has a relatively weak and statistically insignificant effect on green development (coefficient = 0.001, p = 0.173). This finding appears to diverge from the theoretical analysis, which suggests that sound governance practices can support corporate green transformation. One possible explanation is that, in the context of agricultural enterprises, governance structures tend to be relatively simple and oriented more toward ensuring operational compliance and risk control than actively promoting green innovation. As such, the governance mechanisms may not directly translate into improvements in green productivity in the short term. Additionally, governance’s impact on environmental performance may manifest more slowly over time, making its effects less evident in the current cross-sectional analysis.
In summary, the decomposition analysis reveals that the environmental and social dimensions of ESG have significant positive effects on green development, while the governance dimension exhibits a comparatively weaker influence. These insights provide a more granular understanding of the channels through which ESG performance influences green growth. Accordingly, policymakers and corporate managers are encouraged to strengthen investments in environmental and social domains to further enhance green productivity and support sustainable development goals.
6. Conclusions, Policy Proposals, and Limitations
6.1. Conclusions
This paper presents several key findings based on an in-depth analysis of the impact of ESG performance on the green development of listed companies in China’s agricultural and forestry sector.
First, the empirical results demonstrate that ESG performance has a significant positive effect on green total factor productivity (GTFP). This conclusion is further substantiated using instrumental variable methods to address endogeneity concerns.
Second, the heterogeneity analysis yields the following insights: (1) ESG performance exerts a more pronounced positive effect on green productivity in state-owned enterprises (SOEs); (2) firms located in the eastern region of China benefit more from ESG practices in terms of productivity enhancement; and (3) enterprises with lower uncertainty in ESG ratings exhibit a stronger positive correlation between ESG performance and green productivity.
Moreover, the mechanism analysis identifies the following pathways through which ESG promotes green development: (1) ESG performance significantly boosts green innovation outputs; (2) it helps reduce capital–labor mismatches; and (3) higher ESG scores are positively associated with a greater proportion of employees holding graduate degrees or above.
Finally, further analysis shows that ESG performance contributes to green development by improving green technology efficiency and accelerating green innovation. Among the three ESG dimensions, environmental and social responsibility exert significant positive effects on green productivity, whereas the impact of corporate governance is comparatively limited.
6.2. Policy Proposals
Based on the above findings, the following policy recommendations are proposed:
6.2.1. Establish a Sector-Specific ESG Evaluation System and Strengthen Disclosure Mechanisms
Given the unique ecological and operational characteristics of the agricultural and forestry sector, the existing standardized ESG frameworks—lacking industry-specific indicators—are insufficient to guide effective green transformation. The current rating systems rarely include metrics such as soil remediation, water recycling, carbon sink capacity, or biodiversity conservation, which are essential for agroforestry enterprises.
Regulatory authorities, in coordination with industry associations and third-party evaluators, should develop a dedicated ESG rating framework for the sector. This system should also include a dynamic adjustment mechanism to accommodate technological progress and changing sustainability priorities.
In parallel, ESG information disclosure should be made mandatory and standardized. Listed agroforestry firms should regularly report quantitative data on resource consumption, pollutant emissions, land use efficiency, and ecological impacts. Although sector-wide ESG reporting remains at an early stage, growing market attention to sustainability and risk disclosure suggests that improved transparency can enhance both firm credibility and financing access. A unified digital reporting platform would further support comparability and regulatory oversight.
6.2.2. Implement Differentiated Policy Incentives to Address Ownership and Regional Disparities
Significant variation exists in ESG performance across ownership types and regions. State-owned enterprises (SOEs), benefiting from stronger policy responsiveness and resource advantages, generally achieve better ESG-driven productivity outcomes. For these firms, ESG performance should be explicitly integrated into executive evaluation and supervision frameworks.
Private enterprises, particularly in central and western China, often lack sufficient resources and institutional support to effectively implement ESG practices. To address these imbalances, the following differentiated incentive mechanisms are recommended:
- (1)
- Enhanced tax deductions for R&D in green technologies;
- (2)
- Preferential interest rates and guarantees for ESG-compliant loans;
- (3)
- A regional green transformation fund to subsidize clean technology upgrades;
- (4)
- Institutional support for East–West collaboration, facilitating the transfer of ESG knowledge and management experience.
Additionally, ecological asset valuation mechanisms—such as Gross Ecosystem Product (GEP) accounting—should be expanded through pilot initiatives. These can help translate environmental value into tangible economic benefits, thus reinforcing the long-term incentives for ESG investment.
6.2.3. Strengthen Support for Green Innovation and Address ESG–Technology Bottlenecks
Empirical analysis indicates that ESG performance promotes green total factor productivity primarily through technological innovation. However, firms in the agroforestry sector often face significant barriers to R&D, including high costs, long development cycles, and uncertain outcomes.
To strengthen the innovation incentives associated with ESG investment, the following policy actions are recommended:
- (1)
- Establish specialized subsidies for green technologies, with funding prioritized for firms holding ESG ratings of B or above;
- (2)
- Promote joint research initiatives involving enterprises, universities, and research institutes in areas such as water-saving irrigation, ecological planting, and bio-based fertilizers;
- (3)
- Enhance intellectual property protection for green innovations and streamline the approval process for patents related to sustainable agriculture and forestry.
By reducing innovation bottlenecks and improving institutional support, ESG strategies can more effectively drive both environmental sustainability and technological advancement in the agroforestry sector.
6.3. Limitations
Despite its valuable contributions, this study has certain limitations, which also represent directions for future research.
First, at the data level, this study relies primarily on publicly available data from listed companies. Although the dataset spans a long period and includes a broad sample, it may not fully capture ESG practices that vary across firm size, geographic location, and business model.
Second, while the mechanism analysis proposes three pathways, a more detailed exploration of their specific operational dynamics is warranted.
Third, the practical applicability of the policy recommendations could be further enhanced. Although the current proposals provide general direction, more research is needed to develop actionable and industry-specific policy tools tailored to the realities of China’s agricultural and forestry sector.
Author Contributions
Conceptualization, A.X. and G.Y.; methodology, A.X. and G.Y.; software, A.X.; validation, A.X. and H.W.; formal analysis, A.X.; investigation, A.X.; data curation, A.X.; writing—original draft preparation, A.X.; writing—review and editing, G.Y. and H.W. supervision, H.W. All authors have read and agreed to the published version of the manuscript.
Funding
This research received no external funding.
Institutional Review Board Statement
Not applicable.
Informed Consent Statement
Not applicable.
Data Availability Statement
The data used in this study were obtained from the China Stock Market & Accounting Research (CSMAR) Database (https://data.csmar.com, accessed on 1 October 2024); the Wind Database (https://www.wind.com.cn, accessed on 1 October 2024); the CSI ESG Index Platform (https://www.csindex.com.cn, accessed on 1 October 2024); and the SynTao Green Finance Data Platform (https://www.syntaogf.com, accessed on 1 October 2024), all of which are commercial databases requiring subscription or institutional access.
Conflicts of Interest
The authors declare no conflicts of interest.
Abbreviations
The following abbreviations are used in this manuscript:
| ESG | Environmental, social, and governance |
| GTFP | Green total factor productivity |
| R&D | Research & Development |
| SOE | State-owned enterprise |
References
- Wang, Z.; Chu, E.; Hao, Y. Towards sustainable development: How does ESG performance promotes corporate green transformation. Int. Rev. Financ. Anal. 2024, 91, 102982. [Google Scholar] [CrossRef]
- Ge, P.; Liu, T.; Wu, X.; Huang, X. Heterogenous Urbanization and Agricultural Green Development Efficiency: Evidence from China. Sustainability 2023, 15, 5682. [Google Scholar] [CrossRef]
- Guo, X.; Huang, S.; Wang, Y. Influence of Agricultural Mechanization Development on Agricultural Green Transformation in Western China, Based on the ML Index and Spatial Panel Model. Math. Probl. Eng. 2020, 2020, 6351802. [Google Scholar] [CrossRef]
- Zhang, J.; Liu, Z. Study on the Impact of Corporate ESG Performance on Green Innovation Performance—Evidence from Listed Companies in China A-Shares. Sustainability 2023, 15, 14750. [Google Scholar] [CrossRef]
- Zhang, Z.; Hou, Y.; Li, Z.; Li, M. From symbolic to substantive green innovation: How does ESG ratings optimize corporate green innovation structure. Financ. Res. Lett. 2024, 63, 105401. [Google Scholar] [CrossRef]
- Asif, M.; Searcy, C.; Castka, P. ESG and Industry 5.0: The role of technologies in enhancing ESG disclosure. Technol. Forecast. Soc. Change 2023, 195, 122806. [Google Scholar] [CrossRef]
- DasGupta, R. Financial performance shortfall, ESG controversies, and ESG performance: Evidence from firms around the world. Financ. Res. Lett. 2022, 46, 102487. [Google Scholar] [CrossRef]
- Hong, M.; Tian, M.; Wang, J. Digital Inclusive Finance, Agricultural Industrial Structure Optimization and Agricultural Green Total Factor Productivity. Sustainability 2022, 14, 11450. [Google Scholar] [CrossRef]
- Shen, Z.; Wang, S.; Boussemart, J.-P.; Hao, Y. Digital transition and green growth in Chinese agriculture. Technol. Forecast. Soc. Change 2022, 181, 121742. [Google Scholar] [CrossRef]
- Tan, X.; Liu, G.; Cheng, S. How does ESG performance affect green transformation of resource-based enterprises: Evidence from Chinese listed enterprises. Resour. Policy 2024, 89, 104559. [Google Scholar] [CrossRef]
- Wu, S.; Li, Y. A Study on the Impact of Digital Transformation on Corporate ESG Performance: The Mediating Role of Green Innovation. Sustainability 2023, 15, 6568. [Google Scholar] [CrossRef]
- Liu, L.; Ren, R.; Cui, K.; Song, L. A dynamic panel threshold model analysis on heterogeneous environmental regulation, R&D investment, and enterprise green total factor productivity. Sci. Rep. 2024, 14, 5208. [Google Scholar] [CrossRef]
- Gao, D.; Zhou, X.; Mo, X.; Liu, X. Unlocking sustainable growth: Exploring the catalytic role of green finance in firms’ green total factor productivity. Environ. Sci. Pollut. Res. 2024, 31, 14762–14774. [Google Scholar] [CrossRef] [PubMed]
- Ghose, B.; Gogoi, N.; Singh, P.K.; Gope, K. Impact of corporate climate change disclosure on firm performance: Empirical evidence from an emerging economy. Sustain. Account. Manag. Policy J. 2025, 16, 389–414. [Google Scholar] [CrossRef]
- Irene Wei Kiong, T.; Azizan, N.A.; Bhaskaran, R.K.; Sukumaran, S.K. Corporate Social Performance and Firm Performance: Comparative Study among Developed and Emerging Market Firms. Sustainability 2020, 12, 26. [Google Scholar] [CrossRef]
- Liu, X.; Huang, N.; Su, W.; Zhou, H. Green innovation and corporate ESG performance: Evidence from Chinese listed companies. Int. Rev. Econ. Financ. 2024, 95, 103461. [Google Scholar] [CrossRef]
- Long, H.; Feng, G.-F.; Gong, Q.; Chang, C.-P. ESG performance and green innovation: An investigation based on quantile regression. Bus. Strat. Environ. 2023, 32, 5102–5118. [Google Scholar] [CrossRef]
- Wang, J.; Ma, M.; Dong, T.; Zhang, Z. Do ESG ratings promote corporate green innovation? A quasi-natural experiment based on SynTao Green Finance’s ESG ratings. Int. Rev. Financ. Anal. 2023, 87, 102623. [Google Scholar] [CrossRef]
- Wan, J.; Wang, Y.; Wang, Y. Promoting or Hindering: The Impact of ESG Rating Differences on Energy Enterprises’ Green Transformation-A Causal Test from Double Machine-Learning Algorithms. Energies 2025, 18, 464. [Google Scholar] [CrossRef]
- Yuan, H.; Luan, H.; Wang, X. The Impact of ESG Rating Events on Corporate Green Technology Innovation under Sustainable Development: Perspectives Based on Informal Environmental Regulation of Social Systems. Sustainability 2024, 16, 8308. [Google Scholar] [CrossRef]
- Zhang, X.; Li, W.; Ji, T.; Xie, H. The impact of ESG performance on firms’ technological innovation: Evidence from China. Front. Environ. Sci. 2024, 12, 1342420. [Google Scholar] [CrossRef]
- Palsaniya, D.R.; Kumar, S.; Das, M.M.; Kumar, T.K.; Kumar, S.; Chaudhary, M.; Chand, K.; Rai, S.K.; Ahmed, A.; Sahay, C.S.; et al. Integrated multi-enterprise agricultural system for sustaining livelihood, energy use and resource recycling: A case study from semi-arid tropics of central India. Agrofor. Syst. 2021, 95, 1619–1634. [Google Scholar] [CrossRef]
- Friede, G.; Busch, T.; Bassen, A. ESG and financial performance: Aggregated evidence from more than 2000 empirical studies. J. Sustain. Financ. Invest. 2015, 5, 210–233. [Google Scholar] [CrossRef]
- Li, T.-T.; Wang, K.; Sueyoshi, T.; Wang, D.D. ESG: Research Progress and Future Prospects. Sustainability 2021, 13, 11663. [Google Scholar] [CrossRef]
- Jiang, Q.; Li, J.; Si, H.; Su, Y. The Impact of the Digital Economy on Agricultural Green Development: Evidence from China. Agriculture 2022, 12, 1107. [Google Scholar] [CrossRef]
- Deng, X.; Li, W.; Ren, X. More sustainable, more productive: Evidence from ESG ratings and total factor productivity among listed Chinese firms. Financ. Res. Lett. 2023, 51, 103439. [Google Scholar] [CrossRef]
- Yang, C.; Zhu, C.; Albitar, K. ESG ratings and green innovation: A U-shaped journey towards sustainable development. Bus. Strat. Environ. 2024, 33, 4108–4129. [Google Scholar] [CrossRef]
- Huang, X.; Feng, C.; Qin, J.; Wang, X.; Zhang, T. Measuring China’s agricultural green total factor productivity and its drivers during 1998–2019. Sci. Total. Environ. 2022, 829, 154477. [Google Scholar] [CrossRef]
- Liu, D.; Zhu, X.; Wang, Y. China’s agricultural green total factor productivity based on carbon emission: An analysis of evolution trend and influencing factors. J. Clean. Prod. 2021, 278, 123692. [Google Scholar] [CrossRef]
- Song, Y.; Zhang, B.; Wang, J.; Kwek, K. The impact of climate change on China’s agricultural green total factor productivity. Technol. Forecast. Soc. Change 2022, 185, 122054. [Google Scholar] [CrossRef]
- Li, C.; Tang, W.; Liang, F.; Wang, Z. The impact of climate change on corporate ESG performance: The role of resource misallocation in enterprises. J. Clean. Prod. 2024, 445, 141263. [Google Scholar] [CrossRef]
- Qian, S. The effect of ESG on enterprise value under the dual carbon goals: From the perspectives of financing constraints and green innovation. Int. Rev. Econ. Financ. 2024, 93, 318–331. [Google Scholar] [CrossRef]
- Ang, R.; Shao, Z.; Liu, C.; Yang, C.; Zheng, Q. The relationship between CSR and financial performance and the moderating effect of ownership structure: Evidence from Chinese heavily polluting listed enterprises. Sustain. Prod. Consum. 2022, 30, 117–129. [Google Scholar] [CrossRef]
- Wu, G.; Sun, M.; Feng, Y. How does the new environmental protection law affect the environmental social responsibility of enterprises in Chinese heavily polluting industries? Humanit. Soc. Sci. Commun. 2024, 11, 168. [Google Scholar] [CrossRef]
- Ma, D.; He, Y.; Zeng, L. Can green finance improve the ESG performance? Evidence from green credit policy in China. Energy Econ. 2024, 137, 107772. [Google Scholar] [CrossRef]
- Elamer, A.A.; Boulhaga, M. ESG controversies and corporate performance: The moderating effect of governance mechanisms and ESG practices. Corp. Soc. Responsib. Environ. Manag. 2024, 31, 3312–3327. [Google Scholar] [CrossRef]
- Lagasio, V.; Cucari, N. Corporate governance and environmental social governance disclosure: A meta-analytical review. Corp. Soc. Responsib. Environ. Manag. 2019, 26, 701–711. [Google Scholar] [CrossRef]
- Yu, E.P.-Y.; Guo, C.Q.; Bac Van, L. Environmental, social and governance transparency and firm value. Bus. Strategy Environ. 2018, 27, 987–1004. [Google Scholar] [CrossRef]
- Wang, M.; Li, Y.; Li, J.; Wang, Z. Green process innovation, green product innovation and its economic performance improvement paths: A survey and structural model. J. Environ. Manag. 2021, 297, 113282. [Google Scholar] [CrossRef]
- Xie, X.; Huo, J.; Zou, H. Green process innovation, green product innovation, and corporate financial performance: A content analysis method. J. Bus. Res. 2019, 101, 697–706. [Google Scholar] [CrossRef]
- Yuan, B.; Cao, X. Do corporate social responsibility practices contribute to green innovation? The mediating role of green dynamic capability. Technol. Soc. 2022, 68, 101868. [Google Scholar] [CrossRef]
- Li, H.; Su, Y.; Ding, C.J.; Tian, G.G.; Wu, Z. Unveiling the green innovation paradox: Exploring the impact of carbon emission reduction on corporate green technology innovation. Technol. Forecast. Soc. Change 2024, 207, 123562. [Google Scholar] [CrossRef]
- Mbanyele, W.; Huang, H.; Li, Y.; Muchenje, L.T.; Wang, F. Corporate social responsibility and green innovation: Evidence from mandatory CSR disclosure laws. Econ. Lett. 2022, 212, 110322. [Google Scholar] [CrossRef]
- Rao, K.; Tilt, C. Board Composition and Corporate Social Responsibility: The Role of Diversity, Gender, Strategy and Decision Making. J. Bus. Ethics 2016, 138, 327–347. [Google Scholar] [CrossRef]
- Xie, J.; Nozawa, W.; Yagi, M.; Fujii, H.; Managi, S. Do environmental, social, and governance activities improve corporate financial performance? Bus. Strategy Environ. 2019, 28, 286–300. [Google Scholar] [CrossRef]
- Li, D.; Zhao, Y.; Zhang, L.; Chen, X.; Cao, C. Impact of quality management on green innovation. J. Clean. Prod. 2018, 170, 462–470. [Google Scholar] [CrossRef]
- Peng, H.; Shen, N.; Ying, H.; Wang, Q. Can environmental regulation directly promote green innovation behavior?—Based on situation of industrial agglomeration. J. Clean. Prod. 2021, 314, 128044. [Google Scholar] [CrossRef]
- Jiang, W.; Li, J. Digital transformation and its effect on resource allocation efficiency and productivity in Chinese corporations. Technol. Soc. 2024, 78, 102638. [Google Scholar] [CrossRef]
- Wang, B.; Yu, M.; Zhu, Y.; Bao, P. Unveiling the driving factors of carbon emissions from industrial resource allocation in China: A spatial econometric perspective. Energy Policy 2021, 158, 112557. [Google Scholar] [CrossRef]
- Yang, X.; Li, Z.; Qiu, Z.; Wang, J.; Liu, B. ESG performance and corporate technology innovation: Evidence from China. Technol. Forecast. Soc. Change 2024, 206, 123520. [Google Scholar] [CrossRef]
- Zhang, F.; Lai, X.; Guo, C. ESG disclosure and investment-financing maturity mismatch: Evidence from China. Res. Int. Bus. Financ. 2024, 70, 102312. [Google Scholar] [CrossRef]
- Wang, S.; Zhao, D.; Chen, H. Government corruption, resource misallocation, and ecological efficiency. Energy Econ. 2020, 85, 104573. [Google Scholar] [CrossRef]
- Aguilera, R.V.; Aragon-Correa, J.A.; Marano, V.; Tashman, P.A. The Corporate Governance of Environmental Sustainability: A Review and Proposal for More Integrated Research. J. Manag. 2021, 47, 1468–1497. [Google Scholar] [CrossRef]
- Armstrong, C.S.; Blouin, J.L.; Jagolinzer, A.D.; Larcker, D.F. Corporate governance, incentives, and tax avoidance. J. Account. Econ. 2015, 60, 1–17. [Google Scholar] [CrossRef]
- Jiang, F.; Kim, K.A. Corporate governance in China: A modern perspective. J. Corp. Financ. 2015, 32, 190–216. [Google Scholar] [CrossRef]
- Lau, C.; Lu, Y.; Liang, Q. Corporate Social Responsibility in China: A Corporate Governance Approach. J. Bus. Ethics 2016, 136, 73–87. [Google Scholar] [CrossRef]
- Payab, A.H.; Kautish, P.; Sharma, R.; Siddiqui, A.; Mehta, A.; Siddiqui, M. Does human capital complement sustainable development goals? Evidence from leading carbon emitter countries. Util. Policy 2023, 81, 101509. [Google Scholar] [CrossRef]
- Teixeira, A.A.C.; Queiros, A.S.S. Economic growth, human capital and structural change: A dynamic panel data analysis. Res. Policy 2016, 45, 1636–1648. [Google Scholar] [CrossRef]
- Wang, M.; Xu, M.; Ma, S. The effect of the spatial heterogeneity of human capital structure on regional green total factor productivity. Struct. Change Econ. Dyn. 2021, 59, 427–441. [Google Scholar] [CrossRef]
- Bano, S.; Zhao, Y.; Ahmad, A.; Wang, S.; Liu, Y. Identifying the impacts of human capital on carbon emissions in Pakistan. J. Clean. Prod. 2018, 183, 1082–1092. [Google Scholar] [CrossRef]
- Yong, J.Y.; Yusliza, M.Y.; Ramayah, T.; Fawehinmi, O. Nexus between green intellectual capital and green human resource management. J. Clean. Prod. 2019, 215, 364–374. [Google Scholar] [CrossRef]
- Ahakwa, I.; Xu, Y.; Tackie, E.A. Greening human capital towards environmental quality in Ghana: Insight from the novel dynamic ARDL simulation approach. Energy Policy 2023, 176, 113514. [Google Scholar] [CrossRef]
- Chuang, S.-P.; Huang, S.-J. The Effect of Environmental Corporate Social Responsibility on Environmental Performance and Business Competitiveness: The Mediation of Green Information Technology Capital. J. Bus. Ethics 2018, 150, 991–1009. [Google Scholar] [CrossRef]
- Nisar, Q.A.; Haider, S.; Ali, F.; Jamshed, S.; Ryu, K.; Gill, S.S. Green human resource management practices and environmental performance in Malaysian green hotels: The role of green intellectual capital and pro-environmental behavior. J. Clean. Prod. 2021, 311, 127504. [Google Scholar] [CrossRef]
- Alfalih, A.A.; Hadj, T.B. Ecological impact assessment of green technological innovation under different thresholds of human capital in G20 countries. Technol. Forecast. Soc. Change 2024, 201, 123276. [Google Scholar] [CrossRef]
- Consoli, D.; Marin, G.; Marzucchi, A.; Vona, F. Do green jobs differ from non-green jobs in terms of skills and human capital? Res. Policy 2016, 45, 1046–1060. [Google Scholar] [CrossRef]
- Munawar, S.; Yousaf, H.Q.; Ahmed, M.; Rehman, S. Effects of green human resource management on green innovation through green human capital, environmental knowledge, and managerial environmental concern. J. Hosp. Tour. Manag. 2022, 52, 141–150. [Google Scholar] [CrossRef]
- Bin Saeed, B.; Afsar, B.; Hafeez, S.; Khan, I.; Tahir, M.; Afridi, M.A. Promoting employee’s proenvironmental behavior through green human resource management practices. Corp. Soc. Responsib. Environ. Manag. 2019, 26, 424–438. [Google Scholar] [CrossRef]
- Chaudhary, R. Green Human Resource Management and Employee Green Behavior: An Empirical Analysis. Corp. Soc. Responsib. Environ. Manag. 2020, 27, 630–641. [Google Scholar] [CrossRef]
- Ababneh, O.M.A. How do green HRM practices affect employees’ green behaviors? The role of employee engagement and personality attributes. J. Environ. Plan. Manag. 2021, 64, 1204–1226. [Google Scholar] [CrossRef]
- Al-Swidi, A.K.; Gelaidan, H.M.; Saleh, R.M. The joint impact of green human resource management, leadership and organizational culture on employees’ green behaviour and organisational environmental performance. J. Clean. Prod. 2021, 316, 128112. [Google Scholar] [CrossRef]
- Memon, M.A.; Salleh, R.; Mirza, M.Z.; Cheah, J.-H.; Ting, H.; Ahmad, M.S.; Tariq, A. Satisfaction matters: The relationships between HRM practices, work engagement and turnover intention. Int. J. Manpow. 2021, 42, 21–50. [Google Scholar] [CrossRef]
- Dumont, J.; Shen, J.; Deng, X. Effects of Green HRM Practices on Employee Workplace Green Behavior: The Role of Psychological Green Climate and Employee Green Values. Hum. Resour. Manag. 2017, 56, 613–627. [Google Scholar] [CrossRef]
- Hameed, Z.; Khan, I.U.; Islam, T.; Sheikh, Z.; Naeem, R.M. Do green HRM practices influence employees’ environmental performance? Int. J. Manpow. 2020, 41, 1061–1079. [Google Scholar] [CrossRef]
- Su, L.; Swanson, S.R. Perceived corporate social responsibility’s impact on the well-being and supportive green behaviors of hotel employees: The mediating role of the employee-corporate relationship. Tour. Manag. 2019, 72, 437–450. [Google Scholar] [CrossRef]
- Kumar, S. Environmentally sensitive productivity growth: A global analysis using Malmquist–Luenberger index. Ecol. Econ. 2006, 56, 280–293. [Google Scholar] [CrossRef]
- Tone, K.; Toloo, M.; Izadikhah, M. A modified slacks-based measure of efficiency in data envelopment analysis. Eur. J. Oper. Res. 2020, 287, 560–571. [Google Scholar] [CrossRef]
- Qu, Y.; Li, J.; Wang, S. Green total factor productivity measurement of industrial enterprises in Zhejiang Province, China: A DEA model with undesirable output approach. Energy Rep. 2022, 8, 307–317. [Google Scholar] [CrossRef]
- Zhao, P.; Wu, H.; Lu, Z.; Kou, J.; Du, J. Spatial differences, distributional dynamics, and driving factors of green total factor productivity in China. Front. Environ. Sci. 2022, 10, 1058612. [Google Scholar] [CrossRef]
- Gu, J. Digitalization, Spillover and Environmental, Social, and Governance Performance: Evidence From China. J. Environ. Dev. 2024, 33, 286–311. [Google Scholar] [CrossRef]
- Kumar, B.; Kumar, A.; Sassanelli, C.; Kumar, L. Exploring the role of finance in driving circular economy and sustainable business practices. J. Clean. Prod. 2025, 486, 144480. [Google Scholar] [CrossRef]
- Ren, L.; Zhong, X. Trick or Treat? The Effect of CEO Relative Pay on Corporate Social Irresponsibility. Emerg. Mark. Financ. Trade 2024, 60, 1795–1814. [Google Scholar] [CrossRef]
- Tang, S.; He, L.; Meng, L.; Liu, C. Can Corporate Site Visits Improve ESG Ratings? Asia-Pac. J. Financ. Stud. 2025, 54, 22–53. [Google Scholar] [CrossRef]
- Shi, M.; Zou, T.; Xu, J.; Wang, J. Can Carbon Emissions Trading Scheme Make Power Plants Greener? Firm-Level Evidence From China. Front. Energy Res. 2022, 10, 906033. [Google Scholar] [CrossRef]
- Zhao, Y. Carbon Emission Reduction Effects of Heterogeneous Environmental Regulation: Evidence from the Firm Level. Ecol. Chem. Eng. 2024, 31, 243–252. [Google Scholar] [CrossRef]
- Ferdous, L.T.; Rana, T.; Yeboah, R. Decoding the impact of firm-level ESG performance on financial disclosure quality. Bus. Strat. Environ. 2025, 34, 162–186. [Google Scholar] [CrossRef]
- Lee, S.-P.; Isa, M. Environmental, social and governance (ESG) practices and financial performance of Shariah-compliant companies in Malaysia. J. Islam. Account. Bus. Res. 2023, 14, 295–314. [Google Scholar] [CrossRef]
- Feng, L.; Zhang, J. Can state-owned enterprises enhance enterprise value when they shift focus to core businesses? Empirical evidence on the transfer of ‘three supplies and one industry’ in China. Appl. Econ. 2024, 56, 1595–1609. [Google Scholar] [CrossRef]
- Zhang, Z.; Feng, Y.; Zhou, H.; Chen, L.; Liu, Y. The Impact of Climate Policy Uncertainty on the ESG Performance of Enterprises. Systems 2024, 12, 495. [Google Scholar] [CrossRef]
- Zhao, H.; Wang, D.; Zhang, Z.; Hao, X. Does the Classified Reform of Chinese State-Owned Enterprises Alleviate Environmental, Social and Governance Decoupling? Sustainability 2024, 16, 10622. [Google Scholar] [CrossRef]
- Huang, J.; Sun, Y.; Zhang, S. Green Technology Innovation and Corporate ESG—Evidence Based on Listed Companies in China. Sustainability 2025, 17, 1410. [Google Scholar] [CrossRef]
- Yu, G. Digital transformation, human capital upgrading, and enterprise ESG performance: Evidence from Chinese listed enterprises. Oeconomia Copernic. 2024, 15, 1465–1508. [Google Scholar] [CrossRef]
- Duan, Y.; Chen, Y.; Liu, S.; Wong, C.-S.; Yang, M.; Mu, C. The moderating effect of leadership empowerment on relational capital and firms’ innovation performance in the entrepreneurial ecosystem: Evidence from China. J. Intellect. Cap. 2023, 24, 306–336. [Google Scholar] [CrossRef]
- Hu, J. Green productivity growth and convergence in Chinese agriculture. J. Environ. Plan. Manag. 2024, 67, 1775–1804. [Google Scholar] [CrossRef]
- Yao, L.; Si, W.; Si, R. Evaluating the Effects of the ‘Pilot Zone’ Policy on China’s Agricultural Green Development. Sustainability 2024, 16, 5149. [Google Scholar] [CrossRef]
- Liu, C.; Cui, P.; Zhao, H.; Zhang, Z.; Zhu, Y.; Liu, H. Green Finance, Economic Policy Uncertainty, and Corporate ESG Performance. Sustainability 2024, 16, 10141. [Google Scholar] [CrossRef]
- Chen, G.; Han, J.; Yuan, H. Urban digital economy development, enterprise innovation, and ESG performance in China. Front. Environ. Sci. 2022, 10, 955055. [Google Scholar] [CrossRef]
- Zeng, Q.; Xu, Y.; Hao, M.; Gao, M. ESG rating disagreement, volatility, and stock returns. Financ. Res. Lett. 2025, 72, 106602. [Google Scholar] [CrossRef]
- Kim, Y.; Jang, H.; Seok, J. Uncovering the Relationship between ESG Practices and Firm Value: The Role of Reputation and Industry Sensitivity. Asia Mark. J. 2023, 25, 207–218. [Google Scholar] [CrossRef]
- Zhou, H.; Ma, Y. The implied risks caused by ESG rating divergence: A test based on the cost of equity capital. Appl. Econ. 2024, 1–18. [Google Scholar] [CrossRef]
- Wang, H.; Jiao, S.; Ge, C.; Sun, G. Corporate ESG rating divergence and excess stock returns. Energy Econ. 2024, 129, 107276. [Google Scholar] [CrossRef]
- Zhao, Y.; Gao, Y.; Hong, D. Sustainable Innovation and Economic Resilience: Deciphering ESG Ratings’ Role in Lowering Debt Financing Costs. J. Knowl. Econ. 2024, 16, 4309–4343. [Google Scholar] [CrossRef]
- Li, W.; Hu, H.; Hong, Z. Green finance policy, ESG rating, and cost of debt—Evidence from China. Int. Rev. Financ. Anal. 2024, 92, 103051. [Google Scholar] [CrossRef]
- Zhao, S.; Chen, Y. ESG rating and labor income share: Firm-level evidence. Financ. Res. Lett. 2024, 63, 105361. [Google Scholar] [CrossRef]
Disclaimer/Publisher’s Note: The statements, opinions and data contained in all publications are solely those of the individual author(s) and contributor(s) and not of MDPI and/or the editor(s). MDPI and/or the editor(s) disclaim responsibility for any injury to people or property resulting from any ideas, methods, instructions or products referred to in the content. |
© 2025 by the authors. Licensee MDPI, Basel, Switzerland. This article is an open access article distributed under the terms and conditions of the Creative Commons Attribution (CC BY) license (https://creativecommons.org/licenses/by/4.0/).