Abstract
The Industry–Finance Collaboration Pilot (IFCP) integrates governmental green guidance with digital collaboration platforms to promote non-equity-based cooperation between industrial and financial sectors. Using a Difference-in-Differences (DID) approach and a sample of A-share listed industrial firms on the Shanghai and Shenzhen Stock Exchanges from 2011 to 2023, this study examines the IFCP’s impact on corporate green innovation (GI). Results show that the IFCP increases the number of green patent applications by 7.5% on average, indicating its effect in stimulating GI. This effect operates through two main mechanisms. First, under governmental green guidance, the IFCP encourages local green fiscal subsidies, increases green investor participation, improves environmental information disclosure, and lowers agency costs. Second, through digital finance empowerment, it mitigates information asymmetry and transaction costs in financial activities, thereby reducing credit costs and enhancing firms’ access to green credit. The effect of the IFCP on GI is more pronounced in regions with stricter environmental regulation, in pollution-intensive industries, and among firms with smaller asset sizes. Further analysis indicates that the IFCP primarily stimulates tactical, low-value GI driven by compliance or opportunistic motives, rather than promoting substantive, high-quality innovation. This study provides empirical evidence and policy insights into how governmental green guidance and digital finance empowerment can jointly promote green industrial development.
1. Introduction
To better leverage the strengths of both industrial and financial capital [1,2], the Chinese government has gradually liberalized access to the financial sector while promoting industry-finance integration, primarily through equity linkages. However, this model faces persistent challenges such as agency problems, financialization, and increased operational and financial risks [3,4,5,6], with inefficient sectors—including real estate and so-called “zombie” firms—absorbing excessive financial resources.
In March 2016, to channel more financial resources into the real economy and improve allocation efficiency, the Chinese authorities launched the Action Plan for Strengthening Information Sharing to Promote Industry–Finance Collaboration. The plan introduced 22 measures across seven dimensions (see Table 1), and three successive batches of cities were later designated as Industry–Finance Collaboration Pilots (IFCPs). The IFCP facilitates collaboration between industrial and financial sectors while maintaining their institutional independence, thereby mitigating the agency and financialization risks associated with equity-based integration.
Table 1.
Main content of Industry–Finance Collaboration.
Both national and local IFCP platforms have been established and have attracted a wide range of enterprises and financial institutions. These platforms streamline financial service delivery through standardized online procedures. Government agencies also utilize the platforms to guide bank–firm matchmaking, provide corporate training, and disseminate relevant policy updates. In parallel, 24 specialized zones have been created such as advanced manufacturing, the industrial internet, and green development, enabling more targeted and efficient financial services to support new industrialization.
In the context of green development, green innovation (GI)—essential for reconciling environmental sustainability with economic growth [7,8,9]—typically involves high investment, long R&D cycles, and substantial risk [10,11]. Confounded by the dual externalities of environmental protection and knowledge spillovers, GI is particularly vulnerable to market failure, persistent financing constraints, and chronic underinvestment [12,13,14,15]. In the absence of adequate government intervention and financial support, firms often lack both the motivation and capacity to pursue GI [16,17,18,19].
The IFCP integrates governmental green guidance with digitalized industry–finance collaboration platforms, bringing together the functions of green finance and digital finance to enhance both environmental regulation and financial intermediation. In China, green finance has emerged as a core policy tool for promoting GI through environmental regulation and resource reallocation [20,21,22]. However, its effectiveness may be limited by insufficient supply and weak performance-based incentives. Digital finance, by contrast, broadens access to tailored and affordable financial services, particularly for underserved firms [23,24]. Yet without proper regulation, it may prioritize transactional efficiency over environmental outcomes.
Governmental green guidance—via fiscal spending, environmental information disclosure, and improved corporate governance—serves to direct digital financial resources toward environmental objectives, thereby encouraging GI through financial incentives and regulatory pressure [17,21,25]. At the same time, IFCP platforms facilitate the integration of digital technologies into traditional financial systems, reducing information asymmetry, transaction costs, operational expenses, and risk premiums [26,27,28]. These mechanisms jointly lower credit costs and improve financial inclusion [24,29]. Under government coordination, digital finance is further extended to support green finance, enhancing its cost efficiency and accessibility [30].
Accordingly, the IFCP influences both firms’ motivation and capacity to engage in GI, via the dual channels of governmental green guidance and digital finance empowerment. This study examines the effect of the IFCP on GI and finds that, while the policy does stimulate GI, the response is primarily driven by compliance or opportunistic motives—such as securing government subsidies and easing access to external financing—resulting in an increase in tactical, low-value GI rather than substantive, high-quality GI.
This study contributes to the literature by analyzing the joint effectiveness of governmental green guidance and digital finance empowerment in advancing GI. While prior research has typically examined green finance or digital finance in isolation [17,19,25,31,32,33,34], few studies have considered the institutional–technological interaction between them. In addition, this study addresses endogeneity concerns to some degree: the IFCP represents a non-equity-based collaboration model and constitutes an exogenous policy shock. The designation of pilot cities is independent of firm-level characteristics and encompasses a wide range of regions and city sizes, supporting the exogeneity assumption in empirical identification.
The remainder of this paper is structured as follows: Section 2 reviews the literature and develops the hypothesis; Section 3 outlines the empirical strategy and data; Section 4 presents the main findings and robustness checks; Section 5 explores the mechanisms, heterogeneity, and motivation; and Section 6 concludes with policy implications and future research directions.
2. Literature Review and Hypothesis Development
2.1. Literature Review
2.1.1. Green Finance
Green finance refers to financial instruments and services aimed at directing capital toward environmentally sustainable projects, including green credit, green bonds, green insurance, and carbon finance [35]. Prior research has shown that green finance influences firms’ sustainability practices by combining environmental regulation with the reallocation of financial resources. For example, the enforcement of China’s Green Credit Guidelines, through credit constraints, has compelled heavily polluting firms to enhance their efforts in GI [25], while also facilitating loan financing for GI projects [21]. Government subsidies can offset R&D expenditures and emissions control costs associated with GI. By relaxing financing constraints, increasing firms’ willingness to engage in R&D, and improving resource allocation efficiency, these subsidies serve as an important policy tool to stimulate corporate GI [17]. Zhao et al. (2024) construct a provincial green finance index in China and find that green finance contributes to carbon emission reductions through financial support, innovation incentives, and external regulatory pressure [36].
Green finance not only provides financial incentives but also contributes to a reputational environment conducive to continuous GI. On one hand, engaging in GI—such as developing clean technologies, reducing emissions, or adopting sustainable production processes—signals a firm’s commitment to environmental responsibility, thereby enhancing its environmental reputation [7,37]. This improved reputation increases stakeholder trust, strengthens legitimacy, and attracts green investors, customers, and regulatory support [38]. On the other hand, a strong environmental reputation incentivizes firms to sustain or enhance their innovation performance, due to reputational pressure, heightened stakeholder expectations, and increased access to green finance [19,39]. Moreover, environmental disclosure acts as a key transmission mechanism: high-quality, transparent reporting fosters a positive reputation, which in turn enhances GI performance [40]. Overall, this bidirectional relationship forms a virtuous cycle wherein environmental reputation acts as both a motivator for and an outcome of green innovation.
As green finance continues to evolve, identifying green firms, projects, and financial products has become increasingly difficult. The complexity of GI exacerbates information asymmetry and increases transaction costs in both pre-loan assessment and post-loan monitoring [34]. These challenges—coupled with the financial sector’s risk aversion and short-term orientation—have significantly restricted firms’ access to green finance [41,42,43,44]. According to the dual externality theory, GI suffers from both technological spillovers and environmental externalities, leading to market failures that inhibit private investment and reinforce persistent financing constraints [12,13,14,15]. While the operational logic of green finance largely mirrors that of traditional finance, its environmental purpose serves as the core distinction [35]. However, the environmental objective introduces higher uncertainty and longer time horizons, which—under the institutional logic of traditional finance—often conflict with risk aversion and short-term performance incentives, thereby constraining the supply of green finance. Access to green finance is still limited, particularly for small and medium-sized enterprises (SMEs) [43], making it difficult to address the chronic underinvestment in GI [45].
2.1.2. Digital Finance
Advancements in digital technologies—such as big data, cloud computing, artificial intelligence (AI), and blockchain—have accelerated the development of digital finance, reshaping the structure and operation of the traditional financial system. Nassiry (2018) suggests that digital finance can help overcome the “financing bottlenecks” and “trust barriers” frequently observed in green finance [30] by reducing information asymmetry, lowering transaction costs, and improving financial inclusion.
Digital finance addresses information asymmetry and reduces transaction costs. For instance, big data and AI enable real-time monitoring and in-depth analysis of client behavior, while blockchain ensures transparent and tamper-proof transaction records, thereby mitigating fraud and information opacity [27,28]. The decentralized architecture of blockchain also lowers intermediary fees in cross-border transactions, enhancing transparency and operational efficiency [46,47]. Cloud computing strengthens connectivity between financial institutions and their clients, reducing dependence on physical infrastructure and enabling low-cost, scalable financial services [24]. Additionally, the widespread adoption of mobile payments and digital platforms facilitates efficient, low-cost financial transactions by reducing service fees and time-related costs in traditional finance [48].
By offering innovative products and optimized risk assessment tools, digital finance lowers barriers to financial access and expands financial inclusion. Instruments such as microloans, crowdfunding, and digital insurance, along with mobile-based services, provide flexible and accessible financing channels for underserved SMEs and individuals in remote regions [49]. Big data and AI also enhance financial institutions’ ability to assess, identify, and manage credit risks, enabling more accurate lending decisions and reducing systemic risk exposure [27,28].
A growing body of literature shows that digital finance can ease information asymmetry and financial constraints [31,32,34,50], stimulate R&D investment [51], and reduce greenwashing [34], thereby supporting GI. However, most studies overlook the institutional context in which digital finance operates. Without adequate regulation or policy coordination, digital finance—guided by efficiency-first logic—may favor commercially viable but environmentally unsustainable activities, undermining the potential of digital finance to serve green development. This highlights the importance of aligning technological empowerment with institutional incentives to maximize the environmental effectiveness of digital finance.
2.2. Hypothesis Development
The IFCP integrates features of both green finance and digital finance through the dual channels of governmental green guidance and digital collaboration platforms. On the one hand, green guidance facilitates the allocation of financial resources toward environmentally beneficial projects, enabling green finance to perform its regulatory and incentive roles in promoting GI [21,25]. On the other hand, digital platforms enhance the supply and efficiency of green finance through technological empowerment, allowing digital finance to better fulfill its financing function in support of GI [32,34].
2.2.1. Governmental Green Guidance
Green innovation entails substantial knowledge spillovers and environmental externalities, leading to market failures and chronic underinvestment that require policy intervention [15,17]. Environmental protection is one of the priorities of the IFCP. For example, the policy encourages financial institutions to develop green credit instruments (e.g., energy-efficiency loans, carbon-emission-pledged financing) tailored to industrial characteristics, and to implement dynamic credit strategies (e.g., expansion, tightening, or withdrawal) based on firms’ environmental performance. Under the IFCP’s green focus, projects with green attributes are more likely to be included in government priority financing lists. The IFCP also encourages local governments to adopt innovative fiscal tools—such as using public funds as catalytic capital—to support bank–firm matchmaking and project implementation.
These efforts not only provide direct compensation for GI through green fiscal funds, but also attract value-driven institutional investors via signaling effects. On the one hand, subsidies help offset innovation costs and financial shortfalls in firms’ GI, enabling them to overcome financial bottlenecks; on the other hand, they serve as credible signals of government endorsement, boosting investor confidence and improving firms’ access to stable R&D financing [17].
Simultaneously, the IFCP emphasizes strengthening corporate governance through environmental information disclosure. According to agency theory, the separation of ownership and control may cause managers to avoid high-risk, long-term green innovation projects and instead favor short-term, profit-oriented investments [52]. Additionally, in pursuit of personal interests, managers may engage in inefficient expenditures or symbolic initiatives, diverting resources from green R&D [39]. Environmental disclosure signals a firm’s commitment to environmental and social responsibility, attracting external stakeholders who provide monitoring and governance, thereby helping to mitigate agency problems [38,40,53].
2.2.2. Digital Finance Empowerment
The complexity of GI heightens information asymmetry between firms and financial institutions [34], increasing the costs of loan screening and post-lending monitoring, which discourages banks from extending green credit [42]. These elevated transaction costs are often passed on to borrowers, raising the cost of credit for firms [54]. In response to incomplete or imperfect information, financial institutions may also increase risk premiums, further exacerbating credit costs and financing constraints [55,56,57].
The digital industry–finance collaboration platform, supported by technologies such as AI, blockchain, and cloud computing, serves as critical infrastructure for implementing IFCP initiatives. It enables firms to reduce credit costs and improve access to financing for GI by mitigating information asymmetry, lowering transaction costs, enhancing risk assessment, and diversifying financial product offerings.
First, it standardizes the financing process—submission of financing needs, intelligent matching, financial response, agreement, or exit—thereby streamlining service delivery. The digital interface facilitates real-time information exchange and financial transactions between firms and financial institutions [46,47], reduces information barriers [24], and lowers operational expenses and service fees for financial institutions [26], as well as offline transaction costs for firms (e.g., transportation, communication, and compliance costs for seeking loans) [54].
Second, the online process supports intelligent assessment and automated matching, assisting financial institutions in identifying client risks and optimizing credit decisions [27,28]. In addition, the platform provides access to real-time databases and technical support, enabling timely credit screening, accurate risk identification and pricing, as well as customized financial product innovation [24,47,58,59]. For example, the decentralized and tamper-proof features of blockchain facilitate secure identity authentication, smart contract execution, personalized financial product design, and compliance management. These functions reduce credit risk and improve transaction transparency throughout the lending process [47]. As of now, the national platform has integrated 346,500 firms, nearly 3000 financial institutions, 159 government agencies, and over 700 financial products. These technological spillovers improve credit access and reduce costs for firms [24,29].
Under governmental green guidance of the IFCP, digital finance functions on the platform are extended to green finance. For example, the “Green Development” specialized zone on the national platform provides targeted green financial services. This strengthens both the supply and efficiency of green finance, enabling firms to obtain more affordable green credit [30].
Overall, the IFCP enhances both firms’ motivation and financing capacity to pursue GI by combining governmental green guidance with digital finance empowerment. Accordingly, the following hypothesis is proposed:
H1:
The IFCP stimulates GI among firms in pilot regions.
Figure 1 outlines the logic of hypothesis development.
Figure 1.
Theoretical framework underlying the hypothesis.
3. Research Design
3.1. Model Setup
The Chinese government has designated three successive batches of cities for the IFCP:
- First batch of 37 cities announced on 29 December 2016;
- Second batch of 51 cities announced on 16 December 2020;
- Third batch of 66 cities announced on 14 June 2024.
Some pilot cities later withdrew from the IFCP. As of now, only 13 cities from the first batch have continuously remained in the pilot. These cities include not only economically developed and technologically advanced first-tier cities but also a diverse mix of large, medium, and small cities across the eastern, central, and western regions, demonstrating strong representativeness.
Mid-term withdrawal from the IFCP may introduce bias in estimating policy effects. Although these cities were initially included in the pilot and their firms may have received early policy support, the termination or poor implementation of the policy likely weakened or interrupted subsequent incentives. As a result, the intensity of policy treatment becomes heterogeneous across time and space. If firms in these cities are continuously classified as treated units, the average treatment effect may be underestimated, or the true impact of the IFCP in stably implemented areas may be masked.
To ensure the accuracy and identifiability of the estimation, this study treated the implementation of the IFCP in the initial pilot cities as a quasi-natural experiment and excluded firms located in cities that withdrew from the pilot. To estimate the net effect of the IFCP on GI, this study constructed a Difference-in-Differences (DID) model with firm fixed effects and year fixed effects. Firm fixed effects control for time-invariant heterogeneity, and time fixed effects capture temporal variations across entities. The baseline specification is as follows:
where the dependent variable LnGrePata denotes the level of GI for firm i in year t. TP is a binary variable indicating whether the firm i is located in a region implementing the IFCP in year t. Given the short-term policy lag, TP is lagged by one period. ∑Controls represents a vector of control variables, all lagged by one period to mitigate endogeneity concerns. μi captures firm fixed effects, τt denotes time fixed effects, and εi,t is the error term. α0 is the constant term, and α1 is the corresponding regression coefficient, representing the marginal effect of the IFCP on GI.
LnGrePatai,t = α0 + α1TPi,t−1 + ∑Controlsi,t−1 + μi + τt + εi,t,
3.2. Variables and Data
3.2.1. Variables and Measurement
- (1)
- Dependent Variable
Following the prevailing approach [19,25], LnGrePata was defined as the natural logarithm of the number of green patent applications, including both green invention patents and green utility model patents. Green patents were identified based on the International Patent Classification (IPC) Green Inventory.
- (2)
- Core Explanatory Variable
Two binary variables—Treat and Post—based on firm location and year were constructed, and their interaction term TP was defined as follows: TPi,t = Treati × Postt. Here, Treat is a firm-level dummy variable equal to 1 if firm i is located in one of the non-withdrawing initial pilot cities (treatment group), and 0 otherwise (control group). Post is a time dummy equal to 1 for years after the IFCP implementation, and 0 otherwise. Since the initial pilot cities were designated on 29 December 2016 and the fiscal year for Chinese listed firms ends on 31 December 2017, this was set as the start of the policy implementation period. Therefore, Post = 1 for 2017 and subsequent years, and 0 for prior years in the treatment group. For the control group, Post remains 0 in all years. The classical DID model includes both Treat and Post. This study replaced them with firm fixed effects (μi) and year fixed effects (τt) to control for unobservable firm-specific heterogeneity and time-specific shocks.
- (3)
- Control Variables
Drawing on previous studies on the determinants of GI [25,32,60,61], a range of firm-level and regional-level control variables were included. Variable definitions and measurement details are provided in Table 2.
Table 2.
Definition of variables.
3.2.2. Data and Sample
- (1)
- Data Sources
Information on IFCP cities was primarily obtained from the official websites of the Ministry of Industry and Information Technology (MIIT), the Ministry of Finance (MOF), the People’s Bank of China (PBOC), and the China Banking and Insurance Regulatory Commission (CBIRC). Patent data were collected from the China National Intellectual Property Administration (CNIPA) and matched to listed industrial firms in the China Stock Market & Accounting Research (CSMAR) database based on firm name and application year. The dataset included application numbers, filing dates, IPCs, and applicant names and addresses. Given their clear classification and high measurability, green patent applications served as a proxy for firms’ GI. Control variable data were sourced from the CSMAR database.
- (2)
- Sample Selection
Given that the IFCP was designed to promote steady growth, structural transformation, and industrial efficiency, the study focused on A-share listed industrial firms on the Shanghai Stock Exchange (SSE) and Shenzhen Stock Exchange (SZSE) during 2010–2023. Since the core explanatory and control variables were lagged by one year, the final sample period covered 2011–2023. The sample was refined according to the following criteria: (i) firms that migrated into or out of the non-withdrawing initial pilot cities during the pilot period were excluded; (ii) observations with missing values were excluded; (iii) firms with insolvency risk (i.e., leverage ratio ≥ 1) were excluded. The final sample comprised 14,013 firm-year observations from 1809 listed industrial firms. All continuous variables were winsorized at the 1st and 99th percentiles to reduce the influence of outliers.
4. Empirical Results
4.1. Descriptive Statistics
Table 3 presents the descriptive statistics for the sample. The mean value of LnGrePata is 0.5, with a standard deviation of 0.899, a minimum of 0, and a maximum of 3.892. The mean value of Treat is 0.201, indicating that 20.1% of the firms in the sample are in the treatment group—i.e., located in non-withdrawing initial pilot cities.
Table 3.
Descriptive statistics.
4.2. Baseline Regression
The baseline results are presented in Table 4. In Column (1), control variables excluded, the coefficient of the core explanatory variable is 0.066 and statistically significant at the 1% level. In Column (2), after including firm-level and region-level control variables, the coefficient increases slightly to 0.075 and remains significant at the 1% level.
Table 4.
Baseline results.
These findings indicate that, following the implementation of the IFCP, firms in the non-withdrawing initial pilot cities experience an average increase of 7.5% in the number of green patent applications. This result supports the hypothesis that the IFCP stimulates GI among firms in pilot regions.
4.3. Robustness Test
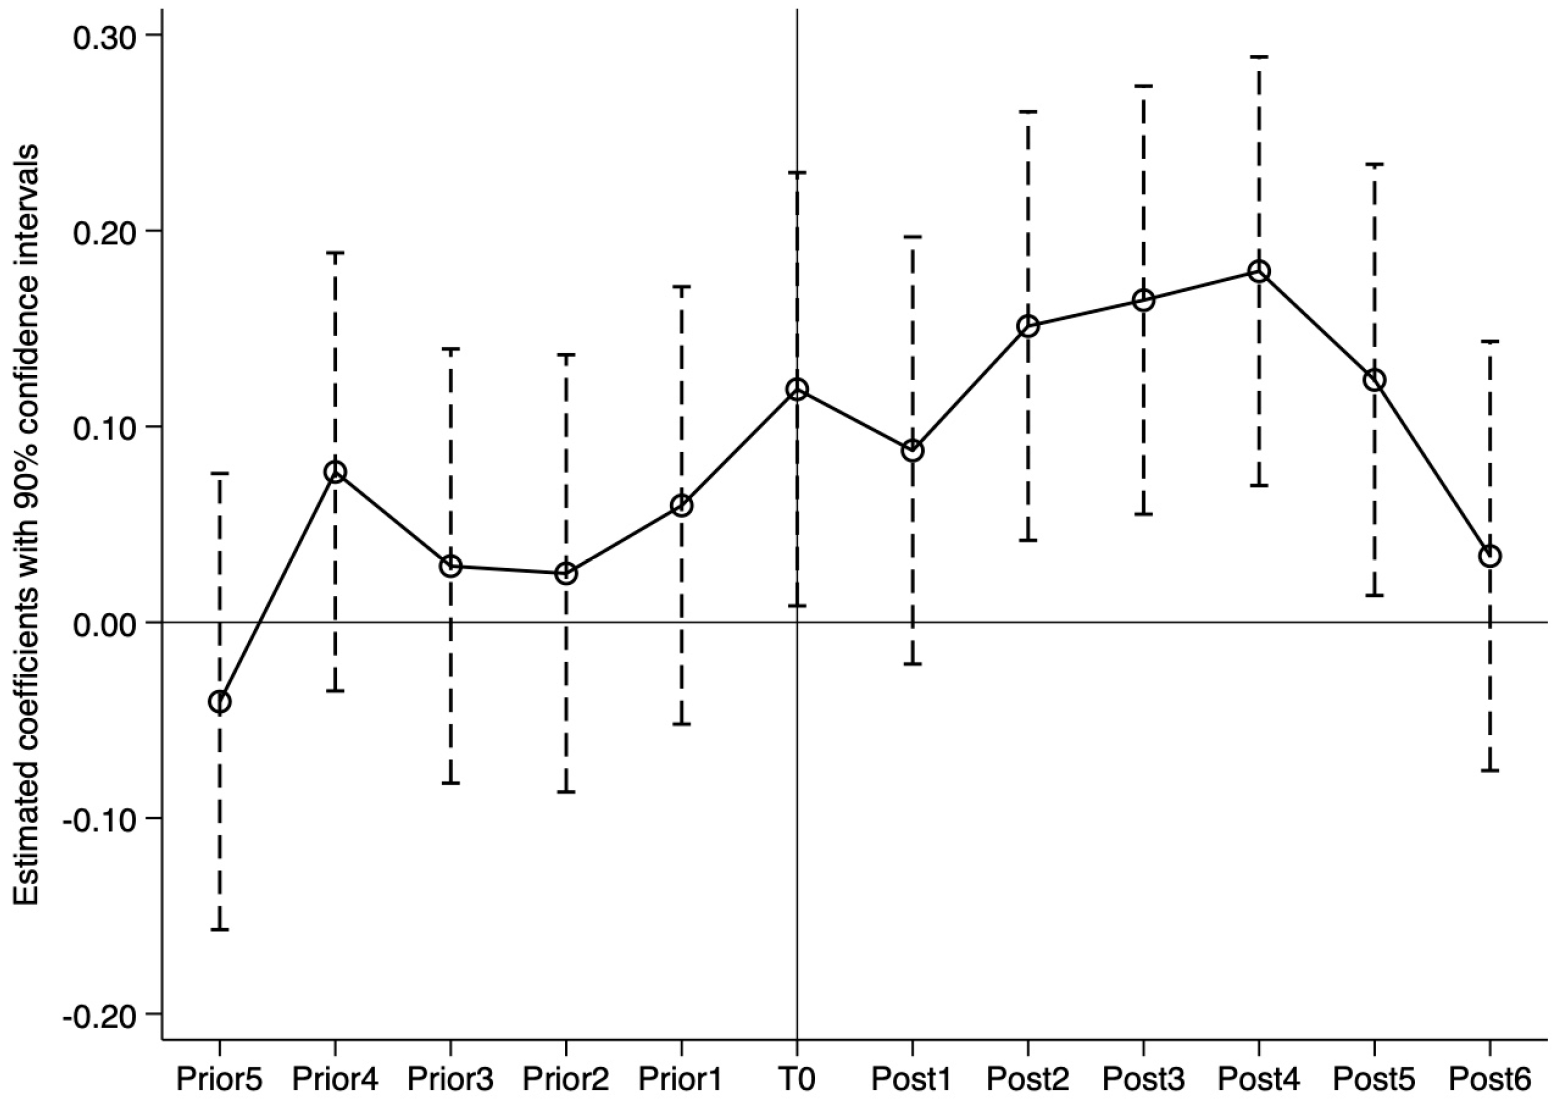
4.3.1. Parallel Trend Test
In the framework of the DID model, the parallel trend assumption is a critical prerequisite for valid causal inference. This assumption requires that, prior to the policy implementation, the number of green patent applications in the treatment and control groups follow similar trends over time. To test this, a parallel trend analysis using 2011 as the baseline year was conducted.
Figure 2 plots the dynamic effects of the IFCP on green patent applications (see Appendix A for details). The coefficients for Prior1 to Prior5 are statistically insignificant, indicating no significant difference in the pre-treatment trends between the treatment and control groups (2012–2016), thereby supporting the validity of the parallel trend assumption. In contrast, the coefficients for T0 and Post2 to Post5 are significantly positive, suggesting that firms in pilot regions experience a substantial increase in green patent applications in 2017 and from 2019 to 2022 relative to firms in non-pilot regions. These results indicate that the IFCP boosts GI among firms in pilot regions.
Figure 2.
The dynamic effects of the IFCP on green patent applications.
4.3.2. Substitution of the Dependent Variable
Different measures of the dependent variable may yield different results. To ensure the robustness of our findings, this study followed prior studies [62,63] and adopted the natural logarithm of the number of granted green patents as an alternative measure of GI. Compared to patent applications, granted patents better reflect a firm’s realized innovation output during the current period.
Column (1) of Table 5 presents the estimation results. The coefficient of TP is 0.099 and is statistically significant at the 1% level. This indicates that firms in the pilot regions experience a 9.9% increase in the number of granted green patents, suggesting that the IFCP has a positive effect on firms’ GI. The result is consistent with the baseline regression.
Table 5.
Robustness test: substitution of dependent variable and cluster robustness.
4.3.3. Cluster Robustness
Since the IFCP is implemented at the city level, firms within the same region may be subject to similar policy incentives, potentially leading to systematic correlations in GI behavior. Moreover, regional policy spillovers and inter-industry linkages may further amplify error correlations across firms. While this issue does not bias OLS coefficient estimates, it can underestimate standard errors, distort significance tests, and ultimately affect the robustness of the conclusions.
To address this issue, this study employed cluster-robust standard errors to control for intra-cluster correlation and improve the validity of inference. As shown in Column (2) of Table 5, the coefficient of TP on GI remains significantly positive, indicating that the baseline results are robust to alternative error estimation methods.
4.3.4. Sample Changes
To avoid the confounding effects of mid-term pilot withdrawal, firms located in cities that exited the pilot were excluded from the baseline regression. To test the robustness of our findings, this study reintroduced the excluded samples and re-estimated the model to observe whether the policy effect remains significant. If the results remain stable, this suggests that our conclusions are not dependent on sample selection and are therefore robust.
This study added back firms located in the initial pilot cities that exited midway, and the second batch of pilot cities to the treatment group, respectively. The results are shown in Columns (1) and (2) of Table 6. In both cases, the coefficients of TP remain significantly positive, indicating that the conclusions hold under alternative sample specifications.
Table 6.
Robustness test: sample changes and city fixed effects.
In addition, a separate regression treating only the initial pilot cities that exited midway as the treatment group was conducted. As shown in Column (3) of Table 6, the coefficient of TP is not statistically significant, suggesting that there is no evidence that mid-term pilot withdrawal affects firms’ GI.
4.3.5. City Fixed Effects
Although the pilot cities span eastern, central, and western regions, as well as large, medium, and small cities, their selection may have been influenced by pre-existing regional characteristics. The designation of IFCP cities was based on criteria such as a well-developed industrial base, sufficient financial resources, an existing foundation for industry–finance collaboration, and a documented list of financing needs for key enterprises and major projects. While the pilot status of a city was not determined by individual firms, underlying city-level conditions (e.g., economic development, innovation potential, and digitalization) could still affect firms’ GI.
To account for potential unobserved heterogeneity at the city level, city fixed effects were incorporated into the baseline regression. As shown in Column (4) of Table 6, the estimated coefficient of TP on GI remains significantly positive, indicating that the baseline results are robust to city-level variations.
4.3.6. Propensity Score Matching (PSM)
Although the non-withdrawing initial pilot cities include regions with varying levels of economic development, firm assignment to the treatment group may not be entirely random. Firms’ location decisions are often influenced by their inherent characteristics, which raises concerns about self-selection bias and potential endogeneity.
To address this issue, the PSM-DID method was applied to improve the robustness of the estimation. Specifically, this study used the control variables from the baseline model as covariates in a logistic regression to calculate propensity scores for each firm. Firms in the treatment and control groups were then matched using nearest-neighbor matching with a 1:3 ratio, ensuring comparable characteristics across groups (see Appendix B for a table presenting the result of balanced test). The matched sample was re-estimated using the baseline DID model.
Table 7 reports the PSM-DID results. Column (1) shows that the coefficient of TP remains significantly positive at the 1% level, even after accounting for sample selection bias. This finding supports the causal inference that the IFCP stimulates GI among firms.
Table 7.
Robustness test: PSM-DID.
4.3.7. Exclusion of Alternative Policies
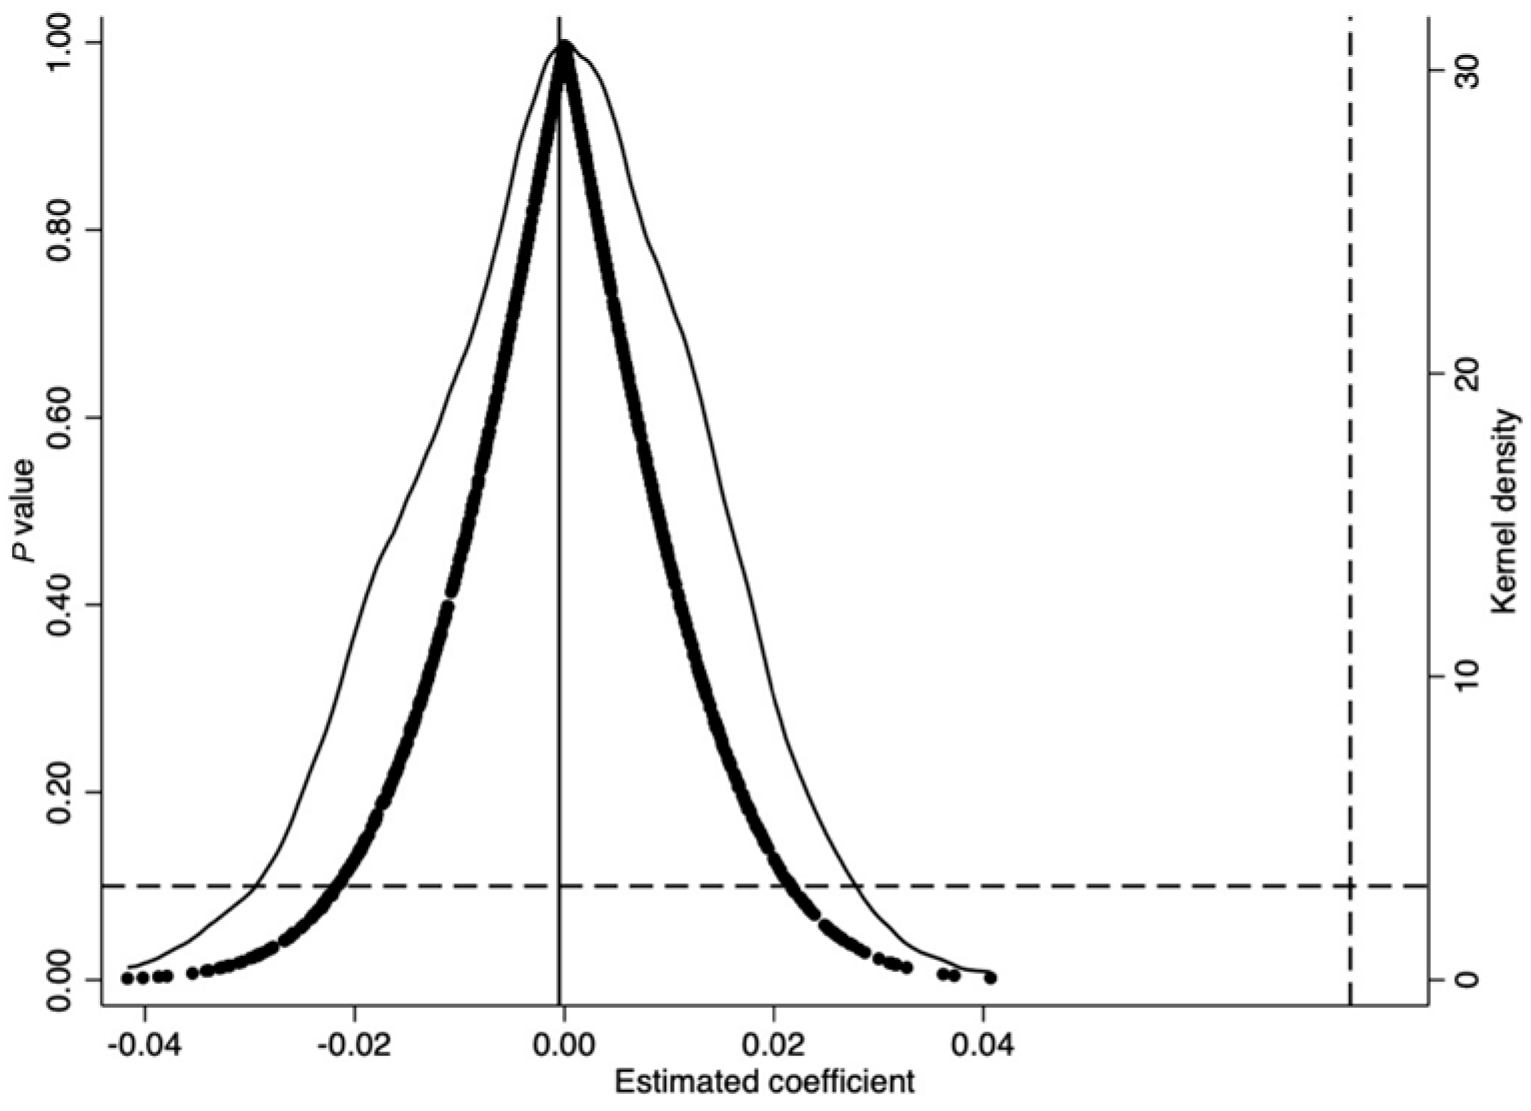
Green finance-related policies—such as the 2012 Green Credit Guidelines, the 2017 Green Finance Reform and Innovation Pilot Zones, and the 2018 Environmental Protection Fee-to-Tax Policy—may offer alternative explanations for the baseline results. To address potential confounding effects, this study constructed three corresponding policy dummy variables (Gcres, GreFin, and EpTax) and included them as additional controls in the baseline regression model.
As shown in Table 8, the estimated coefficients of TP remain significantly positive, indicating that the IFCP has a positive effect on GI, even after accounting for the influence of other green-related policies.
Table 8.
Robustness test: exclusion of alternative policies.
4.3.8. Placebo Test
To further ensure that the observed effect of the IFCP on GI is not driven by other policies or random chance, a placebo test was conducted. Specifically, the core explanatory variable TP across firms and years was randomly reassigned to generate a synthetic dataset. This reassigned variable replaced the original TP in the model, and the regression was re-estimated. The randomization procedure was repeated 1000 times, producing a distribution of estimated coefficients and corresponding p-values for the placebo variable. As shown in Figure 3, the distribution of placebo coefficients centers around zero, which is statistically and substantively distinct from the baseline estimate (0.075). This suggests that the observed increase in GI is unlikely to be driven by random unobserved factors, reinforcing the robustness of the empirical findings.
Figure 3.
Placebo test. The solid vertical line indicates an estimated coefficient of 0, the dashed vertical line indicates an estimated coefficient of 0.075, and the dashed horizontal line indicates a p-value of 0.10.
5. Further Analysis
5.1. Mechanism Analysis
Due to data limitations, it remains difficult to determine which specific measures under the IFCP have been most effective. For example, without publicly available data, the impact of initiatives such as improving supply chain financial services or compiling financing information lists for key enterprises and projects cannot be rigorously assessed. Therefore, this section primarily focuses on the testable mechanisms through which the IFCP stimulates GI in firms. As previously discussed, the IFCP may influence GI through two main channels: governmental green guidance and digital collaboration platforms. This study examined both mechanisms in turn.
5.1.1. Governmental Green Guidance
- (1)
- Fiscal Funds as Catalytic Capital
The IFCP encourages the use of fiscal funds as catalytic capital to facilitate bank–firm matchmaking and the implementation of key projects. Governmental environmental subsidies not only offset the costs associated with GI but also serve as positive signals to mobilize private capital toward green investment [17]. To test this mechanism, this study investigated the IFCP’s effects on green fiscal subsidies (GreFisSub) and the shareholding of green investors (GreInvHld).
Following Shao et al. (2022), GreFisSub was defined as the natural logarithm of green fiscal subsidies received by a firm [64]. These data were manually collected from the “government subsidies” section of annual report notes. This study identified a subsidy as green if its project description included green-related terms (e.g., green, environmental, sustainability, clean, and energy-saving).
Referring to Feng et al. (2024), GreInvHld was defined as the proportion of shares held by green investors [53]. Firstly, the “Fund Subject Information Table” and the “Stock Investment Detail Table” from the CSMAR Fund Market Series database were matched to identify funds investing in listed firms. Then, the “Investment Objective” and “Investment Scope” of each fund were manually examined to determine whether they included green-related terms (e.g., environmental protection, green, low carbon, and clean energy). A fund was classified as a green investor if such terms were present. For each firm-year observation, the total shareholding of green investors was aggregated and divided by the firm’s total number of shares to calculate the proportion of shares held by green investors.
Table 9 presents the results. Column (1) shows that the coefficient of TP on GreFisSub is significantly positive at the 1% level, indicating that the IFCP increases green fiscal subsidies in pilot regions. Column (2) reports a positive coefficient of TP on GreInvHld at the 10% level, suggesting that the IFCP also raises green investor shareholding. These findings imply that the IFCP encourages local governments to allocate fiscal resources more strategically and mobilizes private green capital, thereby encouraging firms to pursue GI as a means of obtaining financing.
Table 9.
Mechanism analysis: fiscal funds as catalytic capital.
- (2)
- Environmental Disclosure and Agency Costs
The IFCP emphasizes strengthening corporate governance through environmental information disclosure. Such disclosure attracts external stakeholders who monitor managerial behavior—such as inefficient spending or diverting resources from green R&D—and thereby helps mitigate agency costs [38,40,53]. To empirically test this mechanism, the impact of the IFCP on environmental disclosure (ED) and agency costs (ACs) were examined.
Following Luo et al. (2022), ED was defined as the natural logarithm of environmental scores provided by Huazheng’s ESG rating system [40]. The localized Huazheng ESG rating system better aligns with the context of Chinese listed firms. Based on publicly disclosed information—including annual reports, CSR and sustainability reports, regulatory websites, and media coverage—it provides a relatively reliable proxy for firms’ environmental disclosure.
Consistent with Ang et al. (2000) [65], AC was measured by the ratio of administrative and selling expenses to operating revenue. The ratio is widely used in the literature as a proxy for agency costs, as excessive non-production expenses may reflect inefficient resource use or managerial opportunism.
The results are reported in Table 10. Column (1) shows that the coefficient of TP on ED is significantly positive at the 1% level, indicating that the IFCP improves firms’ environmental disclosure in pilot regions. Column (2) shows a significantly negative coefficient of TP on ACs at the 5% level, suggesting that the IFCP reduces firms’ agency costs. These findings demonstrate that the IFCP stimulates GI by strengthening corporate governance through enhanced environmental transparency and reduced agency problems.
Table 10.
Mechanism analysis: environmental disclosure and agency costs.
5.1.2. Digital Finance Empowerment
Under governmental green guidance, digital finance functions extend into green finance via digitalized collaboration platforms, which reduce information asymmetry and transaction costs [26,28], thereby lowering firms’ credit costs and improving access to green credit [30]. To test this mechanism, the impact of the IFCP on credit costs (CCs) and access to green credit (GC) at the firm level were examined. CC was defined as the ratio of financial expenses to the average credit balance at the beginning and end of the year. GC was measured as the ratio of changes in long-term loans to operating income. Given the unavailability of direct green credit data and the long-term nature of such credit, long-term loans were used as a proxy.
The results are presented in Table 11. Column (1) shows that the estimated coefficient of TP on CC is significantly negative at the 1% level, indicating that the IFCP reduces firms’ credit costs in pilot regions. Column (2) shows a significantly positive coefficient of TP on GC at the 1% level, suggesting that the IFCP enhances firms’ access to green credit. These findings indicate that the IFCP promotes inclusive green credit through digital empowerment.
Table 11.
Mechanism analysis: digital finance empowerment.
This study further tested whether the IFCP alleviates information asymmetry and credit transaction costs. Following Kim and Verrecchia (2001) [66], the KV index was used to proxy the level of information asymmetry between banks and firms. The KV index was calculated using the following equations:
where Pi,d and Pi,d−1 denote the closing prices of stock i on trading days d and d−1, respectively; Voli,d is the trading volume of stock i on day d; and Voli,0 is the stock’s average daily trading volume for the year. When Pi,d = Pi,d−1, the return cannot be computed, so such trading days are excluded. The slope coefficient β was estimated based on the retained daily observations. Firm-year samples with fewer than 100 trading days or a negative β were excluded. A higher KV index indicated greater information asymmetry.
∆Pi,d = Pi,d − Pi,d−1,
Ln|∆Pi,d ÷ Pi,d−1| = α + β(Voli,d − Voli,0) + εi,d,
KVi,t = βi,t × 106,
Credit transaction cost data are not directly available. Since these costs primarily reflect the search, communication, and coordination expenses incurred during loan acquisition, they are typically recorded under “cash paid for other operating activities” in firms’ cash flow statements. Following Jiang (2017) [54], the ratio of “cash paid for other operating activities” to “cash received from borrowings” was used as a proxy for credit transaction costs (TCs).
Columns (3) and (4) of Table 11 report significantly negative coefficients of TP at the 1% level, indicating that the IFCP reduces both information asymmetry and credit transaction costs, thereby facilitating more efficient financial intermediation for GI.
5.2. Heterogeneity Analysis
Having demonstrated that the IFCP stimulates GI through governmental green guidance and digital finance empowerment, this study further examined the heterogeneity of this effect across different institutional and financial contexts. Specifically, this study incorporated environmental regulation intensity at the regional level, pollution intensity at the industry level, and asset size at the firm level.
5.2.1. Regional Level: Environmental Regulation Intensity
Previous research identifies a U-shaped relationship between environmental regulatory intensity and GI, where the effect shifts from inhibiting to promoting innovation beyond a certain regulatory threshold [67]. Thus, the IFCP’s effect on GI is expected to be more pronounced in regions with higher regulatory intensity. Following prior studies [68,69], this study measured regulatory intensity using the frequency of environmental terms in local government work reports and divided the sample into high and low intensity groups based on the median. As shown in Table 12, Columns (1) and (2), the coefficient of TP on GI is statistically significant only in the high-intensity group. This finding suggests that strong environmental regulation is a necessary condition for the IFCP to effectively convert policy incentives into GI outcomes.
Table 12.
Heterogeneity analysis.
5.2.2. Industry Level: Pollution Intensity
As proposed by Porter’s hypothesis [70], firms’ innovation activities vary across industries with different pollution intensities due to differences in regulatory pressure and financing constraints, which also holds for GI. Therefore, it is essential to examine how the IFCP affects GI across industries with varying pollution intensities. According to classification standards from the China Securities Regulatory Commission and the Ministry of Ecology and Environment, 16 industries—including coal, mining, textiles, and petrochemicals—are categorized as pollution-intensive. Accordingly, the sample was divided into high and low pollution intensity groups. As shown in Table 12, Columns (3) and (4), the coefficient of TP on GI is significant only within the high-intensity group. This finding indicates that in sectors subject to stronger regulatory pressure and tighter financing constraints, the IFCP more effectively stimulates GI.
5.2.3. Firm Level: Asset Size
Large firms typically possess stronger capital strength, better reputational standing, and greater information transparency, which reduce their credit risk and improve access to financial resources. In contrast, SMEs often face “scale-based discrimination” in credit markets, constraining their capacity to invest in GI [71]. The IFCP lowers financing thresholds and enhances financial inclusion through digital empowerment. If so, its effect on GI is expected to be more pronounced in SMEs. To test this, the sample was divided into large and small firms based on the median asset size within each industry. As shown in Table 12, Columns (5) and (6), the coefficient of TP on GI is significant only among firms with smaller asset sizes. This finding suggests that the IFCP stimulates GI by improving the financing environment for smaller firms.
5.3. Extended Analysis
The motivations driving corporate GI can be broadly divided into strategic and compliance-related or opportunistic types [16,34]. Strategic motivations involve integrating GI into core business strategies to enhance environmental performance and long-term competitiveness, often leading to high-quality, substantive innovation with originality and ecological value [8,37]. By contrast, compliance-related or opportunistic motivations stem from regulatory pressure or the pursuit of subsidies and financing benefits, prompting firms to pursue tactical GI aimed at satisfying external expectations rather than achieving real technological progress [12,13]. These firms often emphasize the volume of green patent filings or environmental disclosures as symbolic compliance, resulting in low-value innovation [25,72]. Notably, these motivations are not mutually exclusive; many firms display hybrid behavior, combining internal strategic goals with responses to external policy signals [14].
Similarly, under the IFCP, some firms may leverage policy-enabled resource advantages to enhance innovation quality and competitiveness, while others may adopt tactical GI strategies—focusing on patent quantity and speed—to obtain subsidies or financing without achieving substantive technological progress. To empirically examine firms’ GI motivations, following Feng et al. (2024) and Tang et al. (2021) [53,73], substantive GI was defined as the natural logarithm of the number of green invention patent applications (grants), and tactical GI was defined as the natural logarithm of the number of green utility model patent applications (grants).
Table 13 presents the empirical results. Columns (1) and (2) show that the estimated effects of the IFCP on substantive GI are statistically insignificant. Columns (3) and (4) report significantly positive coefficients for tactical GI at the 1% level. These findings suggest that the IFCP stimulates tactical GI rather than substantive GI—indicating that the policy primarily stimulates compliance or opportunistic motivations in firms, leading to an increase in low-value, tactical GI rather than high-quality, substantive GI.
Table 13.
Extended analysis.
Such “number games”-style innovation behavior may be driven by two underlying factors. First, information asymmetry may prevent regulators or financial institutions from effectively assessing the authenticity or substantive value of green technologies, thereby encouraging firms to engage in greenwashing or tactical behavior [21,40]. Second, in emerging markets with weak institutional environments, the absence of regulatory enforcement and oversight exacerbates rent-seeking incentives, making firms more likely to adopt minimal-cost compliance strategies rather than pursue genuine green technological transformation [13].
6. Conclusions and Discussion
6.1. Conclusions
Anchored in the context of financial services supporting green development, this study investigates the impact and mechanisms of the Industry–Finance Collaboration Pilot (IFCP) on firms’ green innovation (GI). Empirical results show that the IFCP significantly stimulates GI among listed industrial firms in pilot regions, with findings robust to a series of validation tests. Mechanism analysis identifies two main transmission channels. First, under governmental green guidance, the IFCP enhances local green subsidies, attracts green investors, improves environmental disclosure, and reduces agency costs. Second, through digital finance empowerment, the IFCP lowers information asymmetry and transaction costs, thereby reducing firms’ credit costs and improving access to green credit. Heterogeneity analysis reveals that the IFCP’s effect on GI is more pronounced in regions with stricter environmental regulation, in pollution-intensive industries, and among firms with smaller asset sizes. These results underscore the policy’s effectiveness in alleviating financing constraints and promoting GI, especially in environmentally sensitive sectors and resource-constrained firms, and highlight the need for continued coordination between fiscal, regulatory, and digital finance tools.
However, further investigation shows that the IFCP primarily promotes tactical, low-value GI rather than substantive, high-quality GI, suggesting that firms may be responding to compliance-oriented or opportunistic incentives, focusing on easily measurable outputs to meet regulatory expectations or secure policy-related financial benefits, rather than investing in breakthrough green technologies. To address this imbalance, performance evaluation systems, green credit rating mechanisms, and fiscal incentives should be optimized to more effectively channel financial resources toward high-quality, environmentally impactful innovation. Policymakers should revise incentive structures to place greater emphasis on innovation quality, originality, and environmental benefit—rather than relying solely on patent counts or symbolic disclosure. This includes revising assessment frameworks to incorporate metrics for innovation substance and application value. Moreover, regulatory authorities should enhance their capacity to identify and evaluate innovation quality by establishing third-party technical appraisal institutions or strengthening expert review mechanisms. This would ensure that policy resources are allocated to projects that deliver meaningful environmental outcomes, while deterring symbolic compliance behaviors. Strengthening oversight of environmental disclosure and green patent practices is also necessary to ensure that the IFCP contributes not only to the quantity but also the substance of China’s green innovation landscape.
6.2. Discussion
While this study provides valuable insights into the role of the IFCP in GI, several issues remain unaddressed. First, this study is unable to offer a comprehensive explanation for the observed discrepancy between the increase in tactical GI and the absence of improvement in substantive GI. This study hypothesizes that this divergence may be driven by compliance-related and opportunistic behavior, though firms’ underlying motivational mechanisms have not yet been empirically tested. The mechanism analysis reveals that the IFCP provides policy incentives and financing benefits, partially supporting the hypothesis that tactical GI is motivated by resource acquisition. The heterogeneity analysis further shows that the IFCP mainly stimulates GI in firms facing strong institutional pressure and tight financing constraints—conditions often associated with compliance- and opportunism-driven motives. Although this paper advocates for a shift toward quality-oriented GI, systemic and structural barriers such as bureaucratization in green finance and risks of greenwashing remain insufficiently examined. Future research should explore these issues in greater depth.
Second, data limitations—such as restricted access to information on IFCP platform operations, government-designated key firms and projects, bank–firm matchmaking, and fiscal instruments—constrain the precision with which beneficiaries and mechanisms can be identified. For instance, green fiscal subsidies are used as proxies for government support, but represent only one aspect of fiscal tools. Similarly, due to the lack of firm-level data on green finance and supply chain finance, their roles in supporting GI cannot be directly tested.
Third, the empirical analysis focuses exclusively on listed industrial firms, excluding potential effects on non-industrial sectors. Although the IFCP is designed to promote industrial upgrading, non-industrial firms may also benefit from improved financing access in practice. Future research should explore sectoral heterogeneity to provide a more comprehensive understanding. Moreover, due to data constraints, unlisted SMEs are excluded from this study. Although firm heterogeneity is examined through asset size, unlisted SMEs—which typically face greater financing constraints—may be more sensitive to IFCP-related policy incentives. Focusing solely on listed firms may therefore underestimate the full scope of the policy’s impact.
Future research could also examine peer effects in GI adoption, whereby firms are influenced by competitors’ innovation behavior within the same industry [74]. Additionally, the role of external pressures—such as media oversight and public environmental awareness—in shaping firms’ GI efforts deserves further investigation. Lastly, the contribution of digital technologies—such as artificial intelligence and blockchain—to enabling GI should also receive more scholarly attention.
Author Contributions
Conceptualization, X.X. and J.L.; methodology, X.X.; investigation, X.X.; writing—original draft preparation, X.X.; writing—review and editing, J.Z. and J.L.; supervision, J.Z.; funding acquisition, J.Z. All authors have read and agreed to the published version of the manuscript.
Funding
This research was funded by the Key Project of Beijing Social Science Foundation Decision-Making Consultation Program (No. 22JCB044) and “the Postgraduate Innovative Research Fund” of the University of International Business and Economics.
Institutional Review Board Statement
Not applicable.
Informed Consent Statement
Not applicable.
Data Availability Statement
The dataset presented in this study is openly available at https://data.csmar.com/ (accessed on 14 May 2025).
Conflicts of Interest
The authors declare no conflicts of interest.
Appendix A
Figure 2 in the main text illustrates the parallel trend. Here, Table A1 in the appendix presents the corresponding test results.
Table A1.
Parallel trend test.
Table A1.
Parallel trend test.
| (1) | |
|---|---|
| Variable | LnGrePata |
| Prior5 | −0.041 |
| (−0.57) | |
| Prior4 | 0.077 |
| (1.13) | |
| Prior3 | 0.029 |
| (0.43) | |
| Prior2 | 0.025 |
| (0.37) | |
| Prior1 | 0.060 |
| (0.88) | |
| T0 | 0.119 * |
| (1.77) | |
| Post1 | 0.088 |
| (1.32) | |
| Post2 | 0.151 ** |
| (2.27) | |
| Post3 | 0.164 ** |
| (2.48) | |
| Post4 | 0.179 *** |
| (2.70) | |
| Post5 | 0.124 * |
| (1.85) | |
| Post6 | 0.034 |
| (0.51) | |
| Controls | YES |
| Constant | 0.087 |
| (0.28) | |
| Year/Firm | YES |
| Observations | 14,013 |
| R-squared | 0.0360 |
Note: ***, **, and * indicate statistical significance at the 1%, 5%, and 10% levels, respectively.
Appendix B
Table A2 presents the results of the PSM balance test. The mean differences between the treatment and control groups are reduced after PSM, indicating improved covariate similarity between the two groups.
Table A2.
Balance test.
Table A2.
Balance test.
| Variable | Unmatched Matched | Mean | Bias (%) | p > |t| | V(T)/V(C) | |
|---|---|---|---|---|---|---|
| Treat = 1 | Treat = 0 | |||||
| Size | U | 8.316 | 8.295 | 1.700 | 0.421 | 0.980 |
| M | 8.316 | 8.307 | 0.700 | 0.270 | 0.789 | |
| Lev | U | 0.428 | 0.409 | 9.300 | 0 | 1.020 |
| M | 0.427 | 0.419 | 4.500 | 1.690 | 0.0900 | |
| ROA | U | 0.0389 | 0.0425 | −5.300 | 0.0120 | 1.040 |
| M | 0.0391 | 0.0412 | −3.200 | −1.190 | 0.232 | |
| Growth | U | 0.179 | 0.164 | 3.900 | 0.0680 | 0.970 |
| M | 0.179 | 0.176 | 0.800 | 0.280 | 0.776 | |
| CFO | U | 0.0512 | 0.0535 | −3.200 | 0.131 | 0.990 |
| M | 0.0513 | 0.0519 | −0.900 | −0.350 | 0.727 | |
| PPE | U | 0.226 | 0.246 | −13.80 | 0 | 0.950 |
| M | 0.226 | 0.222 | 3 | 1.140 | 0.256 | |
| LnListAge | U | 2.167 | 2.132 | 4.400 | 0.0400 | 0.85 * |
| M | 2.166 | 2.171 | −0.700 | −0.270 | 0.790 | |
| Top1 | U | 0.332 | 0.341 | −6.500 | 0.00300 | 0.89 * |
| M | 0.332 | 0.336 | −2.800 | −1.040 | 0.299 | |
| LnBoard | U | 2.089 | 2.131 | −20.90 | 0 | 1.23 * |
| M | 2.090 | 2.091 | −0.800 | −0.270 | 0.785 | |
| IndDr | U | 0.384 | 0.374 | 19.10 | 0 | 1.16 * |
| M | 0.384 | 0.386 | −3.300 | −1.190 | 0.233 | |
| Dual | U | 0.386 | 0.281 | 22.50 | 0 | . |
| M | 0.386 | 0.378 | 1.700 | 0.630 | 0.528 | |
| POE | U | 0.728 | 0.651 | 16.70 | 0 | . |
| M | 0.727 | 0.713 | 3.100 | 1.190 | 0.235 | |
| LnGDP | U | 9.224 | 8.625 | 57.20 | 0 | 0.71 * |
| M | 9.223 | 9.245 | −2.100 | −0.850 | 0.394 | |
| FinDep | U | 1.763 | 1.642 | 16.50 | 0 | 0.67 * |
| M | 1.764 | 1.789 | −3.400 | −1.400 | 0.163 | |
| Mrkt | U | 9.909 | 9.627 | 15.30 | 0 | 1.12 * |
| M | 9.910 | 9.852 | 3.200 | 1.240 | 0.213 | |
Note: * indicates statistical significance at the 10% level.
References
- Okabe, M. Cross Shareholdings in Japan: A New Unified Perspective of the Economic System; Edward Elgar Publishing Ltd.: Cheltenham, UK, 2002; ISBN 978-1-84064-976-5. [Google Scholar]
- Franzoni, F.; Giannetti, M. Costs and Benefits of Financial Conglomerate Affiliation: Evidence from Hedge Funds. J. Financ. Econ. 2019, 134, 355–380. [Google Scholar] [CrossRef]
- Nagarajan, V.; Mohanty, P.; Khatua, A. Financing Effects of Corporate Diversification: A Review. Rev. Manag. Sci. 2023, 17, 2555–2585. [Google Scholar] [CrossRef]
- Almeida, H.; Kim, C.-S.; Kim, H.B. Internal Capital Markets in Business Groups: Evidence from the Asian Financial Crisis. J. Financ. 2015, 70, 2539–2586. [Google Scholar] [CrossRef]
- Deng, M.; Fang, X.; Lyu, Q.; Luo, W. How Does Corporate Financialization Affect Operational Risk? Evidence from Chinese Listed Companies. Econ. Res.-Ekon. Istraživanja 2023, 36, 1–21. [Google Scholar] [CrossRef]
- Liu, L.; Li, Y. Enterprise Financialization and Stock Price Crash Risk. Financ. Res. Lett. 2024, 60, 104878. [Google Scholar] [CrossRef]
- Ghisetti, C.; Quatraro, F. Green Technologies and Environmental Productivity: A Cross-Sectoral Analysis of Direct and Indirect Effects in Italian Regions. Ecol. Econ. 2017, 132, 1–13. [Google Scholar] [CrossRef]
- Acemoglu, D.; Aghion, P.; Bursztyn, L.; Hemous, D. The Environment and Directed Technical Change. Am. Econ. Rev. 2012, 102, 131–166. [Google Scholar] [CrossRef]
- Andreoni, J.; Levinson, A. The Simple Analytics of the Environmental Kuznets Curve. J. Public Econ. 2001, 80, 269–286. [Google Scholar] [CrossRef]
- Gray, W.B.; Shadbegian, R.J. Plant Vintage, Technology, and Environmental Regulation. J. Environ. Econ. Manag. 2003, 46, 384–402. [Google Scholar] [CrossRef]
- Liu, S.; Wang, Y. Green Innovation Effect of Pilot Zones for Green Finance Reform: Evidence of Quasi Natural Experiment. Technol. Forecast. Soc. Change 2023, 186, 122079. [Google Scholar] [CrossRef]
- Andersen, D.C. Do Credit Constraints Favor Dirty Production? Theory and Plant-Level Evidence. J. Environ. Econ. Manag. 2017, 84, 189–208. [Google Scholar] [CrossRef]
- Polzin, F. Mobilizing Private Finance for Low-Carbon Innovation—A Systematic Review of Barriers and Solutions. Renew. Sustain. Energy Rev. 2017, 77, 525–535. [Google Scholar] [CrossRef]
- Ebrahimi, P.; Mirbargkar, S.M. Green Entrepreneurship and Green Innovation for SME Development in Market Turbulence. Eurasian Bus. Rev. 2017, 7, 203–228. [Google Scholar] [CrossRef]
- Tassey, G. Policy Issues for R&D Investment in a Knowledge-Based Economy. J. Technol. Transf. 2004, 29, 153–185. [Google Scholar] [CrossRef]
- Berrone, P.; Fosfuri, A.; Gelabert, L.; Gomez-Mejia, L.R. Necessity as the Mother of ‘Green’ Inventions: Institutional Pressures and Environmental Innovations. Strateg. Manag. J. 2013, 34, 891–909. [Google Scholar] [CrossRef]
- Han, F.; Mao, X.; Yu, X.; Yang, L. Government Environmental Protection Subsidies and Corporate Green Innovation: Evidence from Chinese Microenterprises. J. Innov. Knowl. 2024, 9, 100458. [Google Scholar] [CrossRef]
- Feng, S.; Zhang, R.; Li, G. Environmental Decentralization, Digital Finance and Green Technology Innovation. Struct. Change Econ. Dyn. 2022, 61, 70–83. [Google Scholar] [CrossRef]
- Yu, C.-H.; Wu, X.; Zhang, D.; Chen, S.; Zhao, J. Demand for Green Finance: Resolving Financing Constraints on Green Innovation in China. Energy Policy 2021, 153, 112255. [Google Scholar] [CrossRef]
- Gilbert, S.; Zhou, L. The Knowns and Unknowns of China’s Green Finance. Available online: https://newclimateeconomy.net/content/knowns-and-unknowns-chinas-green-finance-0 (accessed on 14 May 2025).
- Xing, C.; Zhang, Y.; Tripe, D. Green Credit Policy and Corporate Access to Bank Loans in China: The Role of Environmental Disclosure and Green Innovation. Int. Rev. Financ. Anal. 2021, 77, 101838. [Google Scholar] [CrossRef]
- Zhou, G.; Liu, C.; Luo, S. Resource Allocation Effect of Green Credit Policy: Based on DID Model. Mathematics 2021, 9, 159. [Google Scholar] [CrossRef]
- Omarini, A. Banks and Fintechs: How to Develop a Digital Open Banking Approach for the Bank’s Future. Int. Bus. Res. 2018, 11, 23–36. [Google Scholar] [CrossRef]
- Ozili, P.K. Impact of Digital Finance on Financial Inclusion and Stability. Borsa Istanb. Rev. 2018, 18, 329–340. [Google Scholar] [CrossRef]
- Hu, G.; Wang, X.; Wang, Y. Can the Green Credit Policy Stimulate Green Innovation in Heavily Polluting Enterprises? Evidence from a Quasi-Natural Experiment in China. Energy Econ. 2021, 98, 105134. [Google Scholar] [CrossRef]
- Demertzis, M.; Merler, S.; Wolff, G.B. Capital Markets Union and the Fintech Opportunity. J. Financ. Regul. 2018, 4, 157–165. [Google Scholar] [CrossRef]
- Gomber, P.; Koch, J.-A.; Siering, M. Digital Finance and FinTech : Current Research and Future Research Directions. J. Bus. Econ. 2017, 87, 537–580. [Google Scholar] [CrossRef]
- Chen, M.A.; Wu, Q.; Yang, B. How Valuable Is FinTech Innovation? Rev. Financ. Stud. 2019, 32, 2062–2106. [Google Scholar] [CrossRef]
- Bazarbash, M. FinTech in Financial Inclusion: Machine Learning Applications in Assessing Credit Risk; International Monetary Fund: Washington, DC, USA, 2019. [Google Scholar] [CrossRef]
- Nassiry, D. The Role of Fintech in Unlocking Green Finance: Policy Insights for Developing Countries; Asian Development Bank Institute (ADBI): Tokyo, Japan, 2018. [Google Scholar]
- Kong, T.; Sun, R.; Sun, G.; Song, Y. Effects of Digital Finance on Green Innovation Considering Information Asymmetry: An Empirical Study Based on Chinese Listed Firms. Emerg. Mark. Financ. Trade 2022, 58, 4399–4411. [Google Scholar] [CrossRef]
- Li, X.; Shao, X.; Chang, T.; Albu, L.L. Does Digital Finance Promote the Green Innovation of China’s Listed Companies? Energy Econ. 2022, 114, 106254. [Google Scholar] [CrossRef]
- Hossain, M.R.; Rao, A.; Sharma, G.D.; Dev, D.; Kharbanda, A. Empowering Energy Transition: Green Innovation, Digital Finance, and the Path to Sustainable Prosperity through Green Finance Initiatives. Energy Econ. 2024, 136, 107736. [Google Scholar] [CrossRef]
- Zhang, D. Can Digital Finance Empowerment Reduce Extreme ESG Hypocrisy Resistance to Improve Green Innovation? Energy Econ. 2023, 125, 106756. [Google Scholar] [CrossRef]
- Lee, C.-C.; Lee, C.-C. How Does Green Finance Affect Green Total Factor Productivity? Evidence from China. Energy Econ. 2022, 107, 105863. [Google Scholar] [CrossRef]
- Zhao, X.; Benkraiem, R.; Abedin, M.Z.; Zhou, S. The Charm of Green. Finance: Can Green Finance Reduce Corporate Carbon Emissions? Energy Econ. 2024, 134, 107574. [Google Scholar] [CrossRef]
- Chen, Y.-S. The Driver of Green Innovation and Green Image—Green Core Competence. J. Bus. Ethics 2008, 81, 531–543. [Google Scholar] [CrossRef]
- Dhaliwal, D.S.; Li, O.Z.; Tsang, A.; Yang, Y.G. Voluntary Nonfinancial Disclosure and the Cost of Equity Capital: The Initiation of Corporate Social Responsibility Reporting. Account. Rev. 2011, 86, 59–100. [Google Scholar] [CrossRef]
- Zhao, S.; Abbassi, W.; Hunjra, A.I.; Zhang, H. How Do Government R&D Subsidies Affect Corporate Green Innovation Choices? Perspectives from Strategic and Substantive Innovation. Int. Rev. Econ. Financ. 2024, 93, 1378–1396. [Google Scholar] [CrossRef]
- Luo, Y.; Xiong, G.; Mardani, A. Environmental Information Disclosure and Corporate Innovation: The “Inverted U-Shaped” Regulating Effect of Media Attention. J. Bus. Res. 2022, 146, 453–463. [Google Scholar] [CrossRef]
- Beck, T.; Levine, R. Industry Growth and Capital Allocation: Does Having a Market- or Bank-Based System Matter? J. Financ. Econ. 2002, 64, 147–180. [Google Scholar] [CrossRef]
- Liu, Y.; Yang, Y.; Li, H.; Zhong, K. Digital Economy Development, Industrial Structure Upgrading and Green Total Factor Productivity: Empirical Evidence from China’s Cities. Int. J. Environ. Res. Public Health 2022, 19, 2414. [Google Scholar] [CrossRef]
- Falcone, P.M.; Morone, P.; Sica, E. Greening of the Financial System and Fuelling a Sustainability Transition: A Discursive Approach to Assess Landscape Pressures on the Italian Financial System. Technol. Forecast. Soc. Change 2018, 127, 23–37. [Google Scholar] [CrossRef]
- UNEP. The Financial System We Need: Aligning the Financial System with Sustainable Development. Available online: https://www.uncclearn.org/wp-content/uploads/library/the_financial_system_we_need_aligning_the_financial_system_with_sustainable_development-2015the_financial_system_we_need_ch.pdf.pdf (accessed on 30 April 2025).
- He, L.; Liu, R.; Zhong, Z.; Wang, D.; Xia, Y. Can Green Financial Development Promote Renewable Energy Investment Efficiency? A Consideration of Bank Credit. Renew. Energy 2019, 143, 974–984. [Google Scholar] [CrossRef]
- Goldstein, I.; Jiang, W.; Karolyi, G.A. To FinTech and Beyond. Rev. Financ. Stud. 2019, 32, 1647–1661. [Google Scholar] [CrossRef]
- Gomber, P.; Kauffman, R.J.; Parker, C.; Weber, B.W. On the Fintech Revolution: Interpreting the Forces of Innovation, Disruption, and Transformation in Financial Services. J. Manag. Inf. Syst. 2018, 35, 220–265. [Google Scholar] [CrossRef]
- Chahal, S. Navigating Financial Evolution: Business Process Optimization and Digital Transformation in the Finance Sector. Int. J. Financ. 2023, 8, 67–81. [Google Scholar] [CrossRef]
- Zhou, D.; Kautonen, M.; Dai, W.; Zhang, H. Exploring How Digitalization Influences Incumbents in Financial Services: The Role of Entrepreneurial Orientation, Firm Assets, and Organizational Legitimacy. Technol. Forecast. Soc. Change 2021, 173, 121120. [Google Scholar] [CrossRef]
- Ma, K. Digital Inclusive Finance and Corporate Green Technology Innovation. Financ. Res. Lett. 2023, 55, 104015. [Google Scholar] [CrossRef]
- Liu, J.; Jiang, Y.; Gan, S.; He, L.; Zhang, Q. Can Digital Finance Promote Corporate Green Innovation? Environ. Sci. Pollut. Res. 2022, 29, 35828–35840. [Google Scholar] [CrossRef]
- Jensen, M.C.; Meckling, W.H. Theory of the Firm: Managerial Behavior, Agency Costs and Ownership Structure. J. Financ. Econ. 1976, 3, 305–360. [Google Scholar] [CrossRef]
- Feng, J.; Yuan, Y. Green Investors and Corporate ESG Performance: Evidence from China. Financ. Res. Lett. 2024, 60, 104892. [Google Scholar] [CrossRef]
- Jiang, F.; Jiang, Z.; Huang, J.; Kim, K.A.; Nofsinger, J.R. Bank Competition and Leverage Adjustments. Financ. Manag. 2017, 46, 995–1022. [Google Scholar] [CrossRef]
- Jaffee, D.M.; Russell, T. Imperfect Information, Uncertainty, and Credit Rationing. Q. J. Econ. 1976, 90, 651–666. [Google Scholar] [CrossRef]
- Stiglitz, J.; Weiss, A. Credit Rationing in Markets with Imperfect Information. Am. Econ. Rev. 1981, 71, 393–410. [Google Scholar]
- Myers, S.C.; Majluf, N.S. Corporate Financing and Investment Decisions When Firms Have Information That Investors Do Not Have. J. Financ. Econ. 1984, 13, 187–221. [Google Scholar] [CrossRef]
- Norden, L.; Silva Buston, C.; Wagner, W. Financial Innovation and Bank Behavior: Evidence from Credit Markets. J. Econ. Dyn. Control 2014, 43, 130–145. [Google Scholar] [CrossRef]
- Lee, C.-C.; Li, X.; Yu, C.-H.; Zhao, J. Does Fintech Innovation Improve Bank Efficiency? Evidence from China’s Banking Industry. Int. Rev. Econ. Financ. 2021, 74, 468–483. [Google Scholar] [CrossRef]
- Lin, B.; Ma, R. How Does Digital Finance Influence Green Technology Innovation in China? Evidence from the Financing Constraints Perspective. J. Environ. Manag. 2022, 320, 115833. [Google Scholar] [CrossRef]
- Ming, W.; Zhou, Z.; Ai, H.; Bi, H.; Zhong, Y. COVID-19 and Air Quality: Evidence from China. In Research on Pandemics; Routledge: Oxfordshire, UK, 2021; ISBN 978-1-003-21468-7. [Google Scholar]
- Du, K.; Cheng, Y.; Yao, X. Environmental Regulation, Green Technology Innovation, and Industrial Structure Upgrading: The Road to the Green Transformation of Chinese Cities. Energy Econ. 2021, 98, 105247. [Google Scholar] [CrossRef]
- Feng, Y.; Wang, X.; Liang, Z. How Does Environmental Information Disclosure Affect Economic Development and Haze Pollution in Chinese Cities? The Mediating Role of Green Technology Innovation. Sci. Total Environ. 2021, 775, 145811. [Google Scholar] [CrossRef]
- Shao, Y.; Chen, Z. Can Government Subsidies Promote the Green Technology Innovation Transformation? Evidence from Chinese Listed Companies. Econ. Anal. Policy 2022, 74, 716–727. [Google Scholar] [CrossRef]
- Ang, J.S.; Cole, R.A.; Lin, J.W. Agency Costs and Ownership Structure. J. Financ. 2000, 55, 81–106. [Google Scholar] [CrossRef]
- Kim, O.; Verrecchia, R.E. The Relation among Disclosure, Returns, and Trading Volume Information. Account. Rev. 2001, 76, 633–654. [Google Scholar] [CrossRef]
- Song, M.; Wang, S.; Zhang, H. Could Environmental Regulation and R&D Tax Incentives Affect Green Product Innovation? J. Clean. Prod. 2020, 258, 120849. [Google Scholar] [CrossRef]
- Chen, Z.; Kahn, M.E.; Liu, Y.; Wang, Z. The Consequences of Spatially Differentiated Water Pollution Regulation in China. J. Environ. Econ. Manag. 2018, 88, 468–485. [Google Scholar] [CrossRef]
- Liu, Z.; Tang, Y.; Wilson, J.; Tao, X.; Lv, B.; Wang, Z.; Xu, Y.; Zhang, Z.; Zhang, Y.; Zhao, W. Influence of Government Attention on Environmental Quality: An Analysis of 30 Provinces in China. Environ. Impact Assess. Rev. 2023, 100, 107084. [Google Scholar] [CrossRef]
- Porter, M.E. America’ s Green Strategy. Sci. Am. 1991, 264, 168. [Google Scholar] [CrossRef]
- Trinugroho, I.; Pamungkas, P.; Wiwoho, J.; Damayanti, S.M.; Pramono, T. Adoption of Digital Technologies for Micro and Small Business in Indonesia. Financ. Res. Lett. 2022, 45, 102156. [Google Scholar] [CrossRef]
- Li, G.; Xue, Q.; Qin, J. Environmental Information Disclosure and Green Technology Innovation: Empirical Evidence from China. Technol. Forecast. Soc. Change 2022, 176, 121453. [Google Scholar] [CrossRef]
- Tang, C.; Xu, Y.; Hao, Y.; Wu, H.; Xue, Y. What Is the Role of Telecommunications Infrastructure Construction in Green Technology Innovation? A Firm-Level Analysis for China. Energy Econ. 2021, 103, 105576. [Google Scholar] [CrossRef]
- Sheng, D.; Guyot, O.; Sheng, D.; Guyot, O. Market Power, Internal and External Monitoring, and Firm Distress in the Chinese Market. Data Sci. Financ. Econ. 2024, 4, 285–308. [Google Scholar] [CrossRef]
Disclaimer/Publisher’s Note: The statements, opinions and data contained in all publications are solely those of the individual author(s) and contributor(s) and not of MDPI and/or the editor(s). MDPI and/or the editor(s) disclaim responsibility for any injury to people or property resulting from any ideas, methods, instructions or products referred to in the content. |
© 2025 by the authors. Licensee MDPI, Basel, Switzerland. This article is an open access article distributed under the terms and conditions of the Creative Commons Attribution (CC BY) license (https://creativecommons.org/licenses/by/4.0/).