Article

The Thermal Properties of an Active–Passive Heat Storage Wall System Incorporating Phase Change Materials in a Chinese Solar Greenhouse

1
School of Environmental and Municipal Engineering, Lanzhou Jiaotong University, Lanzhou 730070, China
2
Key Laboratory of Railway Vehicle Thermal Engineering, Lanzhou Jiaotong University, Ministry of Education of China, Lanzhou 730070, China
*
Author to whom correspondence should be addressed.
Sustainability 2024, 16(7), 2624; https://doi.org/10.3390/su16072624
Submission received: 4 February 2024 / Revised: 2 March 2024 / Accepted: 20 March 2024 / Published: 22 March 2024

Abstract

:
The use of renewable energy for food and vegetable production is a potential sustainable method to reduce fossil energy consumption. Chinese solar greenhouses (CSGs) are horticultural facility buildings in the northern hemisphere that use solar energy to produce off-season vegetables in winter. The north wall heat storage and release capacity of CSG has a significant impact on the indoor thermal–humidity environment. However, common traditional solar greenhouses commonly have problems such as insufficient heat storage and release, thick temperature stability zones inside the walls, and inability to dynamically regulate the entire greenhouse environment. Therefore, a novel active–passive heat storage wall system (APHSWS) incorporating phase change materials has been developed to promote the thermal performance of the CSG and its internal temperature of the thermal storage wall in this paper. Through experimental and simulation methods, the heat storage and release of the APHSWS and its impact on the greenhouse environment are investigated. The findings indicate that the APHSWS has increased the wall heat storage and release capacity, compared to the ordinary greenhouse without the APHSWS, in three typical weather conditions in winter (i.e., sunny, overcast, and cloudy); the average temperature of greenhouse with the APHSWS has increased in indoor air temperature, wall surface temperature, and soil surface temperatures of 1.58–6.06 °C, 2.71–6.58 °C, 0.91–6.39 °C, respectively; and during the experiment, the greenhouse with the APHSWS has a monthly average daily effective accumulated temperature of 1.39 times, 1.18 times, 0.60 times, and 0.20 times that of the ordinary greenhouse without the APHSWS from December to March of the next year, respectively. Under typical sunny conditions, the greenhouse wall heat storage capacity increased by 1.59–2.44 MJ/m2 and the heat release capacity increased by 0.97–1.17 MJ/m2. At the direction of wall thickness, the temperature at each point inside the wall with the APHSWS is always higher than that of ordinary wall without the APHSWS. In addition, the operating cost of the APHSWS in winter is analyzed.

1. Introduction

As the world population grows, the demand for food will increase dramatically [1]. By 2050, the world population will grow to about 9.7 billion [2], and the world food demand will increase 70% [3,4]. One of our challenges is feeding a growing world population [5] and developing new technologies to increase food production [6].
Greenhouse cultivation is a potential alternative way to meet food demands.
Chinese solar greenhouses (CSGs) are horticultural facility buildings in the northern hemisphere that use solar energy to produce off-season vegetables in winter. However, traditional greenhouses pose significant energy consumption, high investment and operating costs [7], as they rely principally on fossil fuels. Existing studies recognized that Phase Change Materials (PCMs) played a key role in increasing energy efficiency due to their high heat storage capacity [8,9,10,11,12]. In recent years, adding PCM to enhance the thermal energy storage capacity of building envelope structures is one of the sustainable methods for regulating indoor temperature, thereby improving indoor thermal comfort and reducing energy consumption of buildings [13]. On the one hand, it can increase the thermal capacity of the building envelope structure, reduce indoor air temperature fluctuations, and improve the indoor thermal environment. On the other hand, it can alleviate the contradiction between the time and intensity of building energy supply, and play a dynamic regulatory role, achieving the goal of reducing consumption and energy conservation. Therefore, the application of PCM in the field of building energy conservation and research on improving indoor thermal environment are receiving increasing attention [14]. Therefore, based on the effectiveness of PCM in the field of building energy conservation, some experts have also begun to apply it to enhance the heat storage and release of greenhouse walls and improve the indoor environment of greenhouses. Zhang et al. [15] used composite inorganic PCMs as the main body, combined with raw materials such as cement and sawdust, to prepare a PCM module, which was fixed on the north wall skeleton of a solar greenhouse. They collected temperature data inside the greenhouse to study its heat storage and release effects in actual production environments. The results indicated that the thermal–humidity environment inside the greenhouse can be improved in both winter and summer, allowing crops to grow in a relatively suitable environment with gentle temperature changes. Based on the climate characteristics of the northern region of Jiangsu Province, China, Wu et al. [16] applied a mixture of paraffin and n-butyl stearate as a PCM to greenhouses and compared it with ordinary solar greenhouses. The experimental results showed that PCM could optimize the air temperature and soil temperature of greenhouse, which could effectively reduce the temperature difference between the day and night, and increase the nighttime temperature of the solar greenhouse.
The north wall of CSG is a major heat carrier, and the utilization of PCM on the north wall has been in the spotlight [17,18]. How to combine PCM with the north wall of the greenhouse in different ways to increase the heat storage and release capacity of the wall and improve the indoor environment of the greenhouse has become a focus of research in recent years. Meng et al. [19] applied composite PCMs as energy storage media, packaged with Polyethylene pipes, and externally arranged on the inner surface of the north wall of the phase change greenhouse. Zhou et al. [20] applied composite phase change insulation mortar to the passive walls of solar greenhouses. The experiment results demonstrated that the PCMs can increase the average indoor air temperature by 1.5 °C and increase fruit yield by 80%. At the same time, the structural form of the wall was optimized using ANSYS 2021R2 software, and the optimal combination of phase change insulation mortar thickness and wall thickness was obtained, making the wall have strong heat storage and release capacity, suitable for winter greenhouse production. Guarino et al. [21] proposed a system that integrated PCM in the north wall and conducted experiments. The experiment results showed that the PCM wall was a good executable for solarium under cold climates. Guan et al. [22] developed a new type of greenhouse wall with PCM wallboard. The ability of the greenhouse wall to collect and store heat was improved, and the stability of greenhouse temperature at night was maintained, which was beneficial to the growth of crops. It was analyzed that, no matter how the PCM was placed in the north wall, using PCM wallboard played a role in “peak load shifting” for the utilization of solar energy.
As can be seen from the above, using PCM in a solar greenhouse can effectively improve the thermal performance of the entire wall and the greenhouse environment. However, due to the limited thermal conductivity of PCM [23], it is difficult to transfer the heat stored to the interior of the wall in a timely manner during the daytime. Moreover, at present, the heat storage technology combining a PCM with the wall mostly adopts passive heat storage, relying only on temperature differences for heat transfer, resulting in low heat transfer efficiency and low heat transfer rate; therefore, it will lead to a thicker temperature stable zone inside the wall [24]. Guan et al. [25] analyzed the heat transfer characteristics of the three-layer wall of phase change heat storage of CSG with a thickness of 900 mm. They found that solar intensity affected the wall temperature to a limited depth, accounting for about 33.3% of the wall thickness, and the temperature stable region accounts for 61.1%. It was very limited for improving the efficiency of solar sensible heat storage on walls. In the meantime, attention should be paid to the PCM melting–freezing cycle; the change in outdoor temperature had the greatest influence on the cycle. In the absence of a fully melted or frozen PCM, their ability to store heat could be reduced, especially in winter, when low outdoor temperatures adversely affected the system [26,27,28]. In response to the problems of passive heat storage, many scholars have introduced active heat storage technology into solar greenhouses to further improve solar energy utilization, enhance wall heat storage and release capacity, improve the environmental temperatures inside the greenhouse, and provide a more suitable growth environment for crops. [29]. Yang et al. [30] proposed two new types of prefabricated solar greenhouse wall structures to address the issue of insufficient insulation and heat storage capacity of the north wall of the greenhouse. The local traditional brick-mixed structure greenhouse was used as a reference for the experimental study. The results showed that the two types of wall structure greenhouses can significantly improve the insulation and heat storage performance of the greenhouse. Kooli et al. [31] used a phase change spherical capsule packaging bed to collect heat and exothermic energy directly from solar energy; at night, heat was released through air circulation to actively heat the greenhouse. The analysis showed that forced convective heat release at night could reach 30% of the total heating requirement, while the indoor air temperature could stay at 15 °C when the outdoor air temperature dropped to 8 °C. Arfaoui et al. [32] improved the above device and changed the original single-packed bed into a double layer. Further analysis showed that the heat storage capacity of the device was increased by 47% and effective heat release at night was up to 0.3 kW. Gourdo et al. [33] and Bazgaou et al. [34] laid pebbles in deeper soil layers; the hot air was directly passed into the cobblestone layer by the fan in the daytime, and the excess heat was collected. At night, when the indoor air temperature was low, the fan was turned on again and heat was released through the airflow. The air temperature of the experimental greenhouse at night was 2.6 °C higher than that of an ordinary greenhouse. The auxiliary heater is particularly important, given the instability of solar energy, especially during continuous cloudy and rainy days [35]. Ling et al. [36] applied a multi-curve through an air collector with double heat pipes as an auxiliary heater, which was equipped with a vertical air duct. The study showed the heat transfer efficiency of the experimental wall was 66.2% (airflow rate: 0.26 m/s; airflow direction: top in and bottom out) and the active heat storage was about 9.43 MJ/m3. Mohsenipour et al. [37] has proposed a net-zero greenhouse that combined Iran’s cooling, heating and electricity systems. The greenhouse realized the cascade utilization of energy. However, economic analysis found that the initial investment in greenhouses was high, with a payback period of 12 to 14 years.
As mentioned above, the introduction of PCMs in current solar greenhouses can solve the common problems of low solar energy utilization, insufficient wall heat storage, and high or low temperature inside the greenhouse in traditional CSGs. However, when using PCM in CSG, the combination technology with the wall commonly uses methods such as pipe packaging, capsule packaging, or mixing with cement mortar to make phase change board blocks before simply adhering to the wall. At this time, the solar energy shining on the surface of the north wall through the front roof is absorbed by PCM. Due to the limited thermal conductivity of PCM, the stored heat is difficult to transfer quickly to the interior of the wall, and it greatly reduces the heat storage capacity of greenhouse walls. Furthermore, due to the inability to effectively transfer heat to the wall, there is generally a temperature stable zone inside the CSG wall combined with PCM. From the inner surface of the wall to the interior of the wall, the wall’s heat storage layer only accounts for about 30% of the total wall thickness; the temperature stable zone accounts for about 60%. The excessively thick wall temperature stable zone limits the heat storage and release capacity of the wall, making it unable to fully utilize the wall for heat storage and release, greatly reducing the heat storage and release efficiency of the wall.
Secondly, the use of PCM in CSG often adopts a passive heat storage method. Although this method can achieve dynamic regulation of the overall heat and humidity balance in the greenhouse, its heat storage and release rely entirely on the passive heat transfer caused by the temperature difference between PCM, the wall and the environment, and its heat storage and release cannot be accurately controlled according to actual needs; thus, it is necessary to further rely on the combination of PCM and CSGs active passive collaborative heat storage and release system to regulate the overall thermal environment in the greenhouse. However, as of now, the combination of PCM and active passive collaborative heat storage in CSG has not received sufficient attention, and system design is mostly in the conceptual stage or a small model experiment without specific implementation and application. There is a lack of guidance value for the application of the active passive collaborative heat storage technology in actual solar greenhouses.
Therefore, in response to the common problems encountered in the combination of PCM and CSG mentioned above, we proposed a new active–passive heat storage wall system (APHSWS) incorporating PCMs in the experimental greenhouse. The APHSWS focuses on solving the problems of crop freezing death and damage caused by insufficient heat storage and release on the walls and low temperature in ordinary solar greenhouses during colder winter in northern China. This system was based on passive phase change heat storage and active solar energy collection technology. In addition to the wall used for passive heat storage and release, an active collection system with solar collectors, ventilation ducts, and steel tanks filled by PCM (paraffin wax), a frequency conversion centrifugal fan and a data acquisition unit were added. Compared to previous studies on this topic, most of them simply package PCMs and stick them to the surface of the wall, which prevents heat from indoor surface to the interior of the wall in a timely manner, resulting in lower temperature inside the wall. Additionally, the construction and operation costs of active heat storage system walls are relatively high. The wall with the proposed APHSWS in this study combined PCMs with active heat storage technology, filling PCMs into steel tanks and placing them inside the wall. The air in the pipeline was driven by a centrifugal fan to store and release heat, which could not only improve the utilization of solar energy, but also solve the problem of low internal temperature and thick temperature stability zone caused by the small thermal conductivity coefficient of PCM in the wall. The findings of this study will provide reference for optimizing the walls and internal environment of solar greenhouses in the engineering field.
To demonstrate the improvement of the thermal storage and release characteristics of CSG walls by the new wall structure, this paper combined experimental and simulation methods to test several key indicators, including the temperature of the north wall, indoor air temperature, soil temperature and daily effective accumulative temperature (DEAT), which were detected in both the experimental greenhouse with the APHSWS and ordinary greenhouses without the APHSWS. Meanwhile, two three-dimensional heat transfer models for ordinary greenhouse and the experimental greenhouse with the APHSWS structure were established to comprehensively compare the temperature distribution and heat storage and release characteristics within the walls. The advantages of APHSWS structure walls compared to ordinary walls were also analyzed, as well as the regulation and improvement of the entire greenhouse thermal environment in winter.

2. Materials and Methods

2.1. The APHSWS Incorporating PCMs

To comprehensively utilize solar energy and provide a comfortable indoor thermal environment for greenhouse crops in winter, an active–passive heat storage wall system (APHSWS) incorporating PCMs was proposed and constructed as shown in Figure 1. The system was based on passive phase change heat storage and active solar heat collection technology; it consists of five sets of solar concentrating air collectors, six steel tanks filled by PCM (paraffin wax), stainless steel coil pipes, a frequency conversion centrifugal fan and a data acquisition system. When the heat preservation quilt was turned on during the daytime (10:00 a.m. to 16:00), the APHSWS was also turned on. Solar energy was absorbed by the solar concentrating air collector to heat the air in the receiver tube, and then the heated air was driven by a frequency conversion centrifugal fan, sent the heated air through the insulated pipe to the stainless-steel coil. After the heated air in the coil passed through the six tanks filled by PCM, the PCM gradually underwent phase change when it absorbed a large amount of heat from the coil pipe, the air that released heat was transported by the insulated pipe to the solar concentrating air collector for reheating, which was then recycled repeatedly; thus, the active heat storage process of the APHSWS was realized. Meanwhile, the solar energy can be transmitted directly through the front roof to the inner surface of the north wall passively and transferred to the block bricks in the form of heat conduction, thereby the active and passive approaches were combined to greatly improve the heat storage capacity of the wall. When the heat preservation quilt was closed in the afternoon (from 16:00 to 10:00 day + 1), the valve was closed and centrifugal fan was turned off and the active heat storage system was stopped. At night, the stored heat was released into the CSG by different methods (heat convection, heat radiation and heat conduction) to provide a suitable thermal environment for crop growth.

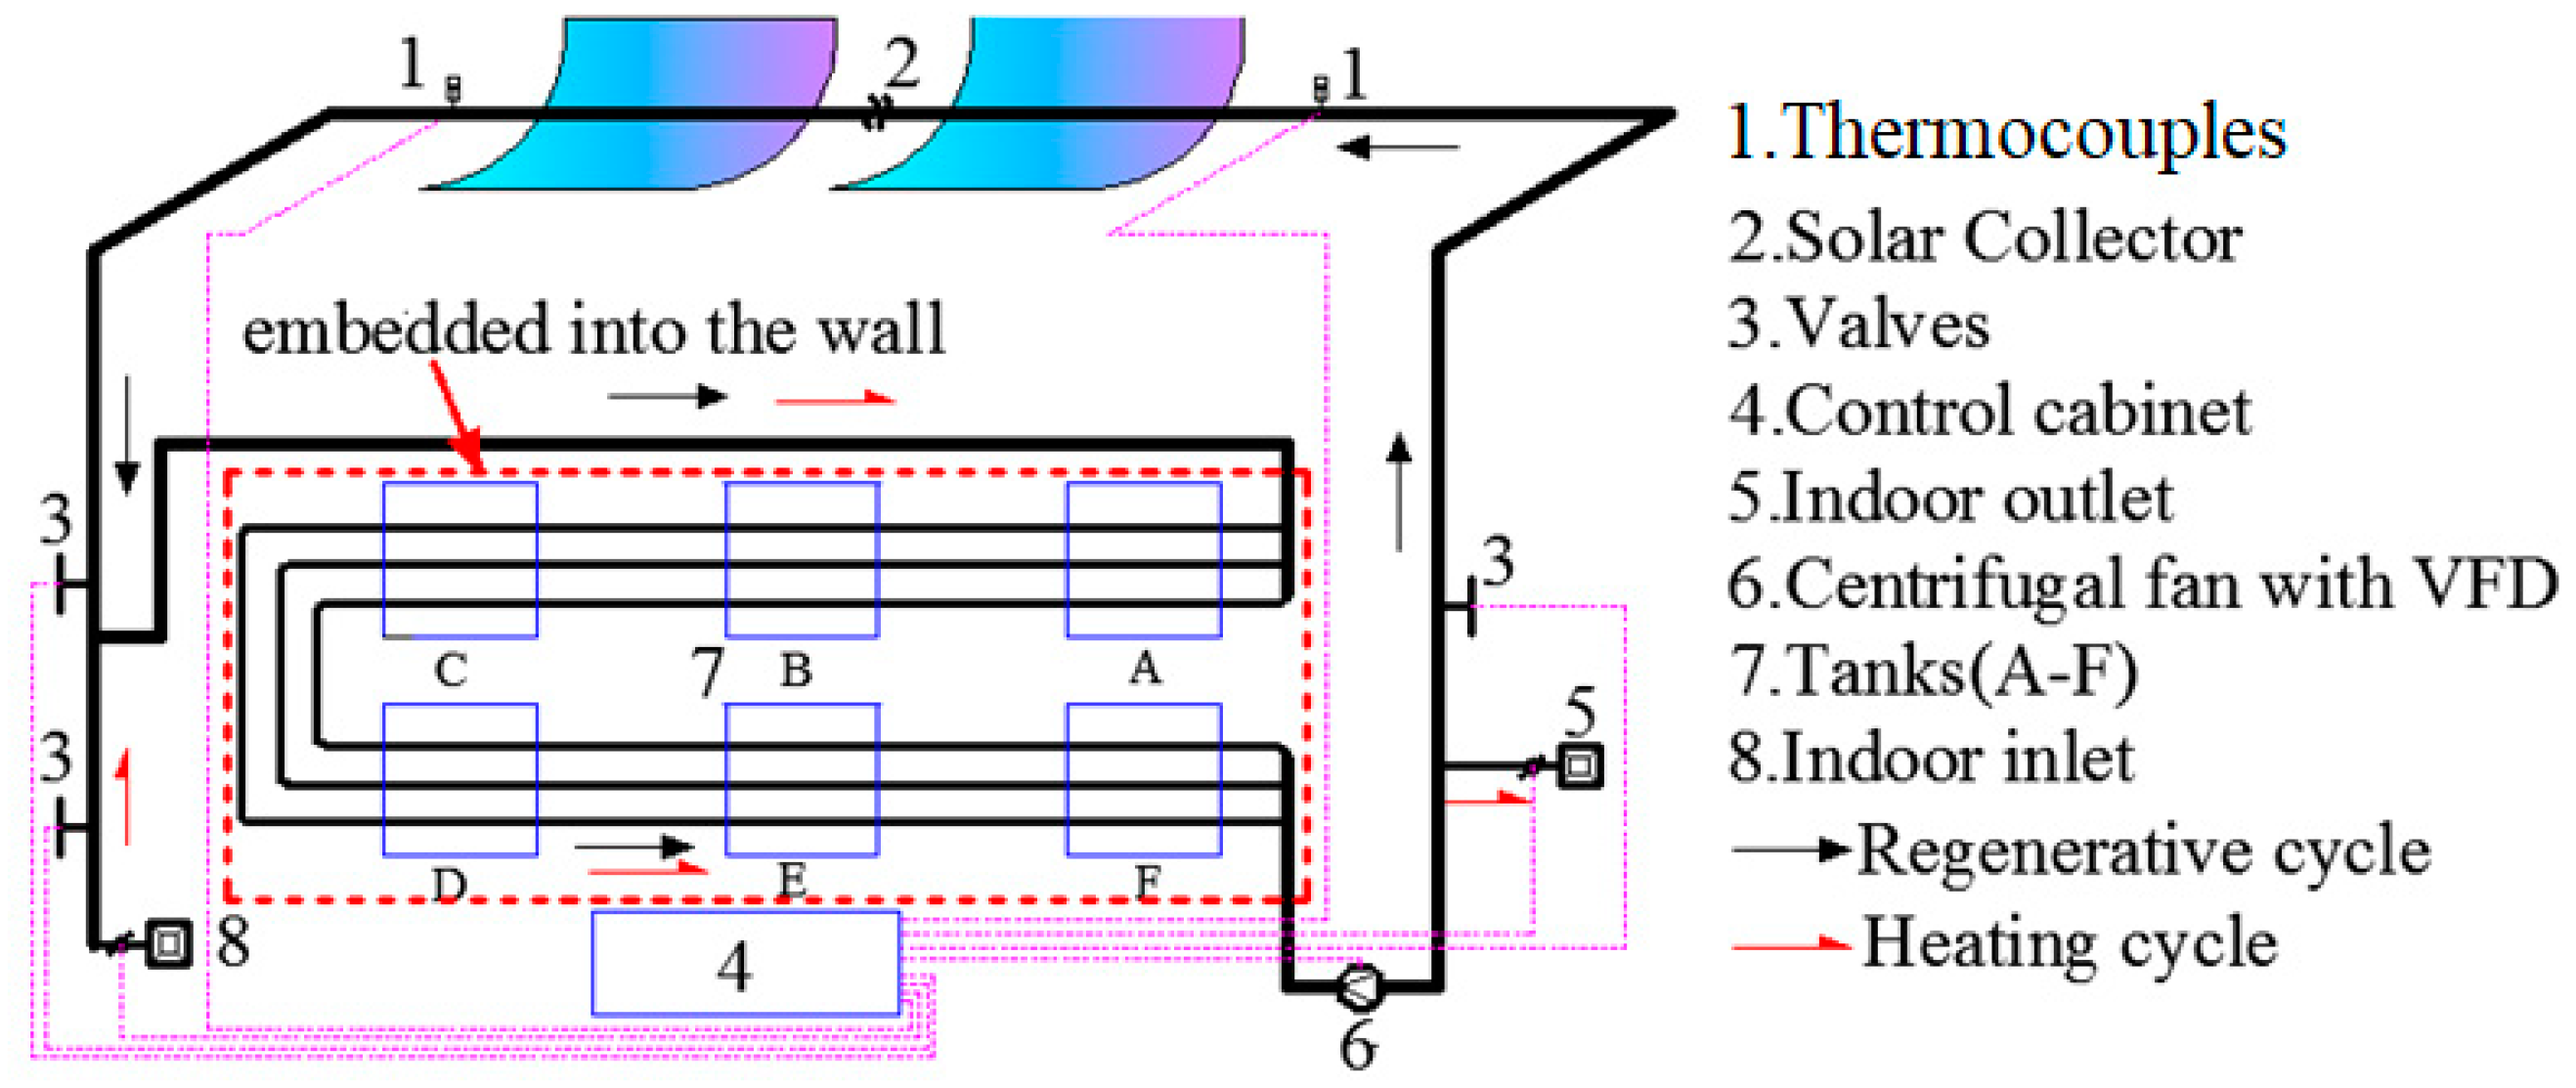
2.2. Experimental Setup

In this experiment, a CSG was constructed in the campus of Lanzhou Jiaotong University (longitude 103.88° E and latitude 36.05° N) in Gansu province, China. As shown in Figure 2, the CSG, facing south and extending along the east–west direction, was divided into two parts: one applied the above-mentioned system, while the other was for comparison. The two greenhouses have the same internal dimensions, 7 m in length and 6.88m in width. Figure 2a,b describes the structure of the two greenhouses in detail. It is particularly noteworthy that the front roof was covered with ethylene-vinyl acetate film (EVA film), which offers a high light transmittance and an improved anti-fogging droplet performance. Furthermore, a 40 mm thick insulation quilt has been laid on the top of the film to maintain the greenhouse warm at night (16:00 to 10:00 day + 1). As shown in Figure 2b,c, the proposed wall with the APHSWS from inside to outside was made up of a 120 mm inner bricklayer, 200 mm stainless steel tank and pipe layer, 370 mm outer bricklayer, 200 mm expanded polystyrene (EPS) board, 50 mm thick extruded polystyrene (XPS) board, 370 mm bricklayer and 10mm thick tiles. And six stainless steel tanks with a dimension of 0.8 m long × 0.8 m high × 0.2 m wide were embedded in the wall, each tank contained about 100 kg of PCM (paraffin wax), while the ordinary wall without the APHSWS had the same structure, but without the tanks, tube layers, and solar collectors. It played an important role in proving the thermal properties of the proposed wall as a comparison. The actual construction processes of the two greenhouses are shown in Figure 2d–g.
The paraffin wax was employed as a PCM because it is colorless and odorless with favorable thermos-physical properties, high latent heat, negligible undercooling, and an appropriate phase change point [38]. Moreover, different types of paraffin wax have different melting points; the paraffin wax used in this study as shown in Figure 3. Its Differential Scanning Calorimetry (DSC) curve, measured using model TASDT-DTA-2960 thermal analyzer (TA Instruments, New Castle, DE, USA) and based on a sample mass of 2.13 mg with a temperature increase of 2 °C/min when heated from 0 °C to 60 °C, its melting point, freezing point, heat of melting, and heat of freezing were found to be 28.7 °C, 23.8 °C, 217.2 J/g, and 206.7 J/g, respectively. The other thermos-physical properties of PCM are shown in Table 1.

2.3. Date Collection

Several important parameters were measured during the experimental tests, including, solar radiation intensity, indoor and outdoor air temperatures, wall temperatures at distinct locations, soil temperatures at the ground level and at depths of 10 cm and 30 cm, air temperatures and velocities at the outlet and inlet of the tube.
The outdoor air temperatures and solar radiation intensity were collected automatically by the PC-4 portable weather station. The two data acquisition devices (Keysight 34972A, Keysight Technologies, Santa Rosa, CA, USA) for recording and monitoring were composed of 76 T-type thermocouples with an accuracy of ±0.3 °C, which was calibrated in 0 °C ice water; Figure 2a–c shows the positions of these temperature measuring points. During the experiment, the air velocity was regulated and controlled by the frequency converter. The relationship between the air velocity and the frequency of the frequency converter is verified by the model 6112 anemometer. Furthermore, the power consumption of the frequency centrifugal fan was measured by an ammeter with an accuracy of 0.01 kWh. The above parameters were experimentally tested at intervals of 10 min.

2.4. Experiment Weather Conditions

For the study, we collected data from 15 December 2018 to 15 March 2019, more than 90 days. Figure 4 shows the weather parameters and trends during the experiment. Over the entire recording period, 46% were sunny days, 18% were cloudy, 29% were overcast, and the others were rainy and snowy days. The daily accumulated solar radiation energy changed between 3.86 MJ/m2 and 16.86 MJ/m2. Moreover, the outdoor air temperatures varied between −8.1 °C and 15.2 °C, with an average temperature of 1.87 °C. Subsequently, three representative days of varying weather (sunny, cloudy, and overcast) were selected to carry out the experimental analysis; they were 6 February (sunny day), 7 February (cloudy day), and 14 February (overcast day), respectively. For this period, the outdoor air temperatures and solar radiation intensity for the three representative weather types were depicted in Figure 5. The corresponding daily accumulated solar radiation energy was 14.17 MJ/m2 (sunny), 10.99 MJ/m2 (cloudy) and 7.71 MJ/m2 (overcast), respectively, and the outdoor air temperature variation range are −1.7 °C to 10 °C (sunny), −0.7 °C to 9 °C (cloudy), −0.9 °C to 9 °C (overcast). Meanwhile, considering the limited arrangement of measurement points in the experiment and some data that cannot be directly measured, in order to further observe the temperature distribution of various points inside the wall and the improvement of the thermal performance of the greenhouse and wall with the system, we adopted a combination of experimental and numerical simulation methods to further analyze the thermal performance of the wall. Subsequent numerical simulation used experimental data collected on 4 February 2019 at 10:00 and 6 February 2019 at 10:00 for result analysis. Figure 6 depicted the outdoor air temperature and solar radiation intensity used for the numerical simulation. The days chosen for analysis were sunny (with sufficient solar radiation and a maximum of 705 W/m2), with outdoor air temperatures ranging from −2.8 °C to 9.6 °C.

2.5. Performance Indicators

2.5.1. Inner Surface Temperature of North Wall of Greenhouse

During the daytime, solar radiation energy travels through the front roof to the inner surface of the north wall, where part of the solar energy is absorbed and conducted to the middle layer of the north wall. At the same time, for the proposed wall, the heated air flows into the stainless-steel coil pipes to heat the inner layer of the wall, and part of the heat has been transferred to the inner surface of the north wall.
When the indoor air temperature of the solar greenhouse drops at nighttime, the proposed wall and the ordinary wall conduct stored energy back to the inner surface, which then transfers heat from the inner surface of the wall to the indoor environment through heat convection and heat radiation. Therefore, the temperatures of the inner surface of the two walls are selected for comparison, demonstrating the effectiveness of the proposed wall system in improving the indoor air thermal environment in CSG [40].

2.5.2. Temperature Distribution of Wall

For the north wall of CSG, due to the effect of solar radiation, the temperature of the wall changes alongside the thickness direction through heat conduction in the daytime, followed by an improvement in the heat storage capacity. At night, when the indoor air temperature of CSG decreases, the heat stored in the north wall is released gradually into the CSG. Then, the temperature difference between the middle layer of the wall and the inner surface of the wall reduces, leading to less heat into the greenhouse, which reduces the heat release capacity of the wall. However, the proposed wall of the CSG is added with an active heat storage system incorporating PCMs. Compared with the ordinary wall of the CSG, the internal temperature distribution is a concrete manifestation of the function of the system. Thus, the temperature distribution of wall is another important performance indicator [24].

2.5.3. Heat Storage and Release Capacity of Wall

During the daytime, the heat preservation quilt is removed; thus, solar radiation energy can enter the greenhouse through polyethylene vinyl acetate film and irradiate the inner surface of north wall directly, causing a significant increase in north wall temperature, which can significantly increase the heat storage of north wall. This improvement in daily heat storage capacity can be obtained using Equation (1) [41].
Q ths = Q   ( 16 : 00   ) Q   ( 10 : 00 )
where Q (10:00) and Q (16:00) represent the wall internal energies of the day at 10:00 and 16:00, respectively.
At nighttime, the heat stored in north wall is released by conduction and natural convection and becomes the heat source of the indoor environment of CSG. Therefore, the daily heat release capacity is considered an important indicator that is available from Equation (2) as follows [19].
Q thr = Q   ( 16 : 00 ) Q   ( 10 : 00   day + 1 )
where Q (16:00) represents the wall internal energies of the day at 16:00, MJ/m2; Q (10:00 day + 1) represents the wall internal energies of the north wall of the next day at 10:00, MJ/m2.

2.5.4. Indoor Air Temperature and Daily Effective Accumulative Temperature

As mentioned above, the heat stored in the north wall was released into the CSG at nighttime, raising the temperature of indoor air. The aim is to provide a suitable thermal environment for the growth and development of crops during the off-season in winter. In the experiment, the average indoor air temperature is calculated by monitoring the temperature at different locations of the measurement points and evaluating the effect of the experimental wall on the improvement of the thermal comfort of the CSGs.
To appraise the environmental comfort of the CSGs, the agricultural experts put forward the daily effective accumulated temperature (DEAT) in combination with the biological zero temperature of the growth and development stage of crops. The DEAT is defined as the time integral of the difference between instantaneous operating temperature and biological zero temperature [36]. It reflects the maximum daily heat gain of a crop in a greenhouse environment, which is calculated according to Equations (3) and (4):
D E A T = 24 h Δ t ( τ ) d τ
Δ t = T air ( τ ) T 0 if T   air T 0 0 if T air < T 0
where DEAT is the daily effective accumulated temperature, °C. h; τ is time, h; Tair(τ) is the average temperature of indoor air at τ, °C; and T0 is the minimum acceptable temperature for crops, also known as biological zero temperature, °C. In this study, T0 is set at 5 °C, as defined by Butterfifield and Morison [42].

2.5.5. Soil Temperature

For the CSG, soil temperature plays a decisive role in the growth and development of greenhouse crops, and directly affecting the elongation and senescence of roots, and affecting the absorption of water and nutrients. It is not only an important environmental condition for the growth of greenhouse crops, but also a direct heat sources for indoor air temperature. Soil temperature is also influenced by the thermal properties of the wall of CSG. Therefore, soil temperature is one of the important indicators in the evaluation of greenhouse thermal environment impact.

2.6. Experimental Uncertainty Analysis

To evaluate the reliability of the experiment results, uncertainty analysis is required. The accuracy of the direct measurement parameters can be obtained directly from the measuring equipment used in the experiment. In the experiment, the parameters directly measured are temperature, air velocity, and solar radiation intensity, respectively. The accuracy of the T-type thermocouples is ±0.3 °C, that of the PC-4 portable weather station is ≤5% (solar radiation) and ±0.1 °C (temperature), the Model-6112 anemometer (Kanomax, Andover, NJ, USA) with an accuracy of 0.01 m/s.
For the indirect measurement parameters, uncertainties can be calculated from the relevant direct measurement parameters through the error transfer Equation (5) [41].
ω y = ( y x 1 δ ω 1 ) 2 + ( y x 2 δ ω 2 ) 2 + ( y x 3 δ ω 3 ) 2 + + ( y x n δ ω n ) 2
where y is a function composed of independent variables x1, x2, x3, xn; δω1, δω2, δω3, and δωn are the uncertainties of the independent variables x1, x2, x3, and xn, respectively, %; and ωy is the uncertainty of dependent variable, %.
The indirect parameters used in this study are the daily effective accumulated temperature, and the heat storage and heat release of the north wall. In accordance with Equation (5), the uncertainties of DEAT, heat storage and release capacity of the north wall are about 4% and 1%, respectively. The calculation results show that the uncertainty of the indirect parameter is less than 5%, and the calculation results are reliable.

3. Numerical Simulation and Model Validation

3.1. The Establishment of Numerical Model

During experimental testing, due to the inability to arrange measurement points continuously, the temperature data collected from various points inside the wall lacked continuity. Therefore, in order to obtain more accurate temperature changes at various points inside the wall and comprehensively analyze the thermal performance of the wall, numerical simulation methods were used, and two three-dimensional models were established, which are identical to the two actual greenhouses. An unstructured tetrahedron mesh was used to generate the grids of the model. The grid is refined to meet the solution of grid independence. The grid system schematic is presented in Figure 7.

3.2. The Assumptions of Numerical Model

Due to the complex heat transfer process of a CSG under the combined influence of multiple factors, it is difficult to fully consider it during numerical simulation. In order to facilitate simulation and analysis, and to reflect its heat transfer process to the maximum extent possible, the following assumptions need to be made to the model:
(1)
Consider the greenhouse wall to be isotropic, initially with a uniform distribution of temperature and humidity within the wall. The solid skeleton remains unchanged, the internal fluid does not undergo phase change or chemical reactions, and the material properties do not change with temperature (except for phase change materials), ignoring the contact thermal resistance at each contact surface.
(2)
Consider the greenhouse as a completely enclosed chamber, ignoring the effects of cold air infiltration and infiltration on heat transfer inside the greenhouse, ignoring the effects of crops and their transpiration and respiration.
(3)
Due to the temperature difference between the surrounding structures during the heat transfer process of a solar greenhouse, and considering that the air domain inside the greenhouse can cause natural convection, the Boussinesq hypothesis is adopted to deal with the buoyancy term generated.
(4)
This study uses numerical simulation methods to focus on the impact of the APHSWS on the heat storage and release of the entire wall, as well as the temperature distribution of the wall under the system. If a collector model is added, it will lead to complex modeling and increased computational difficulty. Therefore, this study will compile the test values of the collector outlet temperature into the solver through experiments.
(5)
Due to the large size and complex structure of numerical models, PCMs belong to the category of variable physical properties. Calculating the natural convection of liquid PCMs during melting requires a more precise grid structure, which will significantly increase the calculation time. Due to the placement of PCMs inside the box, the volume change during the solid–liquid phase transition of PCMs has a relatively small impact on the calculation of the entire model, the natural convection heat transfer of PCM in the box is relatively small. Therefore, the equivalent heat capacity method is used to treat PCMs as solid with temperature-dependent specific heat capacity, and the DSC curve measured in the experiment is used to define their specific heat capacity.

3.3. Governing Equations

The CSG is constantly exchanging heat and mass with the outdoors; this heat transfer and flow process are quite complicated, so its governing equations involve the law of conservation of mass, momentum, and energy, and the general control equation is shown in Equation (6).
( ρ φ ) / t + div ( ρ u φ ) = div ( Γ g r a d φ ) + S
where φ is the universal variable for the conservation of energy, momentum, and continuity equation; u is the velocity, m/s; ρ is the density, kg/m3; Γ is the diffusion coefficient, m2/s; and S is the source terms.

3.4. Turbulence Model

According to the structural parameters of the CSG and the demands of greenhouse crops for the indoor thermal environments, the Reynolds number of airflow in the tube of the active system is above the threshold of 2300 [39] and can be considered turbulence flow. Assuming that the flow is incompressible, the RNG k-ε model is applied for circular tubes as follows [43]:
( ρ k ) t + ( ρ k i u i ) x i = x j [ ( μ + μ t σ k ) k x j ] + G k + G b ρ ε Y M
( ρ ε ) t + ( ρ ε μ i ) x i = x j [ ( μ + μ t σ ε ) ε x j ] + C 1 ε ε k G k C 2 ε ρ ε 2 k
where ε the turbulence energy dissipation; k is the turbulence kinetic energy; Gk is the generation of turbulence kinetic energy due to the mean velocity gradients; Gb is the generation of turbulence kinetic energy due to buoyancy; YM is the contribution of the fluctuating dilatation in compressible turbulence to the overall dissipation rate; σk and σε are the turbulent Prandtl numbers for k and ε, respectively; and C, C are the constants.

3.5. Radiation Model

During the daytime, the solar radiation heats the indoor air, soil, and wall surface via the front roof of the solar greenhouse directly, and radiant heat exchanges between the envelope and the air. Therefore, the radiation model should be turned on for calculation; simultaneously, the DO model should be used for radiant heat transfer calculation. This study is based on Equation (9) [43].
( I ( r , s ) s ) + ( a + σ s ) I ( r , s ) = a n 2 σ T 4 π + σ s 4 π 4 π I ( r , s ) Φ ( s , s ) d Ω
where r, s, s′ are position vector, direction vector, and scattering direction vectors, respectively; a, σs, n are the absorption coefficient, scattering coefficient, and refractive coefficient, respectively; σ is Stephen Boltzmann’s constant; T is the local temperature, K; I is the solar radiation intensity; Φ is phase function; and Ω is the solid angle.
The Solar Loading model will be activated and the Solar-Ray Tracing will be used to input geographic location and timing region and import the solar radiation intensity of that day.

3.6. Grid Independence Verification

Occasionally, the finer grids do not guarantee higher accuracy [44]. For this reason, three meshes with grid numbers of 1638893, 2476732, and 3350270 were generated by Gambit 2.4. The comparison of simulation results and experimental results are shown in Table 2. It can be seen from Table 2 that the average error with the grid number of 2476732 is 0.27% lower than that of 1638893, but its maximum error is reduced by 8.93%, and the difference between the maximum error and the average error is small compared with the grid number of 3350270, but the calculation time for the grid number of 2476732 is 15 h less than that of 3350270. To ensure the simulation accuracy and save calculation time, the mesh with 2476732 grids was used for simulation.

3.7. Initial and Boundary Conditions

3.7.1. Initial Conditions

In this simulation, the temperature inside each enclosure structure in the greenhouse at 10:00 is taken as the initial condition. Because the temperature at different thicknesses of the wall changes with its thickness, the internal temperature tested two days in advance is used by the wall and the air as the overall temperature of this part, as shown in Table 3.

3.7.2. Boundary Conditions

The external surfaces of the roof and walls transfer heat with the outdoor environment in the form of convection; therefore, convective boundary conditions are used for them, and the convection temperature is the outdoor temperature. The relationship between the convective heat transfer coefficient and air velocity is as follows [45]:
h = 18.63 × ( 0.5 u ) 0.605
where h is the convection heat transfer coefficient of wall surface and roof surface, W/(m2 °C); and u is outdoor air velocity, m/s.
To simulate and analyze the thermal performance of the wall system under the experimental conditions, the tested outdoor air temperatures are used as the simulated outdoor air boundary condition. The Fourier expansion method is used to obtain the function expression of outdoor air temperature versus time, and the expression is defined as a User Defined Function (UDF) in Fluent to set its boundary conditions. The internal heat and mass transfer process within the soil is complex. To simplifies the calculation; therefore, the soil surface temperature is set as the measured temperature by using another UDF definition. Moreover, the east and west walls are considered insulated. The PCMs are treated as solids, and the equivalent specific heat capacity is used to replace the heat absorbed and released during their phase change process. Regardless of the difference in phase change temperature, we divide their specific heat capacity into three sections to represent the equivalent specific heat capacity is 1700 J/(kg·K) at temperatures ranging from 100 K to 301.29 K, and 46,187 J/(kg·K) at temperatures ranging from 301.29 K to 305.87 K. At temperatures ranging from 305.87 K to 500 K, it is 1900 J/(kg·K).

3.8. Operating Conditions and Solution Controls

ANSYS Fluent was selected as the simulation solver in this study. In the solution setting, the energy equation, RNG k-ε turbulence model and DO radiation model were set and turned on; the coupling problem of pressure and velocity in the momentum equation was solved using the SIMPLE algorithm; the discrete schemes of momentum and energy equations were both applied a second-order upwind, the others were a first-order upwind. The time step was set at 60 s, the residual convergence standard of the energy equation was 10−6, and the others were 10−3. In addition, the PCMs were considered a solid material with variable specific heat capacity [45]. In the heat transfer process, the heat conduction dominated [46], while the effects of heat convection could be negligible within the PCMs.

3.9. Verification of Heat Transfer Model of CSG

To assess and verify the reliability and accuracy of the two greenhouse models established, the indoor air temperatures of the greenhouse were used as the comparison parameters in this study. The simulated values of the two models were compared and analyzed with the measured values of the experimental greenhouse, as shown in Figure 8. From Figure 8, it can be seen that, under typical sunny conditions, the variation trends of the simulated values of the two greenhouse models established were consistent with the experimental values, and the results were in good agreement with the experiment values. The maximum and average relative errors of the proposed greenhouse with the APHSWS were 14.14% and 3.73%, respectively, while those of the ordinary greenhouse without the APHSWS were 19.4% and 6.02%, respectively. The largest relative errors were all at 9:00 a.m. on 5 February. At this time, the indoor air temperature was lower and, thus, the relative error deviations were slightly larger.
Through the above analysis, all errors meet the requirements, it is proved that the established models are reliable, the model assumptions are reasonable; thus, the numerical methods used are reliable and can be used for the simulation calculation of other conditions in this study.

4. Results

4.1. Experimental Results

Based on the experimental data, this section analyzes the improvement effect of using the APHSWS on the temperature of the entire greenhouse internal thermal and humidity environment compared to ordinary walls, using four indicators: temperature on the north wall of the greenhouse, indoor air temperature of the greenhouse, soil temperature, and daily effective accumulated temperature.

4.1.1. Analysis of Inner Surface Temperature of North Wall

When solar radiation enters the greenhouse through the front roof, it directly irradiates the surface of the north wall of greenhouse, and a portion of the heat is transferred to the interior of the wall for storage through the inner surface. At the same time, the surface of the wall undergoes convective and radiative heat exchange with the greenhouse environment and crops. Therefore, the temperature of the inner wall surface directly affects the greenhouse environment.
Figure 9 illustrates the inner surface temperature of north walls of the two greenhouses under different weather conditions. What was striking in this figure was that the temperatures vary periodically and had a similar trend. From the data in Figure 9, it was apparent that the inner surface temperature of the proposed wall with the APHSWS was invariably higher than that of the ordinary wall without the APHSWS. Firstly, we analyze the sunny and cloudy conditions. For sunny days, as solar radiation increased, the inner surface temperature of the walls gradually increased, reaches the maximum value at 15:00, and then gradually decreased as solar radiation weakened. While the sharp rise was at 14:00 on cloudy days, its maximum temperature and temperature rise are smaller than sunny days. In the daytime, the maximum temperature difference between the proposed wall and the ordinary wall were 8.92 °C (sunny) and 6.34 °C (cloudy), and the average temperature difference were 6.58 °C (sunny) and 5.00 °C (cloudy), respectively. At night, due to the low outdoor temperature in winter in northern China, the temperature of the wall directly determines the amount of heat released by the greenhouse wall, which in turn affects the thermal environment and crop growth inside the greenhouse, the maximum temperature difference between the two walls were 6.0 °C (sunny) and 5.10 °C (cloudy); the average temperature differences were 4.71 °C (sunny) and 3.70 °C (cloudy). The heat insulation quilt was covered on the film for keeping warm to reduce the heat loss of CSG during overcast days; therefore, the inner surface temperature of walls changed gently as shown in Figure 9; the maximum and the average temperature difference between the two walls were 3.62 °C and 2.71 °C, respectively.
According to the analysis of the surface temperatures inside the two types of walls mentioned above, regardless of whether it is sunny, cloudy, or overcast, the inner surface temperature of the wall of greenhouse with the APHSWS was higher than that of the wall of greenhouse without the APHSWS. This result implies that the wall of greenhouse with the APHSWS can provide more heat to the interior of the wall and crops inside the greenhouse, improving the cold resistance of crops in the winter night greenhouse.

4.1.2. Analysis of Indoor Air Temperature of Two CSGs

The environmental temperature inside a solar greenhouse plays a crucial role in the growth of crops, directly affecting their growth. Especially in the northern regions of China, the winter is relatively cold. If the indoor temperature of the greenhouse is too low during colder times at night, it can lead to phenomena such as crop freezing and death, causing losses to agricultural production.
Figure 10 depicts the changes in the indoor air temperature of the two CSGs over time under different weather conditions. It can be seen from Figure 10 that the indoor air temperature of the two CSGs showed a positive correlation with the change in the outdoor solar radiation intensity, and its temperature peak values were delayed compared with the peak values of the solar radiation intensity (see Figure 5). Under different weather conditions, the change trends of the indoor air temperatures of the two CSGs were generally similar, but the air temperatures in the greenhouse of the proposed wall with the APHSWS were always higher than that of the greenhouse with an ordinary wall without the APHSWS at different times. From 10:00 to 16:00, the average indoor air temperatures of the proposed wall greenhouse were 23.0 °C, 18.9 °C, and 12.6 °C on sunny, cloudy and overcast days, while that of the ordinary wall greenhouse were 16.9 °C, 15.4 °C, and 10.3 °C, respectively; the maximum air temperature differences between the proposed wall and ordinary wall greenhouse were 10.6 °C (sunny), and 5.5 °C (cloudy), and its average differences were 6.06 °C (sunny), and 3.48 °C (cloudy) from 10:00 to 16:00. At night, i.e., from 16:00 to 10:00 (day + 1) when the heat preservation quilt was turned off, the average indoor air temperatures of the proposed wall greenhouse were 12.6 °C, 10.7 °C, and 9.1 °C on sunny, cloudy, and overcast days, while that of the ordinary wall greenhouse were 10.0 °C, 8.5 °C, and 7.6 °C, respectively. The lowest temperature of the former in sunny and cloudy days was 8.7 °C and 7.9 °C, respectively, while that of the latter was only 6.7 °C and 6.3 °C. As shown in Figure 10, the indoor air temperature in the proposed greenhouse was high throughout the day on overcast days, despite the heat insulation quilt covering the film. The largest difference between the two CSGs was 2.5 °C, with an average difference of 1.58 °C.
According to the analysis of the environmental temperature of the two types of solar greenhouses mentioned above, regardless of whether it is sunny, cloudy or overcast, the indoor air temperature of greenhouse with the APHSWS was higher than that of ordinary greenhouse without the APHSWS, it can be seen that the indoor thermal environment of the proposed wall greenhouse is more conductive to crop growth, improving a more suitable living environment for crops.

4.1.3. Comparative Analysis of Soil Temperature

Soil temperature plays an important role in seedling growth and root development of crops; if the soil temperature is too low, it will have adverse effects on crops, especially in a cold winter, when crops will freeze to death.
As mentioned earlier, the proposed wall also has an impact on the soil temperature. Figure 11 reported the changes in soil surface temperature of the two CSGs over time under different weather conditions. As shown in Figure 11, the soil temperatures of two CSGs increased rapidly due to the outdoor solar radiation in the daytime, but the soil temperatures in the greenhouse of the proposed wall were always higher than in the ordinary wall greenhouse at different times. The maximum differences in soil temperature between the proposed wall greenhouse and ordinary wall greenhouse were 9.4 °C (sunny day) and 6.0 °C (cloudy day), and the average differences in soil temperature were 6.39 °C (sunny day) and 4.42 °C (cloudy day).
At a depth of 10cm, on sunny and cloudy days, the soil temperature of the two greenhouses will also increase with the increase in solar radiation. However, compared to the soil surface, the increase is relatively small. The maximum difference in soil temperature between the proposed wall greenhouse and the ordinary wall greenhouse is 3.1 °C (sunny) and 2.9 °C (cloudy), with an average difference in soil temperature of 2.61 °C (sunny) and 2.51 °C (cloudy).
As the soil depth continues to increase, at a depth of 30 cm, the amplitude of temperature change with the greenhouse environment is smaller. Whether it is the maximum difference in soil temperature or the average difference, it is smaller than the difference between the soil surface and the depth of 10 cm. At a depth of 30 cm, soil temperature changes are less affected by environmental temperature, but the soil temperature of the proposed wall greenhouse was still higher than the ordinary wall greenhouse. The maximum difference in soil temperature between the proposed wall greenhouse and the ordinary wall greenhouse is 1.6 °C (sunny) and 1.0 °C (cloudy), with an average difference in soil temperature of 1.4 °C (sunny) and 0.7 °C (cloudy).
At nighttime, as the indoor air temperature of the greenhouse dropped, the greenhouse soil gradually released its stored heat into the indoor air, causing the soil temperature to gradually drop as well, reaching the lowest value at 9:00 in the next day. Due to the better thermal environment of the proposed wall greenhouse (see Figure 10), the soil temperature of proposed wall greenhouse was always higher than that of the ordinary wall greenhouse, and the soil stored more heat. The average temperature differences at the soil surface and at depths of 10 cm and 30 cm between the proposed wall and ordinary wall greenhouse were 2.8 °C (sunny) and 2.3 °C (cloudy), 2.6 °C (sunny) and 2.1 °C (cloudy), 1.1 °C (sunny) and 0.91 °C (cloudy), respectively. From the experimental data in Figure 11, even on the overcast day, the soil temperature of the proposed wall greenhouse was also higher than that of the ordinary wall greenhouse, indicating that the proposed greenhouse has a positive impact on crop growth. The maximum soil temperature difference between the two greenhouses were 2.52 °C, 2.63 °C and 1.11 °C, and the average soil temperature difference was 1.71 °C, 1.94 °C and 1.0 °C, respectively.
By comparing the soil temperature of two types of solar greenhouses, the temperature changes on the soil surface, at a depth of 10 cm and at a depth of 30 cm under three different weather conditions were analyzed; the soil temperatures of greenhouse with the APHSWS were significantly higher than that of the ordinary wall greenhouses, especially under sunny and cloudy conditions, indicating that greenhouse with the APHSWS can better help crop growth.

4.1.4. Daily Effective Accumulative Temperature

The daily effective accumulative temperature is an indicator of heat demand for crop growth and development and its value reflects the influence of wall on the indoor thermal environment. Therefore, it was calculated and compared for the recorded period; Figure 12 shows the daily effective accumulative temperature of two CSGs during the experiment period. The proposed wall greenhouse has a good effect on increasing the daily effective accumulative temperature. The proposed wall has a maximum of 443.3 °C h and an average of 127.1 °C h, while the ordinary wall greenhouse has a maximum of 390.0 °C h and an average of 84.8 °C h, with a maximum increasing rate of 13.7% and an average increasing rate of 49.9%.
It is particularly noteworthy that in December, January, February, and March, when we used the proposed greenhouse with the APHSWS, the DEAT of each month were 1.39, 1.18, 0.60, and 0.20 times higher than that of the ordinary greenhouse without the APHSWS, respectively. Combined with Figure 4, it can be seen that the proposed greenhouse has a greater impact on increasing daily effective accumulated temperature in December and January when the outdoor temperature was cooler.

4.2. Analysis of Simulated Result

During experimental testing, due to limited internal measurement points, it was not possible to obtain the temperature of all points inside the wall. Secondly, when evaluating the heat storage and release capacity of the wall, due to the limited number of measurement points, the temperature data obtained was limited, making it impossible to accurately calculate the heat storage and release capacity of the entire wall, achieving an objective evaluation of the heat storage and release capacity of the wall. Therefore, in order to further study the improvement effect of using the APHSWS on the temperature and heat storage and release at various points inside the greenhouse wall compared to ordinary walls, this section used numerical simulation methods to analyze the temperature changes inside the wall with APHSWS and the increase in heat storage and release under typical sunny conditions.

4.2.1. Comparison of the Internal Temperature Distribution of the Two Walls

According to previous research, common solar greenhouses often use passive heat storage on the walls, resulting in a thicker internal temperature stabilization layer and less heat released into the greenhouse at night; the higher temperature inside the wall, the more heat can be released into the greenhouse at night, and the corresponding increase in environmental temperature inside the greenhouse, which is more conducive to crop growth. Therefore, combined with the established numerical models of heat transfer in CSG, as 10:00 a.m. was the start time for opening the insulation and storing heat, and 16:00 p.m. was the heat release stage for closing the insulation and releasing heat from the wall, the calculated temperature distribution of the north wall on typical sunny days of 16:00 on 4 February and 10:00 on 5 February will be analyzed.
It can be seen from Figure 13 that the active heat storage system was embedded in the north wall, the proposed wall temperatures were always significantly higher than the ordinary wall temperatures at different times, ranging from 0 mm to 920 mm. When the insulation quilt was turned off at 16:00, the maximum and the average temperatures of the proposed wall were 10.55 °C and 5.09 °C higher than that of the ordinary wall from 0 mm to 920 mm, respectively. From the inner brick layer to the XPS layer, the temperatures of each layer of the proposed wall were 8.60 °C, 8.56 °C, 4.04 °C, 2.48 °C and 0.82 °C higher than the temperatures at the same position of the ordinary wall, respectively.
When the heat release was completed (10:00 day + 1), the temperature of the proposed wall was 6.44 °C higher than the ordinary on maximum and 4.44 °C higher on average from 0 mm to 920 mm. From the inner brick layer to the XPS layer, the temperatures of each layer of the proposed wall were 5.73 °C, 6.14 °C, 4.50 °C, 2.82 °C and 0.90 °C higher than the temperature at the same position of the ordinary wall. The temperatures of the proposed wall were higher than 14 °C from 0 mm to 400 mm, and the temperature of the proposed wall was higher than its indoor air temperature (9.87 °C) from 0 mm to 760 mm, while the ordinary wall was no higher than 14 °C, the temperature of the ordinary wall was higher than its indoor air temperature (7.92 °C) from 0 mm to 520 mm, accounting for only 68.4% of the proposed wall. In addition, the temperature fluctuation within the two greenhouse walls was relatively mild, with a smaller amplitude in the range of 940–1320 mm outer brick layer. Especially within the thickness range of 1200–1320 mm on the outer wall, it can be seen that the average temperature of the two walls was basically the same when approaching the outermost side of the wall. Because the thickness range was already outside the insulation layer (XPS, EPS), the heat stored inside the wall cannot be transferred to this area. The heat loss of both walls was relatively large. However, according to the data, the average temperature of the new wall and the ordinary wall at 16:00 was 5.26 and 5.11 °C. At 10:00 (day + 1), the average temperature was 1.82 and 1.67 °C, indicating that the temperature of the APHSWS wall was still higher than that of a regular wall.
Through the above analysis, it can be seen that the active heat storage system of CSG can effectively improve the internal temperature of thermal storage wall. Even at the end of the heat release of wall, the internal temperature of the proposed wall with the APHSWS was always significantly higher than that of the ordinary wall without the APHSWS. The results further confirmed the effectiveness of the active–passive heat storage wall system.

4.2.2. Analysis of Heat Storage and Release Capacity of North Wall

The heat storage and release capacity of the wall directly affects the indoor air temperature of the greenhouse. Previous research on the heat storage of solar greenhouse walls has shown that encapsulating and pasting PCMs onto the walls of the greenhouse effectively transfers the solar energy absorbed during the day to the interior of the wall. Insufficient heat storage during the day results in less heat release at night, which may lead to crop freezing. Therefore, this section compares the heat storage and release of two wall temperature chambers to analyze the advantages of APHSWS compared to regular greenhouses.
From the analysis result of Section 4.1.1, the proposed wall can effectively improve the temperature and heat storage performance of wall. To prove this, the heat storage and release capacities of the two walls were calculated by using Equations (1) and (2). Figure 14 presented the heat storage and release capacity of the proposed wall with the APHSWS and the ordinary wall without the APHSWS on three representative days. The heat storage capacities of the ordinary wall were 2.45 MJ/m2, 2.16 MJ/m2, and 2.21 MJ/m2, while the heat storage capacities of the proposed wall were 4.89 MJ/m2, 3.75 MJ/m2, and 4.01 MJ/m2, compared to ordinary walls, which were increased by 2.44 MJ/m2, 1.59 MJ/m2, and 1.80 MJ/m2, respectively, 1.99, 1.73, and 1.81 times as higher than that of the ordinary wall. Compared with the latter, the former increased by 79.0%, 54.6%, and 51.8%, respectively. On the other hand, the heat release capacities of the ordinary wall were 1.64 MJ/m2, 1.46 MJ/m2, and 1.48 MJ/m2. While these values of the proposed wall were 2.73 MJ/m2, 2.43 MJ/m2, and 2.65 MJ/m2, respectively, all higher than the values of the ordinary wall, the increase amounts were 1.09 MJ/m2, 0.97 MJ/m2, and 1.17 MJ/m2, respectively, with rates of increase of 66.0%, 65.7%, and 79.1%, respectively. Furthermore, solar radiation contributes positively to the heat storage capacity of both walls. On 4 February, the solar radiation value was the largest in the three representative days, and both walls had the highest heat storage capacity, while lowest capacity was on 5 February because of the smallest solar radiation value. The heat release capacity was affected by the outdoor air temperature positively at nighttime. Therefore, the highest heat release capacity of both walls was on 4 February and the lowest on 5 February.

4.3. Economic Analysis of the Wall System Operation

The power consumption of the CSG with the proposed wall consists of three parts, i.e., the centrifugal fan power when the active heat storage system was running, the motor power when switching the insulation blanket and the lighting power. Since the motor was only turned on twice a day, the running time was very short, and the lighting equipment was also rarely turned on, the power consumption of the two parts was neglected. According to the division of peak period and price adjustment in Gansu Province in 2021 [47], the specific policies are as follows: The peak period: 7:00–9:00, 18:00–24:00; Low period: 2:00–4:00, 11:00–17:00; Parity was other than peak and low for other times. Price adjustment: The floating standard of the peak-to-valley price difference remains unchanged, that is, the peak period standard was increased by 50% based on the flat section standard, the low period standard was increased by 50% based on the flat section standard, and the residential electricity consumption in the flat section was 0.51 CNY/kWh, the low period was 0.261 CNY/kWh. We calculated the operating costs. It is known that the system was open from 10:00 to 16:00 during the day, which was at parity and through most of the time. During the experimental period, the power consumption and operating costs of the APHSWS are shown in Table 4. It can be seen that the total consumption of the APHSWS in winter only needed CNY 31.32, and the operating cost was lower.

5. Discussion and Limitations of Results

This study focuses on the comparative study of the thermal performances of greenhouse with the APHSWS in the active–passive heat storage during the daytime and passive heat release at night in winter. In the future, with the further development of facility agriculture, the demand for regulating the thermal and humid environment inside greenhouses will gradually increase for different greenhouse crops. The APHSWS can effectively solve the problems that traditional greenhouses encounter. By combining active and passive collaborative control, the heat storage and release of the greenhouse environment and walls can be improved, achieving dynamic regulation, and provide guidance for the development of CSG in the future. At the same time, the active heat storage and release of the APHWS rely on manual operation, and the amount of ventilation in the pipeline cannot be adjusted in a timely manner according to the needs of crop growth, especially at night. further research is needed on the operation mode and control strategy of the system in the future on how to combine a multifunctional control box to propose a mature control system, and set corresponding thresholds based on the environmental temperature requirements of crops at different time periods, and how to implement corresponding threshold control systems according to different time requirements in the greenhouse, so that make the entire control system can achieve automatic regulation and dynamic heat storage and release, improve the thermal environment in the greenhouse in real time, and enhance its reference value in practical engineering applications. In addition, according to the temperature distribution of the wall in Section 4.2.1, it can be seen that the thickness of the wall can be further optimized to reduce the footprint of the wall and reduce the construction cost.

6. Conclusions

To effectively increase the internal temperature and heat storage capacity of the north wall of CSG, and improve the indoor thermal environment of CSG, this paper proposed a new active–passive heat storage wall system (APHSWS) incorporating PCMs in the CSG and conducted comparative experiments between a CSG with the APHWSW and an ordinary greenhouse without the APHWSW in Lanzhou to demonstrate the contribution of the APHSWS to promoting the thermal performance of the CSG and its internal temperature of thermal storage wall. Moreover, the two 3D heat transfer models of the CSG containing the proposed APHSWS and without the APHWSW were also established and the reliability of the heat transfer models was verified by experimental data. Based on the several key parameters of thermal environment evaluation, the effectiveness of the APHSWS was compared and evaluated by experimental and numerical methods. The main conclusions are as follows:
(1)
The established heat transfer models of the CSG containing the proposed APHSWS and without the APHWSW were validated by the experimental data with the average relative error being 3.73% and 6.02%, respectively. Thus, the established models are reliable.
(2)
The wall of greenhouse with the APHSWS can effectively increase the surface temperature of greenhouse wall in winter. In typical sunny weather, the average temperature of the inner surface of the wall with APHSWS during the daytime heat storage stage was 6.58 °C higher than that of wall without the APHWSW, and during the nighttime heat release stage, it was 4.71 °C higher than that of wall without the APHWSW. For overcast conditions, without sufficient solar radiation shining on the walls, the average temperature of the wall with APHSWS throughout the day was still 3.62 °C higher than that of wall without APHSWS.
(3)
Regardless of whether it is sunny or cloudy, the indoor air temperature of the greenhouse with the APHSWS was higher than that of the greenhouse without APHSWS. Compared with the greenhouse without the APHSWS, the average indoor air temperature of the greenhouse with the APHSWS has increased by 6.06, 3.48 and 1.58 °C, respectively. Similarly, under different weather conditions, the average soil temperature of the greenhouse with the APHSWS can be increased by 0.91–6.39 °C. Moreover, the greenhouse with the APHSWS had the monthly average daily effective accumulated temperature of 1.39 times, 1.18 times, 0.60 times and 0.20 times that of the greenhouse without the APHSWS, respectively.
(4)
The proposed wall with the APHSWS can significantly increase internal temperature and promote the heat storage and release capacity of the greenhouse wall, compared with the ordinary wall without the APHSWS in three typical sunny days, the daytime heat storage capacity of the proposed wall increased by 2.44 MJ/m2, 1.59 MJ/m2, and 1.80 MJ/m2, respectively, and the nighttime heat release increased by 1.09 MJ/m2, 0.97 MJ/m2, and 1.17 MJ/m2, respectively. The increase in heat storage and release on the wall can provide a more suitable growth environment for crops in winter.
(5)
The operating cost analysis for the APHSWS was conducted according to its energy consumption; the maximum energy consumption of the APHSWS was CNY 31.32 in winter, and the operating cost was low.
In summary, in the cold winter of northern China, the APHSWS wall system can effectively increase the temperature of greenhouse walls, increase wall heat storage and release, improve the thermal–humidity environment inside the greenhouse, enhance the cold resistance of crops in winter, and provide a more suitable living environment for crops.

Author Contributions

Conceptualization, Y.G. and W.H.; methodology, W.H.; software, Y.C. and Z.W.; validation, Y.G., Y.C. and L.Z.; formal analysis, Y.C.; investigation, Z.W., Y.Y. and Y.C.; resources, W.H.; data curation, Y.C. and W.H.; writing—original draft preparation, Y.G. and Y.C.; writing—review and editing, Y.G., W.H. and L.Z.; visualization, Z.W. and Y.Y.; supervision, Y.G.; project administration, W.H.; funding acquisition, Y.G. and W.H. All authors have read and agreed to the published version of the manuscript.

Funding

This study was supported by the National Natural Science Foundation of China (grant numbers 51868035, 51866006), and the Science and Technology Plan of Gansu Province (grant number 18JR3RA121).

Institutional Review Board Statement

Not applicable.

Informed Consent Statement

Not applicable.

Data Availability Statement

The data presented in this study are available in the article.

Conflicts of Interest

The authors declare no conflicts of interest.

Nomenclature

Qthe wall internal energies of the day (MJ m−2)
QthsDaily heat storage capacity (MJ m−2)
QthrDaily heat release capacity (MJ m−2)
Tairaverage temperature of indoor air at τ (°C)
T0biological zero temperature (°C)
uVelocity (m s−1)
Ssource terms
εturbulence energy dissipation m2 s−3
Gkgeneration of turbulence kinetic energy due to the mean velocity gradients (kg s−2·m−1)
Gbgeneration of turbulence kinetic energy due to buoyancy (kg s−2·m−1)
YMcontribution of the fluctuating dilatation in compressible turbulence to the overall dissipation rate, (kg s−2·m−1)
σkturbulent Prandtl numbers for k
σεturbulent Prandtl numbers for ε
hconvection heat transfer coefficient of wall surface and roof surface (W m−2 °C−1)
rposition vector
sdirection vector
s′scattering direction vectors
aabsorption coefficient (1/m)
σsscattering coefficient (1/m)
nrefractive coefficient (1/m)
Tlocal temperature (K)
DEATdaily effective accumulated temperature (°C)
Greek letters
ρDensity (kg m−3)
Γdiffusion coefficient (m2 s−1)
σStephen Boltzmann’s constant (W m−2.k−4)
Isolar radiation intensity (W m−2)
Φphase function
Ωsolid angle (1802 π−2)
τtime (h)
φuniversal variable for the conservation of energy, momentum, and continuity equation
Abbreviations
APHSWSactive–passive heat storage wall system
CSGChinese solar greenhouse
DEATdaily effective accumulated temperature
PCMPhase change material

References

  1. Sims, R.; Flammini, A.; Puri, M.; Bracco, S. Opportunities for Agri-Food Chains to Become Energy-Smart. 2015. Available online: http://www.fao.org/3/i5125e/i5125e.pdf (accessed on 20 November 2015).
  2. Department of Economic and Social Affairs-United Nations. The World Population Prospects: 2015 Revision. 2015. Available online: https://www.un.org/en/development/desa/publications/world-population-prospects-2015-revision.html (accessed on 20 November 2015).
  3. Food and Agriculture Organization of the United Nations. Enery-Smart Food for People and Climate: Issue Paper. 2011. Available online: http://www.fao.org/3/i2454e/i2454e00.pdf (accessed on 29 November 2011).
  4. Stevens, L.; Gallagher, M. The Energy–Water–Food Nexus at Decentralized Scales: Synergies, Trade-Offs, and How to Manage Them; Practical Action Publishing: Rugby, UK, 2015. [Google Scholar] [CrossRef]
  5. Pittelkow, C.M.; Liang, X.Q.; Linquist, B.A.; Linquist, A.; van Groenigen, K.J.; Lee, J.; Lundy, M.E.; Gestel, N.V.; Six, J.; Venterea, R.T.; et al. Productivity limits and potentials of the principles of conservation agriculture. Nature 2015, 517, 365–368. [Google Scholar] [CrossRef]
  6. Allardyce, C.S.; Fankhauser, C.; Zakeeruddin, S.M.; Grätzel, M.; Dyson, P.J. The influence of greenhouse-integrated photovoltaics on crop production. Sol. Energy 2017, 155, 517–522. [Google Scholar] [CrossRef]
  7. Huang, L.; Deng, L.; Li, A.; Gao, R.; Zhang, L.; Lei, W. A novel approach for solar greenhouse air temperature and heating load prediction based on Laplace transform. J. Build. Eng. 2021, 44, 102682. [Google Scholar] [CrossRef]
  8. Zhao, H.J.; Wan, X.; Lu, J.H.; Zhang, H.Y.; Guo, B.H. Development and applications of phase⁃change energy⁃storage material in architecture. China Plast. 2023, 37, 46–61. [Google Scholar]
  9. Masoud, I.; Fateme, S.T.; Hossein, S.S.N.; Afsharpanah, F. Thermal management of shelter building walls by PCM macro-encapsulation in commercial hollow bricks. Case Stud. Therm. Eng. 2023, 47, 103081. [Google Scholar]
  10. Lu, S.L.; Zheng, J.H.; Wang, R.; Zhu, J.W. Thermal performance research on a novel coupled heating system combined solar air heater with ventilation PCM wall. Sol. Energy 2023, 265, 112100. [Google Scholar] [CrossRef]
  11. Punita, S.; Hooman, M.; Man, W.A.N. Performance evaluation of phase change materials to reduce the cooling load of buildings in a tropical climate. Sustainability 2022, 14, 3171. [Google Scholar]
  12. Zhou, S.Q.; Razaqpur, A.G. Experimental study of thermal performance of new dynamic thermal insulated PCM Trombe wall. Acta Energetica Sin. 2024, 45, 10–15. [Google Scholar]
  13. Li, Y.; Zou, T.; Zhao, J.; Zhang, T.; Deng, P.; Liu, W.; Zhang, X.; Xie, C. High-enthalpy aramid nanofiber aerogel-based composite phase change materials with enhanced thermal conductivity. Compos. Commun. 2023, 40, 101–114. [Google Scholar] [CrossRef]
  14. Benkaddour, A.; Faraji, M.; Faraji, H. Numerical study of the thermal energy storage behaviour of a novel composite PCM/concrete wall integrated solar collector. Mater. Today Proc. 2020, 30, 905–908. [Google Scholar] [CrossRef]
  15. Zhang, Y.; Xu, Y.J.; Chen, Y.; Zhang, K.Y.; Ni, X.Y. Heat storage and release performance of new phase change material and its application in greenhouse. Trans. Chin. Soc. Agric. Eng. 2021, 37, 218–226. [Google Scholar]
  16. Wu, Z.X.; Tang, J.C.; Liang, W.; Song, J.S. Screening and testing of suitable phase change materials for solar greenhouse in northern JiangSu. Acta Energetica Sin. 2023, 44, 264–272. [Google Scholar]
  17. Zou, P.; Jiang, L.Y.; Ling, H.S.; Ma, Y.; Ma, C.W.; Shi, H.F. Study on optimization of thermophysical properties of phase change materials used in solar greenhouse walls. Acta Energiae Solaris Sin. 2023, 43, 139–147. [Google Scholar]
  18. Wang, D.Q.; Zhuang, Y.F.; Zhang, D.D.; Cheng, J.Y.; Wang, P.Z.; Zhao, S.M. Application effect of graded phase-change heat storage and release system in solar greenhouse. Acta Energetica Sin. 2022, 43, 104–111. [Google Scholar]
  19. Meng, F.K.; Jiang, Z.X. Heat storage and release test of external hanging phase change energy storage device in greenhouses. Trans. Chin. Soc. Agric. Eng. 2022, 38, 180–190. [Google Scholar]
  20. Zhou, Y.; Wang, S.X.; Liu, Z.H.; Ma, J.P.; Wang, T. Simulation study on composite phase change thermal insulation walls in solar greenhouse based on ANSYS. Acta Energiae Solaris Sin. 2020, 41, 113–122. [Google Scholar]
  21. Guarino, F.; Athienitis, A.; Cellura, M.; Bastien, D. PCM thermal storage design in buildings: Experimental studies and applications to solaria in cold climates. Appl. Energy 2017, 185, 95–106. [Google Scholar] [CrossRef]
  22. Guan, Y.; Meng, Q.; Ji, T.X.; Hu, W.L.; Li, W.L. Experimental study of the thermal characteristics of a heat storage wall with micro-heat pipe array and PCM in solar greenhouse. Energy 2023, 264, 126183. [Google Scholar] [CrossRef]
  23. Chen, C.; Ling, H.; Zhai, Z.; Li, Y.; Yang, F.; Han, F.; Wei, S. Thermal performance of an active-passive ventilation wall with phase change material in solar greenhouses. Appl. Energy 2018, 216, 602–612. [Google Scholar] [CrossRef]
  24. Chriaa, I.; Trigui, A.; Karkri, M.; Jedidi, I.; Abdelmouleh, M.; Boudaya, C. Thermal properties of shape-stabilized phase change materials based on Low Density Polyethylene, Hexadecane and SEBS for thermal energy storage. Appl. Therm. Eng. 2020, 171, 115072. [Google Scholar] [CrossRef]
  25. Guan, Y.; Chen, C.; Li, Z.; Han, Y.Q.; Ling, H.S. Improving thermal environment in solar greenhouse with phase-change thermal storage wall. Trans. Chin. Soc. Agric. Eng. 2012, 28, 194–201. [Google Scholar]
  26. Kalnaes, S.E.; Jell, B.P. Phase change materials and products for building applications: A state-of-the-art review and future research opportunities. Energy Build. 2015, 94, 150–176. [Google Scholar] [CrossRef]
  27. Entrop, A.G.; Brouwers, H.J.H.; Reinders, A.H.M.E. Experimental research on the use of micro-encapsulated phase change materials to store solar energy in concrete floors and to save energy in Dutch houses. Sol. Energy 2011, 85, 1007–1020. [Google Scholar] [CrossRef]
  28. Devaux, P.; Farid, M.M. Benefifits of PCM under floor heating with PCM wallboards for space heating in winter. Appl. Energy 2017, 191, 593–602. [Google Scholar] [CrossRef]
  29. Gorjian, S.; Calise, F.; Kant, F.; Ahamed, M.S.; Copertaro, B.; Najafi, G.; Zhang, X.; Aghaei, M.; Shamshiri, R.R. A review on opportunities for implementation of solar energy technologies in agricultural greenhouses. J. Clean. Prod. 2021, 285, 124807. [Google Scholar] [CrossRef]
  30. Yang, D.W.; Jing, H.W.; Jing, W.T.; Zou, Z.R.; He, B.; Bao, E.C.; Cao, Y.F. Comparative analysis of thermal performance greenhouses with different wall materials. J. China Agric. Univ. 2023, 28, 194–205. [Google Scholar]
  31. Kooli, S.; Bouadila, S.; Lazaar, M.; Farhat, A. The effect of nocturnal shutter on insulated greenhouse using a solar air heater with latent storage energy. Sol. Energy 2015, 155, 217–228. [Google Scholar] [CrossRef]
  32. Arfaoui, N.; Bouadila, S.; Guizani, A. A highly efficient solution of off-sunshine solar air heating using two packed beds of latent storage energy. Sol. Energy 2017, 155, 1243–1253. [Google Scholar] [CrossRef]
  33. Gourdo, L.; Fatnassi, H.; Tiskatine, R.; Wifaya, A.; Demrati, H.; Aharounce, A.; Bouirden, L. Solar energy storing rock-bed to heat an agricultural greenhouse. Energy 2019, 169, 206–212. [Google Scholar] [CrossRef]
  34. Bazgaou, A.; Fatnassi, H.; Bouhroud, R.; Gourdo, L.; Ezzaeri, K.; Tiskatine, R.; Demrati, H.; Wifaya, A.; Bekkaoui, A.; Aharoune, A.; et al. An experimental study on the effect of a rock-bed heating system on the microclimate and the crop development under canarian greenhouse. Sol. Energy 2018, 176, 42–50. [Google Scholar] [CrossRef]
  35. Gorjian, S.; Ebadi, H.; Najafi, G.; Chandel, S.S.; Yildizhan, H. Recent advances in net-zero energy greenhouses and adapted thermal energy storage systems. Sustain. Energy Technol. Assess. 2021, 43, 100940. [Google Scholar] [CrossRef]
  36. Ling, H.S.; Chen, C.; Chen, Z.G.; Ma, C.W.; Guan, Y.; Li, N. Performance of phase change material wall with vertical air channels integrating solar concentrators. Trans. Chin. Soc. Agric. Mach. 2015, 46, 336–343. [Google Scholar]
  37. Mohsenipour, M.; Ebadollahi, M.; Rostamzadeh, H.; Amidpour, M. Design and evaluation of a solar-based trigeneration system for a nearly zero energy greenhouse in arid region. J. Clean. Prod. 2020, 254, 119990. [Google Scholar] [CrossRef]
  38. Mu, M.; Basheer, P.A.M.; Sha, W.; Bai, Y.; McNally, T. Shape stabilised phase change materials based on a high melt viscosity HDPE and paraffin waxes. Appl. Energy 2016, 162, 68–82. [Google Scholar] [CrossRef]
  39. Ding, C.; Zhu, N.; Lan, Q.Y.; Cheng, B.H.; Fu, K.S. Study on burning and fire spreading behavior of typical building exterior insulation materials. J. Beijing Univ. Civ. Eng. Archit. 2022, 38, 99–105. [Google Scholar]
  40. Hassanain, A.A.; Hokam, E.M.; Mallick, T.K. Effect of solar storage wall on the passive solar heating constructions. Energy Build. 2011, 43, 737–747. [Google Scholar] [CrossRef]
  41. Holman, J.P. Experimental Methods for Engineers, 8th ed.; McGraw-Hill: New York, NY, USA, 2012. [Google Scholar]
  42. Butterfifield, R.E.; Morison, J.I.L. Modeling the impact of climatic warming on winter cereal development. Agric. For. Meteorol. 1992, 62, 241–261. [Google Scholar] [CrossRef]
  43. Li, Y.M.; Sun, F.J.; Shi, W.B.; Liu, X.G.; Li, T.L. Numerical simulation of ventilation performance in mushroom solar greenhouse design. Energies 2022, 15, 5899. [Google Scholar] [CrossRef]
  44. Hong, S.W.; Exadaktylos, V.; Lee, I.B.; Amon, T.; Youssef, A.; Norton, T.; Berckmans, D. Validation of an open source CFD code to simulate natural ventilation for agricultural buildings. Comput. Electron. Agric. 2017, 138, 80–91. [Google Scholar] [CrossRef]
  45. Diarce, G.; Campos-Celador, A.; Martin, K. A comparative study of the CFD modeling of a ventilated active façade including phase change materials. Appl. Energy 2014, 126, 307–317. [Google Scholar] [CrossRef]
  46. Seddegh, S.; Wang, X.L.; Henderson, A.D. A comparative study of thermal behaviour of a horizontal and vertical shell-and-tube energy storage using phase change materials. Appl. Therm. Eng. 2016, 93, 348–358. [Google Scholar] [CrossRef]
  47. Gansu Province Development and Reform Commission. Notice of the Gansu Provincial Development and Reform Commission on Matters Related to the Adjustment of Sales Electricity Prices and Optimization of Peak and Valley Time-of-Use Electricity Prices. 2020. Available online: https://fzgg.gansu.gov.cn/fzgg/c106108/202106/18022c0ea91e4a9ab215bc3d28b79c06.shtml (accessed on 30 November 2020).
Figure 1. The APHSWS incorporating PCMs.
Sustainability 16 02624 g001
Figure 2. Illustrations of the experiment greenhouses: (a) schematic plan; (b) section A-A; (c) section B-B; (d) the construction process diagram of the proposed wall with the APHSWS; (e) the construction process diagram of ordinary wall without the APHSWS; (f) the interior real picture with the proposed wall; (g) the interior real picture with ordinary wall. (Note: In the (b,c), the red cross represents the specific arrangement of measurement points for the experiment, the red circle represents the pipeline).
Sustainability 16 02624 g002
Figure 3. DSC curve of PCM used in proposed wall with the APHSWS.
Sustainability 16 02624 g003
Figure 4. Weather parameter conditions of the whole experiment period.
Sustainability 16 02624 g004
Figure 5. Weather parameter conditions of three representative days during the investigating period.
Sustainability 16 02624 g005
Figure 6. Weather parameter conditions used for the numerical simulation.
Sustainability 16 02624 g006
Figure 7. Computational domain and mesh system of the proposed greenhouse.
Sustainability 16 02624 g007
Figure 8. Comparison between simulation results and experimental results.
Sustainability 16 02624 g008
Figure 9. Inner surface temperature of the north wall under different weather conditions.
Sustainability 16 02624 g009
Figure 10. Variation in the indoor air temperature of two CSGs with time under different weather conditions.
Sustainability 16 02624 g010
Figure 11. Changes in soil temperature over time in two CSGs under different weather conditions: (a) soil surface temperature; (b) soil temperature at depth of 10 cm; (c) soil temperature at depth of 30 cm.
Sustainability 16 02624 g011aSustainability 16 02624 g011b
Figure 12. Daily effective accumulative temperature of two CSGs during the experiment period.
Sustainability 16 02624 g012
Figure 13. Temperature distribution of the two walls at different times.
Sustainability 16 02624 g013
Figure 14. Heat storage and release capacities of the two walls on three representative days.
Sustainability 16 02624 g014
Table 1. Material thermos-physical parameters of the solar greenhouse.
MaterialsThermal Conductivity
W/(m·°C)
Density
kg/m3
Specific Heat
J/(kg·°C)
Reference
Air0.02421.2251006.43[17]
PCM0.26860See Figure 3[17]
Bricks0.5814001050[17]
Tiles0.491800860[17]
Stainless steel16.27700500[17]
EPS board0.041301380[39]
XPS board0.030301500[39]
Table 2. Comparison of the calculation of three selected grids with experimental results.
Number of Grids163889324767323350270
Maximum error, %15.26.275.77
Average error, %2.842.572.3
Calculation time, h233550
Table 3. Initial values of each computational domain in the two greenhouse models.
Item NameTemperature of the Proposed Greenhouse, °CTemperature of the Ordinary Greenhouse, °C
Tank A, B and C11.50-
Tank D, E and F9.80-
Pipe9.35-
Inner brick layer9.256.35
EPS, XPS, Outer brick layer6.356.35
Air5.503.85
Table 4. The power consumption and estimated cost of APHSWS.
ItemConsumption of Day, kWhConsumption throughout Winter (Approx. 120 Days), kWhResidential Electricity,
CNY/kWh
Estimated Cost, CNY
Minimum power consumption0.5600.26115.66
Maximum power consumption112031.32
Disclaimer/Publisher’s Note: The statements, opinions and data contained in all publications are solely those of the individual author(s) and contributor(s) and not of MDPI and/or the editor(s). MDPI and/or the editor(s) disclaim responsibility for any injury to people or property resulting from any ideas, methods, instructions or products referred to in the content.

