1. Introduction
Exploring the large-scale application of hydrogen energy in the industrial sector holds significant importance for constructing a clean, low-carbon, secure, and efficient energy system, as well as achieving the goals of carbon peak and carbon neutrality [
1,
2,
3,
4]. Currently, the primary methods for hydrogen production include fossil fuel-based hydrogen production, water electrolysis, and industrial by-product hydrogen [
5,
6,
7,
8]. Among them, industrial by-product hydrogen refers to the hydrogen generated in the chemical industry, such as coking, chlor-alkali, and propane dehydrogenation, while producing primary products [
9]. Compared with other hydrogen production methods, it has a vast market potential. It can be locally utilized within industrial parks, overcoming challenges related to the high-cost transportation of hydrogen. This approach facilitates the establishment of a regional hydrogen energy industry chain, fostering the large-scale development of hydrogen energy [
10]. Moreover, industrial by-product hydrogen has significant advantages in terms of production costs and carbon reduction compared to other hydrogen production methods, making it a preferable choice for low-carbon and cost-effective hydrogen sourcing [
11,
12]. However, the current utilization methods for by-product hydrogen in industrial parks are relatively singular, failing to fully exploit its utilization value. Taking the chlor-alkali industry as an example, approximately 850,000 tons of by-product hydrogen are generated annually while producing caustic soda. Despite the chlor-alkali plants being equipped with production facilities for hydro-chloric acid and PVC to balance chlorine and recover the by-product hydrogen, down-stream PVC plants cannot fully absorb the by-product hydrogen due to limited capacity. Consequently, only about 60% of the by-product hydrogen is effectively recovered, while the remaining portion is underutilized or wasted due to the downstream PVC plants’ constraints in accommodating the hydrogen produced by chlor-alkali plants [
13,
14]. Therefore, how to efficiently utilize by-product hydrogen in industrial parks and reduce the energy supply costs and carbon emissions of these parks is crucial to establishing a hydrogen supply system primarily based on the local utilization of industrial by-product hydrogen and renewable energy-based hydrogen production.
In industries such as coking, chlor-alkali, propane dehydrogenation, etc., hydrogen—as a by-product in the production process—possesses advantages such as stable supply, low production costs, and convenient transportation. Therefore, by-product hydrogen within these industrial parks holds substantial potential for applications. Scholars have conducted corresponding research on reducing costs and improving efficiency in by-product hydrogen parks. In the realm of hydrogen-electric conversion, reference [
15] indicates that industrial by-product hydrogen needs to undergo one or multiple purification steps to be suitable for hydrogen fuel cells. However, for the by-product hydrogen produced in chlor-alkali plants, its purity can reach 99.5% [
16], essentially free from impurities that could be detrimental to hydrogen fuel cells. It can be used directly or, after a simple purification process, making it suitable for use. Due to the high purity and low impurity content of by-product hydrogen from chlor-alkali, the purification cost is only 1 to 2 ¥/kg. Compared to other types of by-product hydrogen, it is more suitable for coupling with electrical energy. Reference [
17] proposes a novel model of “renewable energy—chlor-alkali—hydrogen energy—self-use of green electricity” by utilizing fuel cells to convert by-product hydrogen produced in chlor-alkali plants into electric energy for the factory’s use. This study optimizes operational parameters with the goal of minimizing production and environmental costs, ultimately enhancing the profitability of chlor-alkali plants. As for hydrogen-thermal conversion, reference [
18] explores the combustion of by-product hydrogen from chlor-alkali plants to generate thermal energy for steam production, demonstrating that the by-product hydrogen can account for 33% of steam production, consequently reducing factory fuel costs. In the realm of multi-energy coupling, reference [
19] introduces an operational model for the electric, thermal, and hydrogen multi-energy system in an industrial park, coupling by-product hydrogen from factories with both electric and thermal energy within the park through fuel cells. However, existing research in the areas of diverse local utilization of by-product hydrogen and carbon emission optimization has not fully tapped into the potential of by-product hydrogen.
Additionally, the aforementioned studies did not consider the spatiotemporal correlation of source-load variables within the by-product hydrogen industrial park. This correlation can have a significant impact on the subsequent optimization and scheduling schemes of the system. In the realm of spatiotemporal correlation studies, reference [
20] considered spatiotemporal correlation when constructing the uncertainty set of wind turbine output, effectively reducing the conservatism of the traditional uncertainty set for wind turbine output. Reference [
21] proposed using copula models to establish a correlation model for photovoltaic output. In the context of grid expansion planning, reference [
22] took into account the correlation of output between wind farms and photovoltaic stations, establishing a copula model for wind-solar complementarity. Reference [
23] considered the constraints of correlations between sources and between sources and loads, respectively, and analyzed the optimization and scheduling of active distribution networks using Latin hypercube and Cholesky decomposition techniques combined with scenario-based methods. Reference [
24] proposed an optimal scheduling method considering the correlation of source–source, load–load, and source–load. Verified results indicate that, after considering correlations, both the operational costs and carbon emissions of the system have decreased. Addressing the issue of correlation in output between sources and loads within the chlor-alkali chemical park, this paper proposes a scenario generation and reduction method that considers the spatiotemporal correlation of source-load variables. Using this method, the generated scenarios effectively cover actual output scenarios, and the temporal and spatial correlation characteristics align more closely with real-world situations.
To better achieve the local utilization of industrial by-product hydrogen, improve the efficiency of by-product hydrogen utilization, and enhance the economic benefits of industrial parks, it is crucial to conduct research on hydrogen multi-energy coupling systems with a focus on by-product hydrogen industrial parks. Considering the limitations of previous studies, this paper conducts a study on a multi-energy coupling system for by-product hydrogen in the context of a chlor-alkali chemical park. On the source side, a model for the electrolyzer’s energy consumption and capacity is established. Additionally, a thermal consumption model is developed for the triple-effect countercurrent evaporation process of alkali solution. On the by-product hydrogen load side, various modeling approaches are applied to represent the multiple utilization pathways for by-product hydrogen within the park, including participation in the production of downstream chemical products, blending with hydrogen in combustion, and utilization in hydrogen fuel cells. Considering the impact of correlations between various loads within the park and wind power generation, a scenario generation and reduction method that accounts for the spatiotemporal correlation of source-load variables is proposed. Finally, with the objectives of maximizing the economic benefits and minimizing carbon emission costs in the chlor-alkali industrial park, a comprehensive simulation analysis is conducted for the optimization and scheduling of the system with consideration of the operational constraints of the chlor-alkali factory and various electric, thermal, and hydrogen energy systems.
2. The Model of MESBPH
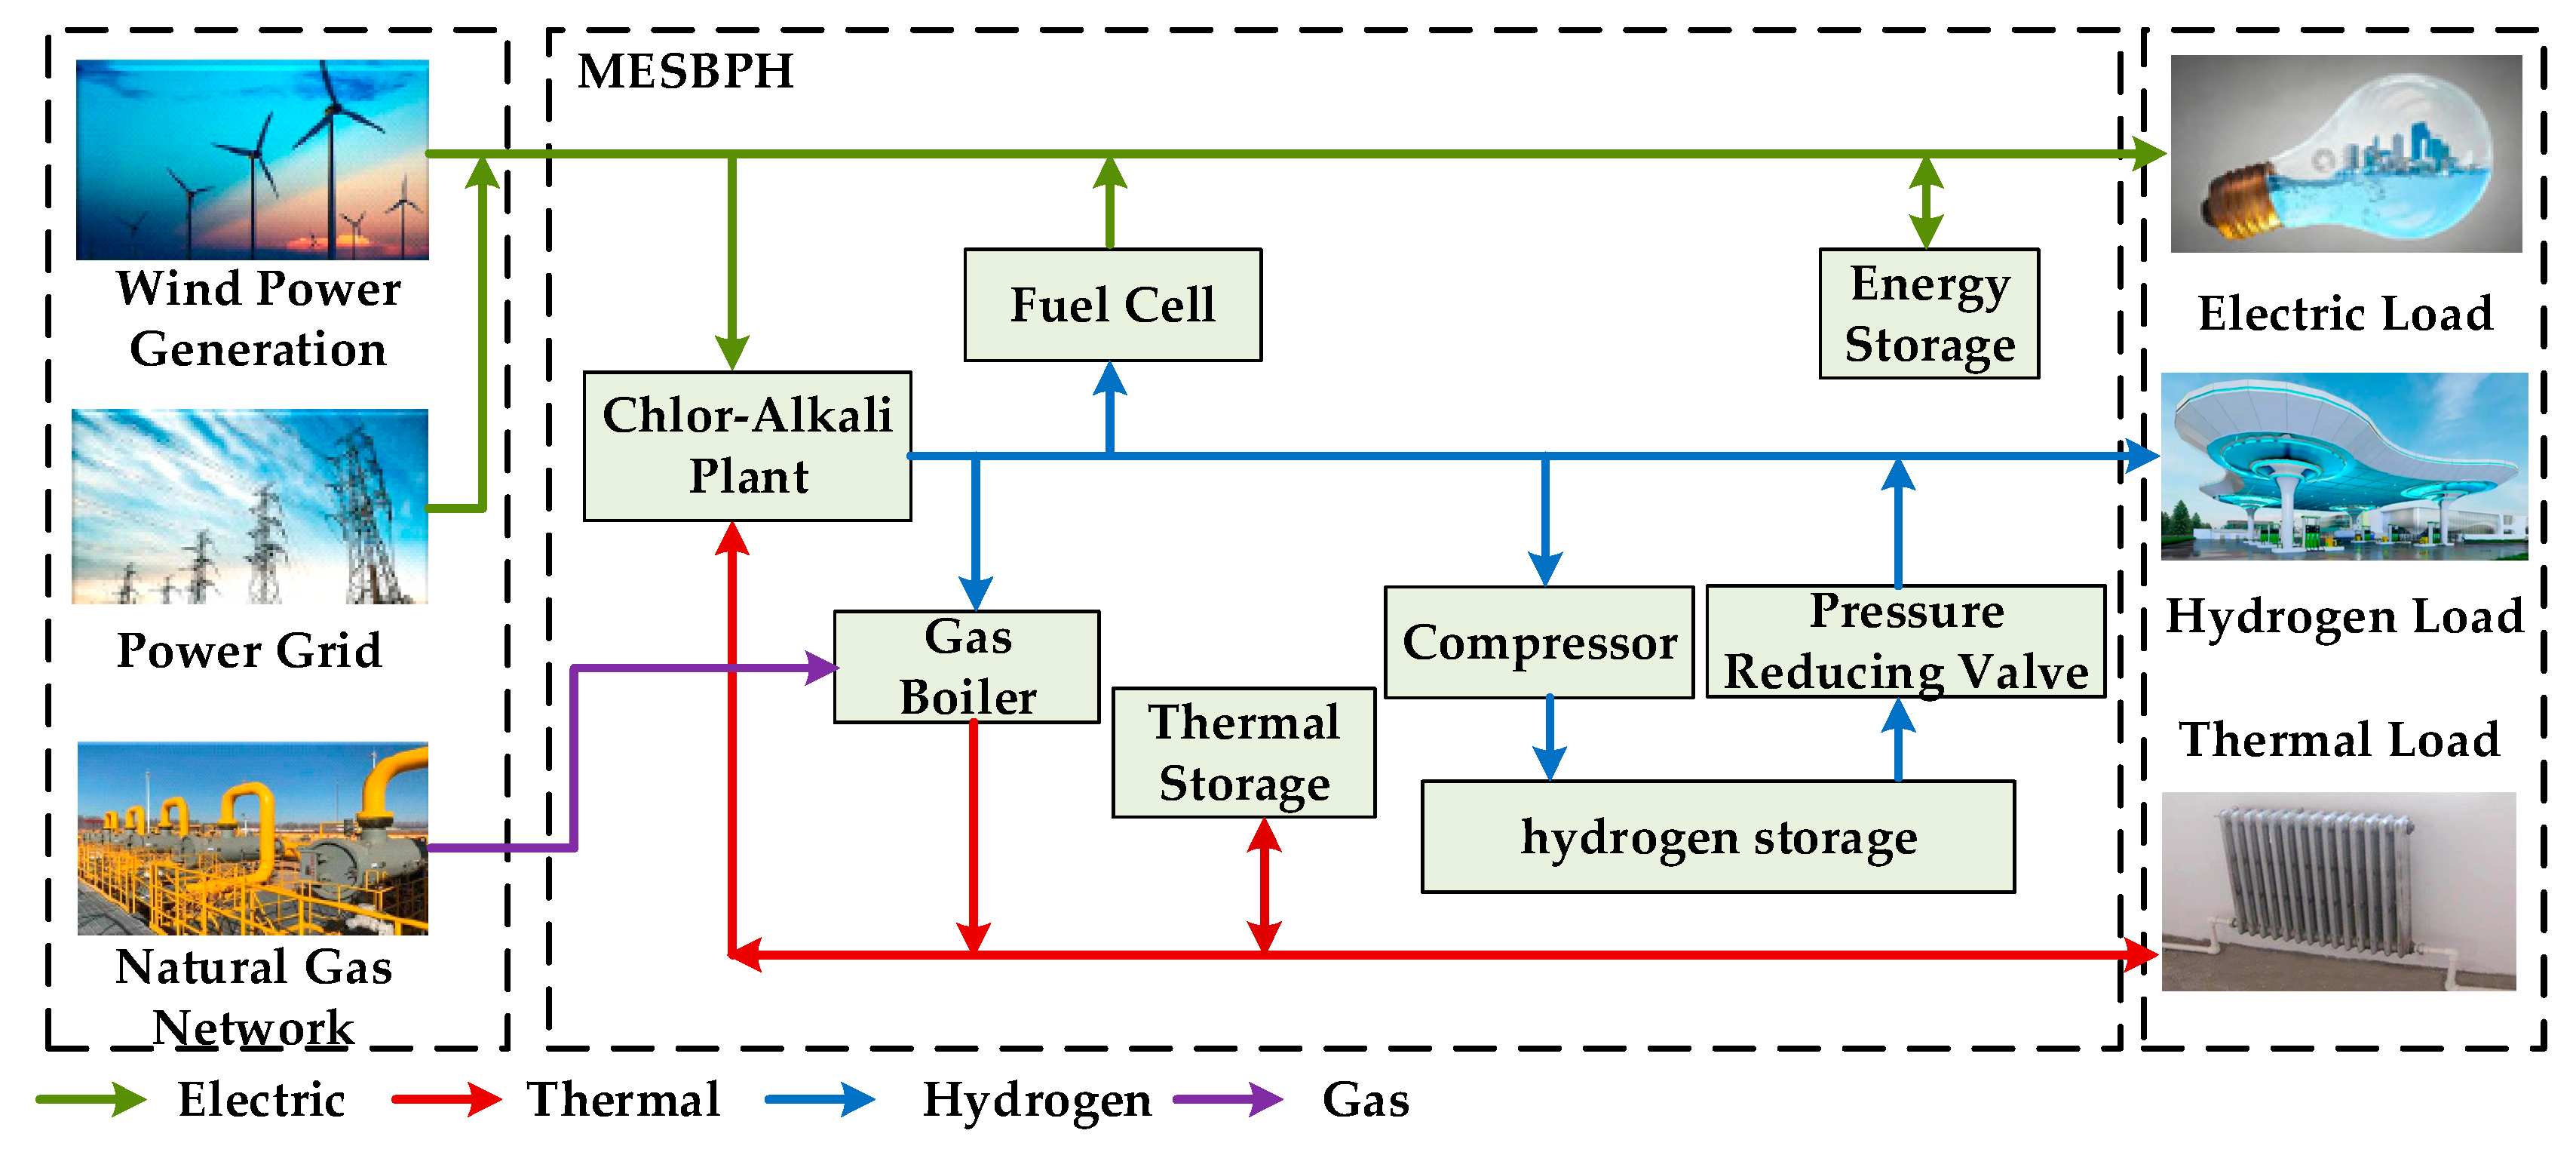
This article proposes a Multi-Energy System with By-Product Hydrogen (MESBPH) for the chlor-alkali industrial park. The system comprises components such as the chlor-alkali plant, wind turbines, fuel cells, gas boilers, energy storage, hydrogen storage, and thermal storage units, as illustrated in
Figure 1. The system’s loads include the park’s electric, thermal, hydrogen load and the electric and thermal energy needed for the chlor-alkali plant’s production. During the chlor-alkali plant production process, electrical and thermal energy is consumed, and the generated by-product hydrogen can be utilized in a multi-energy coupling system. The electrical energy in the system primarily comes from purchasing from the upstream grid and wind power generation. Additionally, it can be produced by fuel cells consuming the by-product hydrogen. The thermal energy in the system is mainly derived from a gas boiler, which primarily obtains heat energy through natural gas combustion. When a substantial amount of by-product hydrogen is produced by the chlor-alkali plant, the gas boiler can also generate heat energy through hydrogen-blended combustion. Furthermore, the energy storage devices in the system serve the purpose of peak shaving and valley filling. It is important to note that when storing hydrogen in the hydrogen storage tank, compression of the by-product hydrogen is required. Clearly, the chlor-alkali plant serves as both an energy consumer and producer. In this section, we first model the main energy consumption components in the chlor-alkali plant’s production process and then establish models for the energy conversion devices in the MESBPH.
2.1. The Energy Consumption Model for the Chlor-Alkali Plant’s Production Process
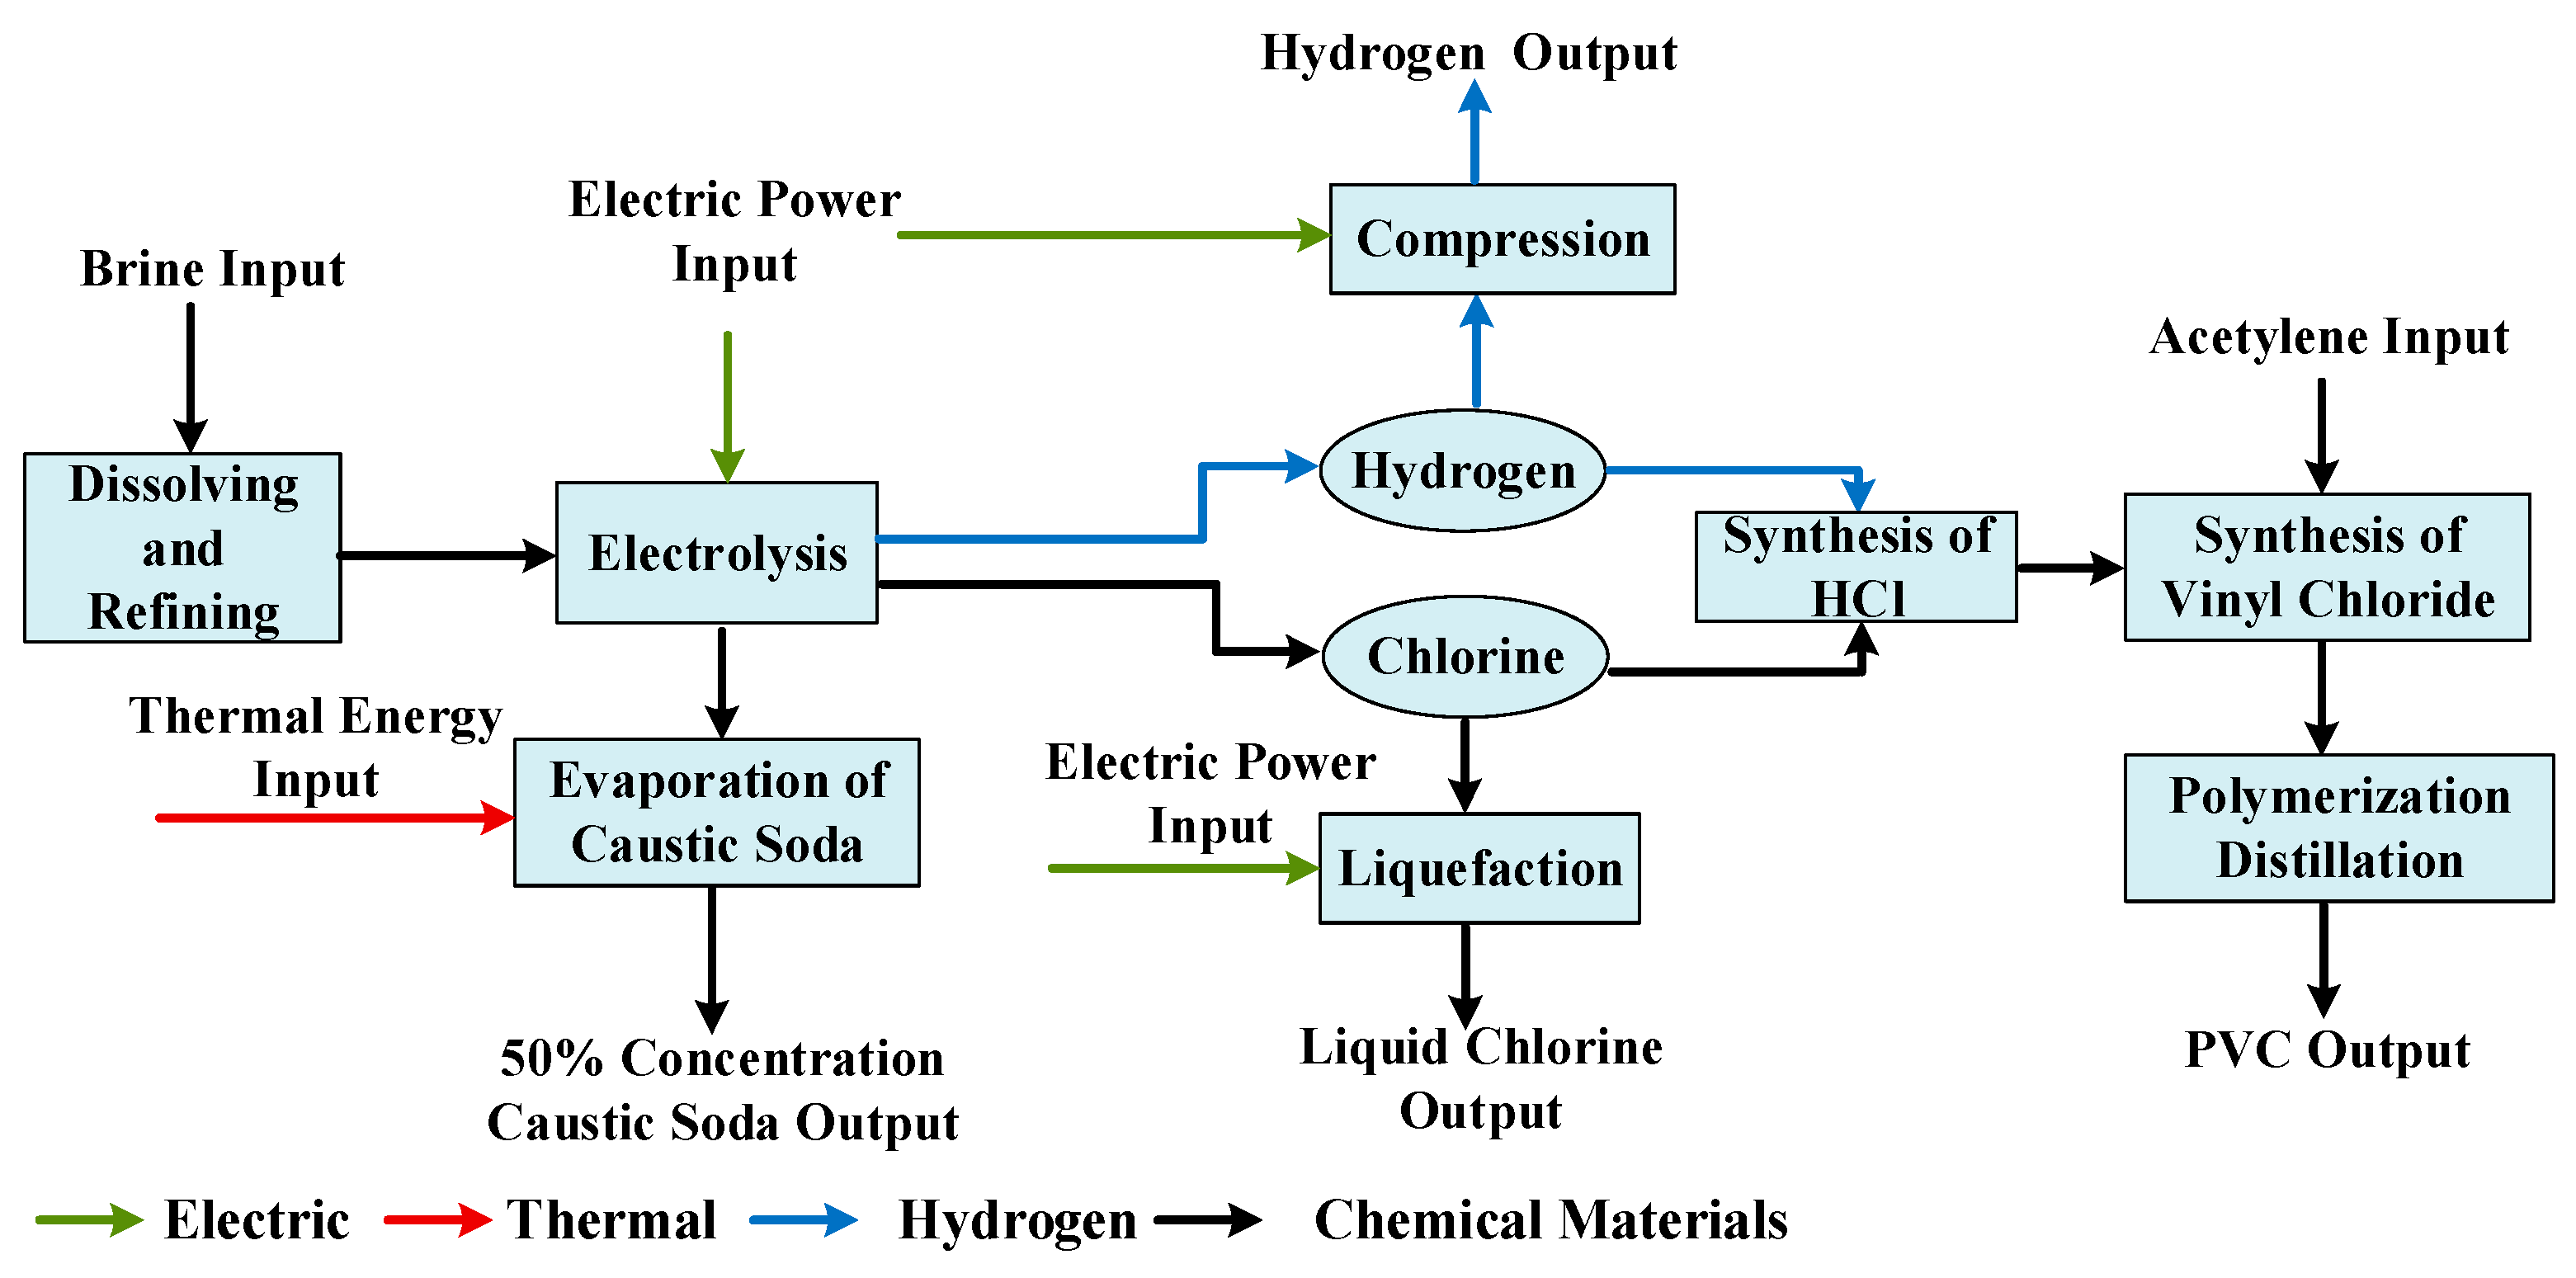
The chlor-alkali industry is a foundational raw material industry that produces caustic soda, using salt as its primary raw material. The production process involves various steps such as raw salt refining, electrolysis, evaporation, synthesis of hydrochloric acid, and other procedures. The hydrogen and chlorine gases generated during the electrolysis process in chlor-alkali plants can serve as raw materials for downstream chemical enterprises in the production of polyvinyl chloride (PVC). However, due to insufficient production capacity in downstream chemical enterprises, some hydrogen and chlorine gases cannot be fully utilized. Chlorine gas can be compressed and liquefied for sale, while hydrogen gas, as a clean energy source, is introduced into the chlor-alkali industrial park’s multi-energy system for efficient and localized utilization in this study.
The chlor-alkali industry, characterized by its high energy demands, primarily involves the consumption of two key resources: electrical energy and thermal energy. Electrical energy is predominantly utilized during the electrolysis process, with additional consumption occurring in the compression phase of hydrogen and chlorine gases produced during electrolysis. Thermal energy is mainly expended in the caustic soda evaporation process.
Figure 2 illustrates the production process flow in the chlor-alkali industry. The ion-exchange membrane electrolyzer and caustic soda evaporation are the primary energy-consuming elements within chlor-alkali plants, and their models are detailed in
Section 2.1.1 and
Section 2.1.2, respectively.
2.1.1. Ionic Exchange Membrane Electrolyzer Model
After the saturated salt solution is produced from raw salt, it is sent to the ion exchange membrane electrolyzer for electrolysis, resulting in the production of caustic soda, chlorine, and hydrogen. The electrolysis process consumes a significant amount of electrical energy. In order to investigate the benefits of the coupling between by-product hydrogen and electricity, we establish a hydrogen production model for the ion exchange membrane electrolyzer [
25,
26]:
In the equation,
Pel represents the power of the electrolyzer (KW);
nH2 denotes the molar rate of hydrogen generation (mol/h);
Acell is the area of a single electrolyzer unit (m
2);
Nc is the number of units connected in series;
z is the number of electrons transferred per mole of hydrogen produced;
F is Faraday’s constant;
ηF is the Faraday efficiency;
k0 and
U0 are coefficients related to the unit voltage of the electrolyzer; the electrolyzer voltage is composed of three parts: reversible voltage, activation overpotential, and ohmic overpotential. According to reference [
25], due to the relatively small variations in electrolyte concentration and electrolyzer temperature during the chlor-alkali production process, the electrolyzer voltage can be expressed as a linear function of current density. Thus,
k0 and
U0 are coefficients related to the unit voltage of the electrolyzer, Based on the data from references [
25,
26,
27], the values can be taken as
k0 = 0.142 (Vm
2/KA),
U0 = 2.432 (V).
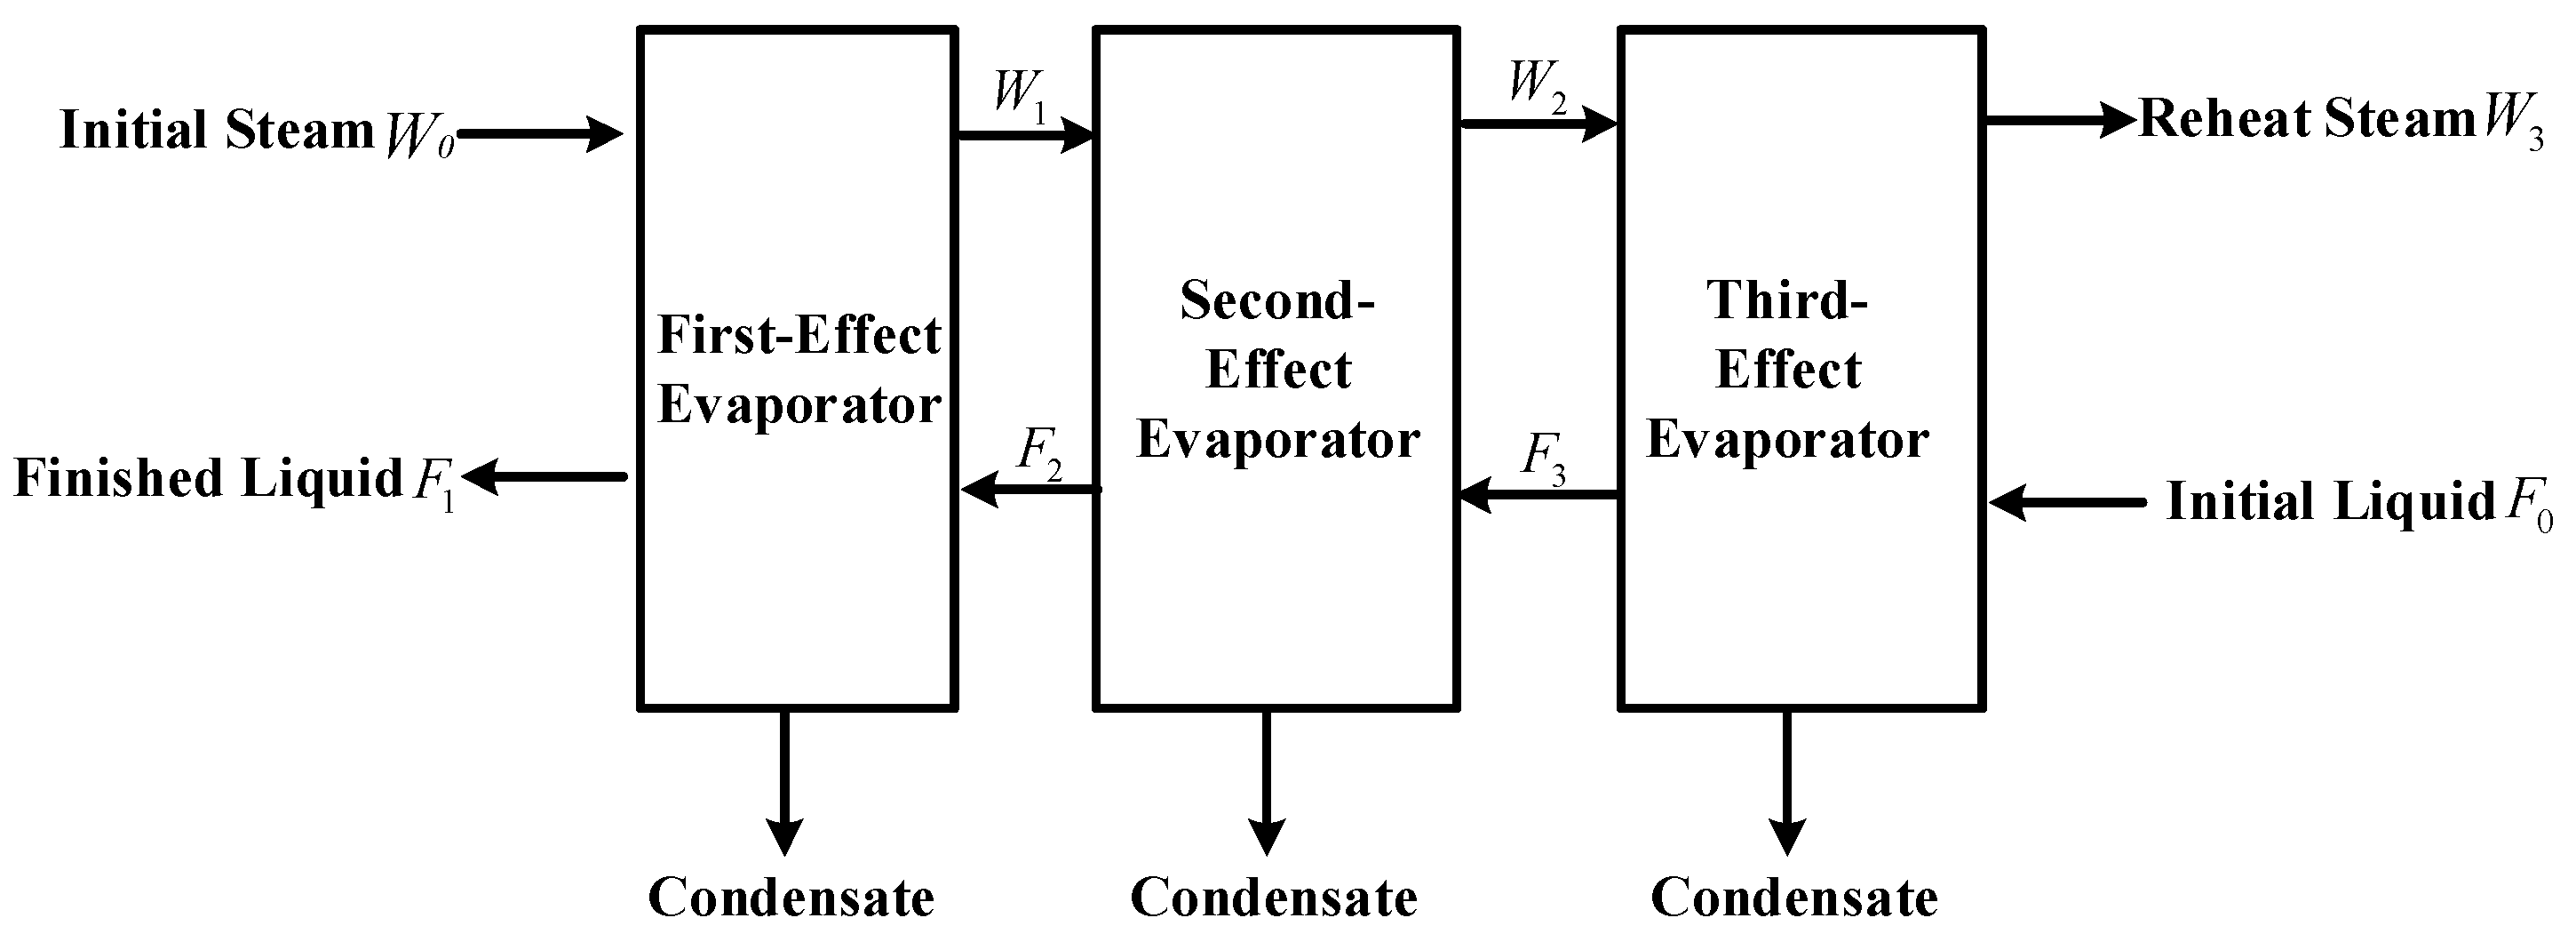
2.1.2. Triple-Effect Countercurrent Evaporator Model
In the ion exchange membrane electrolyzer, the NaOH concentration generated at the cathode is generally only 32%. In practical production, to improve the economic feasibility of transportation and meet the needs of some users, it is necessary to evaporate the caustic soda solution to increase its mass fraction to 50%. The evaporation process consumes a large amount of thermal energy, and the evaporation of caustic soda solution typically uses steam as the heat source. To enhance steam utilization efficiency, chlor-alkali chemical enterprises generally employ a triple-effect countercurrent evaporator for the evaporation and concentration of caustic soda solution, as illustrated in
Figure 3. The initial steam enters from the first-effect evaporator, and the secondary steam generated from evaporating the caustic soda solution serves as the input for the next-effect evaporator. After another round of energy exchange, the steam with the lowest temperature enters the third-effect evaporator. The 32% caustic soda solution produced in the electrolyzer enters from the third-effect evaporator, ultimately obtaining 50% caustic soda solution in the first-effect evaporator. This is because as the concentration of caustic soda solution increases, the heat required for evaporation also increases. Therefore, using a triple-effect countercurrent evaporator can effectively improve the efficiency of steam utilization. To study the benefits of coupling by-product hydrogen with thermal energy, an energy consumption model for the caustic soda solution evaporation process is established [
28]:
In the equation, Hevaporate represents the power required for caustic soda solution evaporation (KW); σ denotes the thermal-electric conversion coefficient, assumed to be 3.6 × 10³ KJ/kWh in this paper; Wi represents the mass flow rate of secondary steam generated by the i-th effect evaporator (kg/h), obtainable from Equation (3); F0 represents the mass flow rate of the input raw material liquid (kg/h); r1 denotes the specific enthalpy of steam entering the first-effect evaporator per unit mass (KJ/kg); Cpi represents the specific heat capacity of the liquid entering the i-th effect evaporator (KJ/kg·°C), which is related to the mass fraction of the liquid; ti is the temperature of the liquid entering the i-th effect evaporator (°C); x0 represents the mass fraction of the raw material liquid, and x3, x2, and x1, respectively, represent the mass fractions of the output liquids from the third, second, and first effect evaporators.
2.2. Gas Boiler Model
The by-product hydrogen from the chlor-alkali plant can be blended with natural gas and burned through a gas boiler. This approach not only effectively utilizes the by-product hydrogen from the chlor-alkali plant to provide the required thermal energy for the system but also reduces the carbon emissions from natural gas combustion. The heat production power model of the gas boiler is as follows [
29]:
In the equation, HGB,t represents the thermal power of the gas boiler at time t (KW); ηGB represents the thermal efficiency of the gas boiler; and represent the heating values of hydrogen and natural gas, taken as 3.54 kWh/m3 and 9.7 kWh/m3, respectively; and Vgas,t represent the hydrogen consumption rate (mol/h) and the volume of natural gas purchased from the upper-level gas network at time t (m3/h), respectively; PrGB and TGB represent the operating pressure at the gas boiler’s inlet (MPa) and the gas combustion temperature (K); R is the molar gas constant (J/mol/K); φmix represents the maximum volume fraction of hydrogen in natural gas. To ensure the safety of hydrogen blending combustion, the volume fraction of hydrogen cannot exceed 20%.
2.3. Fuel Cell Model
The hydrogen fuel cell generates electrical and thermal energy through the chemical reaction of hydrogen and oxygen, achieving combined heat and power (CHP). As the supply pressure of hydrogen for fuel cells is typically in the range of 0.03 to 0.06 MPa, the hydrogen produced from the chlor-alkali plant needs to pass through a pressure reducing valve before being supplied to the hydrogen fuel cell. The models for the electrical power and thermal power generation of the hydrogen fuel cell are as follows [
30]:
In the equation, represents the hydrogen consumption of the fuel cell at time t (mol/h); while Pfc,t and Hfc,t denote the electrical power output and thermal power output of the hydrogen fuel cell at time t (KW); The parameters ηfc,e and ηfc,h stand for the electrical efficiency and thermal efficiency of the hydrogen fuel cell, respectively. Additionally, Tfc and Prfc represent the temperature (K) and pressure (MPa) required for the hydrogen fuel cell to operate normally.
2.4. Compressor Model
After hydrogen is generated from the cathode chamber of the chlor-alkali electrolytic cell, for convenient short-distance transportation, it is first pressurized to 2 bar. Subsequently, it is transported over short distances to gas boilers, hydrogen fuel cells, and hydrogen storage tanks by adjusting the pressure through a pressure reducing valve or compressor. In this process, the power consumption of the hydrogen storage tank compressor not only depends on the intake volume, but is also influenced by the compression ratio. The power consumption operational model of the hydrogen storage tank compressor is as follows [
30]:
In the equation, Pcomp,t is the power consumption of the compressor at time t (KW); is the molar intake rate of the compressor at time t (mol/h); n is the heat capacity ratio of the compressed gas; ηcomp is the efficiency of the compressor; Prtank,t and Prin are the pressure at the outlet and inlet of the compressor at time t, respectively (Pa). Prtank,t can be determined by the storage state of the compressed gas in the compressor at time t.
3. Consideration of Temporal and Spatial Correlation in Wind Turbine Output and Electric, Thermal and Hydrogen Load Model
In the by-product hydrogen industrial park, there exists a certain temporal and spatial correlation among wind turbine output, electric load, thermal load, and hydrogen load. Temporal correlation refers to the consistency of the values of the same random variable in adjacent time periods, while spatial correlation indicates that within the same region, wind turbine output, electric load, thermal load, and hydrogen load are influenced by the same environmental factors, leading to correlations between various random variables. Combining the scenario method, this paper proposes a wind power output and electric, thermal, and hydrogen load demand model considering temporal and spatial correlations.
3.1. D-Vine Copula Theory
Copula theory has been proven to be an effective method for describing the correlation between random variables, effectively connecting the joint distribution functions and marginal distribution functions of different variables [
31]. However, a single Copula function, such as Gaussian/Student-t Copula, cannot accurately describe the complex correlations among multiple variables. Therefore, this paper adopts the D-Vine Copula method. This method represents the multivariate Copula as a series of tree-structured bivariate Copulas, allowing the estimation of all bivariate Copula functions to obtain the joint probability density function for all variables [
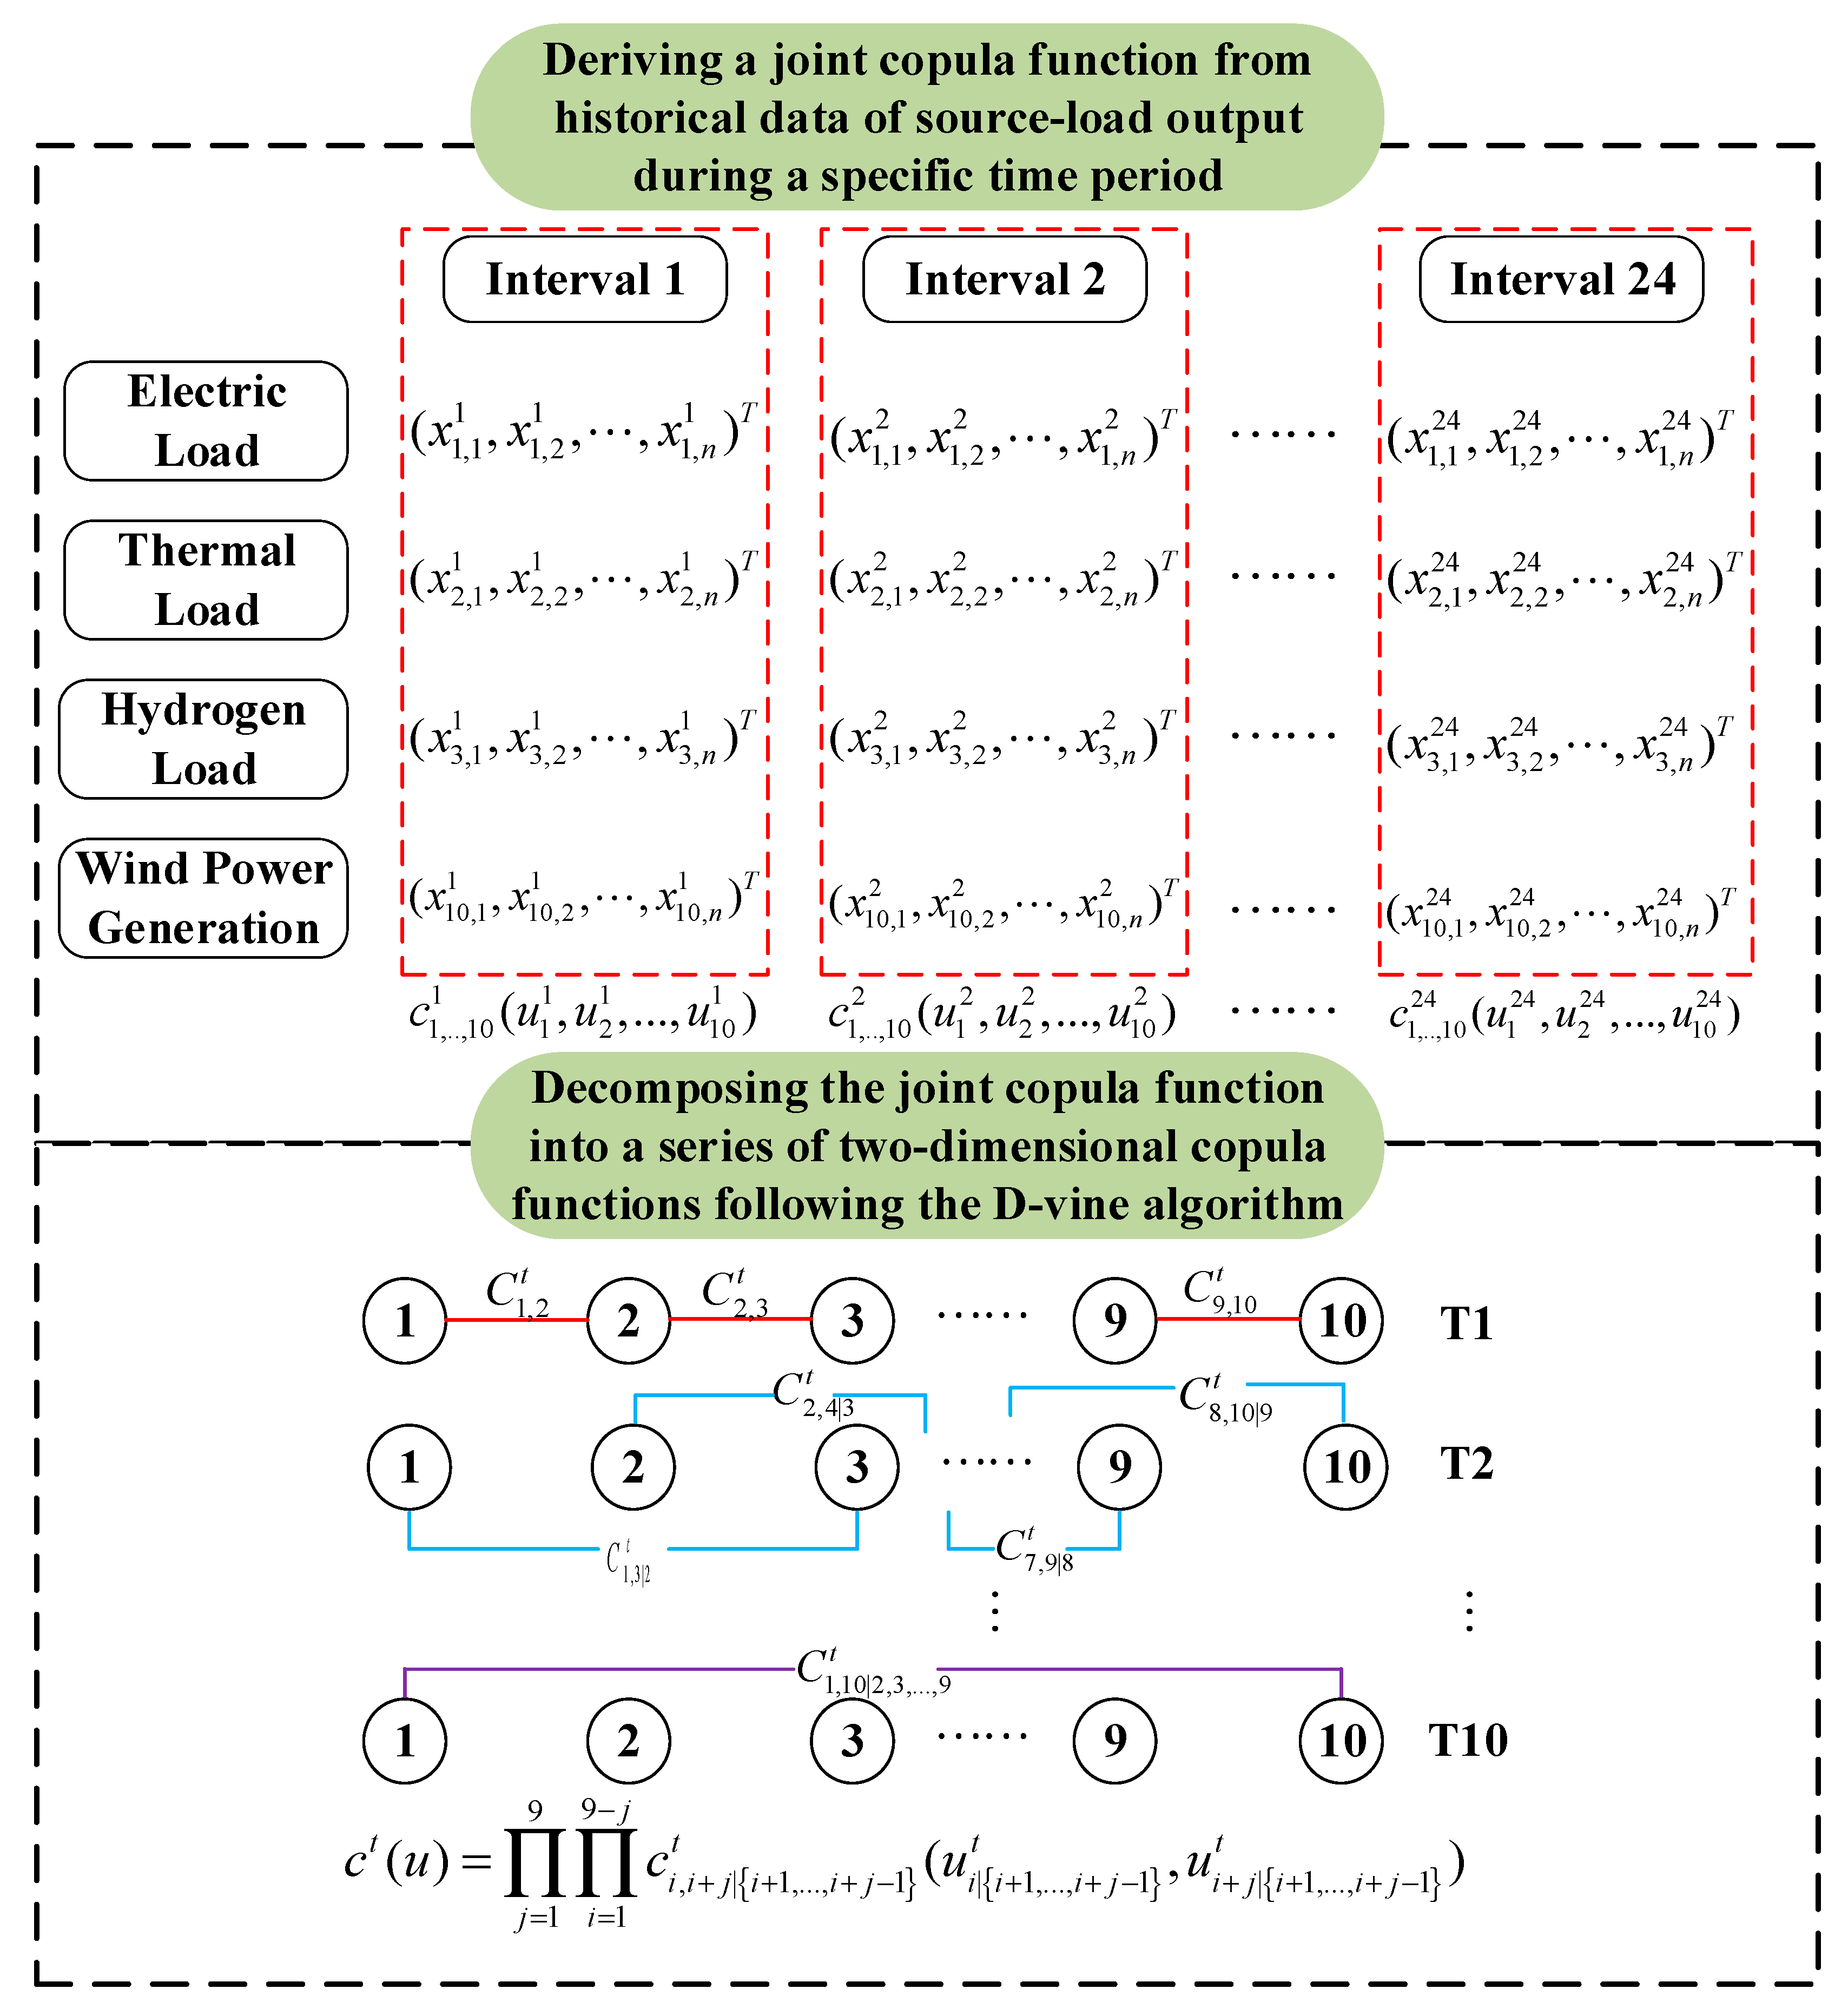
32]. In this paper, D-Vine Copula theory is employed to model the correlated electric, thermal, hydrogen load, and wind power generation. The D-vine condition tree is constructed for these variables, decomposing the multivariate joint Copula function into a series of tree-structured bivariate Copulas. Parameter estimation is then performed for each bivariate Copula, obtaining the multivariate joint Copula distribution. Finally, samples of source load output for each time period are obtained through sampling, as illustrated in
Figure 4.
3.2. Markov Chain Model
Markov Chain Model is a type of time series model that reflects the temporal correlation of random variables through transition probabilities between different time periods. If the state space set of the random variables {
Xt} is denoted as
S, then a
k-th-order continuous-time Markov chain can be represented as:
In the equation, k(xt + 1|xt,xt − 1,…,xt − k + 1) is the state transition probability function, and represents the probability distribution of the random variable at time t + 1 being in state xt + 1 when the states of the random variables at time periods t − k + 1, t − k, ..., t are xt − k + 1, xt − k, …, xt.
The state of the random variable at time
t + 1 is only dependent on the preceding
k time periods. To simplify the scenario generation process, this paper employs a first-order Markov chain model, setting
k = 1, as follows:
The conditional density function can be determined by the following expression, while the probability density function
f(
xt) for the random variable at time
t, as well as the joint probability density function
f(
xt + 1,xt) for time
t and
t + 1, can be obtained through kernel density estimation.
3.3. Scenario Generation and Reduction Steps Considering Spatiotemporal Correlation of Source Loads
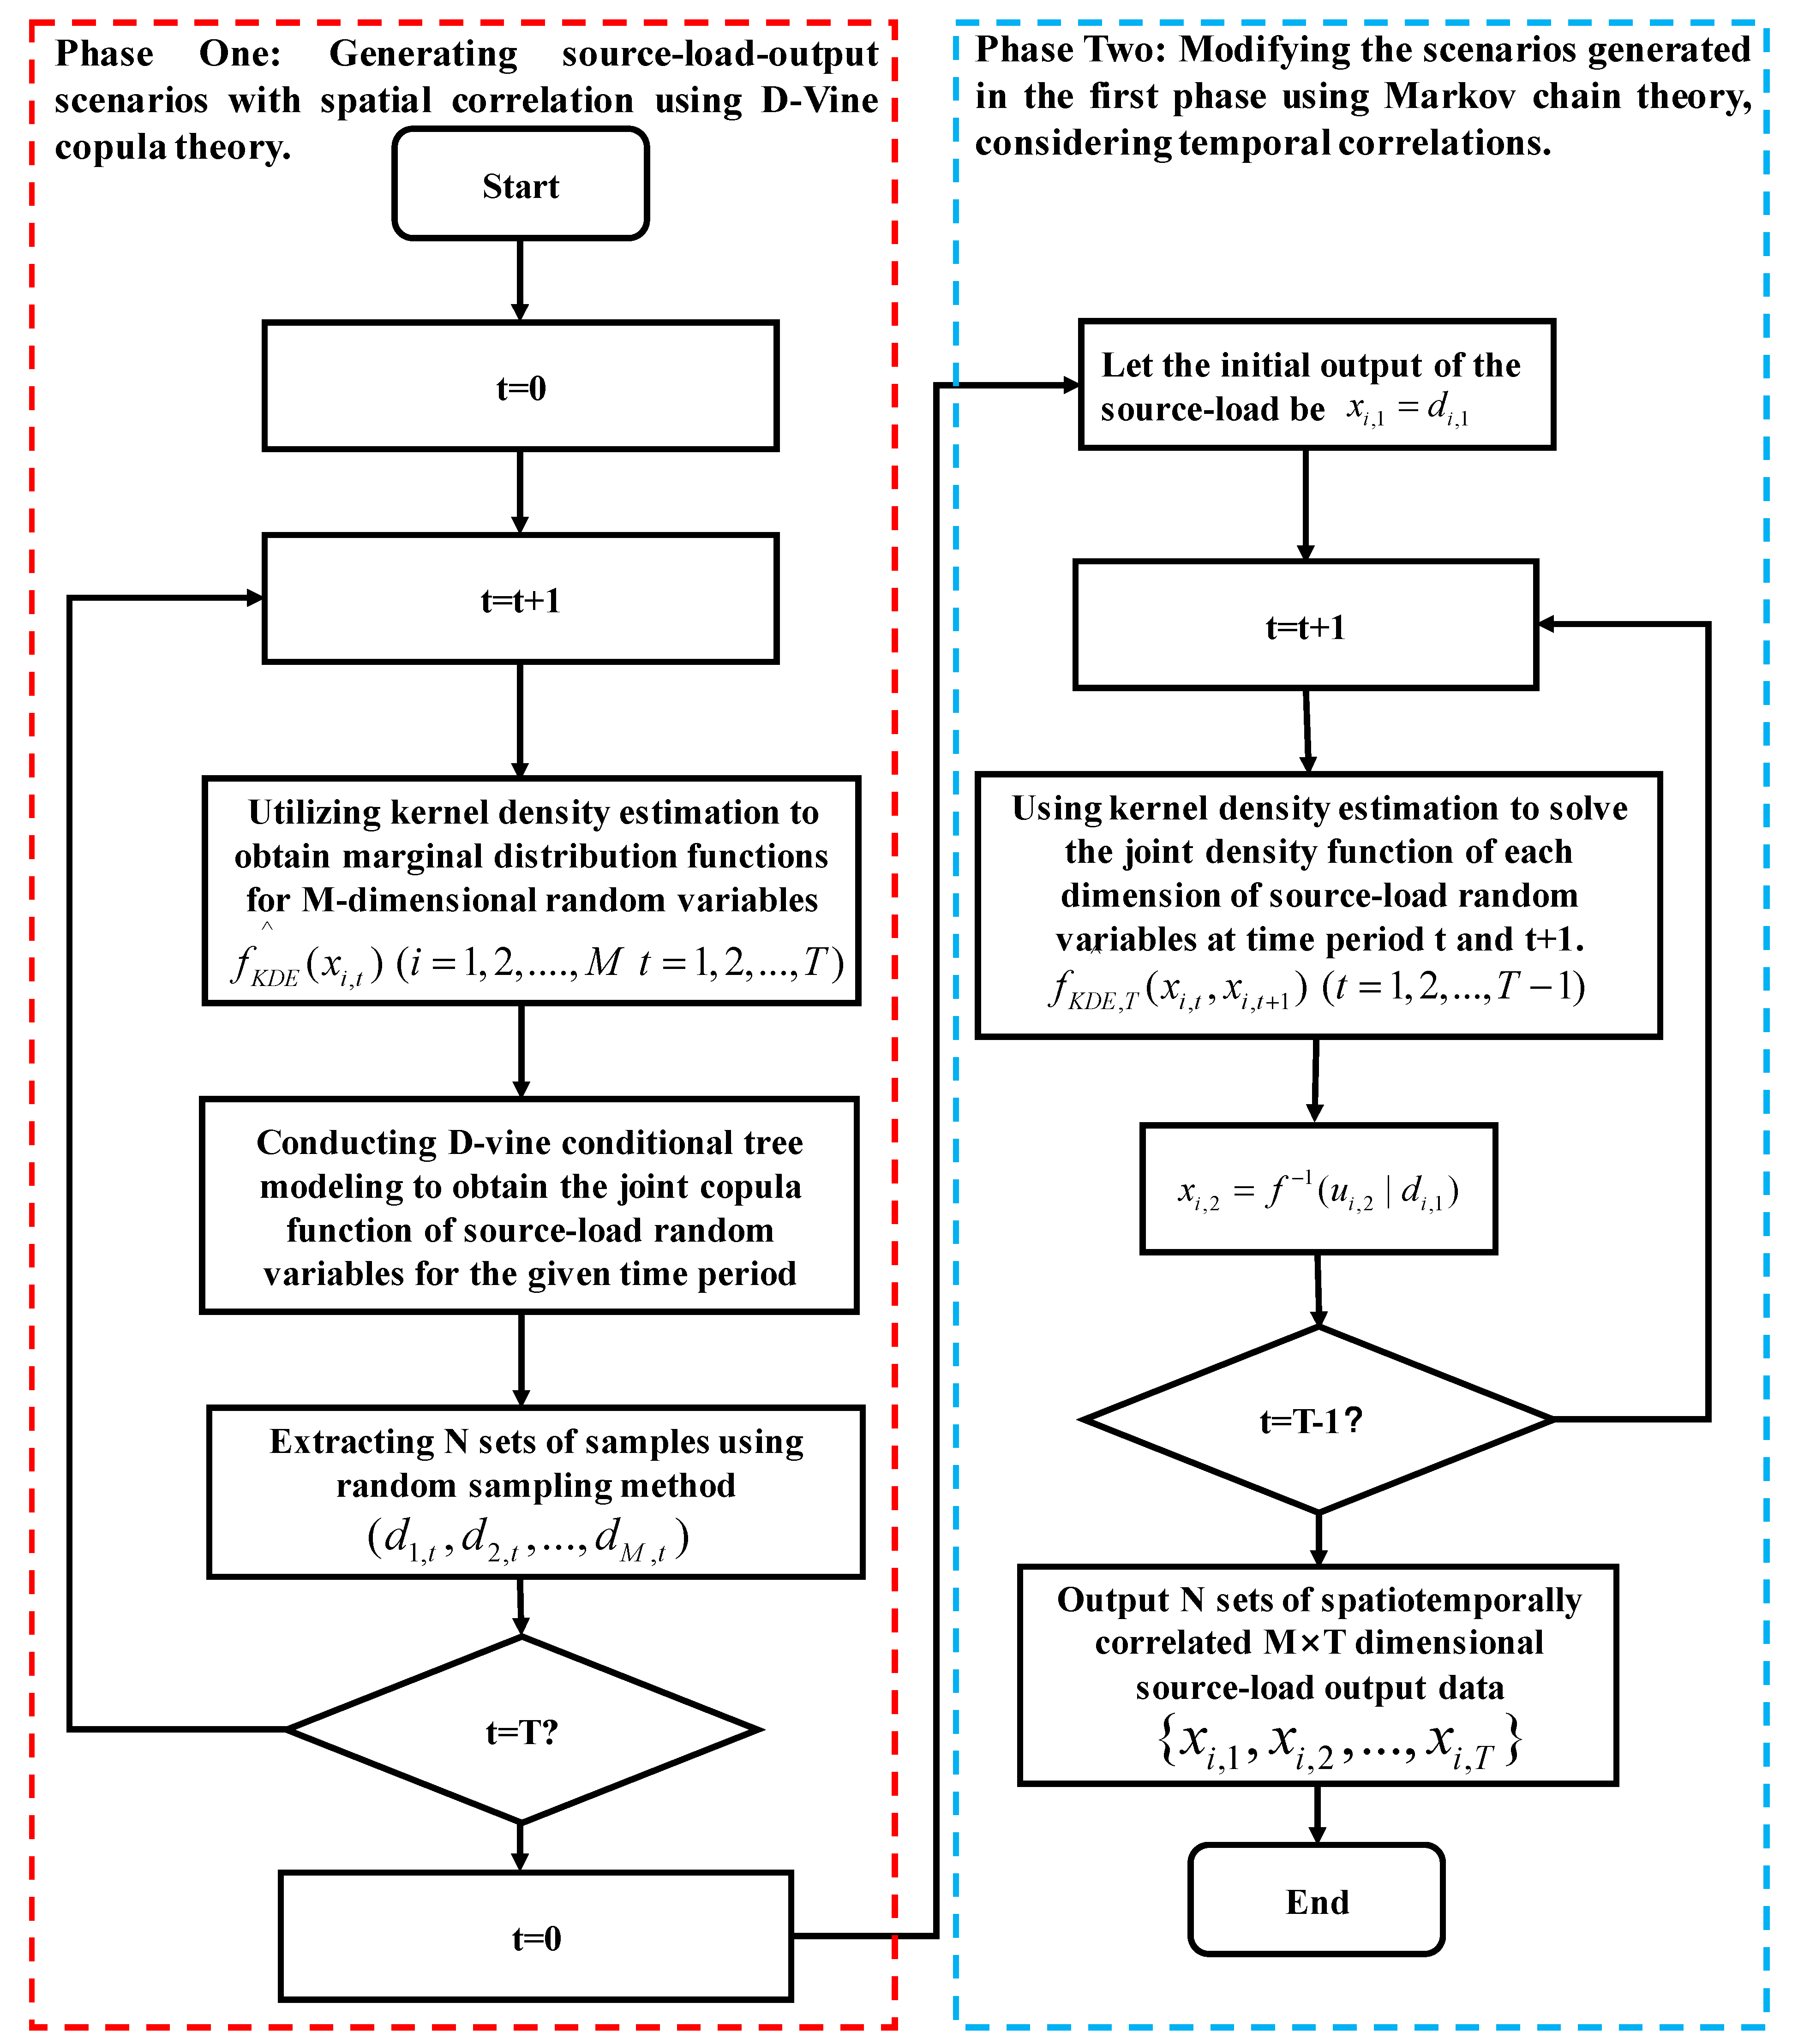
The method for generating wind power output and electric, thermal, and hydrogen load scenarios considering spatiotemporal correlation primarily involves two phases. In the first phase, the D-Vine Copula theory is employed to establish joint density function for wind turbine output, electric load, thermal load, and hydrogen load demand within each time period. And then, using a random sampling approach to sample from the joint density function, extracting
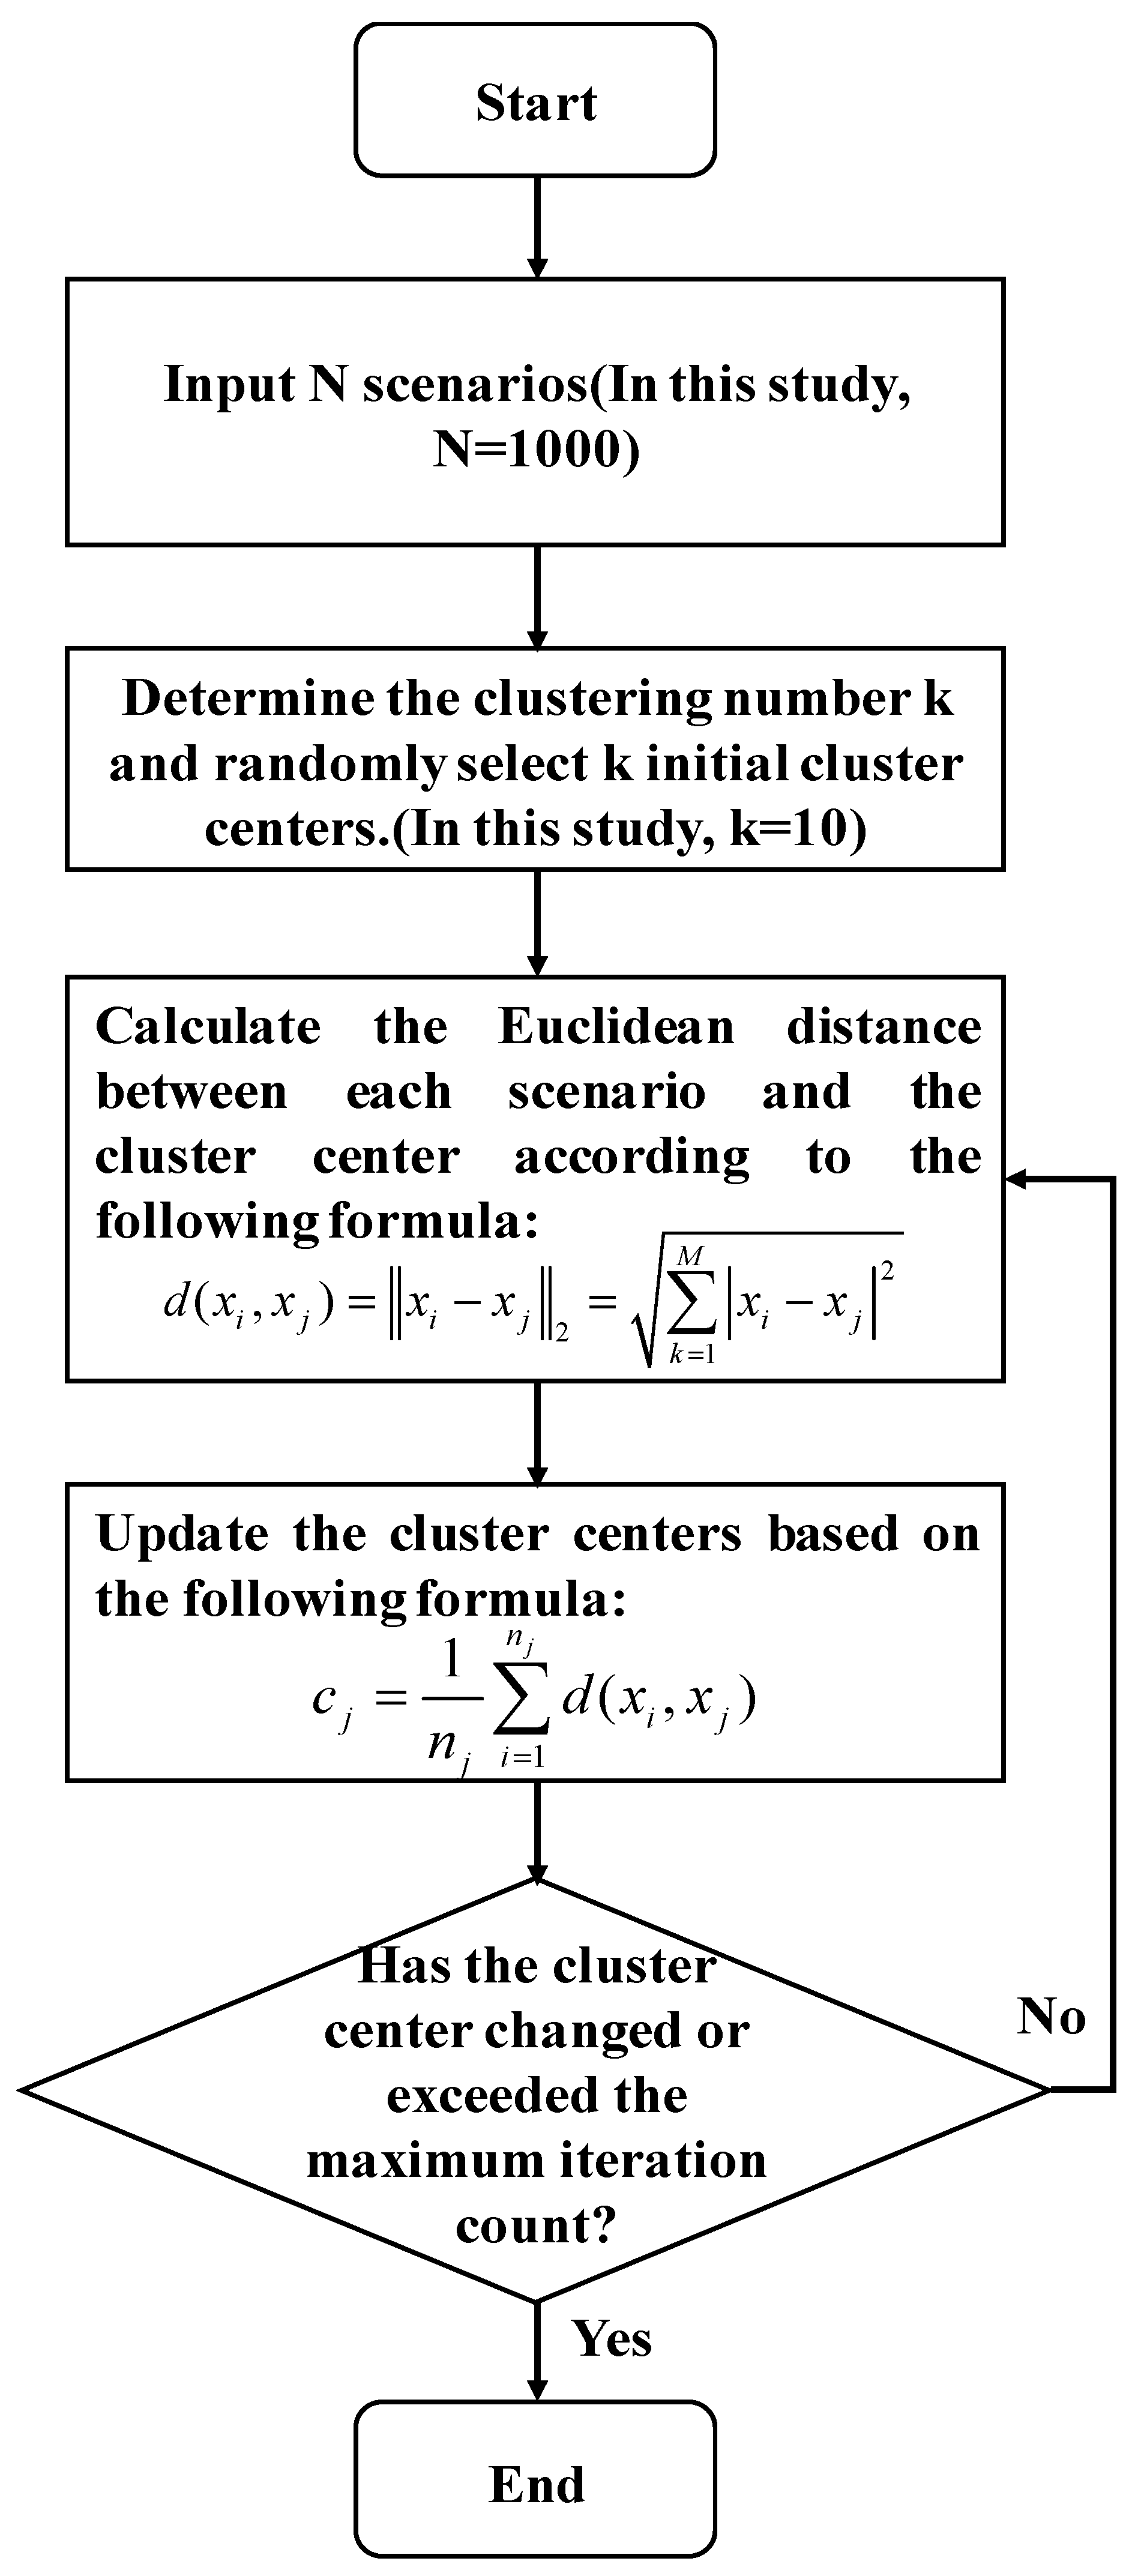
N scenarios. In the second phase, a Markov chain is utilized to construct the transition probability density functions between adjacent time periods for the same random variable. This is applied to transition the source load output scenarios obtained in the first phase, creating scenarios that satisfy both spatial and temporal correlation. Finally, the obtained scenarios are reduced through the k-means clustering method. The basic idea of the k-means clustering algorithm is to initially divide
N samples into
k groups (in this study,
k = 10). In each group, random initial cluster centers are chosen, and then the similarity between each sample and the cluster center is calculated using the formula for Euclidean distance. Highly similar samples are grouped together, and the mean of this cluster’s samples is taken as the new cluster center. This process repeats until the cluster centers no longer change or reach the maximum number of iterations. The proposed steps for scenario generation and reduction considering spatiotemporal correlation of source loads are illustrated in
Figure 5. The process of reducing
N samples into
k groups using the k-means clustering algorithm is illustrated in
Figure 6.
3.4. Scenario Evaluation Metrics
In order to ensure that the generated scenarios accurately reflect the spatiotemporal correlation among source loads, it is essential to propose relevant indicators for measuring the quality of scenarios. This paper considers the probability distribution characteristics, temporal correlation features, and spatial correlation features of the generated scenarios. The evaluation is performed using the Energy Score (ES), Brier Score (BS), and Spearman correlation coefficient [
33]. The BS indicator incorporates methods for event diagnosis, therefore, this paper defines the following two diagnostic events:
Event 1: The generated scenario’s source load output consistently exceeds 50% of the threshold within a 4 h time scale.
Event 2: The generated scenario’s fluctuation magnitude of the source load output within a 4 h time scale exceeds 10% of the threshold.
5. Results
5.1. Basic Data
This paper is based on the operational data from a chlor-alkali industrial parks in Chongqing, China. Combining with the by-product hydrogen multi-energy model, and ensuring the capacity constraints of downstream chemical enterprises, an optimized operation simulation model for the by-product hydrogen industrial park is established. The park includes 1 chlor-alkali plant, 1 wind power plant, 1 gas boiler, 1 fuel cell capable of combined heat and power generation, energy storage devices (for electricity, heat, and hydrogen), and electric, thermal, and hydrogen loads. Time-of-use electricity pricing is adopted with peak periods from 7:00 to 11:00 and 18:00 to 23:00, off-peak period from 23:00 to 7:00, and the rest as regular periods. The time-of-use electricity prices are shown in
Table 1.
Table 2 presents the parameters for the chlor-alkali chemical park, determined through empirical data. The specific values are referenced in [
25,
26,
27,
28].
5.2. Analysis of Spatiotemporal Correlation of Source Loads
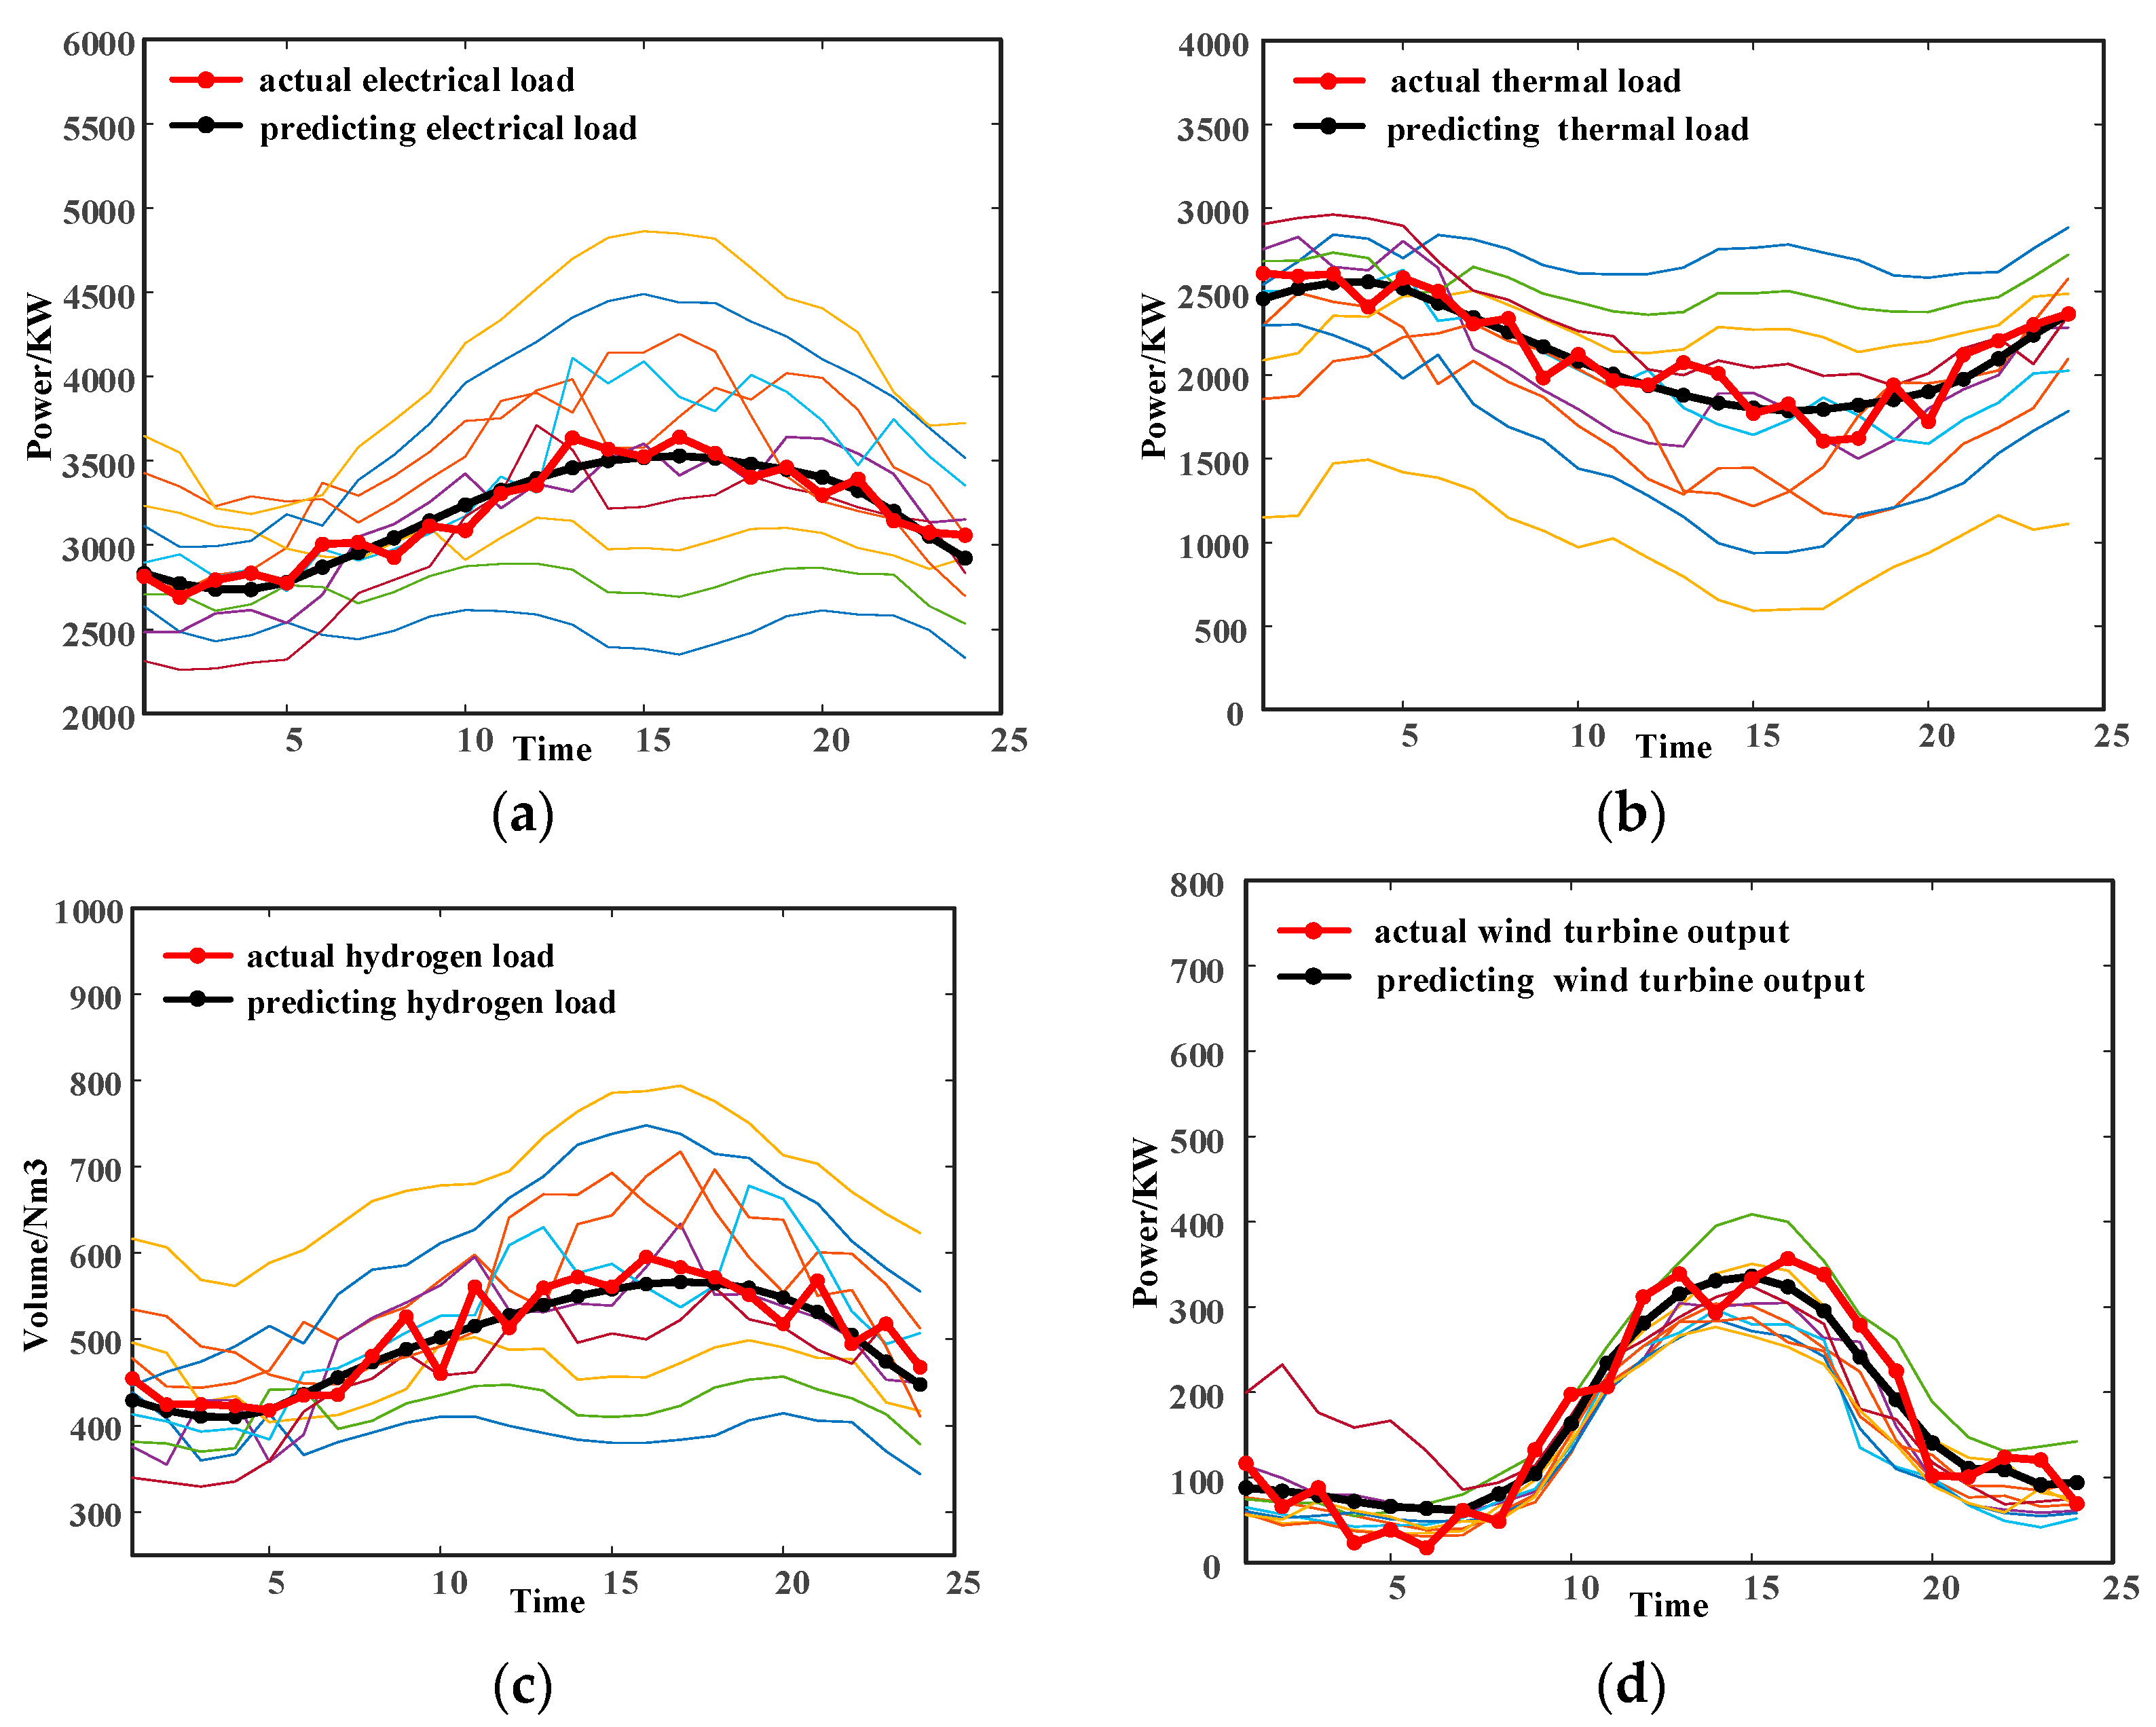
Using the spatiotemporal correlation-aware scenario generation method proposed in this paper, 1000 scenarios of wind turbine output, electrical load, thermal load, and hydrogen load are generated. Through the scenario reduction method, the scenarios are reduced to 10. The reduced scenario outputs (which represented by colored curves), predicted outputs (which represented by black curves), and actual outputs (which represented by red curves) are shown in
Figure 7. Among them, the prediction curve is obtained by taking the average of the historical data for the load. The corresponding probabilities are listed in
Table 3. From the figure, it can be observed that the predicted output and the actual output of the source load generally follow the same trend. However, at certain points, the predicted values may be higher or lower, indicating that the predicted curve cannot accurately describe the fluctuation of the source load under actual conditions. Relying solely on the predicted output of the source load for optimization scheduling in the by-product hydrogen multi-energy system may lead to unreasonable system scheduling results. On the other hand, the source load output scenarios obtained using the scenario generation method proposed in this paper cover the actual outputs, fully reflecting the uncertainty of the actual source load outputs. This ensures that the optimization scheduling results of the subsequent by-product hydrogen multi-energy system are more adaptable to the actual source load conditions.
- 2.
Analysis of Scenario Effectiveness
To verify whether the reduced scenarios accurately reflect the spatiotemporal correlation features among source loads, three source load output scenario generation schemes were designed in this section, and the effectiveness of the reduced scenarios was analyzed using the scenario evaluation metrics proposed in
Section 3.4.
Scheme One: Only considering the spatial correlation features of source loads. The D-Vine Copula theory was used to establish the joint probability density function among wind turbine output, electrical load, thermal load, and hydrogen load. Through Latin Hypercube sampling, 1000 source load output scenarios were extracted, and finally, the scenario reduction method was applied to reduce the scenarios to 10.
Scheme Two: Only considering the temporal correlation features of source loads. Separate Markov chain models were constructed for wind turbine output, electrical load, thermal load, and hydrogen load, obtaining transition density functions between consecutive time periods. Using Latin Hypercube sampling, 1000 source load output scenarios were extracted, and the scenario reduction method was applied to reduce the scenarios to 10.
Scheme Three: Simultaneously considering the spatial and temporal correlation features of source loads. The method described in
Section 3.3 was used to generate 1000 source load output scenarios, and the scenario reduction method was applied to reduce the scenarios to 10.
- ①
The probability distribution characteristics
The ES (Energy Score) index represents the distance between the generated scenarios of source load output and the cumulative distribution function of the actual values. A smaller ES index indicates a smaller distance, implying that the generated scenarios better match the actual values. Calculating the ES index for the three schemes, the results are shown in
Table 4 below. As seen from the table, Scheme Three has a significantly smaller ES index compared to the first two schemes, indicating that the reduced scenarios in Scheme Three better align with the probability distribution of wind turbine output, electricity load, heat load, and hydrogen load requirements in actual situations.
- ②
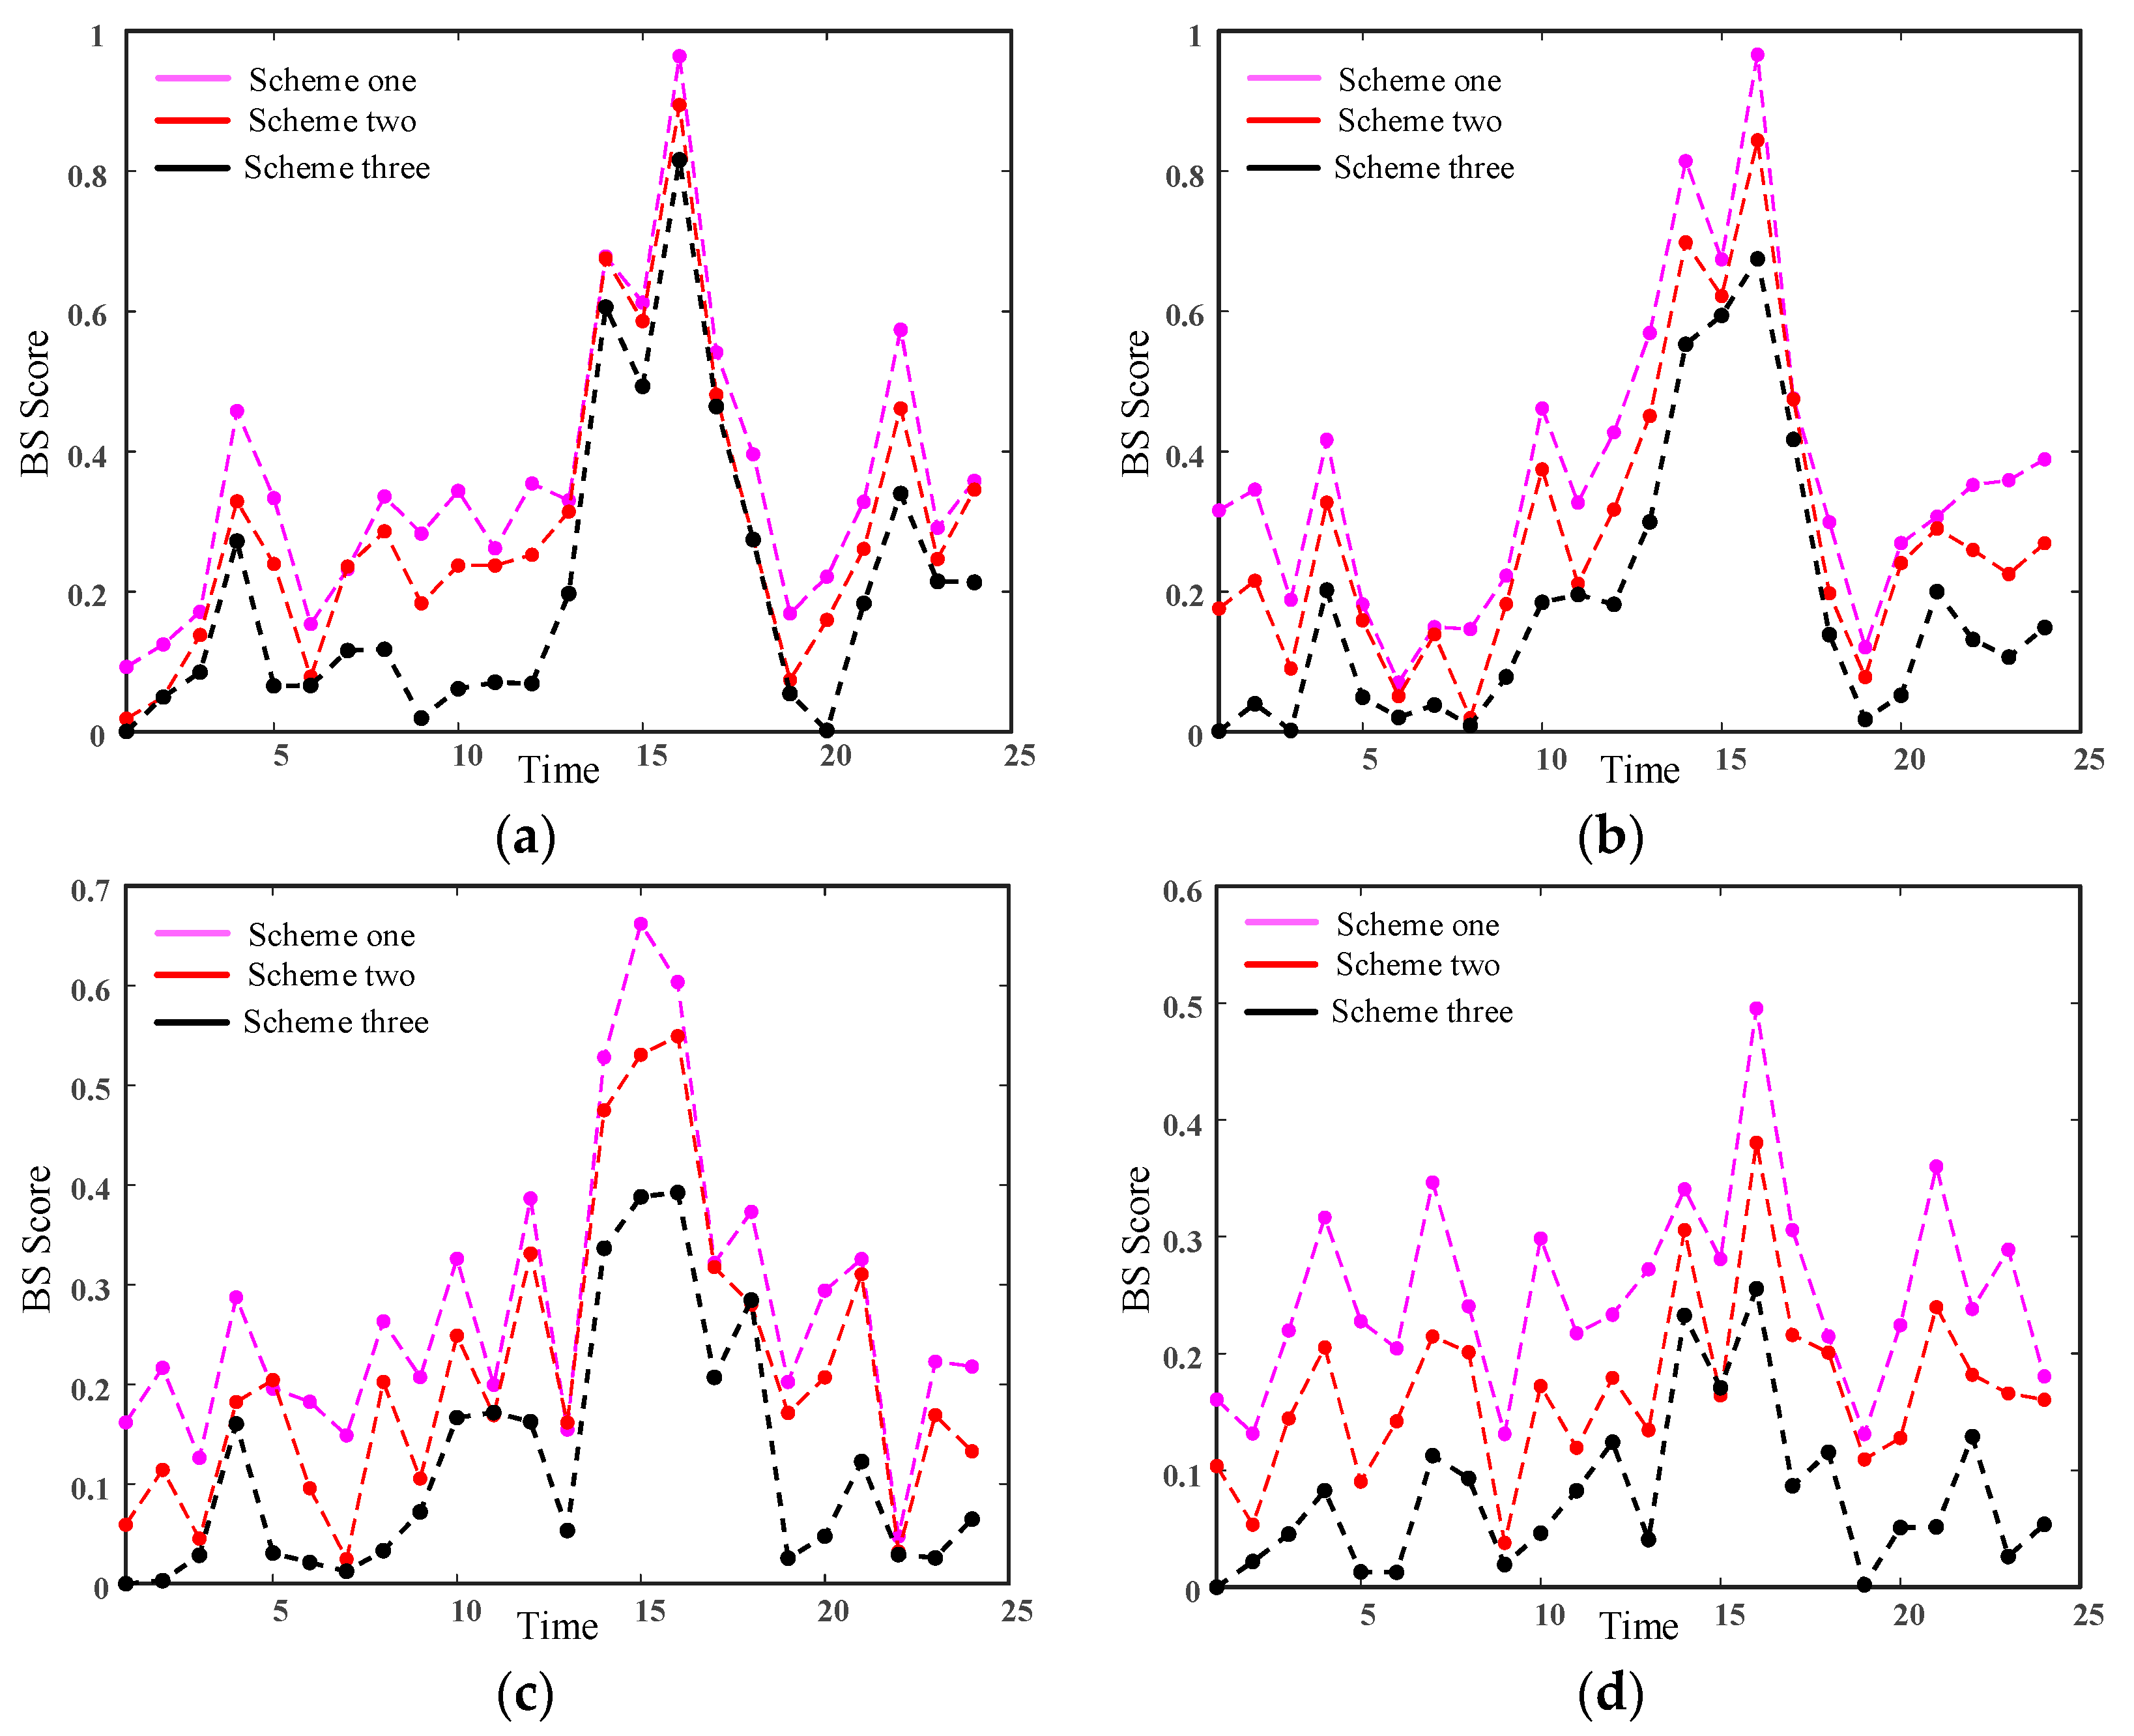
Temporal Correlation Features
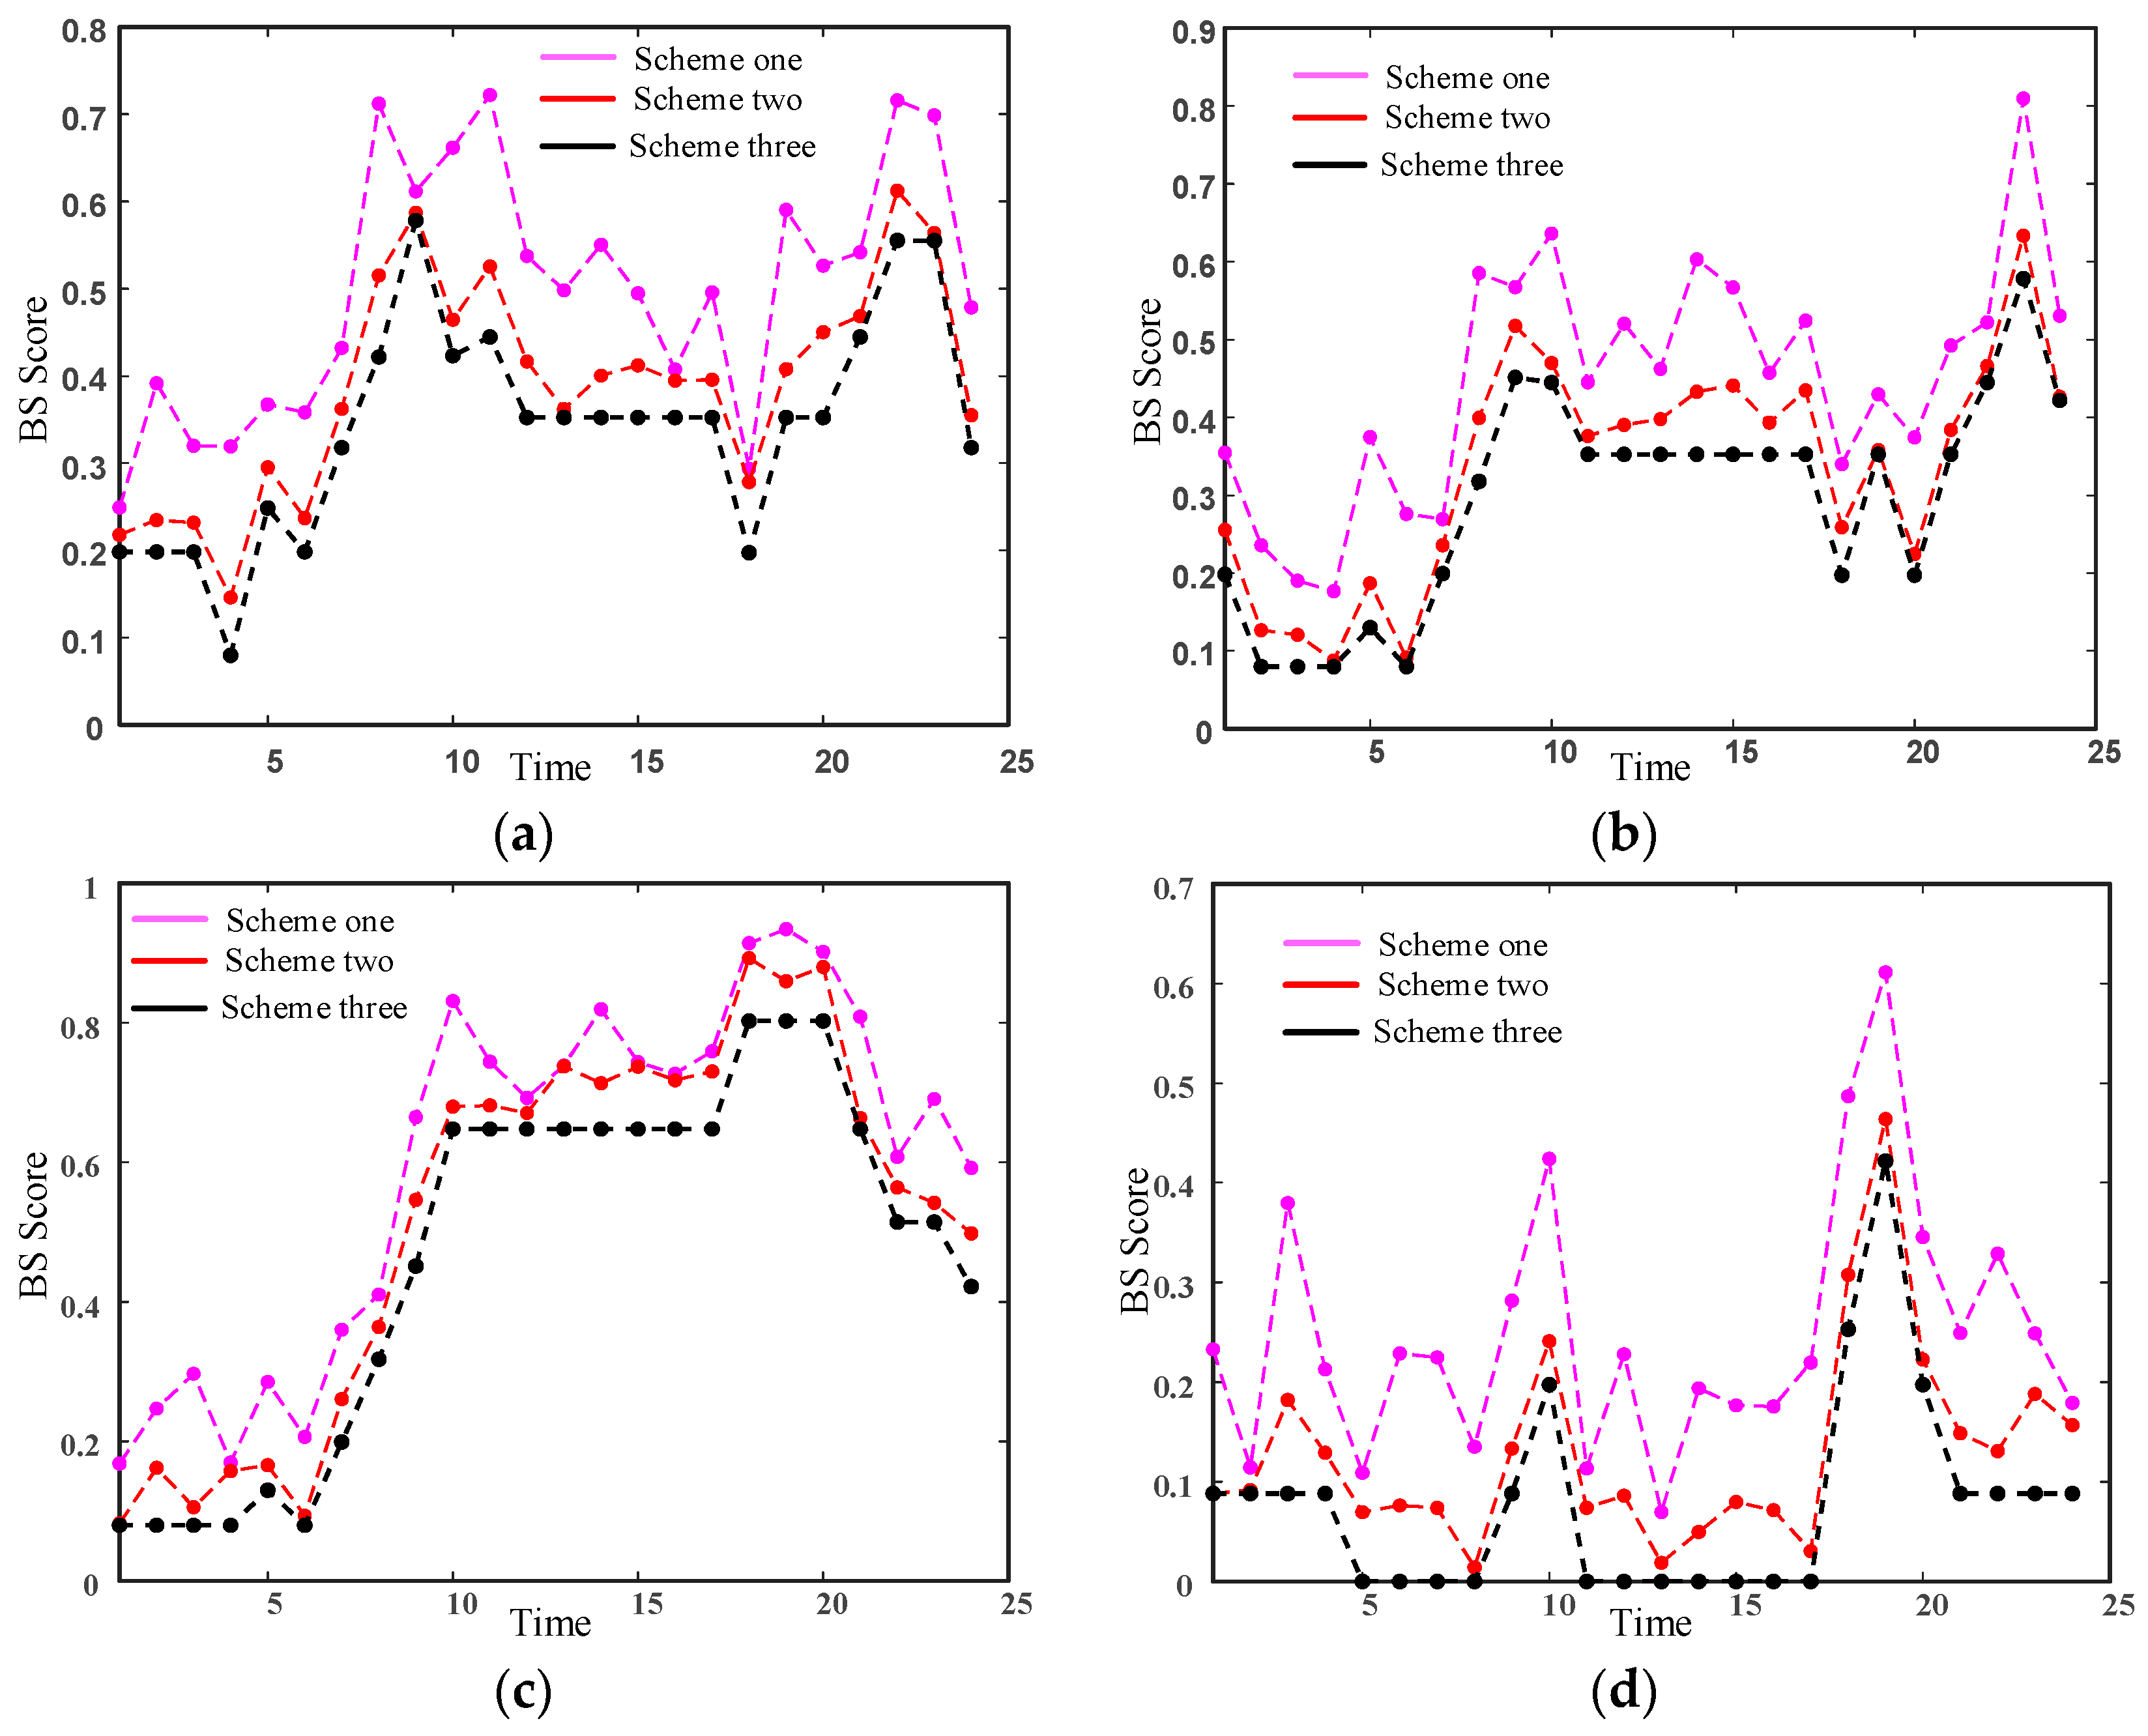
The BS index can be determined by calculating the error between the simulated load-output scenarios and the time trajectory of the measured values, allowing for an assessment of the quality of the scenarios. Therefore, a smaller BS index indicates that the load-output scenarios closely resemble the fluctuation characteristics of the measured values. The calculated BS indices for three scenarios are shown in
Figure 8 and
Figure 9, and it is evident that, for both events, Scheme three has the smallest BS index because it considers both temporal and spatial correlations. It utilizes a Markov chain model to regulate the volatility of output between adjacent time periods, thereby generating scenarios that more accurately describe the temporal correlations among the loads.
- ③
Spatial Correlation Features
The sum of Euclidean distances between the Spearman correlation coefficient matrices for different schemes and the actual situation was calculated. The results are shown in
Table 5, indicating that scheme three has the smallest difference from the Spearman correlation coefficient matrix of the actual situation. This is attributed to scheme three considering both temporal and spatial correlations, using D-Vine Copula theory to regulate the correlation among multidimensional variables. As a result, the generated scenarios more accurately describe the spatial correlations among the source and load.
This section presents a method for generating scenarios that takes into account the spatiotemporal correlation among source and loads. This method is independent of specifications of industrial process and is not only applicable to the by-produced hydrogen multi-energy coupling system proposed in this paper but can also be extended to other energy system for comprehensive correlation analysis related to various energy sources and loads.
5.3. Verification of By-Product Hydrogen Systems in Chlor-Alkali Industrial Park
In order to verify the economic and low-carbon performance of the by-product hydrogen system in the chlor-alkali industrial park, this paper designs the following 4 cases for comparative analysis:
Case 1: By-product hydrogen produced by the chlor-alkali plant is used to manufacture downstream chemical products while meeting production capacity constraints, and excess by-product hydrogen is vented (conventional utilization of the by-product hydrogen).
Case 2: Building upon Case 1, considering that excess by-product hydrogen can be used to generate thermal energy through combustion in gas boilers and mixed combustion with natural gas.
Case 3: Building upon Case 1, considering that excess by-product hydrogen can be used for combined heat and power generation through fuel cells, yielding additional revenue.
Case 4: The proposed co-generation model for by-product hydrogen, where by-product hydrogen is utilized for producing downstream chemical products, combustion in gas boilers mixed with natural gas, and combined heat and power generation through fuel cells.
Table 6 shows the optimization results of the cost (in thousands of yuan) for the MESBPH under different cases, while
Table 7 demonstrates the optimization results of the carbon emissions (in tons) for the different cases. Regarding the improvement of the system’s economic benefits,
Table 6 reveals that, compared to Case 1, the total profit of the system in Case 4, which considers the multiple pathways for utilizing by-product hydrogen, increases from 235.618 thousand yuan to 266.782 thousand yuan, a rise of 13.22%. This increase in system profit primarily stems from the diverse utilization of by-product hydrogen, which reduces the costs of purchasing electricity and gas. However, in terms of the profit of the chlor-alkali plant, Case 4 reduces it by approximately 10.6 thousand yuan compared to Case 1. This reduction is due to the multiple utilization pathways of by-product hydrogen, leading to a decrease in the amount of by-product hydrogen flowing to downstream chemical enterprises. Although the multi-energy coupling mode of by-product hydrogen might decrease the economic efficiency of the chlor-alkali plant, sacrificing its profit to some extent is beneficial for enhancing the overall profit of the park from a multi-energy optimization perspective. In comparison to Case 2, Case 4 sees an increase in the total profit of the system from 243.663 thousand yuan to 266.782 thousand yuan, a rise of 9.49%. The profit of the chlor-alkali plant decreases by 10.6 thousand yuan. This is because the multiple utilization pathways of by-product hydrogen in Case 4, especially for combined heat and power generation by fuel cells, lead to a higher efficiency, thereby reducing the profit from by-product hydrogen used in the production of downstream PVC chemical products. In comparison to Case 3, the multiple utilization pathways of by-product hydrogen in Case 4 increase its combustion in the gas boiler, which decreases costs such as gas purchasing and carbon trading. However, the reduction in the amount of by-product hydrogen used for fuel cells increases the system’s electricity purchasing cost, resulting in a less significant improvement in the overall economic profit of the system. Nevertheless, considering the significance of hydrogen-blended combustion in the boiler for environmental benefits, the consideration of Case 4 goes beyond merely improving economic efficiency.
In terms of enhancing environmental benefits,
Table 7 illustrates that the carbon emissions of the system mainly include carbon emissions within the park and those from purchasing electricity from the upstream grid. Compared to Case 1, Case 4 sees a decrease in both the carbon emissions within the park and those from purchasing electricity from the upstream grid. In comparison to Case 2, the carbon emissions within the park increase by 0.3570 tons, while the carbon emissions from purchasing electricity from the upstream grid decrease by 43.7987 tons. This is because the carbon emissions within the park mainly come from the combustion of natural gas in the gas boiler, and the multiple pathways for utilizing by-product hydrogen in Case 4 reduce the amount of by-product hydrogen used for hydrogen-blended combustion, leading to an increase in carbon emissions from the gas boiler and a decrease in carbon emissions from purchasing electricity from the upstream grid. Compared to Case 3, the carbon emissions within the park decrease by 2.3856 tons, while the carbon emissions from purchasing electricity from the upstream grid increase by 6.1685 tons. In Case 4, by-product hydrogen is not only used for fuel cells but also for hydrogen-blended combustion in the gas boiler. Thus, the carbon emissions from the gas boiler decrease, while the carbon emissions from purchasing electricity from the upstream grid increase due to the increased utilization of by-product hydrogen.
In summary, Case 4 shows improvements in both economic and environmental benefits compared to Case 1. Although the carbon emissions within the park slightly increase by 0.3570 tons in Case 4 compared to Case 2, the economic benefits of the system increase by 2.3119 million yuan. Compared to Case 3, the economic benefits of the system slightly increase, and the carbon emissions within the park decrease. It is evident that the proposed multi-energy coupling mode for by-product hydrogen has a significant promoting effect on both the carbon emissions and economic benefits of the system.
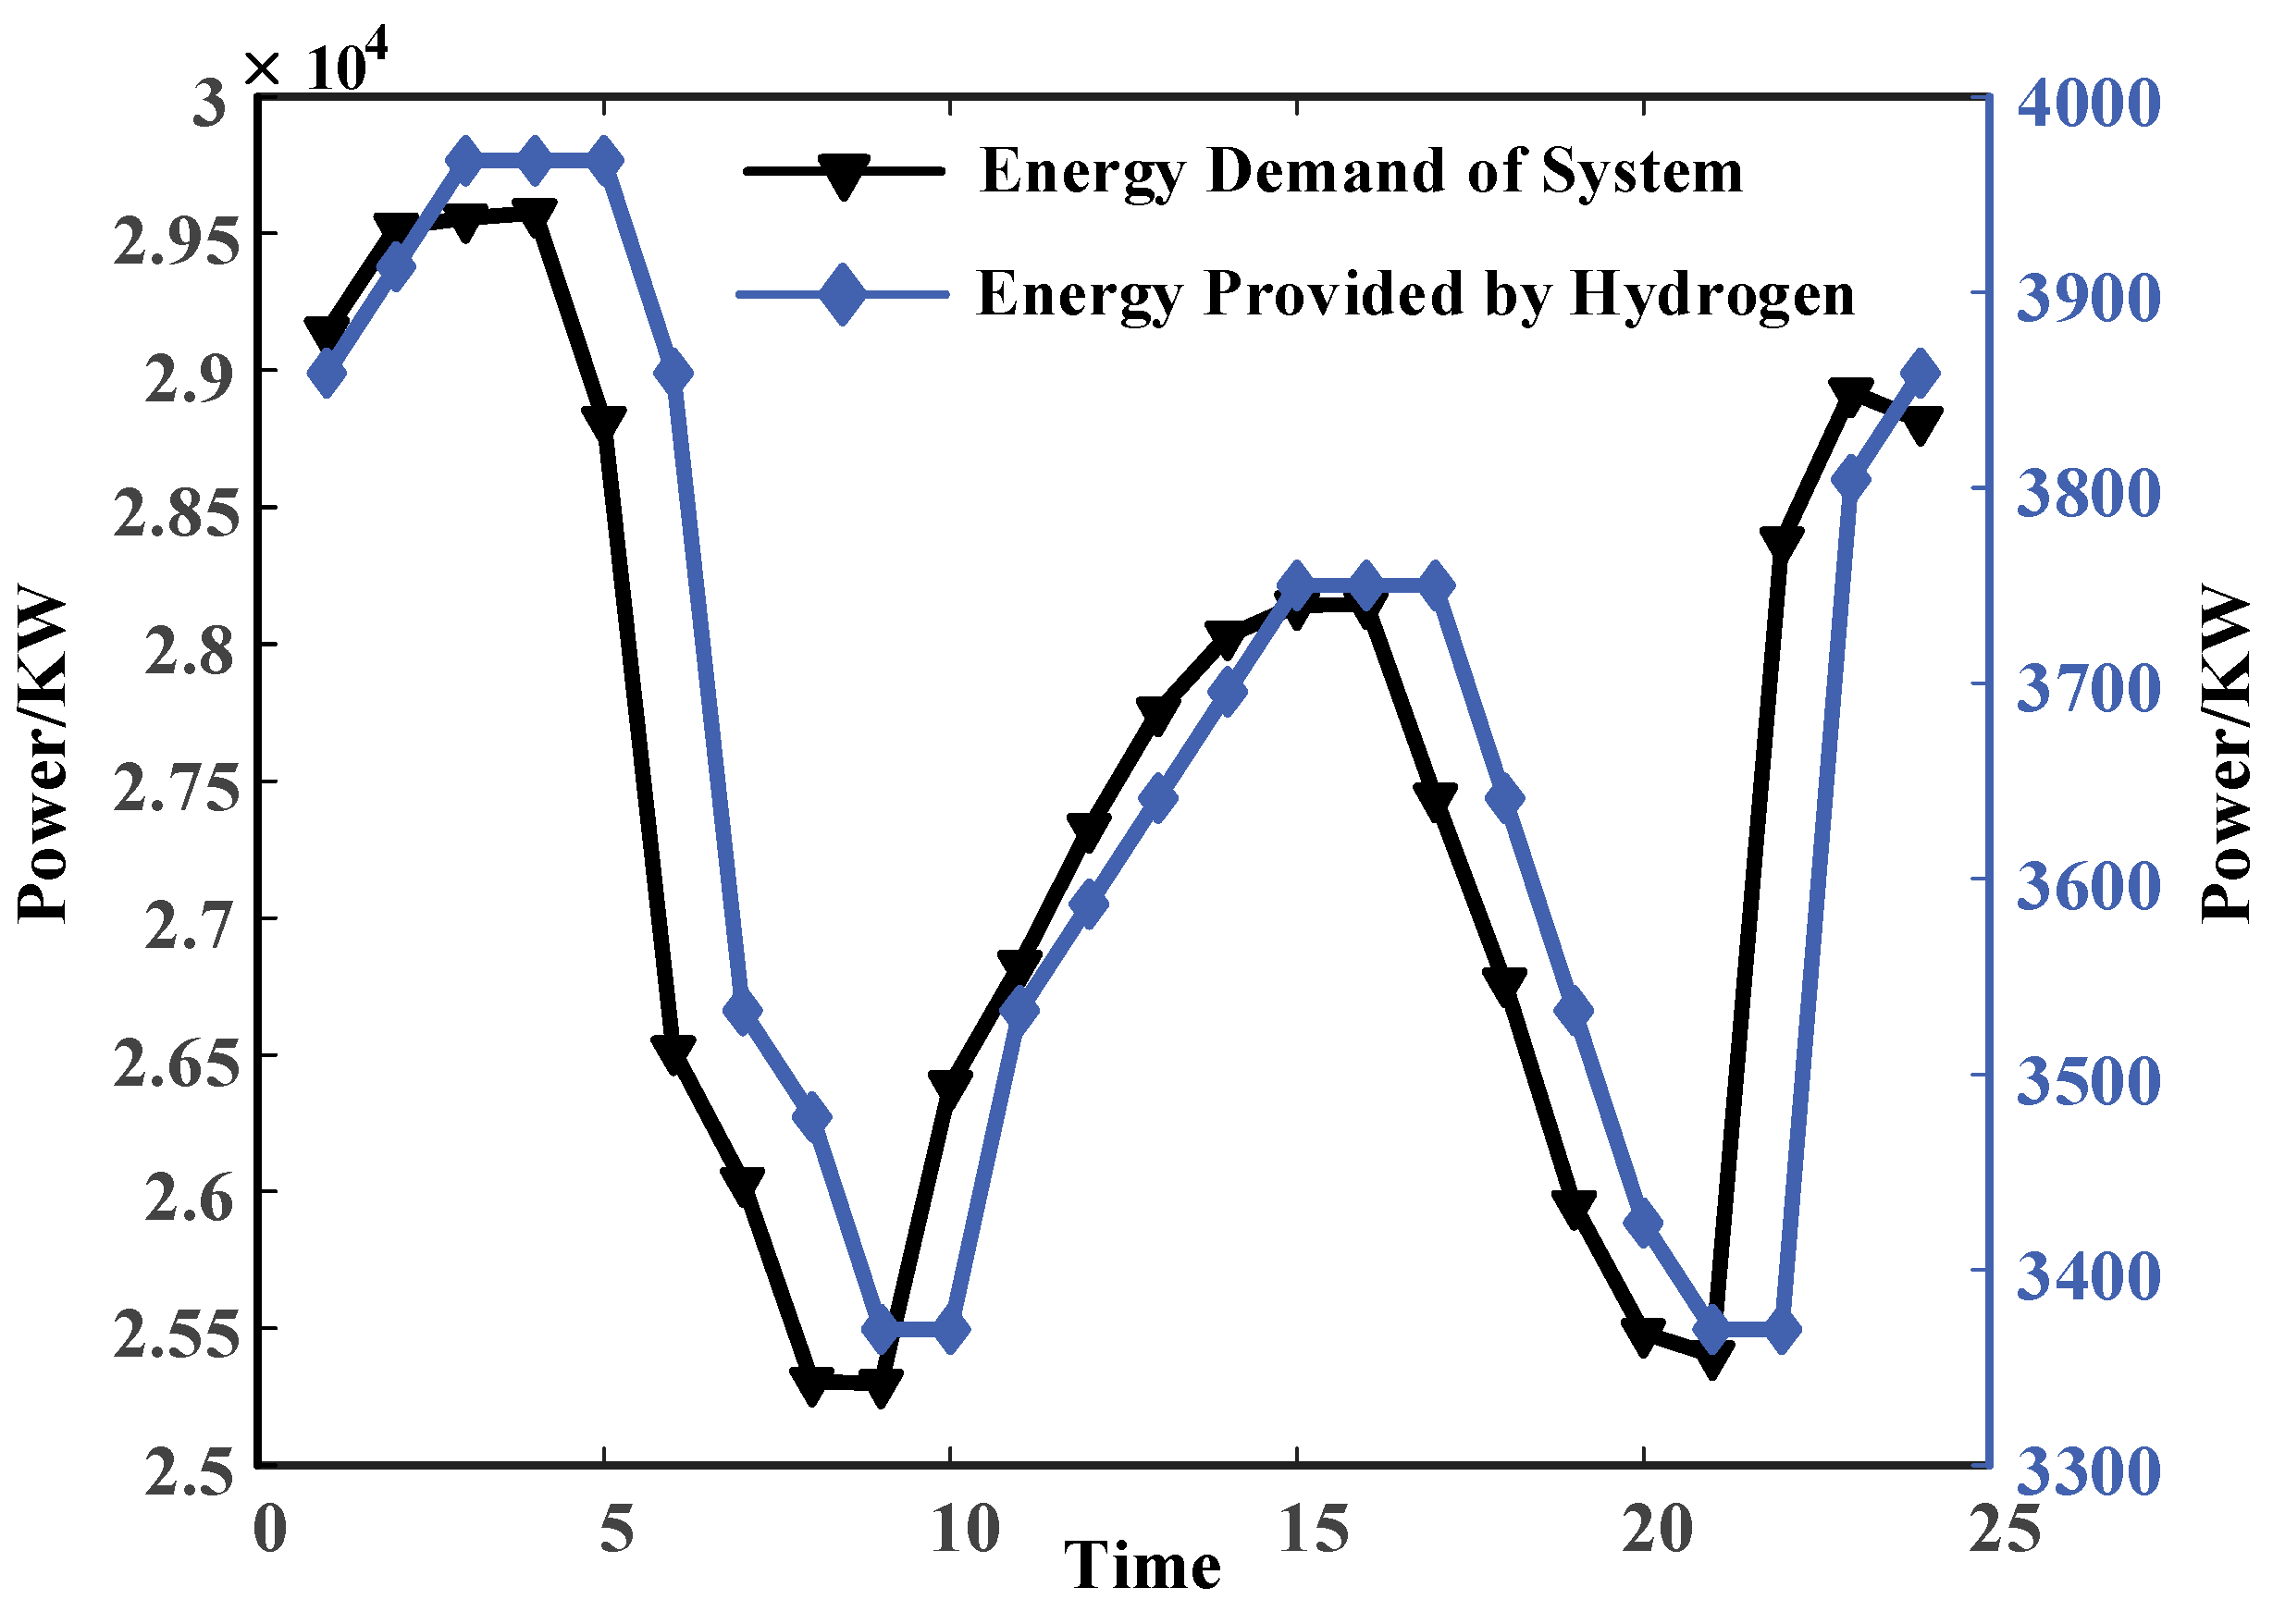
The energy consumption in the chlor-alkali industrial park is primarily composed of electricity and thermal. The rational utilization of by-product hydrogen can reduce the system’s dependency on upstream energy sources. Furthermore, the multi-energy coupling of by-product hydrogen can mitigate fluctuations in the system’s demand for upstream energy. As shown in
Figure 10, during the periods of 23:00–4:00 and 13:00–17:00, when the chlor-alkali plant has higher production capacity and the system experiences higher energy demand, the production of by-product hydrogen from the plant is also substantial. This surplus can be effectively converted into various forms of energy. In contrast, during the remaining periods when the chlor-alkali plant has lower production capacity and the system requires less energy, the production of by-product hydrogen is lower, resulting in a reduced capacity for energy conversion.


