Article

Velocity Augmentation Model for an Empty Concentrator-Diffuser-Augmented Wind Turbine and Optimisation of Geometrical Parameters Using Surface Response Methodology

Physics Department, Faculty of Science & Agriculture, University of Fort Hare, Alice 5700, South Africa
*
Author to whom correspondence should be addressed.
Sustainability 2024, 16(4), 1707; https://doi.org/10.3390/su16041707
Submission received: 27 December 2023 / Revised: 15 February 2024 / Accepted: 16 February 2024 / Published: 19 February 2024
(This article belongs to the Special Issue Applications and Technologies of Renewable Energy)

Abstract

:
Wind energy, renowned for cost-effectiveness and eco-friendliness, addresses global energy needs amid fossil fuel scarcity and environmental concerns. In low-wind speed regions, optimising wind turbine performance becomes vital and achievable by augmenting wind velocity at the turbine rotor using augmentation systems such as concentrators and diffusers. This study focuses on developing a velocity augmentation model that correctly predicts the throat velocity in an empty concentrator-diffuser-augmented wind turbine (CDaugWT) design and determines optimal geometrical parameters. Utilising response surface methodology (RSM) in Design Expert 13 and computational fluid dynamics (CFD) in ANSYS Fluent, 86 runs were analysed, optimising parameters such as diffuser and concentrator angles and lengths, throat length, and flange height. The ANOVA analysis confirmed the model’s significance (p < 0.05). Notably, the interaction between the concentrator’s length and the diffuser’s length had the highest impact on the throat velocity. The model showed a strong correlation (R2 = 0.9581) and adequate precision (ratio value of 49.655). A low coefficient of variation (C.V.% = 0.1149) highlighted the model’s reliability. The findings revealed a 1.953-fold increase in inlet wind speed at the throat position. Optimal geometrical parameters for the CDaugWT included a diffuser angle of 10 ° , concentrator angle of 20 ° , concentrator length of 375 mm (0.62 R t h ), diffuser length of 975 mm (1.61 R t h ), throat length of 70 mm (0.12 R t h ), and flange height of 100 mm (0.17 R t h ) where R t h is the throat radius. A desirability value of 0.9, close to 1, showed a successful optimisation. CFD simulations and RSM reduced calculation cost and time when determining optimal geometrical parameters for the CDaugWT design.

1. Introduction

Many without electricity worldwide reside in rural areas, and South Africa is not an exception, with an estimated 3.5 million households not connected to the national electricity grid [1]. The Electricity Supply Commission (ESKOM), the main energy supplier, notes that expanding the grid to these rural communities is expensive. Given their remote nature, low population density, and low-income levels, it becomes challenging for ESKOM to recover capital and operating costs solely from tariffs [1,2]. The potential expansion of wind energy into these areas could drive technological advances, contributing to a cleaner energy mix. As a clean and consistently renewable resource, wind energy plays a crucial role in reducing carbon dioxide emissions and mitigating the effects of climate change [3,4]. Although wind turbine technology may be an alternative source of electricity in such areas, its effectiveness is often hindered by low wind speeds. In addition, most commercially available wind turbines were designed for high wind speeds; thus, they do not work efficiently in areas of low wind speeds. Therefore, shrouded wind turbines have been suggested in the literature to augment the power output of wind turbines in low-wind speed regions in order to address this issue [5,6]. Shrouded wind turbines enhance wind energy capture by increasing wind velocity as it passes through the throat region of ducts while retaining the original energy extraction method employed by bare wind turbines [7,8]. Numerous studies suggest that shrouded wind turbines can outperform their bare counterparts, producing more wind power at lower cut-in wind speeds and allowing for extended operation throughout the year [7,9,10,11].
Additionally, shrouded turbines may surpass the Betz limit, signifying peak efficiency and mitigating energy losses related to tip vortices [10,11,12,13]. Shrouded wind turbines offer additional advantages, including noise reduction, reduced risk of blade failure, improved bird safety, and enhanced performance in turbulent environments [14]. Despite being promising for built environments and small-scale applications [14], hub flow separation can impact shrouded turbine performance, hindering the shroud’s ability to capture mass [
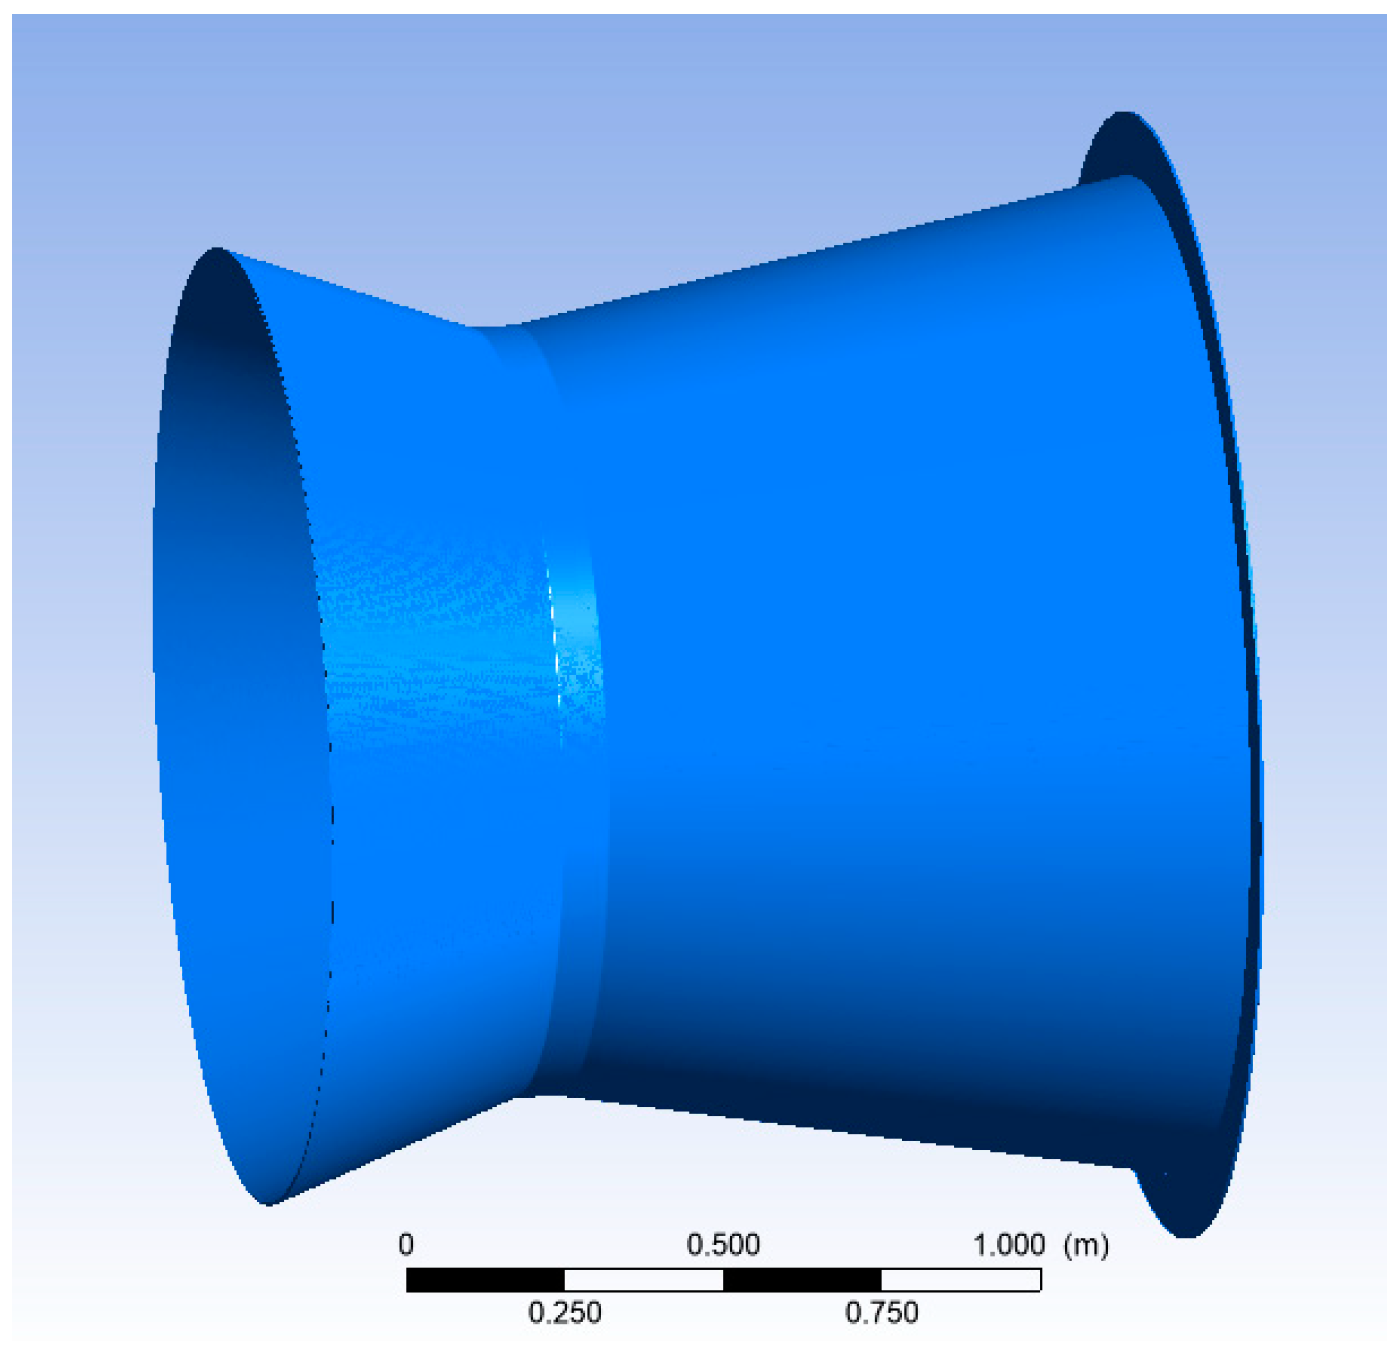
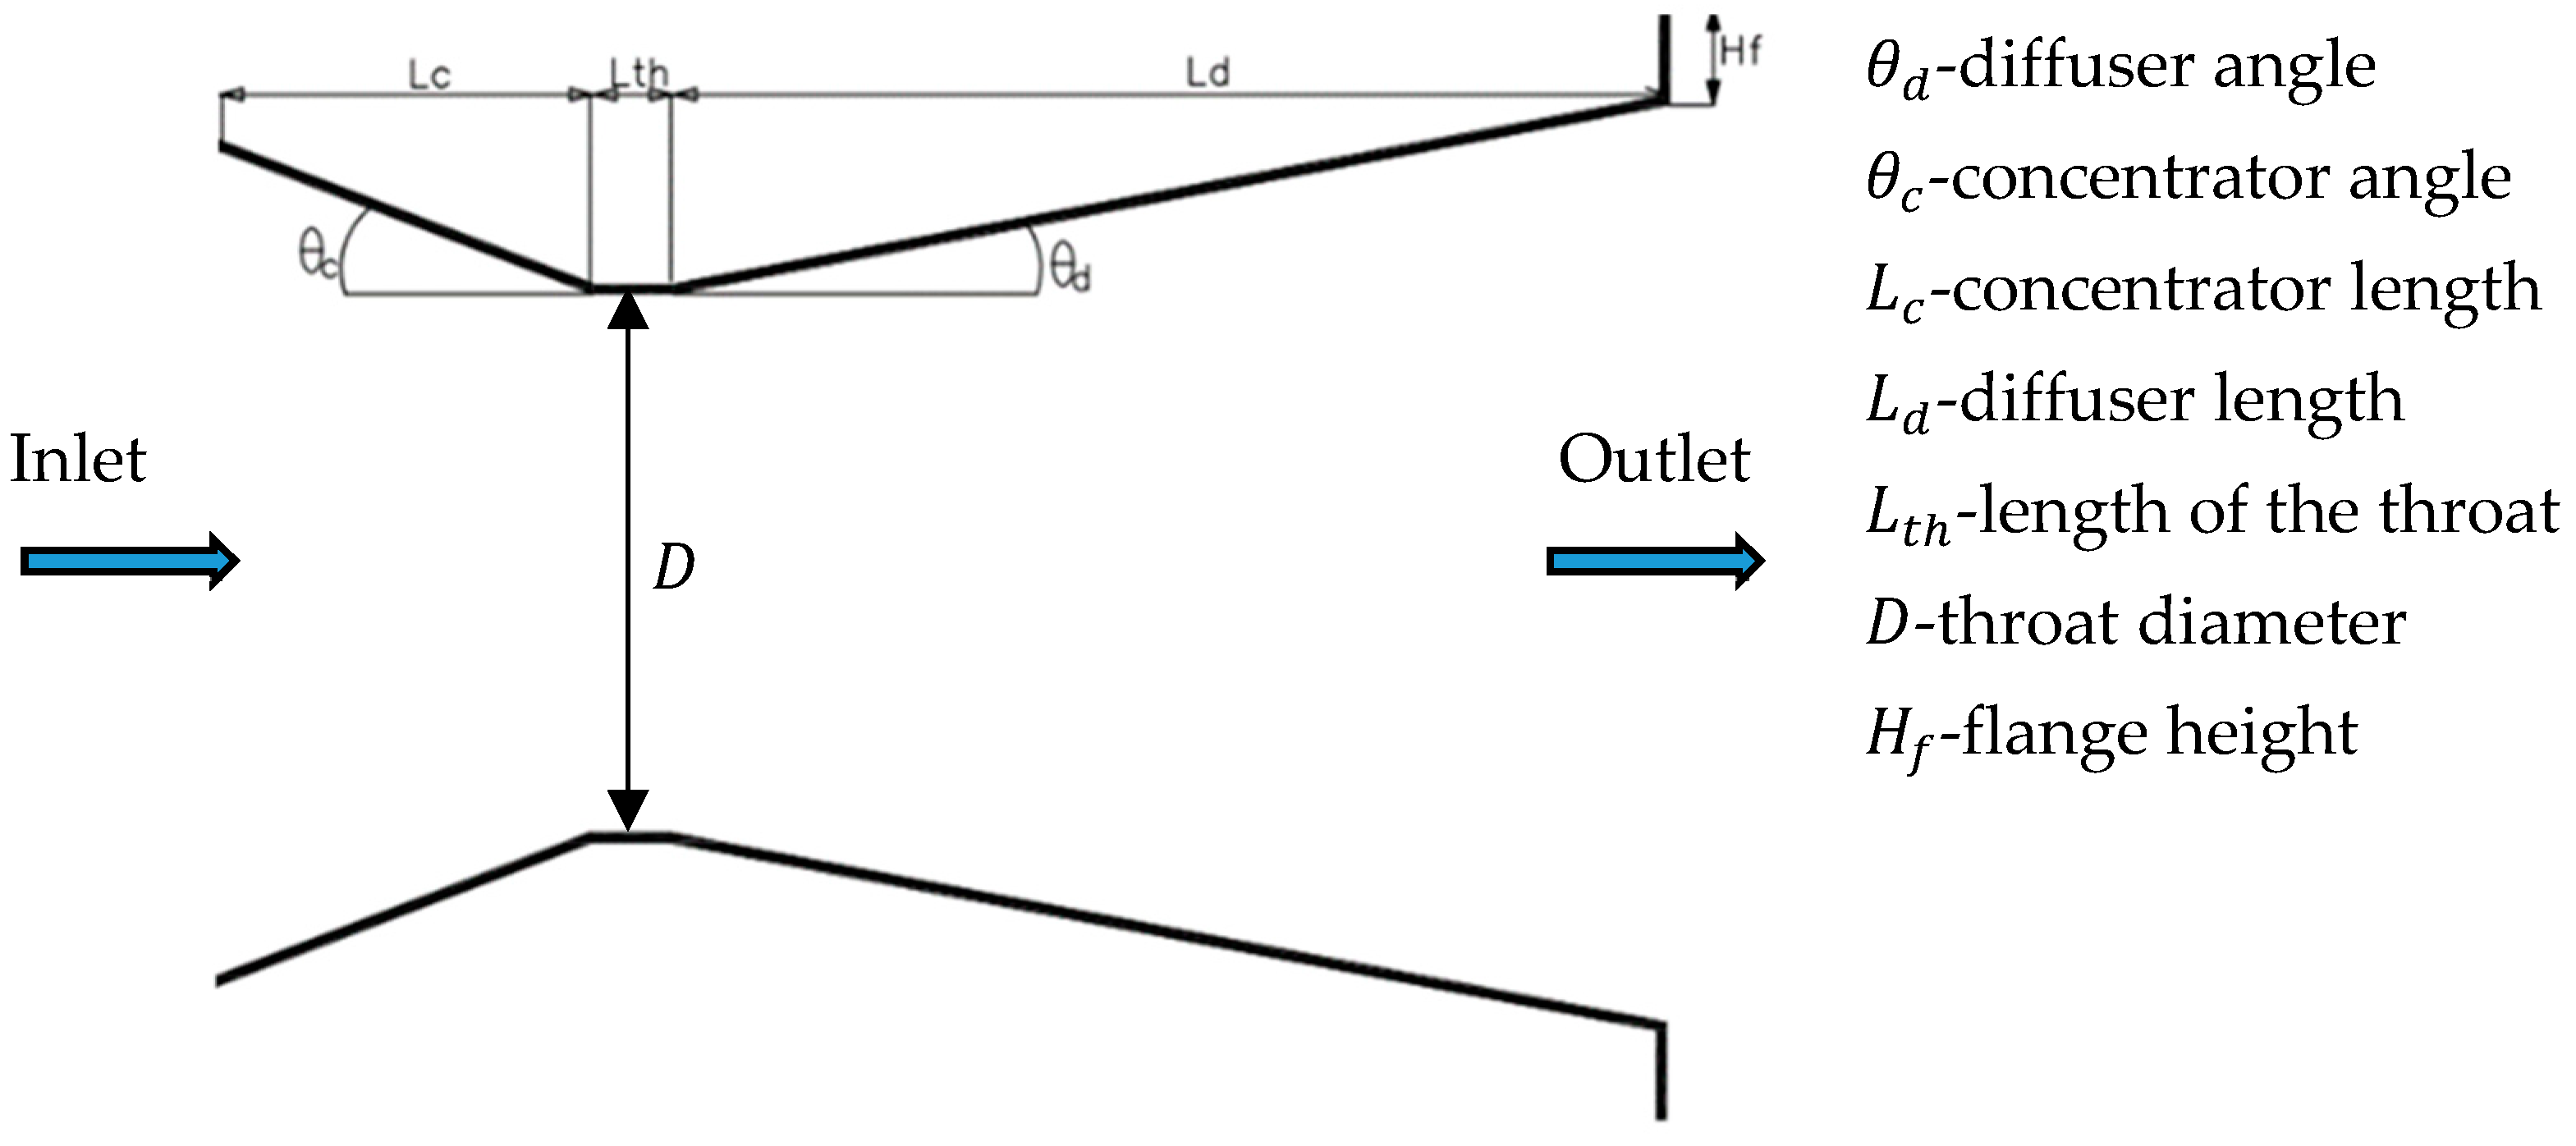
12]. The concentrator-diffuser-augmented wind turbine (CDaugWT) consists of a concentrator, a cylindrical section (throat section) housing the wind turbine, and a diffuser with a flange, as shown in Figure 1.
The CDaugWT significantly enhances wind speed at the rotor or throat section [8,15]. Commonly referred to as a wind lens, the CDaugWT, when equipped with a flange, can generate 2–5 times more power than conventional wind turbines of the same rotor diameter and upstream wind speed [16]. The CDaugWT is advocated for use in low-wind-speed areas and urban environments due to its ability to reduce drag forces and enhance power coefficients.
Several research studies have contributed to the understanding and optimisation of the CDaugWT. In [14], high-fidelity numerical modelling techniques were utilised to investigate six geometric parameters of the wind lens and assess its responsiveness to wind direction. The optimised configuration of the wind lens attained a power coefficient (Cp) of 0.702 at a tip speed ratio of 1, surpassing the Betz limit. This optimisation also narrowed the range of the torque ripple factor, establishing it as a practical and economical design for power generation, especially in the built environment. A wind tunnel study by [17] examined the influence of turbulence on a wind turbine equipped with a wind lens under yaw conditions. They explored the wind lens turbine’s performance across varying turbulence intensity levels (10% and 15%) and yaw angles (0° to 30°). The findings indicated that an increase in yaw angle correlated with a decrease in the power coefficient for the turbine equipped with the wind lens. Additionally, the wind lens turbine demonstrated superior performance compared to the turbine without the flow concentrator in turbulent flow and yaw angles of 20° or less.
The research conducted in [18] investigated the impact of a brimmed wind lens on power augmentation in wind turbines. The numerical analysis focused on the low-pressure region and its influence on vortices formed by the brim attached to the diffuser. Comparative numerical predictions were employed to optimise torque augmentation. The results demonstrated a substantial increase in wake formation and vortex strength when incorporating the brimming effect into the diffuser. Furthermore, Ref. [19] utilised computational fluid dynamics (CFD) to analyse a diffuser-augmented hydrokinetic turbine. They predicted performance and flow speeds for various shrouds encasing the turbine, including nozzle, diffuser, and combined nozzle-diffuser turbines. The CFD analysis provided insights for optimising the turbine design to enhance hydrokinetic energy capture. Modified nozzle-diffuser-augmented turbines demonstrated improved efficiency, with a 36.73% increase in the performance of the modified combined model, albeit with effects on torque and power output due to pressure drop and rotor rotation.
Additionally, Ref. [20] conducted a feasibility study on a nozzle-diffuser duct as an energy harvester for Kuroshio currents. It employed computational fluid dynamics simulations in ANSYS Fluent to calculate the drag and mass coefficients of the duct anchored to the seabed. The results indicated that the duct could remain stable 25 m below the sea surface under normal wave conditions and achieve a peak power take-off of 15 kW.
In [21], computational analysis was carried out on three diffuser duct configurations: the straight wind lens, curved wind lens, and vortex generators (VGs) wind lens. Their study investigated the impact of these designs on wind turbine performance. The findings revealed that the curved wind lens and VGs-assisted wind lens setups generated increased turbulence behind the wind turbine, forming low-pressure areas. Notably, the curved diffuser wind turbine achieved the highest power generation in this analysis.
Research efforts have also focused on enhancing the design and geometry of shrouded wind turbines. Another study [22] employed wind lens technology to increase wind velocity at the rotor. It conducted a numerical simulation for a wind turbine model, both with and without a diffuser, optimising the diffuser’s geometry for maximum efficiency. The study concluded that incorporating a diffuser with an 8° divergence angle around a wind turbine operated at an optimal wind velocity of 2 m/s resulted in a power coefficient of 0.6, surpassing the Betz limit of 59.3% for horizontal axis wind turbines. The investigation in [23] found that converging–diverging ducts for low-speed wind electricity generation can increase wind velocity by 1.32-fold at a 15° outlet angle and an initial wind speed of 2.45 m/s. However, it identified external backflow zones that hinder internal flow. The authors recommended counteracting this by creating a negative pressure zone outside the duct, enhancing internal flow, and avoiding excessive outlet angles.
Furthermore, Ref. [24] developed a compact wind turbine featuring a variable nozzle-diffuser duct. This innovative design allowed control over the duct’s geometry, optimising its performance in various wind conditions. Using numerical simulations and experimental testing, it achieved a significant average augmentation ratio of 39.75% and a rotor speed-up ratio of 53% in low-wind speed tunnel experiments.
Geometric characteristics are key in governing the aerodynamic performance of shrouded wind turbines [14,25]. Therefore, an in-depth exploration of the impact of each parameter is essential [26]. It has been established that the ability of the concentrator to increase velocity is determined by both the angle and length of the concentrator [9,27,28,29,30]. Concurrently, the augmentation of velocity for diffusers is significantly influenced by the length of the diffuser and its opening angle [31,32,33,34]. Moreover, adding a flange to the diffuser is thought to further improve velocity augmentation [11,35,36,37]. While the cylindrical section primarily serves as a housing for the turbine, its throat length is crucial as it can influence airflow, thereby affecting velocity augmentation. It is important to recognise that interactions among these parameters impact the overall airflow within the structure of the CDaugWT.
As emphasised by [14], the geometric parameters of the CDaugWT design exhibit diverse impacts on downstream vortices. The concentrator angle stands out as a pivotal factor influencing wind turbine performance, impacting wind velocity enhancement, flow disruption prevention, and pressure recovery through the diffuser. Abdelrazek et al. [30] emphasised the significance of a well-designed concentrator angle, highlighting its role in significantly increasing wind velocity by guiding, collecting, and concentrating airflow within the nozzle. Furthermore, their study reported that wind velocity experiences an increase as the concentrator length increases from 0.15D to 0.2D, with fluctuations beyond 0.2D, where D represents the throat diameter. In a similar finding, Ref. [32] noted that wind velocity tends to increase with the concentrator length up to a certain point, beyond which it fluctuates.
Regarding the diffuser angle, Ref. [33] indicated that the optimal opening angle falls within the range of 6° for intermediate and long diffusers, while 8° is ideal for short diffusers. The authors of [37] suggested that increasing diffuser length while preventing flow separation within the shroud results in enhanced velocity at the rotor. However, Ref. [36] cautioned against excessive diffuser length, as it may lead to decreased performance due to potential flow instability. The work in [32] highlighted the critical role of throat section length in shrouded wind turbine systems, emphasising its significance in preventing non-uniform velocity distribution before the turbine and potential flow separation behind the rotor, particularly at the diffuser’s outlet. Adding a flange to the diffuser exit creates a low-pressure region, drawing more mass flow and causing wind turbines to rotate and automatically align with changes in wind direction [11,26].
Response surface methodology (RSM) is a versatile tool in engineering and optimising wind energy systems. Researchers such as the authors of [38] underscore its crucial role in elucidating parameter-response relationships and facilitating the identification of optimal combinations. Rahmatian et al. [9] illustrate the prowess of RSM in optimising various aspects of wind energy systems, including turbine energy recovery and control parameter optimisation. The authors of [39] recognise RSM’s broad applicability, but they also acknowledge its limitations when dealing with nonlinear outputs. The work described in [40] introduces response surface optimisation (RSO) through the use of surrogate models, providing insights into the intricate impact of design parameters on vertical axis wind turbine performance. Stressing the robustness of RSM, Ref. [41] positions it as a benchmark against which machine learning methods in optimisation can be evaluated. Collectively, these perspectives underscore the enduring significance of RSM in the ever-evolving landscape of wind energy optimisation.
A review of studies suggests that the surface response methodology can be effectively combined with other methods in the context of shrouded wind turbines. The authors of [9] employed the response surface methodology (RSM) and genetic algorithms (GA) for the optimisation of a convergent–divergent shroud in wind turbines. In their study, seven parameters are simultaneously investigated: the throat diameter and the length and angle of the duct components (nozzle, diffuser, and flange). The findings indicated a substantial increase in wind speed of up to 2.18 times and a remarkable 3.94-fold improvement in the wind turbine power coefficient. Additionally, the optimised duct configuration led to reduced vortices behind the turbine, resulting in decreased noise levels and dynamic forces. The analysis presented in [15] utilised a multi-objective genetic algorithm to optimise a nozzle-divergent duct for wind turbines. The simultaneous optimisation of turbine and duct components resulted in a significant 12.3% increase in turbine power. This approach led to reduced drag and thrust coefficients, highlighting improved aerodynamic efficiency and structural performance.
Ramayee and Supradeepan [42] conducted an optimisation study on a shrouded wind turbine enclosure using numerical simulations and the design of experiments (DOE) approach. The study identified optimal parameters, including a shroud length-to-diameter (L/D) ratio of 0.4, shroud angle of 9°, flap L/D ratio of 0.2, flap angle of 16°, and a radial distance of 0.2R. This optimisation resulted in a higher acceleration factor, reduced material volume, and a shorter enclosure length. The authors of [38] optimised a wind turbine with a concentrator and flap using the response surface method (RSM) and Box Behnken experimental design. They conducted a 2D computational fluid dynamics (CFD) analysis and employed the actuator porous disc model. The combined approach achieved a 1.2-fold increase in flow speed at the turbine zone. Bouvant et al. [43] optimised an Archimedes screw turbine using response surface methodology and central composite design (CcompD). The study achieved a predicted Cp of 0.5137.
A research study in [7] utilised response surface methodology (RSM) and computational fluid dynamics (CFD) to optimise duct performance. Employing central composite design (CcompD) for 27 runs, the analysis revealed that optimal design parameters, such as a duct throat diameter of 0.16 m, contraction ratio of 2, and length-to-throat diameter ratio of 1.5, could increase power output up to six times. Numerical data emphasised the substantial impact of well-selected parameters on wind-enhanced power and speed, confirming the efficiency of RSM-enabled CFD simulations in optimising duct performance. Netto et al. [44] conducted an optimisation study on an H-Darrieus vertical axis wind turbine using surrogate-based optimisation with three models. The extreme learning machine surrogate outperformed with the smallest root mean square error at 11.24%, followed by kriging at 17.64% and response surface at 22.17%. The authors of [11] optimised the Archimedean-spiral type wind turbine (ASWT) for off-grid power generation using an evolutionary algorithm with a kriging model and computational fluid dynamics simulations. The optimised shroud design achieved a remarkable Cp of 0.502, a 2.58-fold increase over the bare ASWT’s Cp of 0.195 at a tip speed ratio of 2.5. The authors of [41] optimised a U-type Darrieus wind turbine (UDWT) using machine learning (ML) with a back-propagation neural network and three optimisation algorithms (genetic algorithm, particle swarm optimisation, and simulated annealing). The optimised UDWT achieved significant power coefficient improvements, surpassing bare turbines in aerodynamic and structural performance. Kaseb and Montazeri [45] utilised metamodels to optimise converging–diverging ducted openings in high-rise buildings. They demonstrated that such ducts could enhance wind power, with various metamodels yielding power estimates showing up to 153% variation.
While considerable research has explored enhancing wind turbine power output through CDaugWTs, further investigation is required to design a CDaugWT with optimal geometrical parameters. For economic and structural reasons, the CDaugWT structure must have an optimal length with increased velocity augmentation at the wind turbine rotor. Many previous studies overlooked interactions that occur among the parameters affecting throat velocity. This study addresses this gap by employing the surface response methodology, an optimisation approach that considers the interactions between geometrical parameters, thus enhancing the precision of the optimisation process. The study also seeks to develop a velocity augmentation model that considers the relationship between the throat velocity and six geometrical parameters and to identify optimal geometrical parameters for CDaugWT design, utilising computational fluid dynamics simulations carried out in ANSYS Fluent workbench and Design Expert 13 software. This is a novel approach because, according to the authors, to their knowledge, this has never been done. The model is important because it assists in the design process of the CDaugWT by accurately predicting the throat velocity and is also utilised as an objective function in evolutionary optimisation methods when finding optimal geometrical parameters.
The study, however, shares similarities with the work conducted in [7,9]. A contrast arises in selecting geometric parameters, particularly lengths, as outlined in [9]. At the same time, the authors of [7], in their mathematical model, focused on two response outputs (velocity and power output), three parameters, and a design structure, which differ from those of the present study. The present study also seeks to promote using surrogate models and computational fluid dynamics simulations in shroud optimisation, a practice not well-established in current wind energy applications.
Section 2 outlines the methodology employed in the research, introducing the geometry of the CDaugWT structure and outlining the surface response methodology and numerical methodology. The main findings of the study are subsequently discussed in Section 3, and finally, the conclusion is drawn in Section 4.

2. Methodology

The methodology phase of the research focused on the development of the velocity augmentation model and identifying the optimal geometrical parameters of the concentrator-diffuser design that maximised the weighted average throat velocity of a CDaugWT. This involved the application of response surface methodology using the central composite design and numerical methodology to establish the velocity augmentation model. In numerical methodology, computational fluid dynamics (CFD) was employed, utilising ANSYS Fluent, Reynolds averaged Naiver–Stokes equations, and the shear stress transport k-ω turbulence model. These phases are presented in each subsection.

2.1. Surface Response Methodology

The response surface methodology (RSM) was utilised in the present study. RSM is a collection of mathematical and statistical techniques that serve the purpose of designing and constructing empirical models [46,47,48]. It analyses the impact of various factors and determines the optimal conditions [37,49,50]. An outline of the steps of the response surface methodology is given in Figure 2.
In the present study, six geometrical parameters were identified from the literature: diffuser angle ( θ d ), concentrator angle ( θ c ), concentrator length ( L c ), diffuser length ( L d ), length of the throat ( L t h ), and flange height ( H f ) [51,52,53,54]. Figure 3 depicts the geometry of the empty CDaugWT with the design parameters shown.
Research studies have indicated that these parameters affect the velocity augmentation of the diffuser-augmented wind turbine (DaugWT), the concentrator-augmented wind turbine (CaugWT), and the CDaugWT [26,29,55,56]. However, most of these studies focused on analysing each parameter’s influence independently, while other parameters were held constant [42,57,58]. The present study investigated the interaction between these parameters and their contribution towards velocity augmentation. The geometrical parameter range chosen based on previous literature studies is shown in Table 1.
This study utilised the central composite design (CcompD) with n number of independent variables ( X 1 , X 2 ,   , X n ), encompassing three segments: the standard 2 n factorial points with their origin at the centre, an axial section with ( 2 n ) points, and repeated runs at the centre ( n c ) to prevent errors. The axial (star) points ( 2 n ) served for screening analysis, maintaining constant variance of model prediction at points equidistant from the design centre. The parameter n c represents the number of central points providing test replicates at the centre, crucial for the independent estimation of the experimental error [59]. The number of experiments needed in a CcompD to quantify the effects of six factors is given by Equation (1) [60,61].
N = 2 n + 2 n + n c = 2 6 + 2 × 6 + 10 = 86
In experiments involving six factors, the CcompD included 64 factorial points, 12 axial points, and 10 replicates at central points, resulting in a total of 86 tests (N), as indicated in Equation (1). Once the desired range of variable values was defined, they were coded at five levels to ± 1 for the factorial points, 0 for centre points, and ± α for the axial points [37,59,62]. The experimental sample schedule used in CFD analysis is given in Table 2.
The 86 prepared empty concentrator-diffuser geometries (experimental samples), as depicted in Table 2, were subsequently designed and simulated using ANSYS Fluent workbench for 2D CFD analysis. This analysis aimed to obtain throat velocity values ( V t h ), which were rendered dimensionless by dividing them by the inlet free stream velocity ( V ) to yield the throat velocity augmentation ratio V t h V   . The CFD experimental results of V t h V   were subsequently used as input data in Design Expert 13.0 software to establish the velocity augmentation model. This model was further analysed and optimised to obtain the optimal geometrical parameters for the CDaugWT design. The present study, guided by insights from prior research [7,41,43,63] and the fact that the first-order multiple linear model is limited to a 2-level factorial fit due to the strong curvature of the response surface [48], led to the adoption of the more flexible and versatile second-order multiple linear model, or quadratic model. Equation (2) provides this quadratic regression equation for the wind speed augmentation model [7,38,43,64].
y = α 0 + i = 1 n α i x i + i = 1 n 1 j > 1 n α i j x i x j + i = 1 n α i i x i 2 + ε 0
where y represents the predicted response variable or objective function (throat wind speed augmentation ratio V t h V , α 0 is the offset term, α i is the linear effect, α i j is the squared effect, and α i i is the interaction effect. ε 0 represents the total error; this value is usually assumed to follow a normal distribution with a mean of zero.
To assess the validity and significance of the wind speed augmentation model developed using response surface methodology (RSM), this study employed analysis of variance (ANOVA) and a lack-of-fit test [65]. The model’s fitness was crucial for optimising the geometrical parameters of the CDaugWT and the velocity augmentation ratio. Various metrics, including F-value, correlation coefficient R 2 , adjusted determination coefficient (adjusted R 2 ), the p -value for regression parameters, and adequate precision were used to check the model adequacies. The model was considered adequate when the p-value was <0.05, lack-of-fit p-value was >0.05, R 2 > 0.9, and adequate precision > 4 [50,66]. The proposed model’s 95% confidence level evaluated the significance of independent geometrical parameters on the velocity augmentation ratio. R 2 , ranging from 0 to 1, indicated how well the model fit the data, with a value closer to 1 signifying a better fit. Additionally, p-values reflected the significance of parameters on the objective function, with lower p-values indicating a more significant role. The response surface optimiser in Design Expert 13 was used to obtain the optimum design parameters, and a reduced velocity augmentation model was obtained. The response surface (contours and 3D plots) was plotted and analysed at the optimised condition. The obtained values of geometrical parameters were verified with CFD analysis in ANSYS Fluent workbench.

2.2. Numerical Methodology

2.2.1. Governing Equations

The current study involved two-dimensional, incompressible, steady-state simulations. In the present study, only the continuity and momentum equations were considered. The conservation of energy equation was excluded from the analysis due to the negligible heat transfer and the assumption of incompressible flow. The governing equations considered were as follows:
Continuity equation
ρ u i x i = 0
Momentum equations
ρ u i u j x j = p x i + x j ρ v u i x j + u j x i ρ u i u j ¯
In Equation (4) ρ u i u j ¯ denotes Reynolds stresses, p , u i , u i , and v , respectively, denote mean static pressure, mean velocity, turbulent fluctuation, and kinematic viscosity.

2.2.2. Turbulence Model Equations

The study employed the widely used shear stress transport (SST) k-ω turbulence model, which combines the accuracy of the k-ω model near the wall with the independence of the k-ε model in the far field [67,68,69]. This model effectively investigates boundary layers, considering factors such as free-stream flow turbulence, pressure gradient, and heat transfer influences, particularly in shrouded wind turbines [15,37,70,71]. The SST k-ω model transitions from near-wall regions to far-from-wall regions, accurately predicting flow separation and shear flows [11]. Notably, it is suitable for adverse pressure gradients, insensitive to free-stream turbulence in the far wake region, and eliminates the need for damping functions [72]. The model choice was based on extensive literature recommendations for aerodynamic purposes, especially in shrouded wind turbines [9,11,12,37,40,42,67,68,69,72,73,74,75,76,77,78].
The transport equations for the SST k-ω turbulence model were as follows:
Turbulent kinetic energy ( k )
t ( ρ k ) + x i ρ k u i = x j Γ k k x j + G k Y k + S k
Specific dissipation rate ( ω )
( ρ ω ) t + ρ ω u i x i = x j Γ ω ω x j + G ω Y ω + D ω + S ω
where G k , denotes the generation of turbulence kinetic energy resulting from the mean velocity gradient, which can be computed using the following Equation (7):
G k = ρ u i u j u j x i
The generation of G ω is given by (8)
G ω = α ω k G k
The value of coefficient α depends on k and ω , and it is determined in such a way that it tends towards unity in the far field regions of the flow.
The terms Γ k and Γ ω , represent the effective diffusivity of k and ω , respectively, shown as:
Γ k = μ + μ t σ k
Γ ω = μ + μ t σ ω
where σ k and σ ω , are the turbulent Prandtl numbers for k and ω , respectively. μ t is the turbulent viscosity; Y k and Y ω , describe turbulence-induced k and ω dissipation. The cross-diffusion term is controlled by D ω , while user-defined source terms are stated as S k and S ω . The SST k-ω model is classified as a low Reynolds turbulence model, which means that it is designed for regions where boundary layer effects are significant. To meet this criterion, the height of the first cell within the boundary layer should fall within the viscous sublayer. A recommended guideline is to ensure that the y + value of the mesh on the wall surfaces is approximately 1 [12,68].
This dimensionless wall distance, y + , is given by the following equation:
y + = u *   y ν
where u * stands for the friction velocity, y for the distance between the first node and the wall, and v for the kinematic viscosity [12,77].

2.2.3. Computational Domain and Boundary Conditions

The CDaugWT shroud was modelled using the design modeller in ANSYS Fluent. In order to reduce the computational time, a 2D axisymmetric domain was employed for the study [79]. The dimensions of the computational domain are illustrated in Figure 4 as a function of the throat diameter (D). The domain surrounding the CDaugWT shroud had a rectangular shape with 15D length and 5D height. The inlet and outlet of the domain were positioned at a distance of 5D upstream and 10D downstream of the CDaugWT shroud, respectively.

2.2.4. Solver Settings and Boundary Conditions

Before conducting the fluent analysis, the 2D computational mesh was prepared using the pressure-based solver and the absolute velocity formulation. A single solver processor was utilised. The fluid medium employed was air, with a density of 1.225   k g / m 3 and a viscosity of 1.7894 × 10 5 k g / m s . Furthermore, the boundary conditions were defined with the inlet area designated as a velocity inlet, set at a velocity of 2 m/s, and the outlet area configured as a pressure outlet set at 0 Pa [80]. The wall boundary was established as a slip condition with a zero shear boundary condition, and the CDaugWT shroud was specified as a no-slip boundary [81]. The pressure-velocity coupling was achieved using a coupling scheme. The governing equations were solved using the second-order upwind method [68]. The chosen turbulence model was the SST k-ω, described by Equations (5) and (6). This model combines elements of the k- ε and k- ε turbulence models, as previously mentioned. The current study employed a root mean square (RMS) residual value of 10 6 as the stopping criterion for continuity, momentum, velocity components, and turbulence equations [64,68,76]. The solution converged after approximately 121 iterations.

2.2.5. Mesh Generation, Quality, and Grid Independence Test

The study employed the ANSYS Fluent 2022R1 software meshing tool for model creation and mesh generation. An unstructured quadrilateral mesh consisting of 84,388 cells and 85,096 nodes was utilised. To satisfy the required condition of y + = 1 for the SST k-ω turbulence model, the height of the first layer was set to 1.1 mm. Specifically, the wall boundaries of the shroud were equipped with ten inflation layers, each with a growth rate of 1.2, as illustrated in Figure 5. The mesh size was gradually increased to achieve solution convergence while avoiding abrupt increases in mesh size, because they can hinder solution convergence [82].
Furthermore, the assessment of mesh quality considered aspects such as aspect ratio, orthogonal quality, and skewness [68,83]. To ensure solution convergence, strict criteria were applied, maintaining a maximum aspect ratio of 25 or less and a maximum skewness of 0.9, even for intricate geometries [82]. ANSYS recommends a maximum skewness ratio below 0.95 for optimal mesh quality, categorising average skewness ratios as excellent (0–0.25), very good (0.25–0.50), good (0.50–0.80), acceptable (0.80–0.94), poor (0.95–0.97), and unacceptable (0.98–1.00) [84]. This study’s maximum skewness ratio was 0.7392, well below the recommended threshold, and the average skewness ratio was 0.0827, indicating excellent mesh quality. The low skewness enhanced simulation accuracy and stability, confirming the mesh’s perfection. Orthogonal quality, another crucial parameter, is deemed excellent between 0.95 and 1.00, very good between 0.70 and 0.95, good between 0.20 and 0.69, acceptable between 0.10 and 0.20, poor between 0.001 and 0.10, and unacceptable below 0.001 [84]. Meeting the recommended minimum orthogonal quality rate above 0.1, the simulation’s mesh exhibited a minimum orthogonal quality rate above 0.167. Furthermore, the average orthogonal quality rate, indicating perfect quality, was 0.9805 in this simulation. Table 3 shows mesh parameters.
Conducting a mesh independence study is crucial to ensure that the obtained solution remains unaffected by mesh resolution or cell size [68]. In this study, a mesh independence analysis aimed to enhance accuracy by minimising the impact of cell size on computational results while reducing costs. For the grid independence test, eight different grid sizes were employed. The number of grid elements was gradually increased from 30,159 to 198,365 until minimal changes were observed in the results (Table 4 and Figure 6). The findings revealed that from grid number 5, comprising 84,388 elements, throat velocity deviated by less than 0.29%. Considering mesh independence and computational efficiency, grid number 5 was determined as the optimal grid size.

3. Results and Discussion

3.1. CFD Analysis

The outcomes and discussions concerning the performance of a CDaugWT structure under six geometrical parameters are presented and explored. The design’s performance was influenced by the diffuser angle, concentrator angle, length of the concentrator, length of diffuser, length of throat, and flange height. Utilising ANSYS Fluent workbench, 86 randomly designed runs based on response surface methodology (RSM) were executed to optimise the area-averaged throat velocity and maximum velocity inside the flanged CDaugWT design analysed in two dimensions. Figure 7, Figure 8 and Figure 9 provide details for each case of the 86 runs: the area-weighted averaged throat velocity, maximum velocity, and throat velocity augmentation ratio. The values of the six parameters used in each of the 86 simulated runs in two-dimensional (2D) ANSYS Fluent are listed in Table 2. Figure 7 shows that the maximum velocity was recorded in case run 67, with a velocity of 5.48 m/s, while the lowest value for maximum velocity was recorded in case run 47 at 5.23 m/s. The average maximum velocity for all 86 runs in Figure 7 was 5.35 m/s. Correspondingly, the average maximum velocity augmentation ratio V t h V was determined as 2.68, given an inlet velocity of 2 m/s. This finding suggests that the inlet velocity increased approximately 2.68 times compared to the initial velocity. Notably, this value is slightly higher than the 2.22 times reported in a study conducted by [9].
Figure 8 shows that the highest velocity, recorded in case run 11 at 3.92 m/s, corresponds to a throat velocity augmentation ratio of 1.96, as illustrated in Figure 9. The area-weighted averaged throat velocities in Figure 8 and their corresponding velocity augmentation ratios in Figure 9 were used to develop the model, as they represent a larger throat section area than the maximum velocity values depicted in Figure 7.

Validation of CFD Model

To validate the CFD model, we referenced [85] and adopted the same computational domain and baseline shroud geometry presented in Figure 10. The mesh structure employed for validation can be seen in Figure 11. The CFD model’s validation involved comparing the graph of U/Uo versus x/D with the results of Abe and Ohya, as illustrated in Figure 12, where U, Uo, x, and D represent the free stream velocity, streamwise velocity, streamwise coordinate, and inlet diameter of the diffuser, respectively. Notably, the simulations indicated that the highest value of U/Uo was 1.29% lower than the results of Abe and Ohya. This small deviation is likely attributable to minor shroud geometry and mesh structure differences but remains within acceptable margins.

3.2. ANOVA Analysis

In the present study, response surface methodology (RSM) utilising the central composite design method was employed to investigate the interaction of geometrical parameters and their effects on the velocity augmentation ratio. Design Expert 13 software was used to analyse empirically collected data and develop a second-order surface response quadratic model by estimating model component coefficients. The coefficients for the model components were determined through one-way ANOVA. Additionally, ANOVA was applied to evaluate the adequacy of results concerning input parameters, with a model deemed significant if it had a p-value below 0.05. The model’s validity was assessed using the coefficient of regression (R2), and its statistical significance was measured by the F-value.
Furthermore, the study examined pure errors and residuals at repeated points through the lack-of-fit test; 2D and 3D response surface plots were also generated. Additionally, a numerical optimisation method with the desirability function in Design Expert 13 software was carried out to determine optimal geometrical parameters and confirm the accuracy of the velocity augmentation ratio model in predicting the desired results. Finally, CFD analysis was performed with the obtained optimal set of geometrical parameters to validate the throat velocity predicted by the developed velocity augmentation ratio model.

3.3. Mathematical Model Fitting and Assessment

The RSM proposed a reduced quadratic model that relates the velocity augmentation ratio to the six independent geometrical parameters. The model summary statistics for the velocity augmentation ratio are given in Table 5. The reduced quadratic model was not aliased and was adequately significant to represent the correlation between the velocity augmentation ratio and its six independent geometrical parameters. It is on this basis that the model was selected for model fitting.
The wind speed augmentation model V t h V , in terms of coded factors, is given by Equation (12), and in terms of actual factors is given by Equation (13).
V t h V = 1.93782 + 0.00174831 θ d + 0.000856908 θ c + 0.00306857 L c + 0.00758128 L d + 0.00153922 L t h   + 0.000909229 H f + 0.000669089 θ d L c + 0.0007775 L c L d + 0.000452187 L d L t h 0.00136721 θ d 2 0.000438725 θ c 2 0.000500042 L c 2
V t h V = 0.752974 + 0.355948 θ d + 0.280702 θ c 0.00431128 L c 0.00217402 L d 0.0133117 L t h + 0.000363692 H f + 0.000214108 θ d L c + 4.976 × 10 6 L c L d + 1.447 × 10 5 L d L t h 0.0218753 θ d 2 0.00701959 θ c 2 3.20027 × 10 6 L c 2
where V t h is the throat velocity, V is the inlet upstream velocity, θ d is the diffuser angle,   θ c is the concentrator angle, L c is the length of the concentrator,   L d is the length of the diffuser, L t h is the length of the throat, and H f is the flange height.
The velocity augmentation serves as the response, and θ d , θ c , L c ,   L d , L t h , and H f , represent the coded terms for the examined parameters. The value and sign of each coefficient of the response parameters indicate the nature of the effects, with a negative sign suggesting antagonistic effects and a positive sign signifying synergistic effects. In accordance with the proposed correlation in Equation (12), the relative significance of the independent parameters is as follows: θ d (diffuser angle) with a coefficient value of 0.00174831 , θ c (concentrator angle) with a coefficient value of 0.000856908 , L c (length of the concentrator) with a coefficient value of 0.00306857 , L d     (length of the diffuser) with a coefficient value of 0.00758128 , L t h (length of the throat) with a coefficient value of 0.00153922 , and H f (flange height) with a coefficient value of 0.000909229 . This confirms that all of the parameters had a positive effect on the velocity augmentation. Additionally, the maximum increasing impact of the dependent factor was 0.0007775 , related to the interaction between L c and L d parameters. The coded parameters in the quadratic model were beneficial for predicting the relative significance of the factors by comparing the coefficients of the factors [86]. By default, the factors’ low and upper levels were coded as −1 and +1, respectively [66]. The coded equations were useful for understanding the relative effects of the parameters by comparing the coefficients of the factors [86]. In contrast, Equation (13) with actual factors specified in original units was used for predictions in the original factor units. Unlike the coded Equation (12), it was not suitable for determining the relative impact of factors, as coefficients were scaled for unit compatibility, and the intercept was not centred in the design space. The findings presented in Figure 13 reveal a consistent order of influence on velocity augmentation, as observed in the sequence: D > C > A > E > F > B, aligning with the patterns described in Equation (12). Notably, the length of the concentrator and the length of the diffuser emerged as the most influential factors, exerting the most significant impact on velocity augmentation.
The analysis of model fitness included a lack-of-fit test and analysis of variance (ANOVA). The ANOVA results in Table 6 revealed a calculated p-value of <0.0001, signifying the statistical significance (p-value < 0.05) of the quadratic model with a low probability of error. The p-values less than 0.0500 in the ANOVA indicated the significance of model terms A, B, C, D, E, F, AC, CD, A2, B2, and C2 in this study. For the velocity augmentation model, the maximum R2 and adjusted R2 were 0.9581 and 0.9387, respectively, with a standard deviation of 0.0022. The R2 value of 0.9581 (Table 5) indicated that independent parameters accounted for 95.81% of the variation in the velocity augmentation ratio. A quadratic model with an R2 value exceeding 0.9 has the strongest positive correlation [66,87]. Adequate precision, measured by a ratio value of 49.655, indicated a satisfactory signal-to-noise ratio, considering a ratio of adequate precision greater than four is acceptable [7,88]. Model significance and proper variable fitting were affirmed by the F-value of 106.67, with only a 0.01% probability that such a high F-value could arise due to noise. The non-significant lack of fit (p-value = 0.0866) can be used to navigate design spaces with a low probability of error [86]. Furthermore, the low coefficient of variation (C.V.% = 0.1149) and the good agreement between predicted and actual velocity augmentation values in Figure 14A suggest the experiment’s reliability.

3.4. Regression Analysis

Figure 14A shows a plot of the actual value against the predicted value for velocity augmentation, in which the points were randomly placed on a straight line. These results confirmed that the predicted and actual values were in good agreement with the high acceptability of the models and, therefore, can be utilised to analyse and predict the velocity augmentation [7,86]. Figure 14B depicts the normal probability chart of the studentised residuals utilised to assess the adequacy and suitability of the velocity augmentation model. As shown in the graph, the points form a straight line, affirming that the errors were distributed normally with a mean of zero and a fixed value, thereby confirming the model’s adequacy [37,62,65,86,89]. Similar to the findings of [7], the results show no evidence to dispute any independence violations or hypotheses of permanent variance. In Figure 14C, a random distribution of points is displayed, varying up and down the x-axis within the range of −3.59982 to +3.59982, enclosed by the red line, without exhibiting any noticeable trends. This observation serves as an assessment of the adequacy and reliability of the velocity augmentation model [65]. This scenario suggests that the velocity augmentation model is reasonably exempt from any violations of the independence or constant variance assumptions [86]. In Figure 14D, a chart displays internally studentised residuals plotted against the predicted velocity augmentation ratio. The residuals exhibit a random distribution within the range of +3.00 to −3.00, suggesting that the velocity augmentation model effectively captures the relationship between the independent geometrical parameters and the velocity augmentation ratio [59,90].

3.5. Interaction Effects of Geometrical Parameters on Velocity Augmentation

The surface plots (three-dimensional and contour) for the results achieved are shown in Figure 15, Figure 16 and Figure 17, where the data demonstrate the combined effect of the geometrical parameters. The interaction between the two geometrical parameters (length of diffuser and length of concentrator) on the velocity augmentation ratio was significant compared to the other parameters in Figure 15 and Figure 17. It must noted that the concentrator length and diffuser angle in Figure 15 interact in the same way that the diffuser length and concentrator length do in Figure 16. In Figure 15, the contour and response surface plots illustrate the velocity augmentation ratio as a function of concentrator length and diffuser angle. The results reveal that as the concentrator length increased with an increase in the diffuser angle, the velocity augmentation ratio also increased. However, once an optimal diffuser angle was reached, as depicted in Figure 15, the velocity augmentation ratio started to decrease. The interaction of these parameters was weak, as indicated by the ANOVA analysis. Consistent with these findings, previous studies such as [31,91] observed that an increase in the diffuser angle leads to an increase in both velocity inside the diffuser and flow separation. Subsequently, further increasing the diffuser angle starts to decrease the velocity inside the diffuser.
The curved slope of the response surface plot in Figure 16 indicates that the length of the diffuser had a greater influence on the velocity augmentation than the length of the concentrator and diffuser angle in Figure 15. This indicates its influential role in increasing the throat velocity in a CDaugWT design. As shown in Figure 16, a rise in the length of the diffuser with the increase in the length of the concentrator was responsible for the increase in the velocity augmentation ratio. However, it must be noted that once an optimal concentrator length was reached, any further increase in length started to impact the flow negatively, hence the decrease in the velocity augmentation ratio, as shown in the graph [32,92]. In addition, Ref. [37] asserted that an extended concentrator length intensifies flow separation in the diffuser zone with CDaugWT design, causing a decrease in the velocity augmentation ratio, as shown in Figure 16.
In Figure 17, the velocity augmentation ratio is depicted as a function of the length of the throat and length of the diffuser at constant values (diffuser angle = 9.75°, concentrator angle = 19.75°, length of concentrator = 362.5 mm, flange height = 97.5 mm). By keeping the other parameters constant at those given values, the maximum velocity augmentation ratio showed a positive correlation with the length of the diffuser. Still, it remained constant in relation to the length of the throat. This observation is not surprising, as this combination in the ANOVA analysis had a p-value of 0.1082, greater than 0.1, indicating that the model term was classified as insignificant. However, it was required to support the hierarchy in the model. On the other hand, it is interesting to note that the increase in velocity augmentation ratio with the increase in diffuser length was reported in previous publications [33,36,54,91,93,94].

3.6. Optimisation of Design Parameters through the Desirability Function (SRO)

The optimisation process in this study employed the desirability function, with values ranging from 0 (undesirable) to 1 (desirable). Utilising a numerical optimisation method (SRO), the procedure identified points that maximise the desirability function [66]. Numerical optimisation allows for selecting desirable values for input parameters and responses. Various input optimisations, such as range, maximum, minimum, target, and none (for responses), can be chosen to establish an optimised output value under specific conditions [7,88]. In this study, specific ranged values were assigned to the input variables, while the objective was to achieve a maximum response. The optimisation ramp in Figure 18 and Table 7 displays the optimal values, with a maximum velocity augmentation ratio of 1.953 and a desirability function value of 0.9. The optimal projected geometrical parameters were as follows: (A) diffuser angle = 10°, (B) concentrator angle = 20°, (C) length of concentrator = 375 mm, (D) length of diffuser = 975 mm, (E) length of throat = 70 mm, and (F) flange height = 100 mm. The optimisation proved successful, given the proximity of the desirability value to 1 (0.9). A confirmatory CFD analysis yielded a throat velocity of 3.898 m/s with the optimal geometrical parameters values obtained from the desirability function (SRO) utilised. This result is slightly below the model-predicted throat velocity of 3.906 m/s. This demonstrates the suitability and accuracy of the developed model.

3.7. Validation of the Velocity Augmentation Model with CFD Results

Table 8 displays the optimal geometrical parameter values, specifically the throat velocity V t h values obtained from the surface response optimisation algorithms (SRO) alongside C F D V t h , which represents the throat velocity values from CFD analysis in ANSYS Fluent, utilising the optimal geometrical parameter values from the optimisation method (SRO). The results indicate a consistent alignment of the SRO outcomes with the values derived from CFD analysis. The percentage difference of 0.2% was obtained, highlighting the developed model’s excellent accuracy and reliability in predicting the CDaugWT design’s throat velocity.

4. Conclusions

This study developed a velocity augmentation model using RSM with CcompD, illustrating the relationship between throat section velocity and six geometrical parameters of the CDaugWT design. The model accurately predicted the simulation data with an R2 accuracy of 0.9581. Our primary conclusions are as follows:
(1)
The non-aliased reduced quadratic model is significant in representing the relationship between the velocity augmentation ratio and its six independent geometrical parameters. The choice of this model for fitting was grounded in these considerations.
(2)
The p-value for the velocity augmentation ratio model was below 0.05, indicating its significance. On the other hand, the model’s F-value was 106.67, suggesting a less than 0.01% probability that noise could result in such a substantial F-value. Moreover, the low coefficient of variation (C.V.% = 0.1149) highlighted a favourable agreement between predicted and actual velocity augmentation values.
(3)
The coded Equation (12) confirmed the relative importance of the independent parameters and that each parameter positively influenced velocity augmentation. Notably, the concentrator length and diffuser length emerged as the most impactful factors, exerting the greatest influence on velocity augmentation.
(4)
The optimum geometrical parameters for the CDaugWT, resulting in a maximum velocity augmentation ratio of 1.953 and a desirability function value of 0.9 at the throat section, were determined as follows: diffuser angle of 10 ° , concentrator angle of 20 ° , concentrator length of 375 mm (0.62 R t h ), diffuser length of 975 mm (1.61 R t h ), throat length of 70 mm (0.12 R t h ), and flange height of 100 mm (0.17 R t h ) with R t h representing the throat radius.
(5)
The results of CFD validation indicated that the average throat velocity obtained through RSM optimisation, 3.906 m/s, showed a percentage difference of 0.2% compared to the value obtained from the CFD simulation of 3.898 m/s. This underscores the excellent accuracy and reliability of the developed model in predicting the throat velocity of the CDaugWT design.
This study confirms the effectiveness of the combination of RSM and CFD methodologies in developing a mathematical model that relates the throat velocity with its geometrical parameters and the ability to optimise the CDaugWT to obtain optimal geometrical parameters. This study also highlights and magnifies the need to utilise RSM in developing mathematical models that consider the interaction effects of the parameters a deviation from one-factor analysis, which is not a holistic approach to the study of the impact of geometrical parameters of the CDaugWT design. In addition, similar to the point noted in [7], comparing RSM predictions with CFD data suggests that RSM effectively predicts shrouded wind turbine performance. Therefore, utilising RSM will significantly reduce both the time and cost compared to CFD computations.

Author Contributions

Conceptualisation, methodology, software, formal analysis, and writing—original draft preparation, N.S.; writing—review and editing, methodology, formal analysis, supervision, and funding acquisition, G.M. and P.M. All authors have read and agreed to the published version of the manuscript.

Funding

This research received no external funding. It received internal funding from Govan Mbeki Research and Development Centre (GMRDC).

Informed Consent Statement

Not applicable.

Data Availability Statement

The data presented in this study are available on request from the corresponding author.

Conflicts of Interest

The authors declare no conflict of interest.

References

  1. Lesala, M.E.; Shambira, N.; Makaka, G.; Mukumba, P. The Energy Poverty Status of Off-Grid Rural Households: A Case of the Upper Blinkwater Community in the Eastern Cape Province, South Africa. Energies 2023, 16, 7772. [Google Scholar] [CrossRef]
  2. Shonhiwa, C.; Makaka, G.; Mukumba, P.; Shambira, N. Investigation of Wind Power Potential in Mthatha, Eastern Cape Province, South Africa. Appl. Sci. 2023, 13, 12237. [Google Scholar] [CrossRef]
  3. Shambira, N.; Makaka, G.; Mukumba, P.; Shonhiwa, C. Comparative Analysis of Numerical Methods for Assessing Wind Potential in Fort Beaufort, South Africa, using Two- Parameter Weibull Distribution Model. Weather stations. In Proceedings of the SAIP2023, the 67th Annual Conference of the South African Institute of Physics, Zululand, South Africa, 3–7 July 2023; Prinsloo, P.A., Ed.; South African Institute of Physics, University of Zululand: Zululand, South Africa, 2023; pp. 428–436. [Google Scholar]
  4. Shambira, N.; Makaka, G.; Mukumba, P.; Lesala, M.; Roro, K.; Julies, J.; Tazvinga, H. Wind Resource Assessment in the Upper Blinkwater area in the Province of Eastern Cape, South Africa. Int. J. Eng. Res. Technol. 2020, 9, 387–402. [Google Scholar]
  5. Bontempo, R.; Di Marzo, E.M.; Manna, M. Diffuser augmented wind turbines: A critical analysis of the design practice based on the ducting of an existing open rotor. J. Wind Eng. Ind. Aerodyn. 2023, 238, 105428. [Google Scholar] [CrossRef]
  6. Ahmad, S.; Rafat Al, W.; El Haj, A.; Khalil, K.; Salim, B.N.M. Analysis of Accelerating Devices for Enclosure Wind Turbines. Int. J. Astronaut. Aeronaut. Eng. 2017, 2, 9. [Google Scholar] [CrossRef] [PubMed]
  7. Taghinezhad, J.; Abdoli, S.; Silva, V.; Sheidaei, S.; Alimardani, R.; Mahmoodi, E. Computational fluid dynamic and response surface methodology coupling: A new method for optimization of the duct to be used in ducted wind turbines. Heliyon 2023, 9, e17057. [Google Scholar] [CrossRef]
  8. Shambira, N.; Makaka, G.; Mukumba, P. Analytical models for concentrator and diffuser augmented wind turbines: A review. Int. J. Smart Grid Clean Energy 2021, 10, 123–132. [Google Scholar] [CrossRef]
  9. Rahmatian, M.A.; Shahrbabaki, A.N.; Moeini, S.P. Single-objective optimization design of convergent-divergent ducts of ducted wind turbine using RSM and GA, to increase power coefficient of a small-scale horizontal axis wind turbine. Energy 2023, 269, 126822. [Google Scholar] [CrossRef]
  10. Danish, S.N.; Almutairi, Z.; Alshareef, M. CFD studies of the effect of holes and angles of upstream duct of horizontal axis wind turbines. AIP Adv. 2023, 13, 035326. [Google Scholar] [CrossRef]
  11. Hameed, H.S.A.; Hashem, I.; Nawar, M.A.A.; Attai, Y.A.; Mohamed, M.H. Shape optimization of a shrouded Archimedean-spiral type wind turbine for small-scale applications. Energy 2023, 263, 125809. [Google Scholar] [CrossRef]
  12. Rezek, T.J.; Camacho, R.G.R.; Manzanares-filho, N. A novel methodology for the design of diffuser-augmented hydrokinetic rotors. Renew. Energy 2023, 210, 524–539. [Google Scholar] [CrossRef]
  13. Quispe-abad, R.; Müller, N. Finding an absolute maximum theoretical power coefficient for ducted wind turbines. J. Wind Eng. Ind. Aerodyn. 2023, 236, 105335. [Google Scholar] [CrossRef]
  14. Hesami, A.; Nikseresht, A.H. Towards development and optimization of the Savonius wind turbine incorporated with a wind-lens. Energy 2023, 274, 127263. [Google Scholar] [CrossRef]
  15. Khamlaj, T.; Rumpfkeil, M. Analysis and optimization of ducted wind turbines. Energy 2018, 162, 1234–1252. [Google Scholar] [CrossRef]
  16. Ohya, Y.; Karasudani, T.; Nagai, T.; Watanabe, K. Wind lens technology and its application to wind and water turbine and beyond. Renew. Energy Environ. Sustain. 2017, 2, 2. [Google Scholar] [CrossRef]
  17. Richmond-Navarro, G.; Uchida, T.; Calderón-Muñoz, W.R. Shrouded wind turbine performance in yawed turbulent flow conditions. Wind Eng. 2022, 46, 518–528. [Google Scholar] [CrossRef]
  18. Sagar, G.; Kalyankar, R.; Chikhale, P. Power generation by diffuser augmented wind turbine. Int. J. Innov. Eng. Res. Technol. 2021, 1–5. Available online: https://repo.ijiert.org/index.php/ijiert/issue/view/41 (accessed on 26 December 2023).
  19. Joshy, A.; Sreejith, B. Performance Analysis of Modified Nozzle-Diffuser Augmented Horizontal Axis Hydrokinetic Turbine. In Proceedings of the Yukthi 2021-The International Conference on Emerging Trends in Engineering, GEC Kozhikode, Kerala, India, 24–26 September 2021; pp. 1–9. [Google Scholar] [CrossRef]
  20. Yeh, P.; Tsai, S.; Chen, W.; Wu, S.; Hsieh, M.; Chen, B. A Simple Nozzle-Diffuser Duct Used as a Kuroshio Energy Harvester. Processes 2021, 9, 1552. [Google Scholar] [CrossRef]
  21. Rajendra Prasad, K.; Manoj Kumar, V.; Swaminathan, G.; Loganathan, G.B. Computational investigation and design optimization of a duct augmented wind turbine (DAWT). Mater. Today Proc. 2020, 22, 1186–1191. [Google Scholar] [CrossRef]
  22. Sri, P.U.; Jeevesh, C. Performance analysis of a horizontal axis wind turbine. In Proceedings of the Conference on Emerging Trends in Engineering (ICETE) Emerging Trends in Smart Modelling Systems and Design, Hyderabad, India, 22–23 March 2019; Springer International Publishing: Berlin/Heidelberg, Germany, 2020; pp. 440–448. [Google Scholar]
  23. Ye, J.; Cheng, Y.; Xie, J.; Huang, X.; Zhang, Y.; Hu, S.; Salem, S.; Wu, J. Effects of Divergent Angle on the Flow Behaviors in Low Speed Wind Accelerating Ducts. Renew. Energy 2020, 152, 1292–1301. [Google Scholar] [CrossRef]
  24. Siavash, N.K.; Najafi, G.; Hashjin, T.T.; Ghobadian, B.; Mahmoodi, E. An innovative variable shroud for micro wind turbines. Renew. Energy 2020, 145, 1061–1072. [Google Scholar] [CrossRef]
  25. Al-quraishi, B.A.J.; Zelawati, N.; Asmuin, B. Review on Diffuser Augmented Wind Turbine ( DAWT). Int. J. Integr. Eng. 2019, 11, 178–206. [Google Scholar] [CrossRef]
  26. Ohya, Y.; Karasudani, T.; Sakurai, A.; Abe, K.I.; Inoue, M. Development of a shrouded wind turbine with a flanged diffuser. J. Wind Eng. Ind. Aerodyn. 2008, 96, 524–539. [Google Scholar] [CrossRef]
  27. Thangavelu, S.K.; Goh, C.Y.; Sia, C.V. Design and flow simulation of concentrator augmented wind turbine. IOP Conf. Ser. Mater. Sci. Eng. 2019, 501, 012041. [Google Scholar] [CrossRef]
  28. Shikha, S.; Bhatti, T.S.; Kothari, D.P. Air concentrating nozzles: A promising option for wind turbines. Int. J. Energy Technol. Policy 2005, 3, 394–412. [Google Scholar] [CrossRef]
  29. Orosa, J.A.; Garca-Bustelo, E.J.; Oliveira, A.C. An experimental test of low speed wind turbine concentrators. Energy Sources Part A Recover. Util. Environ. Eff. 2012, 34, 1222–1230. [Google Scholar] [CrossRef]
  30. Abdelrazek, A.M.; Abdelrazik, A.M.; Kassab, S. Performance of a flanged diffuser augmented wind turbine structure under variable geometrical conditions. Am. J. Eng. Res. 2021, 10, 142–153. [Google Scholar]
  31. Maulana, M.I.; Syuhada, A.; Nawawi, M. Analysis of diffuser augmented wind turbine (DAWT) with flange and curved interior using CFD. AIP Conf. Proc. 2018, 1984, 2–7. [Google Scholar] [CrossRef]
  32. Ghorani, M.M.; Karimi, B.; Mirghavami, S.M.; Saboohi, Z. A numerical study on the feasibility of electricity production using an optimized wind delivery system (Invelox) integrated with a Horizontal axis wind turbine (HAWT). Energy 2023, 268, 126643. [Google Scholar] [CrossRef]
  33. Elsayed, A.M. Design optimization of diffuser augmented wind turbine. CFD Lett. 2021, 13, 45–59. [Google Scholar] [CrossRef]
  34. Takeyeldein, M.M.; Ishak, I.S.; Lazim, T.M. the Effect of the Number of the Blades on Diffuser Augmented Wind Turbine Performance. J. Eng. Sci. Technol. 2023, 18, 1019–1037. [Google Scholar]
  35. Jauhar, T.A.; Hussain, M.I.; Kiren, T.; Arif, W.; Miran, S.; Lee, G.H. Effect of flanged diffuser divergence angle on wind turbine: A numerical investigation. PLoS ONE 2023, 18, e0287053. [Google Scholar] [CrossRef]
  36. Maw, Y.Y.; Tun, M.T. Sensitivity analysis of angle, length and brim height of the diffuser for the small diffuser augmented wind turbine using the numerical investigation. ASEAN Eng. J. 2021, 11, 280–291. [Google Scholar] [CrossRef]
  37. Hosseini, S.R.; Ganji, D.D. A novel design of nozzle-diffuser to enhance performance of INVELOX wind turbine. Energy 2020, 198, 117082. [Google Scholar] [CrossRef]
  38. Koç, E.; Yavuz, T. Effect of flap on the wind turbine-concentrator combination. Int. J. Renew. Energy Res. 2019, 9, 551–560. [Google Scholar] [CrossRef]
  39. Kaseb, Z.; Rahbar, M. Towards CFD-based optimization of urban wind conditions: Comparison of Genetic algorithm, Particle Swarm Optimization, and a hybrid algorithm. Sustain. Cities Soc. 2022, 77, 103565. [Google Scholar] [CrossRef]
  40. Elsakka, M.M.; Ingham, D.B.; Ma, L.; Pourkashanian, M.; Moustafa, G.H.; Elhenawy, Y. Response Surface Optimisation of Vertical Axis Wind Turbine at low wind speeds. Energy Rep. 2022, 8, 10868–10880. [Google Scholar] [CrossRef]
  41. Cheng, B.; Yao, Y. Design and optimization of a novel U-type vertical axis wind turbine with response surface and machine learning methodology. Energy Convers. Manag. 2022, 273, 116409. [Google Scholar] [CrossRef]
  42. Ramayee, L.; Supradeepan, K. Influence of Axial Distance and Duct Angle in the Improvement of Power Generation in Duct Augmented Wind Turbines. J. Energy Resour. Technol. 2022, 144, 091302. [Google Scholar] [CrossRef]
  43. Bouvant, M.; Betancour, J.; Velásquez, L.; Rubio-Clemente, A.; Chica, E. Design optimization of an Archimedes screw turbine for hydrokinetic applications using the response surface methodology. Renew. Energy 2021, 172, 941–954. [Google Scholar] [CrossRef]
  44. Netto, D.C.; Camacho, R.R.; Filho, N.M. Surrogate-Based Design Optimization of a H-Darrieus Wind Turbine Comparing Classical Response Surface, Artificial Neural Networks, and Kriging. J. Appl. Fluid Mech. 2023, 16, 703–716. [Google Scholar]
  45. Kaseb, Z.; Montazeri, H. Data-driven optimization of building-integrated ducted openings for wind energy harvesting: Sensitivity analysis of metamodels. Energy 2022, 258, 124814. [Google Scholar] [CrossRef]
  46. Panda, D.; Satapathy, A.K.; Sarangi, S.K. Thermo-hydrodynamic analysis and optimal design of a GM cycle cryorefrigerator using response surface methodology and particle swarm optimization. Sci. Technol. Built Environ. 2019, 25, 1467–1481. [Google Scholar] [CrossRef]
  47. Taghinezhad, J.; Alimardani, R.; Masdari, M.; Mahmoodi, E. Performance optimization of a dual-rotor ducted wind turbine by using response surface method. Energy Convers. Manag. X 2021, 12, 100120. [Google Scholar] [CrossRef]
  48. Djimtoingar, S.S.; Derkyi, N.S.A.; Kuranchie, F.A.; Yankyera, J.K. A review of response surface methodology for biogas process optimization. Cogent Eng. 2022, 9, 2115283. [Google Scholar] [CrossRef]
  49. Atalan, Y.A.; Tayanç, M.; Erkan, K.; Atalan, A. Development of nonlinear optimization models for wind power plants using box-Behnken design of experiment: A case study for Turkey. Sustainability 2020, 12, 6017. [Google Scholar] [CrossRef]
  50. Aydar, A.Y. Utilization of Response Surface Methodology in Optimization of Extraction Extraction of Optimization of Plant Plant Materials. In Statistical Approaches with Emphasis on Design of Experiments Applied to Chemical Processes; InTech: London, UK, 2018; pp. 157–169. [Google Scholar]
  51. Tang, J.; Avallone, F.; Bontempo, R.; Van Bussel, G.J.W.; Manna, M. Experimental investigation on the effect of the duct geometrical parameters on the performance of a ducted wind turbine. J. Phys. Conf. Ser. 2018, 1037, 022034. [Google Scholar] [CrossRef]
  52. Aldhufairi, M.; Muda, M.K.H.; Mustapha, F.; Ahmad, K.A.; Yidris, N. Design of Wind Nozzle for Nozzle Augmented Wind Turbine. J. Adv. Res. Fluid Mech. Therm. Sci. 2022, 95, 36–43. [Google Scholar] [CrossRef]
  53. Lipian, M.; Dobrev, I.; Massouh, F.; Jozwik, K. Small wind turbine augmentation: Numerical investigations of shrouded- and twin-rotor wind turbines. Energy 2020, 201, 117588. [Google Scholar] [CrossRef]
  54. Ramayee, L.; Supradeepan, K.; Ravinder Reddy, P.; Karthik, V. Design of shorter duct for wind turbines to enhance power generation: A numerical study. J. Braz. Soc. Mech. Sci. Eng. 2022, 44, 160. [Google Scholar] [CrossRef]
  55. Putra, F.Q.; Rifai, D.; Suryopratomo, K.; Budiarto, R. Multilevel Diffuser Augmented for Horizontal Axis Wind Turbine. E3S Web Conf. 2018, 42, 01001. [Google Scholar] [CrossRef]
  56. Susandi, A.; Arifin, F.; Kusumanto, R. Simulation of Diffuser Parameters in the Performance of Horizontal Axis Wind Turbine using Computational Fluid Dynamics. Eng. Technol. 2021, 63, 7739–7749. [Google Scholar]
  57. Beller, C. Layout Design for a Venturi to Encase a Wind Turbine Integrated in a High Rise; Risø National Laboratory for Sustainable Energy: Roskilde, Denmark, 2008; Volume 6, pp. 3527–3537. [Google Scholar]
  58. Yadav, V.; Tiwari, P.K. A Review on CFD Analysis of Effects of Convergence and Divergence Angles on the Performance of a Nozzle. Int. J. Sci. Res. Eng. Trends 2020, 6, 33–35. [Google Scholar]
  59. Behera, S.K.; Meena, H.; Chakraborty, S.; Meikap, B.C. Application of response surface methodology (RSM) for optimization of leaching parameters for ash reduction from low-grade coal. Int. J. Min. Sci. Technol. 2018, 28, 621–629. [Google Scholar] [CrossRef]
  60. Sahu, S.; Behera, S. A review on modern control applications in wind energy conversion system. Energy Environ. 2022, 33, 223–262. [Google Scholar] [CrossRef]
  61. Qader, B.S.; Supeni, E.E.; Ariffin, M.K.A.; Talib, A.R.A. RSM approach for modeling and optimization of designing parameters for inclined fins of solar air heater. Renew. Energy 2019, 136, 48–68. [Google Scholar] [CrossRef]
  62. Aslani, A.; Masoumi, H.; Gilani, H.G.; Ghaemi, A. Improving adsorption performance of l - ascorbic acid from aqueous solution using magnetic rice husk as an adsorbent: Experimental and RSM modeling. Sci. Rep. 2023, 13, 10860. [Google Scholar] [CrossRef]
  63. Khamlaj, T.A.; Rumpfkeil, M.P. Theoretical analysis of shrouded horizontal axis wind turbines. Energies 2017, 10, 38. [Google Scholar] [CrossRef]
  64. Khalid, W.; Sherbaz, S.; Maqsood, A.; Hussain, Z. Design and optimization of a diffuser for a horizontal axis hydrokinetic turbine using computational fluid dynamics based surrogate modelling. Mechanika 2020, 26, 161–170. [Google Scholar] [CrossRef]
  65. Pashaei, H.; Mashhadimoslem, H.; Ghaemi, A. Modeling and optimization of CO2 mass transfer flux into Pz-KOH-CO2 system using RSM and ANN. Sci. Rep. 2023, 13, 4011. [Google Scholar] [CrossRef]
  66. Kumari, S.; Rajput, V.D.; Minkina, T.; Rajput, P.; Sharma, P.; Verma, A.K.; Agarwal, S.; Garg, M.C. Application of RSM for Bioremoval of Methylene Blue Dye from Industrial Wastewater onto Sustainable Walnut Shell (Juglans regia) Biomass. Water 2022, 14, 3651. [Google Scholar] [CrossRef]
  67. Sheshadri, S.M.; Dighe, V.V. Ground effect for ducted wind turbines: A computational study. J. Phys. Conf. Ser. 2022, 2265, 042079. [Google Scholar] [CrossRef]
  68. Refaie, A.G.; Hameed, H.S.A.; Nawar, M.A.A.; Attai, Y.A.; Mohamed, M.H. Comparative investigation of the aerodynamic performance for several Shrouded Archimedes Spiral Wind Turbines. Energy 2022, 239, 122295. [Google Scholar] [CrossRef]
  69. Hashem, I.; Hafiz, A.A.; Mohamed, M.H. Characterization of aerodynamic performance of wind-lens turbine using high-fidelity CFD simulations. Front. Energy 2020, 16, 661–682. [Google Scholar] [CrossRef]
  70. Taghinezhad, J.; Alimardani, R.; Masdari, M.; Mosazadeh, H. Parametric study and flow characteristics of a new duct for ducted wind turbines system using analytical hierarchy process: Numerical & experimental study. Energy Syst. 2022, 3, 1–30. [Google Scholar] [CrossRef]
  71. Gaden, D.L.F.; Bibeau, E.L. A numerical investigation into the effect of diffusers on the performance of hydro kinetic turbines using a validated momentum source turbine model. Renew. Energy 2010, 35, 1152–1158. [Google Scholar] [CrossRef]
  72. Ajayi, O.O.; Unser, L.; Ojo, J.O. Implicit rule for the application of the 2-parameters RANS turbulence models to solve flow problems around wind turbine rotor profiles. Clean. Eng. Technol. 2023, 13, 100609. [Google Scholar] [CrossRef]
  73. Wilberforce, T.; Alaswad, A. Performance analysis of a vertical axis wind turbine using computational fluid dynamics. Energy 2023, 263, 125892. [Google Scholar] [CrossRef]
  74. Yiyin, K.; AM, S.Y.; Muhammad, A.; Sri, S. Assessment of Flange Diffuser Structures to Improve the Power Generation of a Diffuser Augmented Wind Turbine. Przegląd Elektrotechniczny 2022, 4, 21–26. [Google Scholar] [CrossRef]
  75. Auyanet, A.G.; Verdin, P.G. Numerical Study of the Effect of Flap Geometry in a Multi-Slot Ducted Wind Turbine. Sustainability 2022, 14, 12032. [Google Scholar] [CrossRef]
  76. Sridhar, S.; Zuber, M.; Shenoy, B.S.; Kumar, A.; Ng, E.Y.K.; Radhakrishnan, J. Aerodynamic comparison of slotted and non-slotted diffuser casings for Diffuser Augmented Wind Turbines (DAWT). Renew. Sustain. Energy Rev. 2022, 161, 112316. [Google Scholar] [CrossRef]
  77. Badawy, Y.E.M.; Nawar, M.A.A.; Attai, Y.A.; Mohamed, M.H. Co-enhancements of several design parameters of an archimedes spiral turbine for hydrokinetic energy conversion. Energy 2023, 268, 126715. [Google Scholar] [CrossRef]
  78. Rahmatian, M.A.; Hashemi Tari, P.; Mojaddam, M.; Majidi, S. Numerical and experimental study of the ducted diffuser effect on improving the aerodynamic performance of a micro horizontal axis wind turbine. Energy 2022, 245, 123267. [Google Scholar] [CrossRef]
  79. Al-Quraishi, B.A.J.; Asmuin, N.Z.; Nasir, N.F.; Latif, N.A.; Taweekun, J.; Mohd, S.; Mohammed, A.N.; Al-Wahid, W.A.A. CFD Investigation of Empty Flanged Diffuser Augmented Wind Turbine. Int. J. Integr. Eng. 2020, 12, 22–32. [Google Scholar]
  80. Khalid, M.W.; Ahsan, M. Computational Fluid Dynamics Analysis of Compressible Flow Through a Converging-Diverging Nozzle using the k-ε Turbulence Model. Eng. Technol. Appl. Sci. Res. 2020, 10, 5180–5185. [Google Scholar] [CrossRef]
  81. Ramayee, L.; Supradeepan, K. Numerical study on flow characteristics of shroud with and without flap for wind turbine applications. Wind Eng. 2023, 47, 546–563. [Google Scholar] [CrossRef]
  82. Ramayee, L.; Supradeepan, K. Grid convergence study on flow past a circular cylinder for beginners. AIP Conf. Proc. 2021, 2317, 1. [Google Scholar] [CrossRef]
  83. Calle, A.R.; Baca, G.A.; Gonzales, S. Optimization of the Eolic Cell to improve the wind velocity augmentation effect through the metamodel of optimal prognosis. Energy Convers. Manag. X 2022, 16, 100330. [Google Scholar] [CrossRef]
  84. Görgülü, Y.F.; Özgür, M.A.; Ramazan, K.Ö.S.E. CFD analysis of a NACA 0009 aerofoil at a low reynolds number. Politek. Derg. 2021, 24, 1237–1242. [Google Scholar] [CrossRef]
  85. Abe, K.I.; Ohya, Y. An investigation of flow fields around flanged diffusers using CFD. J. Wind Eng. Ind. Aerodyn. 2004, 92, 315–330. [Google Scholar] [CrossRef]
  86. Azhar, F.N.A.; Taha, M.F.; Ghani, S.M.M.; Ruslan, M.S.H.; Yunus, N.M.M. Experimental and Mathematical Modelling of Factors Influencing Carbon Dioxide Absorption into the Aqueous Solution of Monoethanolamine and 1-butyl-3-methylimidazolium Dibutylphosphate Using Response Surface Methodology (RSM). Molecules 2022, 27, 1779. [Google Scholar] [CrossRef] [PubMed]
  87. Chaib, M.; Slimane, A.; Slimane, S.A.; Ziadi, A.; Bouchouicha, B. Optimization of Ultimate Tensile Strength with DOE approach for application FSW process in the aluminum alloys. Frat. ed Integrità Strutt. 2021, 57, 169–181. [Google Scholar] [CrossRef]
  88. Pashaei, H.; Ghaemi, A.; Nasiri, M.; Karami, B. Experimental Modeling and Optimization of CO2 Absorption into Piperazine Solutions Using RSM-CCD Methodology. ACS Omega 2020, 5, 8432–8448. [Google Scholar] [CrossRef]
  89. Khoshraftar, Z.; Masoumi, H.; Ghaemi, A. Experimental, response surface methodology (RSM) and mass transfer modeling of heavy metals elimination using dolomite powder as an economical adsorbent. Case Stud. Chem. Environ. Eng. 2023, 7, 100329. [Google Scholar] [CrossRef]
  90. Peng, H.; Guo, J.; Qiu, H.; Wang, C.; Zhang, C.; Hao, Z.; Rao, Y.; Gong, Y. Efficient Removal of Cr (VI) with Biochar and Optimized Parameters by Response Surface Methodology. Processes 2021, 9, 889. [Google Scholar] [CrossRef]
  91. Thangavelu, S.K.; Wan, T.G.L.; Piraiarasi, C. Flow Simulations of Modified Diffuser Augmented Wind Turbine. IOP Conf. Ser. Mater. Sci. Eng. 2020, 886, 012023. [Google Scholar] [CrossRef]
  92. Abdelrazek, A.M.; Abdelrazik, A.M.; Kassab, S.Z. Performance of a flanged diffuser augmented wind turbine structure with and without the presence of the turbine: 3D Study. In Proceedings of the 4th International E-Conference on Advances in Engineering, Technology and Management—ICETM, Changsha, China, 8–10 November 2024; pp. 115–125. [Google Scholar]
  93. Arifin, F.; Kusumanto, R.D.; Bow, Y.; Rusdianasari; Taqwa, A.; Susandi, A.; Herlambang, Z.D.; Wang, M.W.; Sitompul, C.R. Study the Effect Diffuser Length and Degree to Horizontal Wind Turbine. In Proceedings of the 4th International Conference on Applied Science and Technology on Engineering Science (iCAST-ES 2021), Sion, Mumbai, 7 May 2021; Science and Technology Publications: Setúbal, Portugal, 2021; pp. 681–685. [Google Scholar]
  94. Bekele, N.; Bogale, W. Parametric study of a diffuser for horizontal axis wind turbine power augmentation. AIMS Energy 2019, 7, 841–856. [Google Scholar] [CrossRef]
Figure 1. The CDaugWT design.
Sustainability 16 01707 g001
Figure 2. Surface response methodology procedures [48].
Sustainability 16 01707 g002
Figure 3. Geometry of the empty CDaugWT with the design parameters.
Sustainability 16 01707 g003
Figure 4. Computational domain dimensions.
Sustainability 16 01707 g004
Figure 5. Computational meshing and inflation layers on the shroud.
Sustainability 16 01707 g005
Figure 6. Mesh independence study for shroud (2D mode).
Sustainability 16 01707 g006
Figure 7. Maximum velocities for each case of the 86 runs.
Sustainability 16 01707 g007
Figure 8. Area weighted averaged throat velocities for each case of the 86 runs.
Sustainability 16 01707 g008
Figure 9. Throat velocity augmentation ratio for each of the 86 runs.
Sustainability 16 01707 g009
Figure 10. Reference study’s computational domain dimensions [85].
Sustainability 16 01707 g010
Figure 11. Mesh structure.
Sustainability 16 01707 g011
Figure 12. Velocity profile along the central axis.
Sustainability 16 01707 g012
Figure 13. The perturbation plot for velocity augmentation within the design space, showing parameters such as (A) diffuser angle, (B) concentrator angle, (C) length of concentrator, (D) length of diffuser, (E) length of throat, and (F) flange height.
Sustainability 16 01707 g013
Figure 14. Diagnostic plots of the model: (A) predicted vs. actual, (B) normal % probability vs. externally studentised residuals, (C) externally studentised residuals vs. predicted, and (D) internally studentised residuals against predicted.
Sustainability 16 01707 g014
Figure 15. The contour and response surface plots of velocity augmentation ratio as a function of concentrator length and diffuser angle.
Sustainability 16 01707 g015
Figure 16. The contour and response surface plots of velocity augmentation as a function of diffuser length and concentrator length.
Sustainability 16 01707 g016
Figure 17. The contour and response surface plots of velocity augmentation as a function of the length of the throat and the diffuser length.
Sustainability 16 01707 g017
Figure 18. Desirability ramp for adjustment of settings for maximum available velocity augmentation ratio optimised values for (A) diffuser angle, (B) concentrator angle, (C) length of concentrator, (D) length of diffuser, (E) length of throat, and (F) flange height.
Sustainability 16 01707 g018
Table 1. The parameter ranges.
ParameterNameUnitsLowHigh
ADiffuser angle ( θ d )degrees9.510
BConcentrator angle ( θ c )degrees19.520
CConcentrator length ( L c )mm350375
DDiffuser length ( L d )mm950975
Elength of the throat ( L t h )mm6570
FFlange height ( H f )mm95100
Table 2. Central composite experimental design (CcompD) samples.
RunA: θ d [ ° ] B: θ c [ ° ] C: [ L c /mm]D: [ L d /mm]E: [ L t h /mm]F: [ H f /mm]
11019.535097570100
29.819.8362.5962.567.597.5
39.52035095065100
49.519.53509507095
59.5203759507095
69.819.8362.5962.567.597.5
710203509756595
8919.8362.5962.567.597.5
99.819.8362.5927.167.597.5
1010203509506595
119.819.8362.5997.967.597.5
129.52037595070100
13102035095065100
149.519.535095065100
159.819.8362.5962.574.697.5
169.819.8327.1962.567.597.5
171019.53759757095
189.819362.5962.567.597.5
191019.53509756595
209.819.8362.5962.567.597.5
219.519.53509756595
229.519.53509757095
23102035097570100
249.5203509506595
259.519.537595065100
269.819.8362.5962.567.597.5
279.5203509507095
281019.53509757095
299.519.535097570100
309.819.8362.5962.567.597.5
319.52035097570100
329.519.535097565100
339.519.537597565100
349.52035095070100
35102035095070100
369.5203759756595
3710203759507095
381019.53759507095
399.519.537597570100
401019.53759756595
411019.537595065100
4210.519.8362.5962.567.597.5
439.819.8362.5962.560.497.5
449.819.8362.5962.567.597.5
459.819.8362.5962.567.597.5
461019.53759506595
479.519.535095070100
489.519.53759507095
499.819.8362.5962.567.5104.6
509.52037595065100
51102037595070100
529.519.53509506595
539.819.8362.5962.567.597.5
541019.537597570100
559.5203759757095
569.52037597570100
571019.535095070100
581019.535097565100
599.819.8362.5962.567.597.5
6010203759757095
611019.537595070100
629.819.8362.5962.567.597.5
63102035097565100
6410203509757095
659.519.53759757095
669.519.537595070100
679.820.5362.5962.567.597.5
689.519.53759756595
6910203509507095
70102037597565100
71102037597570100
729.5203509756595
739.52035097565100
749.5203509757095
759.819.8397.9962.567.597.5
761019.53509507095
779.519.53759506595
789.819.8362.5962.567.590.4
791019.537597565100
8010203759756595
8110203759506595
821019.53509506595
839.5203759506595
841019.535095065100
859.52037597565100
86102037595065100
Table 3. Details of the mesh parameters.
Mesh MetricElement QualityAspect RatioSkewnessOrthogonal
Quality
Min0.27191 1.3508 × 10 10 0.50298
Max0.99955.15350.73921
Average0.92461.08220.08270.9805
Standard Deviation0.10890.14220.11630.0487
Table 4. Study of mesh independency.
Grid NoNumber of Elements Average   Throat   Velocity   V t h Relative Difference (%)
130,1592.7854613-
240,2382.78952420.146
349,6632.79185050.083
466,0472.79399050.077
584,3882.78589750.290
6120,8402.78580980.003
7192,8592.78649580.025
8198,3652.78638790.004
Table 5. Summary of the model.
SourceStd. Dev.R2Adjusted R2Predicted R2PRESS
Linear0.00300.89050.88220.86420.0009
2FI0.00300.91280.88420.86840.0009
Quadratic0.00220.95810.93870.87430.0008Suggested
Cubic0.00210.97850.9430−1.14820.0144Aliased
Table 6. Analysis of variance for velocity augmentation model.
SourceSum of SquaresdfMean SquareF-Valuep-Value
Model0.0063120.0005106.67<0.0001significant
A-θd0.000310.000350.98<0.0001
B-θc0.000110.000112.250.0008
C-Lc0.000810.0008152.04<0.0001
D-Ld0.004610.0046929.89<0.0001
E-Lth0.000210.000238.37<0.0001
F-Hf0.000110.000113.390.0005
AC0.000010.00005.840.0182
CD0.000010.00007.820.0066
DE0.000010.00002.650.1082
A20.000310.000354.09<0.0001
B20.000010.00005.570.0209
C20.000010.00005.850.0180
Residual0.0004734.947 × 10−6
Lack of Fit0.0003645.320 × 10−62.320.0866not significant
Pure Error0.000092.294 × 10−6
Cor Total0.006785
Table 7. Ideal ranges for response and designated parameters.
ParameterTargetMinimum Maximum Optimised Value
Diffuser angle (θd)In range9.5010.00 10 °
Concentrator angle (θc)In range19.5020.00 20 °
Concentrator length (Lc)In range350.00375.00375
Diffuser length (Ld)In range950.00975.00975
Length of the throat (Lth)In range65.0070.0070
Flange height (Hf)In range95.00100.00100
Velocity   augmentation   ratio   ( V t h V )Maximum1.918871.957951.95313
Desirability-010.9
Table 8. Validation of model-predicted values using CFD analysis.
Method θ d θ c L c L d L t h H f V t h C F D V t h % Difference
SRO102037597570703.9063.8980.2
Disclaimer/Publisher’s Note: The statements, opinions and data contained in all publications are solely those of the individual author(s) and contributor(s) and not of MDPI and/or the editor(s). MDPI and/or the editor(s) disclaim responsibility for any injury to people or property resulting from any ideas, methods, instructions or products referred to in the content.

