Review

Identification of Criteria for Enabling the Adoption of Sustainable Maintenance Practice: An Umbrella Review

University of Novi Sad, Faculty of Technical Sciences, Department of Industrial Engineering and Engineering Management, Trg Dositeja Obradovića 6, 21000 Novi Sad, Serbia
*
Authors to whom correspondence should be addressed.
Sustainability 2024, 16(2), 767; https://doi.org/10.3390/su16020767
Submission received: 20 December 2023 / Revised: 3 January 2024 / Accepted: 4 January 2024 / Published: 16 January 2024

Abstract

:
The evolution from traditional industrial maintenance to sustainable maintenance (SM) is pivotal within an existing industrial ecosystem. This study, utilising an umbrella review (UR), critically examines this transition, highlighting its increased importance in maintenance decision-making (MDM). Using a sample (n = 20) of reviews, we synthesised meta-, methodological-, and content-based evidence and performed bibliometric, thematic and statistical analyses. For the bibliometric and thematic/conceptual analyses, we used the R bibliometrix package. The results show that the early research focuses mainly on theoretical aspects, while recent studies examine the practical implications. Also, comprehensive studies evaluating the benefits of implementing environmental and social aspects within MDM are still lacking. For that reason, we switched the attention to content-based data, from which we identified 43 distinct criteria discussed. For the analysis of criteria, the Bayesian Network Analysis with Gaussian Copula Graphical Model (BNA-GCGM) method was used. Although the evidence shows that environmental pollution, energy consumption and health and safety of workers are the most discussed criteria, the BNA-GCGM suggests that labour costs, resource consumption, employee satisfaction and energy consumption, among others, are the most influential criteria in the network analysis. Interestingly, after distinguishing studies into pre- and post-2021 research, the results show that pre-2021 research is primarily focused on economic and technical factors, reflecting a profit-oriented approach. The post-2021 analysis suggests a discernible shift towards more balanced considerations by incorporating social and environmental factors, suggesting a more socially responsible approach. Finally, while SM is gaining momentum, further empirical and practical research are required to demonstrate the advantages that SM offers in the light of the upcoming Industry 5.0.

1. Introduction

1.1. Background

Conventional maintenance practices have primarily focused on reactive repairs and replacements, often leading to inefficient resource utilisation and environmental degradation. However, the paradigm is shifting towards predictive, energy-based [1], and sustainable maintenance (SM) practices [2]. These practices encompass strategies neglecting the sole aim of prolonging the lifespan for the sake of profitability, in fact, the environmental and social priorities are now at the forefront [3]. Integrating sustainability principles into maintenance practice [4], the expected outcome considers minimised negative environmental impacts, reduced resource consumption, and enhanced resilience of physical assets.
Rhetorically, SM goes beyond the traditional understanding of maintenance as a mere technical activity of condition monitoring, maintenance activities and planning [5]. In fact, it recognizes the interconnectedness between human activities, asset management and the environment, acknowledging the importance of sustainability challenges [6]. Such a holistic approach provides (1) a shift in traditional perception of maintenance as a “necessary evil” to “value-added activity” [7]; (2) transition from a short-term financial benefit to a long-term perspective; and (3) better understanding of the life cycle impacts of maintenance activities [8]. With the adoption of SM practices, one potentially contributes to the realisation of Sustainable Development Goals (SDG) [9]—imposed by the European Commission, promotes circular economy (CE) principles [10], and enhances social equity [11], which are all dimensions that SM tries to encapsulate.
Moreover, SM yields economic benefits in the long run. Namely, by investing in advanced maintenance technologies, organizations can avoid costly repairs and replacements, minimize downtime, and improve overall operational efficiency [12]. Additionally, SM practices can create new job opportunities in sectors such as energy efficiency, renewable energy, and sustainable materials. Therefore, understanding and implementing SM strategies is not only essential for preserving the environment and achieving global sustainability goals, but also for promoting economic growth and resilience [13].
Given the aforementioned issues, this manuscript delves deeper into the concept of sustainable maintenance and its implications. Given the rise in interest in SM as research, backed up by an exponential rise in systematic and scoping reviews on the topic, we have conducted an overview of reviews, i.e., an umbrella review. Our goal is to provide both insights and feedback into what existing issues are of primary concern within disclosed reviews. By doing so, we expect to raise awareness and draw attention to the main factors enabling an easier transition to and adoption of SM management practice.

1.2. Related Research

Sustainable maintenance is slowly becoming a focus of mainstream research, mainly due to the benefits this practice offers, ensuring the long-term functionality, sustainability and viability of various systems and infrastructures [14,15,16,17,18]. As the world faces unprecedented challenges such as climate change and resource depletion, there is an urgent need for sustainable approaches in maintaining and managing organisational physical assets [19]. Considering that sustainable manufacturing enables moving from the linear to circular economy (CE) for efficient resource management and waste reduction [10], it is important to include the interrelationships between maintenance and sustainability. This is especially important, given that CE is considered one of the promising sustainable avenues for industrial companies aimed at reducing resource consumption [20]. Finally, aside from functionality, sustainability and viability, recent research started emphasising the importance of Industry 5.0 for sustainable reliability centred maintenance (RCM) [21].
The recent review studies show that existing body of knowledge on the topic of sustainable maintenance within the domain of Industry 4.0 [6] and Industry 5.0 [22], i.e., Maintenance 5.0, is mostly concerned [23] with resilient, worker-in-the-loop and human-in-the-loop [11] maintenance research. It places the wellbeing of the worker at the centre of the production process, enabling the use advanced technologies that provide prosperity beyond jobs. It complements the existing “Industry 4.0” approach by specifically putting research and innovation at the service of the transition to a sustainable, human-centric smart manufacturing [24], and resilient European industry [25].
Moreover, a limitation of existing work is that it lacks emphasis on data-driven reasoning in maintenance decision-making, which we believe is a missing link in the adoption of sustainable maintenance policies by top maintenance management. This can be primarily attributed to the lack of knowledge and understanding of data from operational processes, which are often left unused because maintenance technicians and engineers neglect useful information and knowledge in recognizing the hidden potential of data [26]. Also, the increased complexity of big data visualization techniques (e.g., multivariate data visualisation) [27] is one of the reasons why switching from big data toward smart data is much more suitable for data-driven MDM [28].
Lastly, given the expansion in the number of systematic reviews conducted on the topic of SM, there is a lack of uniform consensus about the existing SM research. Based on the screening on different literature sources and index bases, namely Web of Science, SCOPUS, Dimensions.ai, and Google Scholar, using search strings “sustainable maintenance” AND “umbrella review”, we did not find an overview of reviews conducted on the topic of SM. Therefore, this is the first study conducted using an explicit umbrella review protocol that addresses collective knowledge from prior reviews on the topic of SM practice.

1.3. Aims and Objectives

It is not uncommon for overviews to be viewed as a straightforward extension of their well-established precursor, the systematic review [29]. Thus, given the proliferation of systematic literature reviews (SLRs) on the topic of sustainable maintenance, there are conflicting opinions within existing SM reviews. Therefore, it has become apparent that synthesised evidence across SLRs on the topic of SM is required, especially if maintenance decision-makers (MDMs) were to make truly informed decisions considering the benefits of adopting advanced maintenance strategies in the upcoming Industry 5.0.
The apparent rise in the number of reported SLRs concerning challenges, barriers and trends of SM practices seems to suggest a general consensus is lacking on whether identified factors and criteria discussed within existing studies contribute to the improvement of MDM. Based on the screening, many SM review studies aim to address vertical rather than horizontal questions, which suggests that most of the existing reviews are descriptive. This can also be considered as a limitation of the existing SM body of knowledge, since reviews synthesise both primary and secondary sources of literature, ultimately overlapping studies, leading to a potential bias in conclusions. For this reason, we have decided to conduct an umbrella review (UR).
The UR refers to compiling evidence from multiple reviews into one accessible and usable document [29]. It focuses on broad conditions or problems for which there are competing factors, challenges, barriers, and criteria discussed. In the medical sciences, these competing factors are considered as interventions, where, unlike in the engineering domain, there are more horizontal types of RQs that are more suitable for these types of reviews [30]. In addition, in this study, we used the Preferred Reporting Items for Overviews of Reviews (PRIOR) checklist [31] and Overviews of Systematic Reviews (OoSR) flow diagram [32] for the search. Finally, we used the Population Concept Context (PCC) research question framework [33], and proposed the following research questions (RQs):
RQ1. How do existing meta-data records obtained from prior reviews (Population) across different industries, regions and scientific domains (Context) illustrate the evolution and current trends in sustainable maintenance practices (Concept)?
This RQ aims to illustrate the on-going research and thematic areas using meta-data records obtained from Web of Science bibliometric (bib or txt) files. The file consists of titles, authors, abstracts, author-generated keywords, and WoS-indexed keywords, among others. For the content analysis, we aim to gather content-based evidence that consists of criteria discussed within the sustainable maintenance literature.
The second RQ is then proposed as follows:
RQ2. What are the most influential factors/criteria (Concept) researched by ongoing systematic reviews (Population) that are enabling the adoption of sustainable maintenance practices (Context)?
The aim of this RQ is to allocate all criteria discussed within existing systematic reviews and to investigate which ones are driving the change and affecting other criteria in the overall SM discourse. By allocating criteria, we intend to raise awareness and place more attention on specifics enabling the adoption of SM practices within the industrial ecosystem.
The rest of the manuscript is as follows. The second section describes the methods and materials of the study, including an in-depth description of the search strategy, bibliometric (and bibliographic) analysis, including conceptual and thematic analysis, and finally the content investigation using Bayesian network analysis. The third section comprises results obtained from sources, publications’ meta-data records and content-based evidence. This section also provides detailed results obtained from conceptual and thematic analysis, including bibliographic coupling and evolution analysis. The last part of the third section includes the results from the Bayesian network analysis. The discussion section describes the discourse on sustainable maintenance and results obtained. Finally, the last section describes concluding remarks, limitations and implications of the research, and future research directions.

2. Methodology

Literature review methods have evolved in recent years. Unlike traditional narrative reviews, many protocols emerged to ensure transparency and replicability of a review. For instance, the Preferred Reporting Items for Systematic Reviews and Meta-Analyses (PRISMA) protocol [34] provided a way to ensure transparency and replicability of systematic reviews. However, the protocol such as PRISMA is not equipped to ensure consistency of umbrella reviews [30] for describing the quality of primary studies. This has become important in recent years since an exponential rise in systematic reviews on the topic of sustainable maintenance has been reported. Therefore, we decided to conduct an umbrella review following OoRS guidelines [32] and relying on the PRIOR [31] checklist. In the following subsections, an in-depth description of search strategies, data and information extraction steps is provided. In addition, for data and text analysis, we extracted both qualitative and quantitative evidence, including meta-data, qualitative and textual data from titles, abstracts, and keywords using word N-grams.

2.1. Search Strategy and Retrieval of Reviews

Based on the proposed RQs, it was difficult to isolate systematic reviews since the term “sustainable maintenance” encompasses a large amount of research outside the field of industrial maintenance, including buildings and facility maintenance, energy management, etc. The research specifically delved into sustainable maintenance of industrial assets. Also, not to omit any important studies and to assure high precision and accuracy of the search strategy, the search strings (Table 1) were designed to encompass studies outside of industrial maintenance practice using different search strings (e.g., physical asset management).
The search was performed with respect to the eligibility criteria (Table 2). The inclusion criteria considered full text reviews, written in English, and explicitly standalone reviews (primarily systematic reviews). However, since most of the studies were characterised as scoping rather than systematic and critical, a consensus was reached between the authors to include all standalone reviews with a time frame set to 2000–2023. The underlying reason for including all types of reviews was that outside of the medical sphere, most of the proposed research questions were vertical rather than horizontal in nature. Thus, the final list included SLRs, ScRs, and narrative reviews but excluded theoretical discussion papers and reviews that were extended with primary evidence such as case studies, expert and panel surveys, etc., that did not explicitly focus on conducting standalone reviews. Additionally, the backward snowballing (searching through references) and forward snowballing (searching through citations) searches were conducted for allocating related sources. The performed snowballing did not result in any new papers being allocated.
After finishing the searches, the results obtained resulted in 25 (16 available) studies. Since nine papers were unavailable to the authors, we contacted the main and corresponding author(s) via email and ResearchGate, which resulted in allocating 4/9 papers. In total, 20 review papers were included in the analysis, and five papers were unavailable to be tracked. The complete list of papers is provided in the Supplementary Materials.
Following the search strategy, the OoSR protocol (Figure 1) illustratively explained and reported the process of paper retrieval. For each included review paper in the analysis, three types of information were gathered for the analysis: review meta-data records and bibliometric and textual data (e.g., word N-grams), and content-based evidence regarding the criteria, factors and challenges discussed in the literature. Information regarding the meta-data and bibliometric data was extracted from RIS files and text files that were used as inputs for VosViewer (v1.6.19) and the R Bibliometrix (biblioshiny) package. Considering the criteria, the data consisted of discussed indicators, challenges and factors affecting sustainable maintenance development and decision-making in the literature. In addition, we included research methods, aims and objectives, definitions proposed, domains of the research, etc. The complete analysis of all included information and data is provided in the Supplementary Files, including qualitative and quantitative data.

2.2. Bibliographic and Thematic Analysis

From the extracted data from retrieved reviews, bibliographic analysis was conducted using VosViewer software and the R Bibliometrix package using the biblioshiny() functional platform. The biblioshiny() provides bibliographic analysis that requires no programming skills for visualization of gathered meta-data records. In addition, the package provides the conceptual structure and thematic mapping analysis, which are used in this study. The analysis of conceptual structure represents the relationship between concepts (or words/topics) in a sample of included articles. Namely, the structure is used here to understand the topics covered by the sample of synthesised review studies, with the idea of visually representing the analysis for better understanding the trend and thematic structures of on-going research. Also, a mixed approach using both factorial analysis (MCA—Multiple Correspondence Analysis) and network analysis (word co-occurrence) was conducted. The factorial approach considers plotting items consisting of word N-grams (e.g., unigrams, bigrams, trigrams) from titles, keywords, and abstracts for creating a bi-dimensional matrix where the axes are a functions of centrality and density of the thematic structure.
The performed thematic mapping, including both trend and evolution analysis, highlighted the themes of on-going research from different systematic reviews. The thematic mapping was represented by a biplot of centrality and density. The centrality represented a measure of the theme’s relevance, while density was a measure of the theme’s development [35]. The biplot was then split into four areas explaining (i) developed and isolated themes, (ii) motor themes, (iii) emerging or declining themes, and (iv) basic and transversal themes. Finally, the size of the cluster (bubble) was proportional to the co-occurrence of the word used, while position was determined by the Callon centrality [35]. This would not only aid in understanding the current and on-going research but also the evolution of the topic. In that sense, it would be possible to delineate the research topics over a specific time span, where matrices within a specified time span provide insight about on-going and future research. This would help gain insight about the evolution of sustainable maintenance over time. In order to assure the transparency and replicability of the findings, we provided the parameters for estimating the thematic model (Table 3).
Considering the MCA, the parameters were set to estimate the topic research relying on abstract bigrams with at least four clusters using a distance metric presented via dendrograms. The whole natural language processing (NLP) process before MCA implemented the Porter’s stemming algorithm to reduce the inflected (sometimes derived) words from word stems [36]. The MCA graphical representation and clustering was performed based on the K-means clustering. The full arguments behind the MCA analysis are provided in [36]. Finally, the co-occurrence and collaborative network analysis was performed using both VosViewer and Bibliometrix with an in-depth description of the analysis. Based on the obtained structure, conclusions were derived. In the following, the full description of the Bayesian network analysis (BNA) for allocating criteria affecting the on-going adoption and MDM within SM, is presented.

2.3. Bayesian Network Analysis (BNA)

The BNA network analysed belongs to the group of multivariate undirected network models. They are commonly used to discover and quantify the unique relationships (edges) between variables (nodes) for complex, multivariate datasets. Lately, many researchers have started utilising graphical network models over traditional multivariate factor analysis and structural equation models. These models, consisting of composed items in a network, are constructed to assess specific underlying dimensions [37]. In fields like the social and health sciences, network models are constructed with several related items that are used to measure the specific construct. However, this is a challenge for BNA models since the meaning of connections between items (nodes) usually changes. Traditional network models are constructed as Gaussian graphical models (GGMs) for building the network, where nodes (variables) and edges (connections) represent the conditional (in)dependencies depicted by statistical estimates between variables. This is usually done by partial correlation estimates (for conditioning on all other nodes). Simply put, an association between items that reflects the shared variance and a common cause is plausible.
For positioning the nodes in the network graph, the Fruchterman–Reingold [38] algorithm is commonly used. The FR algorithm can be understood as a force-directed measure that is visually represented by nodes (vertices) and edges (lines) as strings for the visual representation of data using specific estimators [39]. The extended Bayesian information criterion graphical least absolute shrinkage and selection operator (EBICglasso) [40,41] estimator is commonly used. However, in our case, since we were dealing with discrete non-continuous data, we used the Bayesian gaussian graphical model (Bayesian GGM) to explore the space of all models in a stochastic way [42]. What is good about these network models is that “spurious” connections can be revealed. In addition, since several assumptions need to be made in GGM (e.g., normality, linearity), we extended BNA with the Gaussian copula graphical model (GCGM) estimator that is particularly useful in its ability to capture both linear and non-linear dependencies and can accommodate binary, ordinal or continuous variables simultaneously by transforming variables into multivariate normal space using copulas [40].
The network interpretation is performed based on the global centrality measures represented by the centrality plot [41]. The centrality indices include Betweenness (the number of times a node lies within the shortest path between other nodes [43]), Closeness (the average shortest path between a single node with other nodes in the network), Strength (sum of the absolute weights of connections between different nodes [44]), and Expected Influence (the relative importance of a node considering both strength and direction of influence) [44]. For the edge centrality plot, an inclusion criterion is set to BF10 = 10 with 95% credible intervals (note: in Bayesian statistics, estimating credible intervals differs from frequentists confidence intervals, see [45]). Also, the indices in BF of 1 and 0 suggest evidence in favour of the alternative hypothesis over the null hypothesis. Additionally, instead of using R, the results can be replicated in open-source software JASP (v0.18.1) since it is built on the R platform and includes the mentioned packages.
The BNA-GCGM network parameters were set to Gamma = 0.5 [46] with G-Wishart prior df = 3. It is most prevalent in today’s scientific practice because it reduces the complexity of connections. Finally, since we were estimating the network structure with the analysis of a sparse network, the sampling options for the node and edge estimation were based on the 5000 (burn-in) and 10 k iterations (seed was set to 1234). It should be noted that BNA analysis models set conditional dependencies between variables, i.e., nodes, by estimating partial correlations between them. The g prior affects the strength of regularisation (how strongly the model avoids overfitting), while G-Wishart specifies prior distribution for the precision matrix (inverse of covariance matrix). In addition, the performed analysis included detailed results form tables given in the Appendix A, Appendix B and Appendix C, considering the weight matrix table, edge evidence probability table estimated from edge inclusion probability, and finally, centrality table of included indices.

3. Results

The sample consisted of 20 reviews closely related to the RQs. The time span covered 2015–2023 from 16 scientific sources with a 22.28% annual growth rate. There were a total of 73 authors included, with 3.65 average (3.5 median) authors per article, with two papers resulting in one author and a paper with eight authors (Table 4), and 30% of international co-authorship resulting on average in 3.27 co-authors per document. There were 69 author-generated keywords per document and 1476 references. The document average age was 2.05, and there were 15.2 average citations per document, while mean total citations per year averaged 4.84 citations (data in Appendix A).
Considering the overall meta-data of the studies, most of the articles were obtained through Google Scholar and SCOPUS, while 19 were indexed in Web of Science. From the analysis of the samples, reviews showed that on average, 47 papers were included per document, covering (search span) a time span of 33 years (median = 20) while synthesising papers (included span) averaged 8.3 years (median = 9), mostly prior to the search year.
Considering the methodological properties within the sample of reviews, the authors mostly relied on SCOPUS and WoS (65%) index bases for their analyses, including snowballing (30%) and other search databases (10%) with overlaps within. However, in five papers (25%), there was no explicit information on their literature sources. The study types mostly included journal articles (80%), followed by conferences (65%) and book chapters (30%). Also, four reviews, while elaborating on the search strategy, did not explicitly state study types included. An important fact to emphasise is that only 45% of included reviews had an explicit protocol (e.g., PRISMA, EBSE). In addition, only 55% of reviews included an explicit search strategy, while 75% had an explicit research question at the start of the review. Finally, only 10% of reviews included QAT tool, and only 40% of articles received funding for their research. In the following subsections, bibliographic, thematic and Bayesian network analyses are performed, and statistical inferences are discussed briefly.

3.1. Bibliometric and Bibliographic Analysis Results

3.1.1. Source Analysis and Meta-Records

The most relevant sources considering sustainable maintenance reviews were IFAC-PapersOnLine (2); Journal of Cleaner Production (2); Reliability Engineering & System Safety (2) and Sustainability (2); followed by sources with a single publication. The most locally cited sources (citations within documents) were Journal of Cleaner Production (83); IFAC-PapersOnLine (70); Reliability Engineering & System Safety (59); Journal of Quality in Maintenance Engineering (44); International Journal of Production Research (41); Procedia CIRP (34); Sustainability (28); Journal of Manufacturing Systems (26); Applied Sciences (25); Computers in Industrial Engineering (25); International Journal of Advanced Manufacturing Technology (22); and International Journal of Production Economics (21), followed by sources with less than citable articles.

3.1.2. Authors and Affiliations

Regarding authors and co-authors with the most contributions, Franciosi, C. (3); Miranda, S. (3); Riemma, S. (3); Bredebach, C. (2); Jasiulewicz-Kaczmarek M. (2); and Iung, B. (2), followed by others, had the highest numbers of systematic reviews on the topic of sustainable maintenance. The largest collaboration network was represented by Jasiulewicz-Kaczmarek M., while Franciosi, C. had the network with the most produced articles (Figure 2). In addition, evidence suggests that Franciosi, C. (22); Mirana S. (22); Riemma S. (22); Iung B. (21); Voisin A. (12); and Jasiulewicz-Kaczmarek M. (4) were the most locally cited authors.
Considering affiliations, the Universite de Lorraine (3); Centre National de La Recherche Scientifique—CNRS (2); and University of Salerno (2) were the most impactful considering number of publications. Most produced by country included Brazil (6), France (5), Italy (4), Portugal (4), Malaysia (3), Poland (3), Germany (2), Morocco (2), Norway (2), and the USA (2), with the rest considering only one country-associated affiliation. The most-cited countries included Italy (136); Poland (44); France (38), Finland (26), and Malaysia (16). The production of papers by authors, with topics of “sustainability”, “sustainable maintenance”, “industry 4.0”, seemed to produce the most results in IFAC-PapersOnLine, Journal of Cleaner Production and Sustainability (Figure 3). The evidence suggests that authors with fewer papers published focused more on the topics of “maintenance 4.0”, “asset management”, and “circular economy”, and these topics were also favoured by the top three sources.

3.1.3. Document Analysis

Considering global citation impact, the most impactful paper was that by Franciosi C. et al. (70 citations) [47], followed by Franciosi et al. (63 citations) [48] and Jasiulewicz-Kaczmarek M. (44 citations) [26], which was similar to the citations between SLRs obtained, i.e., local citations of documents. Considering references spectroscopy analysis—analysis of references within documents—the analysis showed that the earliest papers dated back to 1948, whereas the highest number of citations encompassed research papers within the last 5 years, with a peak in 2020 (Figure 4).
The performed analysis of word clouds encompassed review titles, abstracts, keywords, WoS categories and WoS-indexed keywords, and is provided in Figure 5.
The word clouds (Figure 5) seemed to be consistent with the expected research considered in the synthesised literature on sustainable maintenance, where most of the papers comprised systematic reviews on the topic of SM. Out of 156 extracted keywords, the threshold was set to two-word co-occurrence (33 words).
Next, the analysis of word co-occurrence, which shows the relatedness of items based on the number of documents in which they occur together (Figure 6), revealed the existence of four clusters. The underlying assumptions suggested that green clusters dealt mostly with the general review on the topic. The blue clusters suggested the asset management performance considering TBL metrics. Finally, the yellow clusters showed non-specific research encompassing general sustainability and Industry 4.0 domains, while red clusters suggested technical and system-specific energy-oriented analysis.
The relatedness of co-citation reference analysis (Figure 7) is formed based on a minimum of two citations appeared across the synthesised reviews (138 articles). This is consistent with previous globally and locally cited references of Franciosi, S. et al. and Jasiulewicz-Kaczmarek et al. as the most-cited articles. The data also supported the findings that Journal of Cleaner Production, Reliability Engineering & System Safety and Sustainability were the most-cited sources (Figure 8), followed by Computers & Industrial Engineering, International Journal of Production Research, Applied Sciences, and Journal of Manufacturing Systems. The source co-citation analysis was performed for items with at least two citations shared.

3.2. Conceptual and Thematic Analysis Results

3.2.1. Bibliographic Coupling

Bibliographic coupling shows the relatedness of items based on the number of references they share. The resulting graph (Figure 9) provides results mostly associated with the year of publication, where red clusters show the similarities in sharing references published 2022–2023, green clusters show similarities in papers published prior to 2020, while blue clusters show mixed results for papers published from 2019 to 2023. The resulting graph did not provide any unexpected results considering the references of articles shared.

3.2.2. Thematic Mapping and Evolution Analysis

We first performed thematic evolution analysis using unigrams from the abstracts. After conducting several iterations, an adequate interpretation was performed by splitting the range into 2015–2019, 2020–2020, 2021–2022 and 2023 (Figure 10). Considering the reviews from 2015–2019, the most common unigrams suggested development of the concept of sustainable maintenance and its application in the industrial domain. On the other hand, the incorporation of “sustainability” into the maintenance decision-making process brought the notion of triple bottom line (TBL), in which case some reviews started to discuss the association between TBL factors and maintenance, which ultimately led to the open gap of incorporation of sustainable maintenance performance indicators (SMPI) [49], although just from a theoretical perspective (Figure 11). During 2020, the increase in reviews indicated a shift from theoretical towards the practical context by investigating the theoretical propositions of SMPIs within manufacturing and asset management contexts (Figure 11). In the following years (2021–2022), most reviews continued the synthesis of evidence and started questioning the role of technology and digitization for sustainable maintenance services [50], ultimately questioning the role of these technologies as enablers for the transition towards SM (Figure 11). Finally, six systematic reviews published on the topic SM started questioning the suitability and maturity level of SM practice in the manufacturing context (Figure 11), especially in the domain of Industry 5.0 [22].
Unlike thematic evolution analysis, the thematic mapping (Figure 12) and network mapping (Figure 13) help identify major themes and topics within sample of studies. Namely, based on the performed thematic mapping using abstract bigrams, the visualisation suggested that future research will be mostly dedicated to the association between SM development, enabling technologies and maintenance policies within SME enterprises, relating to sustainable development and sustainable manufacturing. Next, the sample of review studies provided several remarks and conceptual propositions regarding the SMPI, however, mostly from the theoretical perspective. Also, it has been recognised that maintenance is actually an important link within asset management research, specifically considering energy and resource consumption. On the other hand, the allocation of abstract bigrams suggested that bibliometric and bibliographic analysis is taking place within SLR studies as a more visually appealing way to represent on-going and state-of-the-art research. Some studies have started emphasising the importance of TBL factors and their impact through economic dimensions. Finally, there were also raised concerns specifically towards social aspects and challenges of SM and their importance and association with sustainability goals (Figure 13), i.e., Sustainable Development Goals (SDGs).
Unlike thematic evolution and mapping analysis, a historiograph (Figure 14) was used to map scientific literature on the topic. The evidence suggested that most of the published and on-going research has been impacted by the paper of Franciosi, C. et al. [47]. Next, the visual representation showed that Franciosi, C. et al. [48] and Jasiulewicz-Kaczmarek, M. et al. [26] were the most impactful papers in terms of citation. It was interesting to find that the papers by Orošnjak, M. et al. [5] and Karki, B. et al. [50] were separate from the others, which in fact showed that these reviews covered energy-oriented and digital aspects and challenges within the sustainable maintenance domain, which will be discussed in detail later.

3.2.3. Factor analysis using MCA

The MCA analysis was performed using abstract bigrams. The model adequately captured more than 80% of the variation, i.e., inertia (Figure 15), which is considered appropriate [7]. The overall structure showed good association of words into clusters based on the Euclidean distance (k-means), where clusters suggest reasonable separation between centroids by the hierarchical clustering distance (Figure 16), ultimately suggesting an appropriate number of clusters.
Considering the detailed MCA analysis, several interesting insights were uncovered. Namely, the first SLR study on the topic of SM, performed by Pires, S. et al. [51], did not show any association with other clusters, which could also be observed from the historiograph (Figure 14) showing no association with later review studies. Next, based on the formed centroids and identified clusters, most items (bigrams from abstracts) clustered within the centre point of gravity (for understanding, see [52]). This suggests that from the text analysis using abstract bigrams, most of the papers had high word similarity (16 papers). The papers showing high inertia were those of Franciosi, C. et al. [47] (blue cluster), Campos, R. et al. [53] (green cluster) and Santos, A. et al. [54] (purple cluster), which will be further analysed and elaborated in the discussion.

3.3. Bayesian Network Analysis Results

3.3.1. Raw Data Extraction

The BNA of factors addressing existing challenges in the SM was considered. Firstly, the data synthesis of raw secondary evidence, i.e., reviews, consisted of 87 isolated factors discussed within the sample of review studies. The isolated factors were then subjected to the analysis. Similar factors were grouped and merged. Finally, the list consisted of 43 specific factors under five different factor groups. Based on the sample of reviews, the proportion of discussed factors in the literature consisted of (Figure 17b) Environmental (35.6%), Economic (18.78%), Technical (20.93%), Social (20.39%), and Technological (4.29%). These factors were addressed either through samples of reviews as potential challenges for the transition to advanced SM, or as evaluation metrics.
From the list of 43 extracted specific factors (Figure 17a), energy consumption was by far the most-mentioned environmental factor addressed within SLRs on the topic of SM, followed by pollution factors (e.g., pollution, waste, etc.) and hazardous emissions (e.g., noise). Considering economic factors, overall maintenance costs, energy consumption costs and production costs were the three most-discussed factors. From the group of technical factors, reliability, availability and maintainability (RAM) were the most-considered, followed by productivity, product quality, and spare parts management. From the social perspective, the health and safety of workers were by far the most important, followed by responsibilities and regulations, accidents, training and employee training and upskilling. Finally, the technological dimensions were the least-discussed in the domain of SM, where data management, data analytics and information management were mostly considered within the reviews.

3.3.2. Overall Network Structure and Analysis Results

Based on the acquired secondary-source data from synthesised reviews, we performed BNA to depict a potential association between factors investigated. To do so, we performed BNA in JASP using the following parameters: the network estimator was GCGM; edge estimation was performed based on the inclusion criteria with Bayes Factor (BF10 > 10); the sampling option was 5000 burn-in period with 100 k iterations (seed was 1234 for repeatability); the g prior was set to 0.5 without initial configuration of prior edge inclusion (g start = empty); and degrees of freedom of G-Wishart prior (df prior) was set to 3. For the inclusion of edges, the cut point was set to 0.2 as the threshold to eliminate edges with low effect. The obtained network showed 0.494 sparsity of association between nodes (Table 5). The analysis was performed on an Intel® Core™ i5-10400 CPU @2.90GHz, with 16.0 GB (15.8 GB usable) RAM memory running the 64-bit Windows 11 Home operating system for x64-based processors.
The design of the network required approximately 5 min to complete. After splitting the network into pre-2021 SM research and post-2021 SM research, the time to complete the design of the network more than tripled (15.5 min). The network structure is presented in Figure 18. The edge evidence probability table and weights matrix were unable to be added in attachments due to size but are provided in the Supplementary File in csv format.
The BNA network (Figure 18) of the synthesised studies suggested high association between several factors discussed within the literature. Namely, the consideration of environmental factors such as environmental_ollution ultimately resulted in positive associations with economic factors (environmental_costs), positive associations with social factors (health_and_safety_of_workers) and negative associations with social factor (responsibility_and_regulations). The environmental factor of energy_consumption suggested high positive association with technical (reliability; spare_parts_management) factors. The waste_management suggested high association with responsibility_and_regulations alongside health_and_safety_of_workers. Overall, the environmental factors were strongly associated with technical factors. This suggests that most of the reviews conducted showed that within their collected studies, the primary studies mostly considered technical aspects while considering environmental challenges.
Considering the economic factors, most of the nodes suggested high associations with social factors—health_and_safety_of_workers, responsibility_and_regulations, training_and_upskilling and stakeholder_participation/involvement. However, there were some negative associations, such as the edge between labor_costs and energy_consumption. Indeed, the connection suggested that changes in consideration of environmental factors, such as focusing more on energy_consumption strongly influenced the labor_costs. Such a perspective tended to describe the focus of the study simply by emphasising the domain of research on more technical aspects, rather than economic aspects, ultimately describing the existing body of research.
The technical factors suggested that the highest edge association was shared between risk_of_failure and data_analytics and maintenance_waste and resource_management. The former suggested the importance of data analysis tools in avoiding and/or preventing failures, while the latter suggested that effects considering changes in resource_management strongly influence maintenance waste, presumably in terms of time and costs. Finally, the influence on changes in technological variables can be considered inconclusive, since only three reviews considered discussing the role of technological factors within the sustainable maintenance domain.
Furthermore, in the analysis of the impact of indices, i.e., nodes in the network, the results for centrality (Figure 19) suggested that Labor_costs, Process_management, Resource_Consumption, Maintenance_spare_parts_costs, Employee_satisfaction, Transporation_and_Delivery, and Energy_consumption we the most impactful nodes in the network, among others. This suggest a higher probability that changes in these variables will lead to changes/increases in scores for other variables and changes in the network structure.
The analysis of the expected influence by the centrality plot suggested that the highest impact in the network was due to economic factors. Therefore, changes in these variables are likely to produce notable changes in other nodes in the network. The lower impact in the network was due to technological factors, as suggested by the centrality plot. However, although these types of network analyses emerged recently, shared negative scores for the expected influence are under constant debate and discussion, which is beyond the scope of this paper. However, most agree that shared positive expected influence suggests that such nodes (variables) act as facilitators in the network, where changes in a specific node will impact changes in other nodes shared in the network.

3.3.3. Network Analysis Results after Split

After performing the BNA of the retrieved sample of review studies, the data were then split into pre-2021 and post-2021 studies. The reason for the split was driven by the changes in thematic evolution (Figure 10) and conceptual maps (Figure 11). The resulting network showed relatively similar sparsities (Table 6), with a slightly lower number of non-zero nodes in the post-2021 research network. Based on the split, the results obtained showed different underlying probabilities, i.e., dependencies between network nodes (Figure 20).
The obtained network structure showed more sparsity on the right (Post_2021 sample), with few or no conditional dependencies between technological and other nodes in the network. Although the network supported the existence of edge association between similar nodes, the results exposed new potential associations between Post_2021 studies, specifically the association between environmental and technical factors, while in Pre_2021, the existence of an association between environmental and social factors was noticed.
The node centrality (Figure 21) showed consistency with the overall BNA structure, where Labor_costs was the most impactful node. However, unlike overall node centrality, in the Post_2021 network Product_Quality, Health_and_safety_of_workers, and Reliability and Maintenance_costs were the most impactful ones, while in Pre_2021, Transporation_and_Delivery, Data_management and Maintenance_Downtime, among others, were the most impactful nodes. Hence, our inference was that TBL indicators, researched or implemented in maintenance decision-making, invoke the question of economic impact when considering a wide range of criteria for maintenance decision-making.

4. Discussion

4.1. The Discourse on SM Practices from Bibliometric Analysis

The rise in systematic (or standalone) reviews on the topic of sustainable maintenance suggests the following. Firstly, the growth in the number of SM publications characterises scientific discourse on industrial maintenance, which in fact has been stimulated by imposed environmental actions (e.g., Millennium Development Goals—MDGs) and initiatives (e.g., Green Deal, RePowerEU). The former, adopted by the UN during Millennium Summit 2000, marked a historic mobilisation to achieve a set of important social and environmental priorities worldwide [55], and was later succeeded by the SDGs in 2015 [9], consequently affecting the adoption of SM conceptual propositions. Secondly, the shift from traditional maintenance practices towards sustainable ones by relying on sustainability indicators can be a valid point for maintenance evolution [5] by incorporating more than economic dimension in maintenance decision-making.
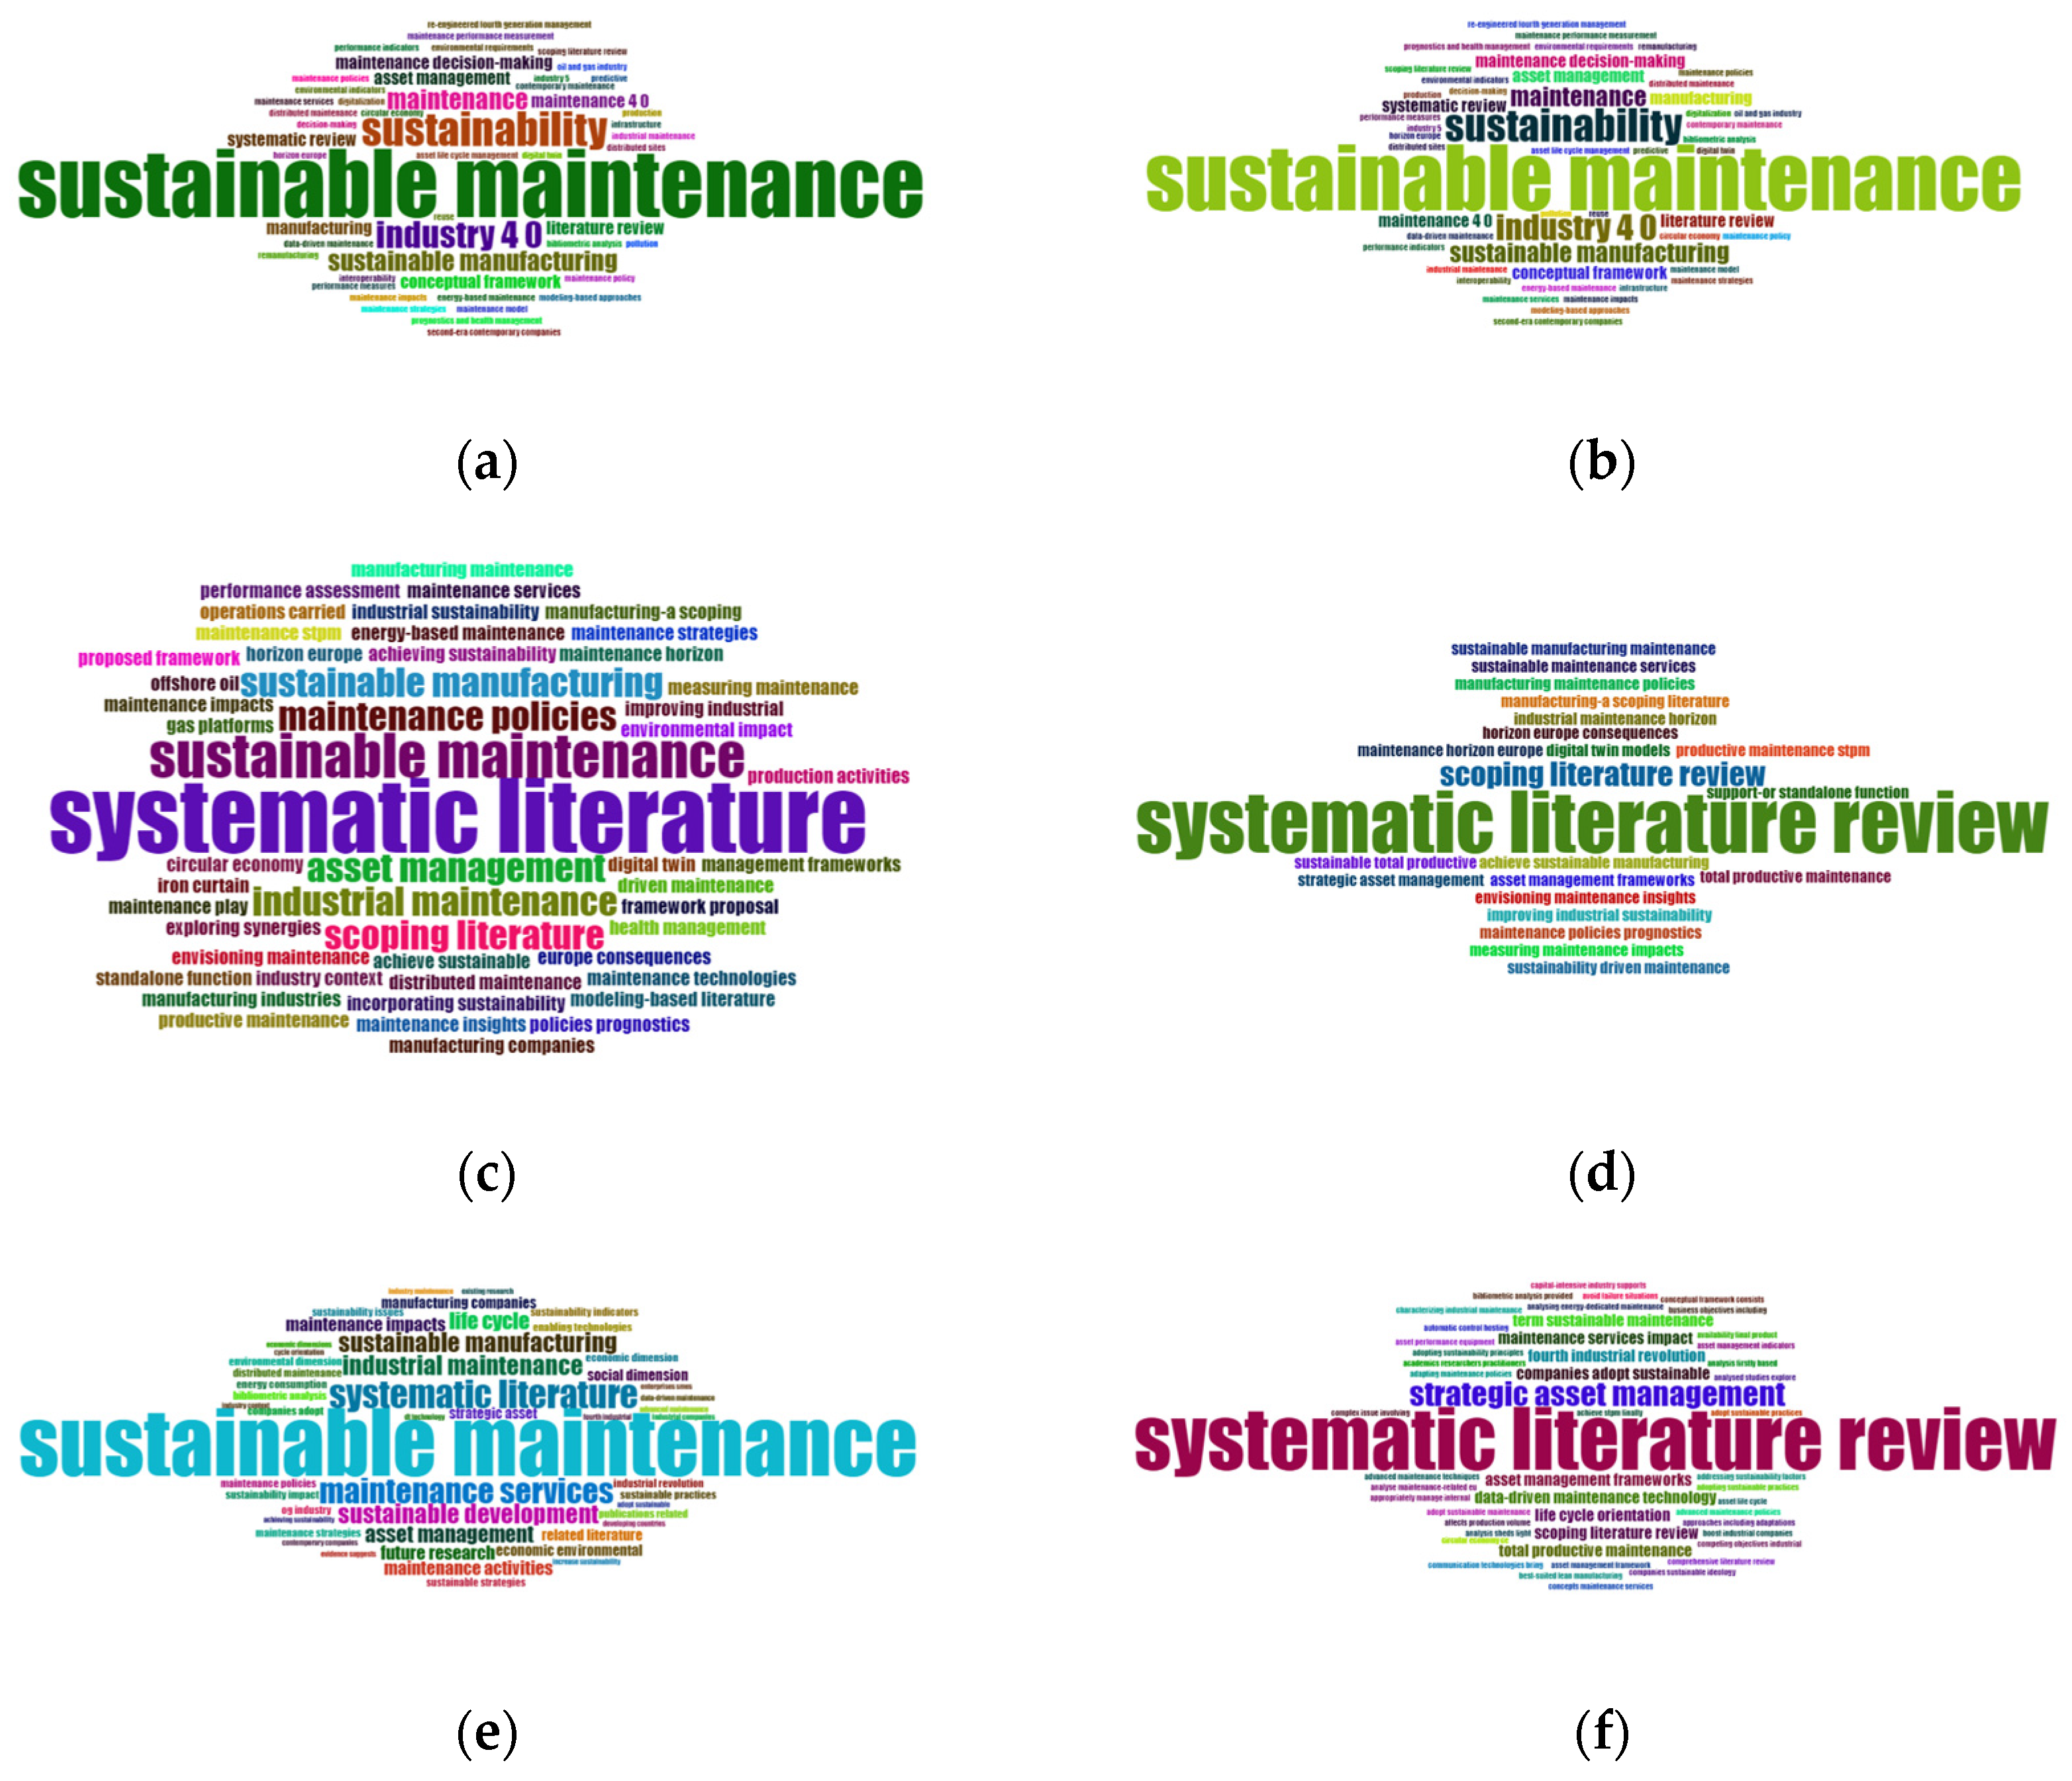
The results of our search strategy considering word clouds (Figure 5) seem to be reasonable in terms of encapsulating studies referring to “sustainable maintenance” and “systematic literature reivew”. The triplot of authors, concepts and sources (Figure 3) suggested that most of the SM research specifically addresses the role of sustainability in traditional asset and maintenance management, and the impact of sustainability on maintenance within the domain of Industry 4.0.
The bibliometric analysis encompassing reviews from 2015 to 2023 suggested the following (
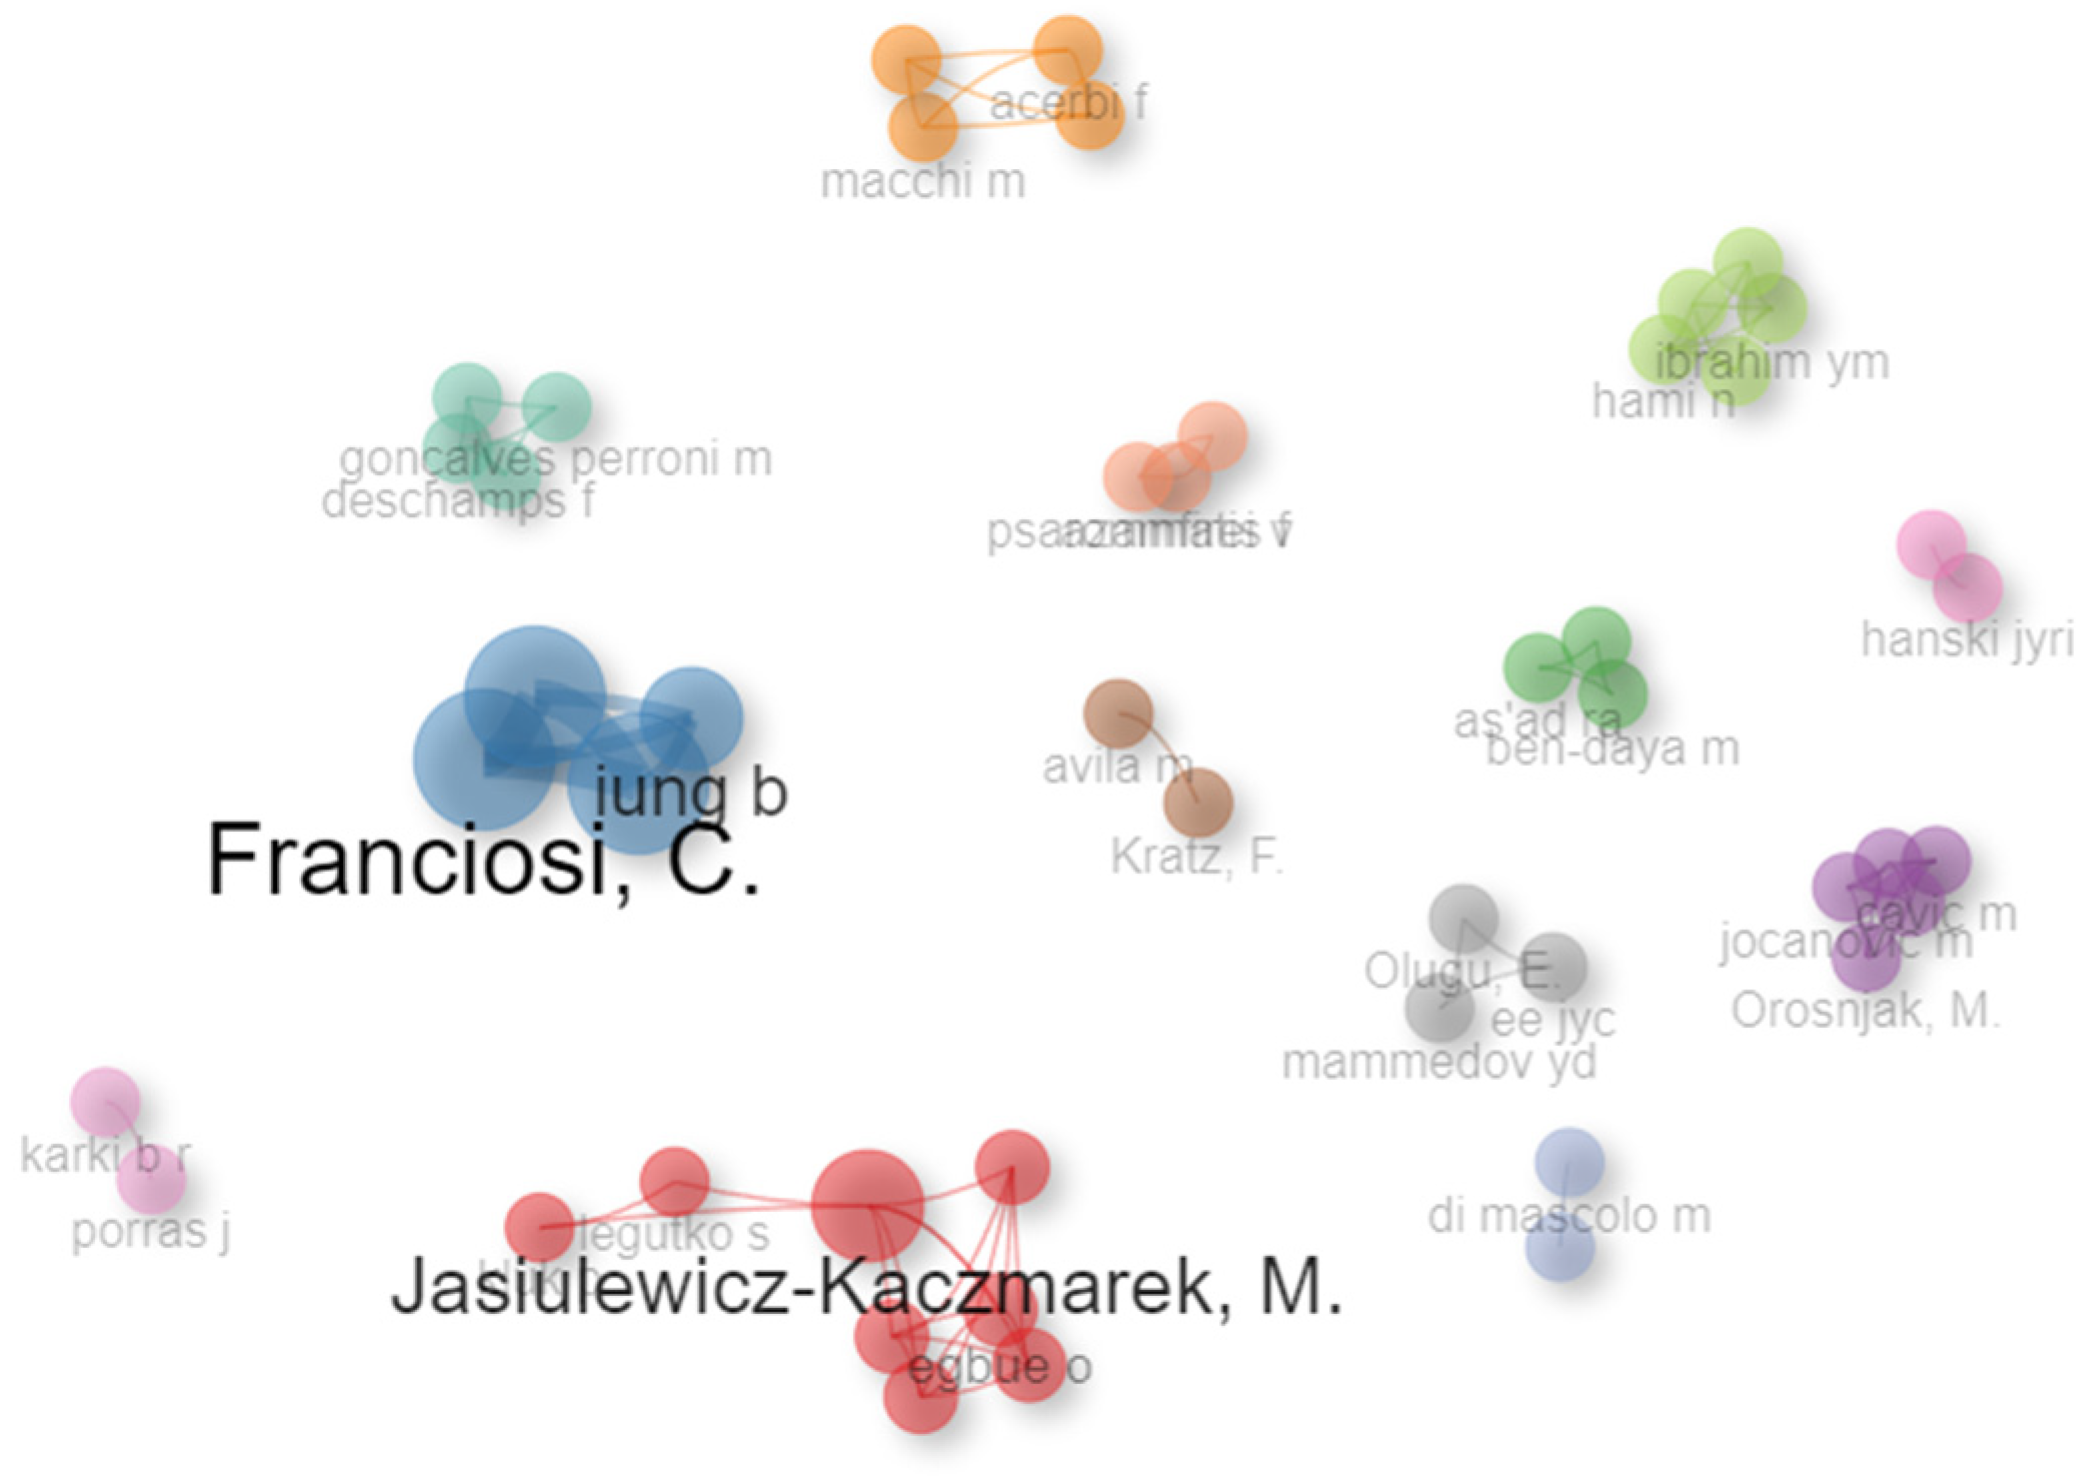
Table 4). The growth in reviews (22.28%), averaging 4.84 citations per document year, suggests that indeed SM offers a huge potential for the upcoming Industry 5.0; however with many challenges and barriers encountered both in literature and in practice. Although an extensive SLRs are conducted, from methodological side, the reviews may be prone to bias. Namely, out of all reviews gathered, only 30% (6/20) used an explicit protocol (e.g., PRISMA), while only 10% (2/20) used an explicit QAT tool. In that sense, the validity and reliability of such studies can be considered low and questionable in terms of reproducibility. From the co-occurrence analysis of authors (Figure 7) and sources (Figure 8), the publications by Franciosi, S. and Jasiulewicz-Kaczmarek M., can be considered leaders in the domain of SM, while the Journal of Cleaner Production and Sustainability, as the literature sources with the most publications, vouch for the reliability of SM results. Moreover, in the existing reviews, there were no primary studies conducted that specifically assessed or compared SM strategies to traditional ones. Based on the prior evidence, only one study [56] contrasted EBM to traditional maintenance practice(s), resulting in poorer results, suggesting that SM practice is still in its infancy and on theoretical basis, thus lacking substance behind arguments of benefits authors claim it provides.
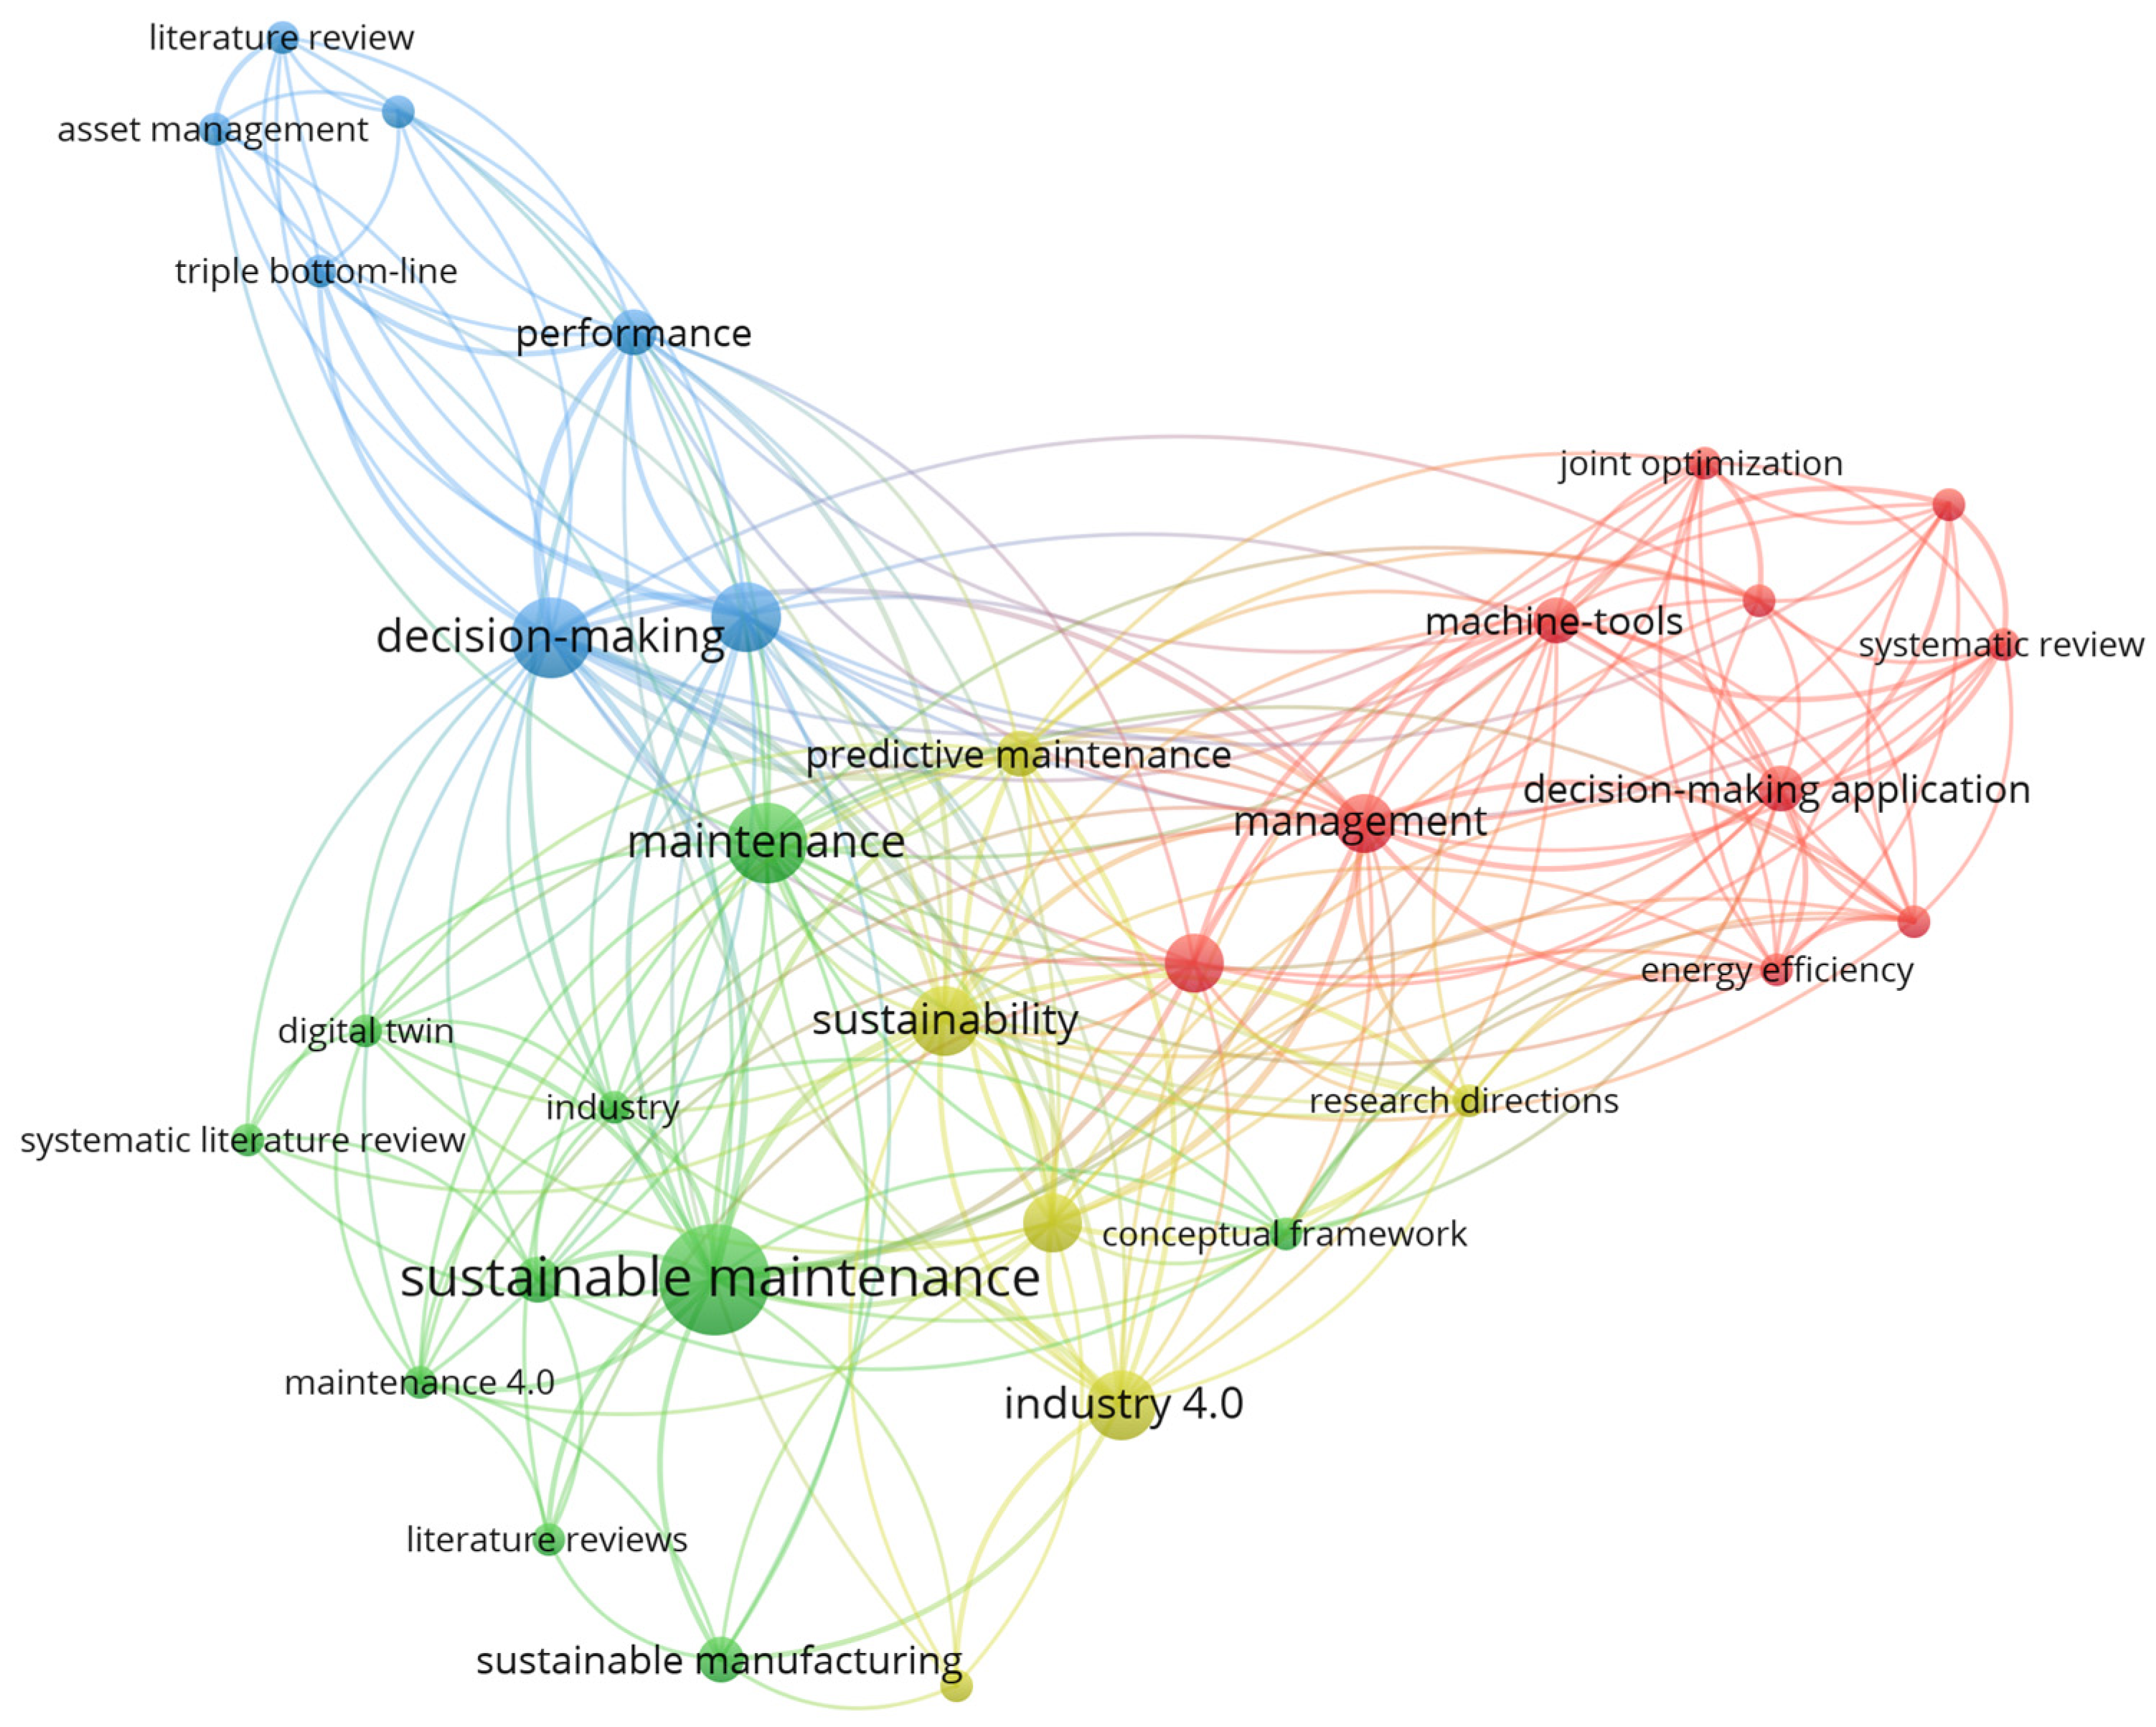
Further deduction, based on keyword co-occurrence analysis (Figure 6) separated by clusters, suggest three research SM domains: maintenance decision-making and performance-associated metrics/indicators (blue clusters), general sustainable maintenance challenges (green clusters), and energy-oriented maintenance applications for optimisation purposes (red clusters). Still, to avoid making generic inferences using simple word co-occurrence, we explored thematic and conceptual results.

4.2. Thematic and Conceptual Analysis

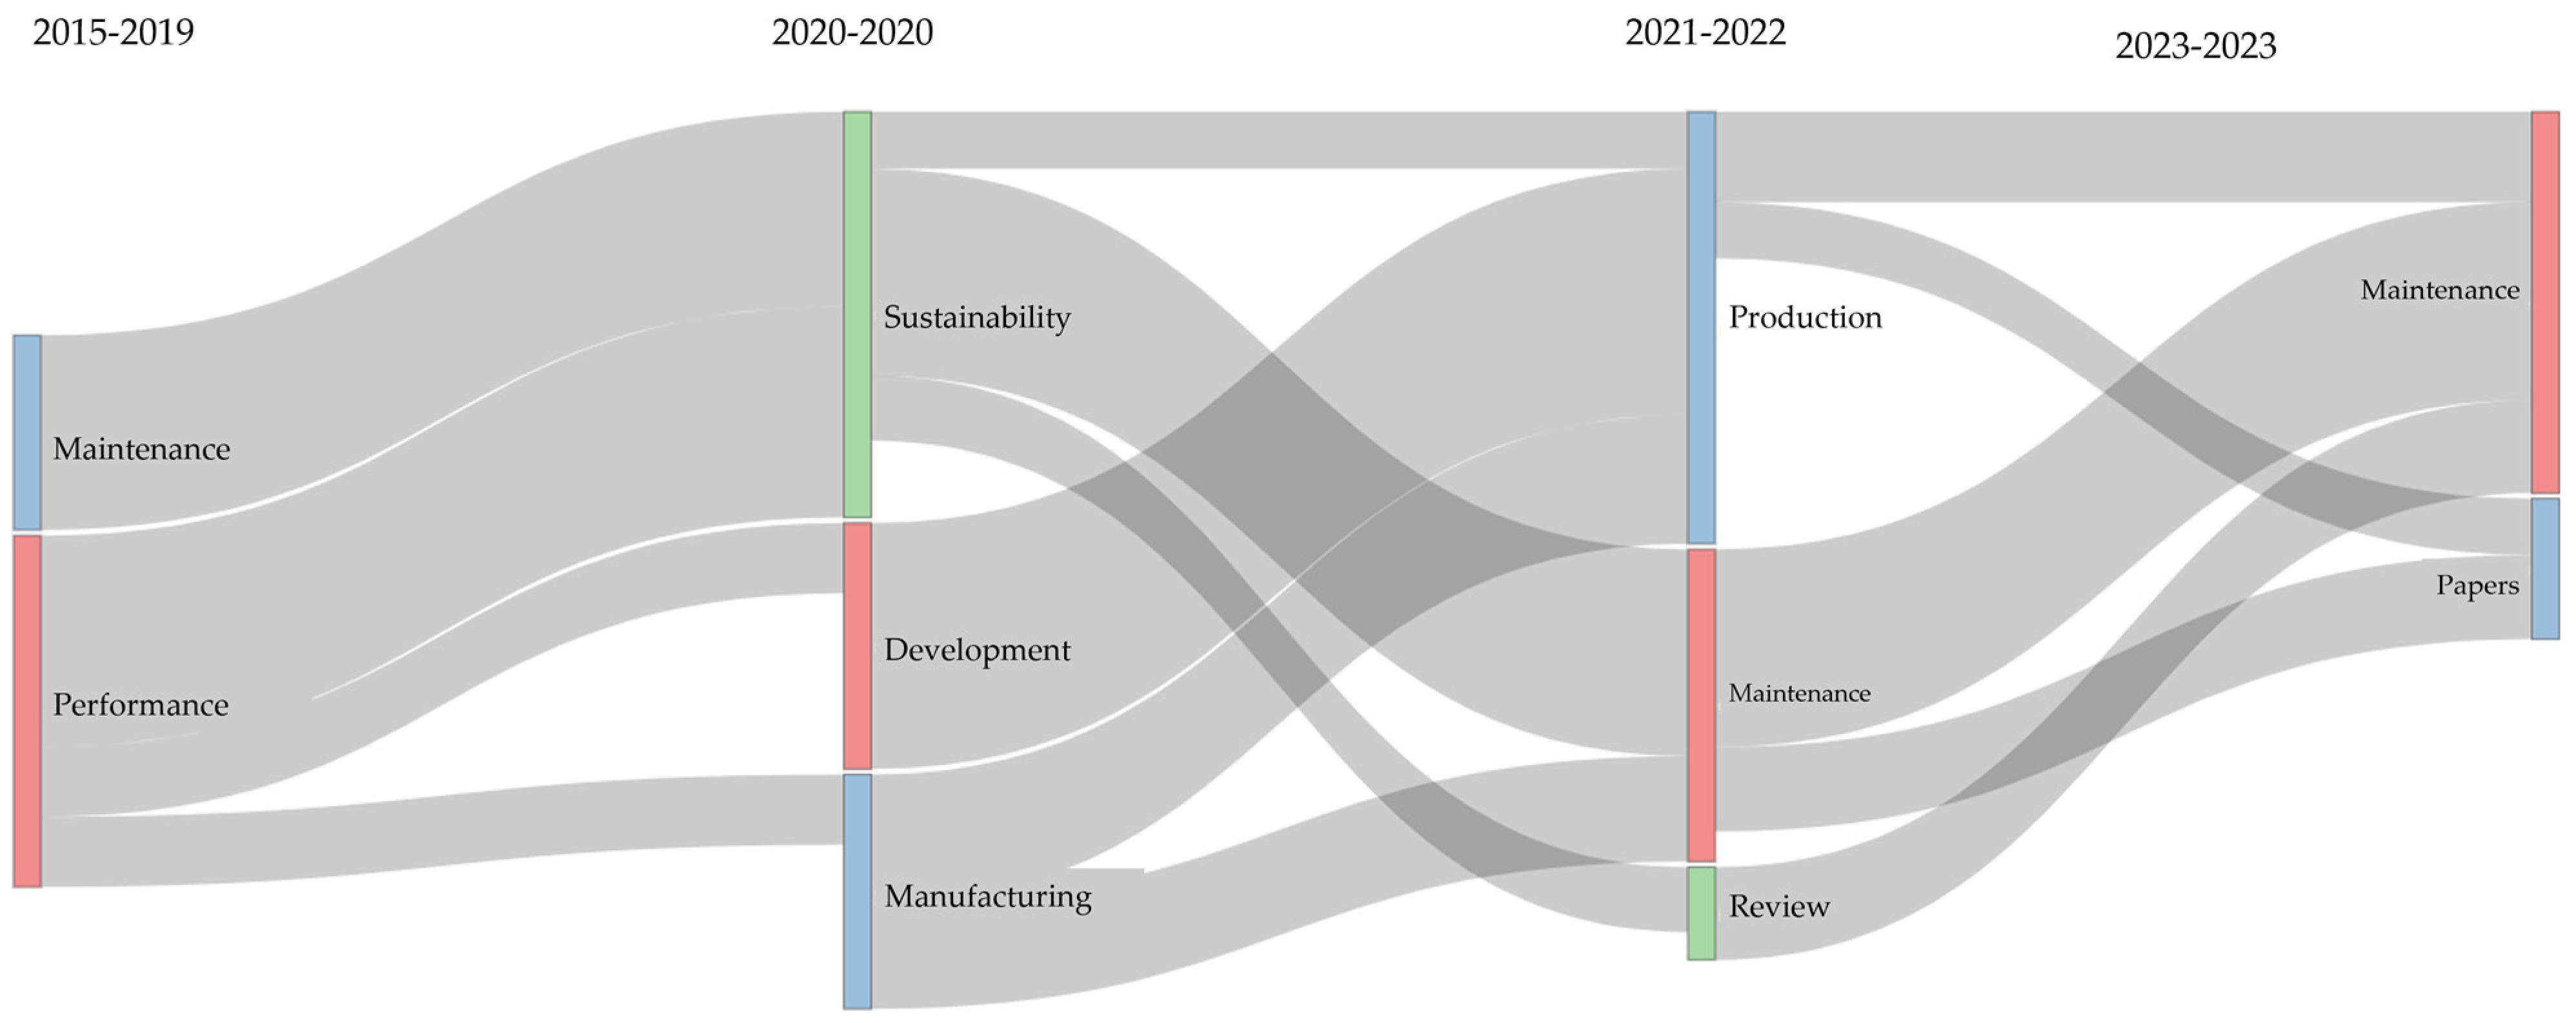
The thematic evolution (Figure 10) analysis suggest that most of the research are on a theoretical basis (up to 2021), which considered a discussion on the suitability of and relationships between sustainability concepts (e.g., CE) and industrial maintenance. Later on, the studies started questioning the role of sustainable maintenance as a standalone function [57], instead of just a supporting activity for the sake of sustainability [47]. This was also semi-supported by the thematic evolution maps (Figure 11), where prior to 2021, emerging themes were circling around economic, social and environmental dimensions and slowly adopting questions regarding barriers, challenges and performance indicators. The post-2021 mapping did not provide enough information, except in the generic terms “systematic”, “sustainability”, “production”, “manufacturing”, etc.; thus, the findings from the unigram mappings in post 2021 split remained inconclusive. Extending the thematic analysis by abstract bigrams (Figure 12), the results provided insight about the motor themes of “future research”, “sustainable maintenance”, “asset management”, and “maintenance impacts”, while emerging/declining themes covered “sustainable goals”, “social aspect”, “economic dimensions” and “maintenance perspectives”, leaving the impression that although there is a huge amount of solution space to be explored, the fact that there is most research on a theoretical basis, leaves the impression that SM topic is not moving forward.
Furthermore, the MCA analysis (with abstract bigrams) show that 16/19 abstract items cluster together (shared inertia), while reviews by Franciosi, C. et al. [47], de Campos et al. [53], and Santos, A. et al. [54] show the highest inertia from the centre of gravity, whereas the study by Pires, S. [51] did not associate with any cluster. Primarily, the study by Pires, S. [51] is also questionable in terms of suitability within the proposed domain, since it mostly investigates the roles of interoperability, ontology and semantics for enabling applicability and transition of sustainability in MDM. This perhaps can be considered a major setback that resulted in a poor transition towards the sustainable approach simply because technological challenges were poorly covered and addressed before delving into sustainable dimensions. This was later recognised in the review conducted by Karki, B. and Porras, J. [50] acknowledging the importance of digitalization for sustainable maintenance activities.
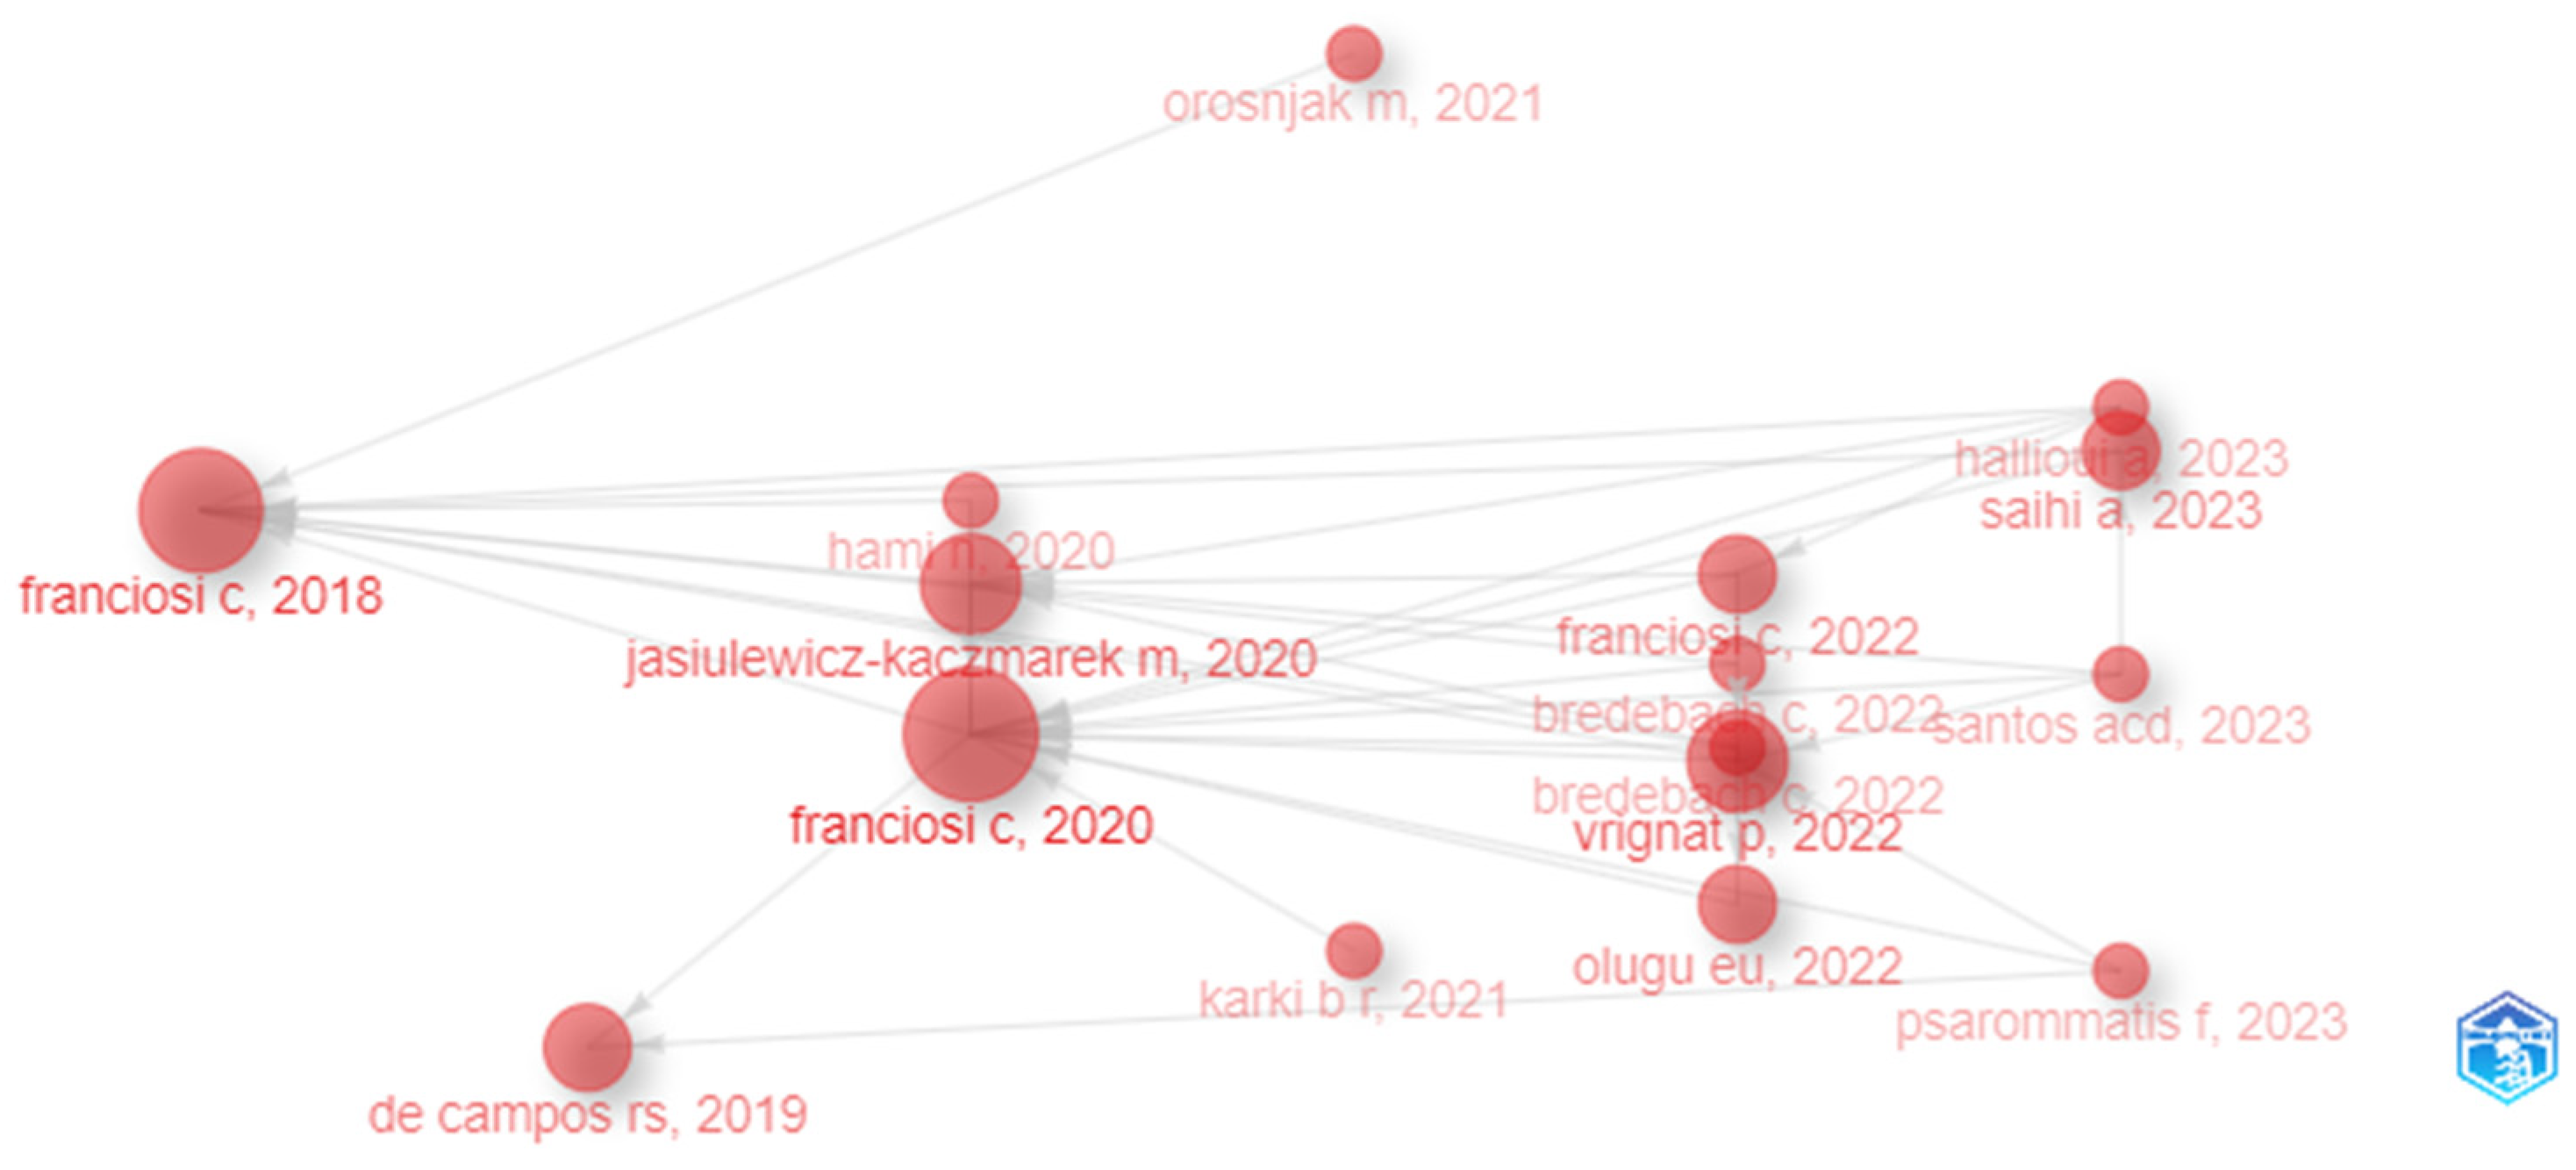
The work by Franciosi, C. et al. [47] motivated many to engage in standalone reviews on the topic of sustainable maintenance (
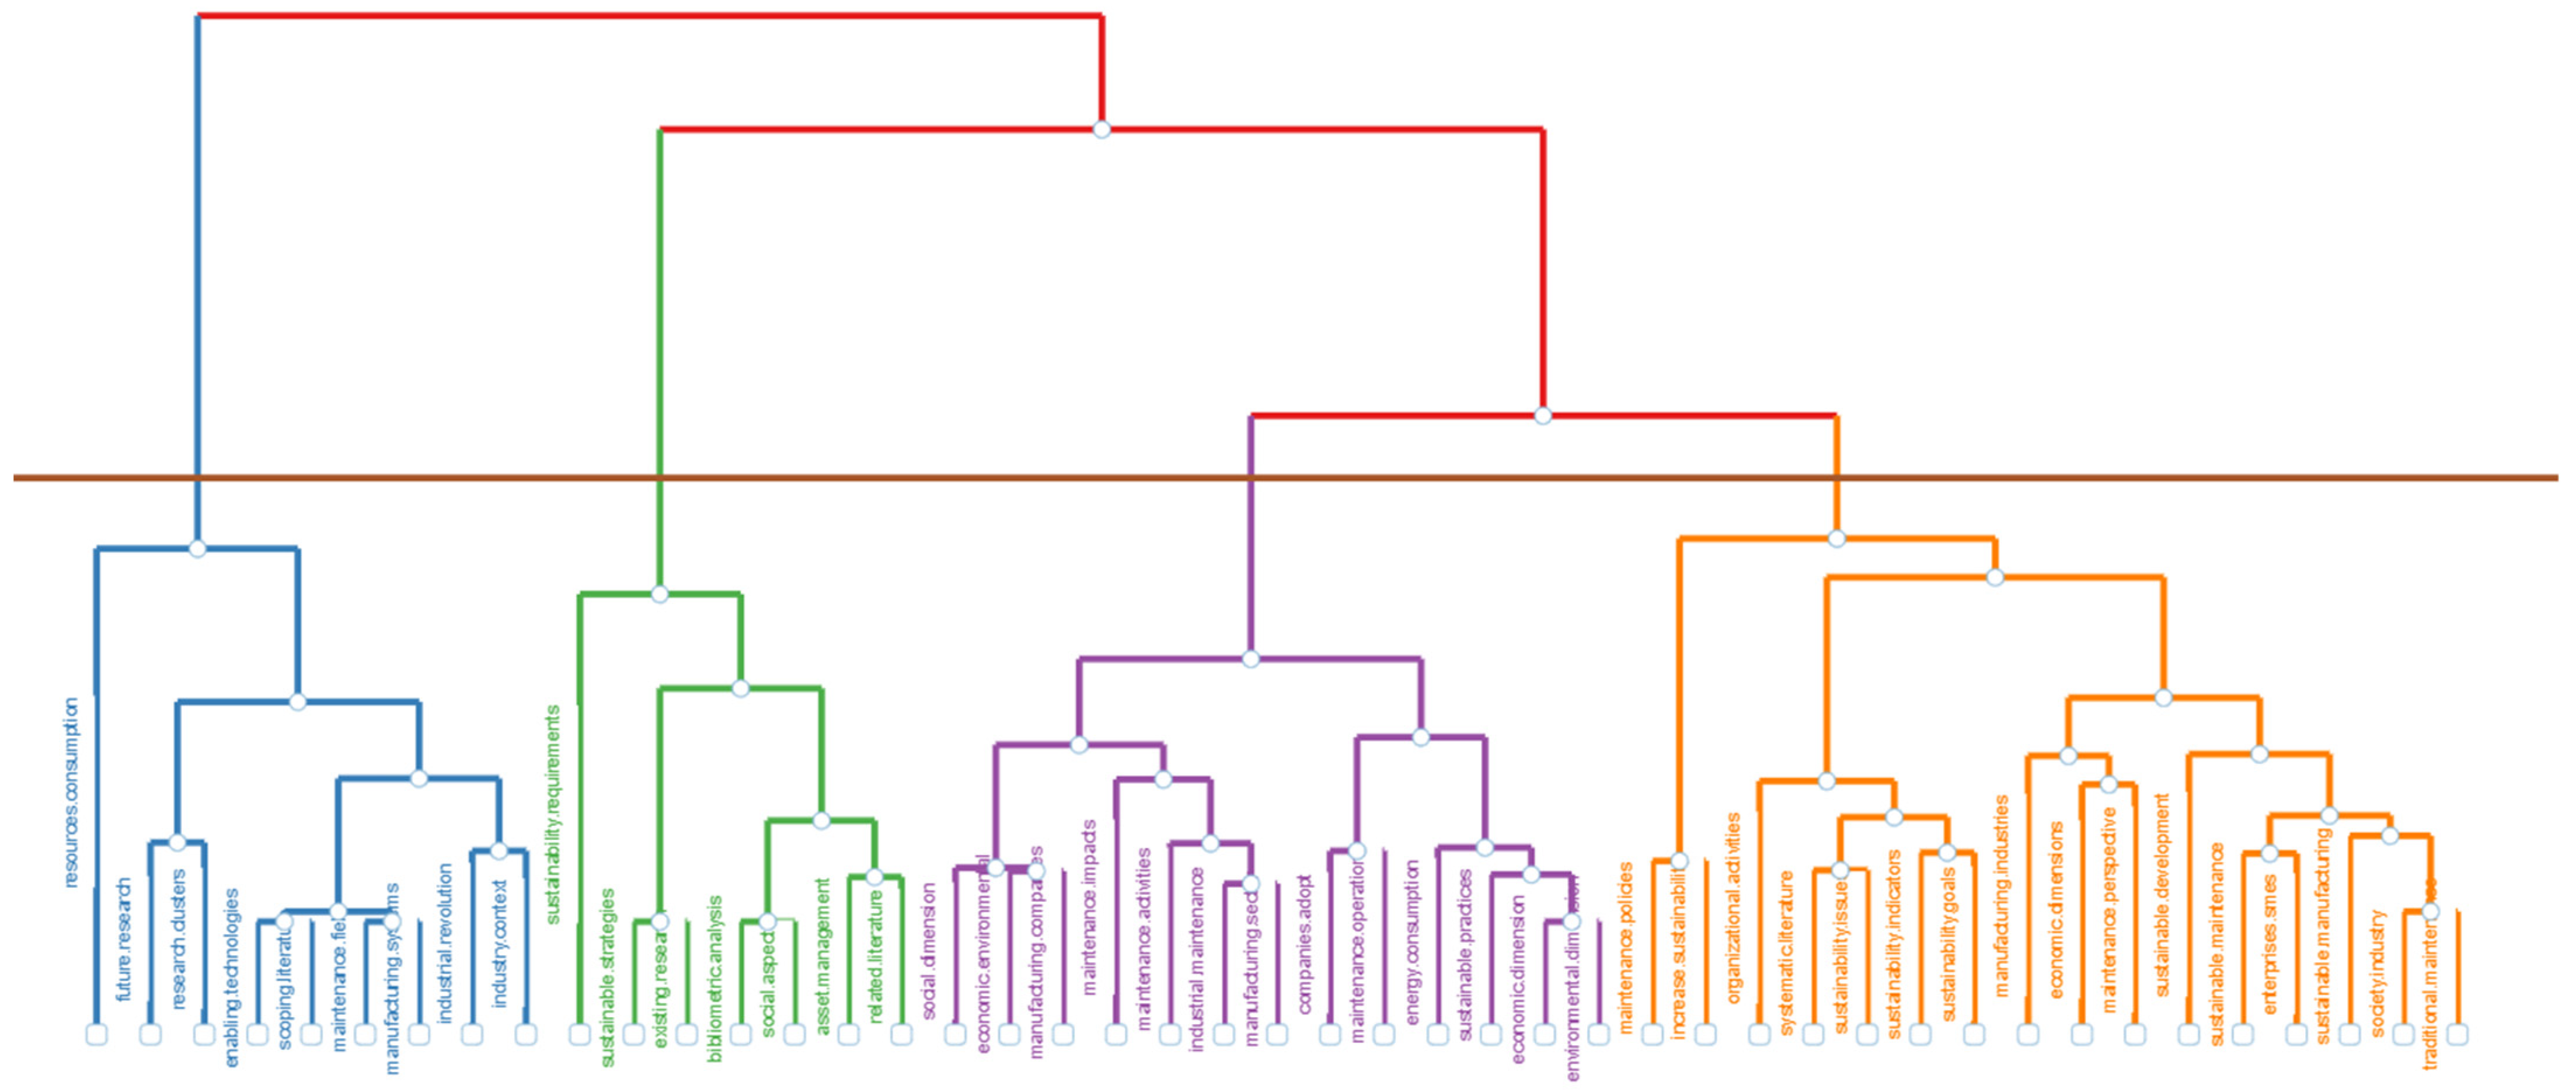
Figure 14). The MCA cluster (blue cluster in Figure 15) depicting the work [47], can be considered the first one questioning the role of maintenance in sustainable manufacturing with a particular focus on I4.0 and associated enabling technologies. More so, the study provoked many scientists, outside of maintenance domain, to engage into debates regarding the importance of sustainable maintenance performance indicators (SMPIs) considering their role in minimizing the environmental and economic impact, and social impact considering the improvement of companies image. Although engaging in SMPIs are attractive by manufacturing and service companies, the role of enabling technologies (e.g., big data, augmented reality) in the adoption of SM performance metrics were still unexplored.
Later work by de Campos and Simon [53] pointed out that lack of knowledge of the subject matter acts as a barrier and a challenge for the implementation of SM practices. Hence, they provided an understanding of how exactly sustainability concepts are being inserted into maintenance strategies by separately examining sustainability, maintenance strategies and sustainable maintenance. The emphasis was placed on the benefits both internally and externally for companies willing to adopt SM practices. Next, from their analysis of 24 selected articles, costs associated with environmental and economic indicators were the most discussed ones. Most importantly, they managed to identify the lack of methods that use technologies (e.g., big data, IoT, CPS) for collecting and storing data regarding the environmental and social impacts.
Lastly, the literature review performed by Santos, A. et al. [54] identified the research gaps of maintenance policies within the context of reuse and remanufacturing. Contrary to the previous similar research by Acerbi, F. et al. [20], the analysis of 53 papers identified a lack of models dealing with EoL processes, lack of case studies on reuse and remanufacturing, lack of established frameworks characterising environmental and social costs, and a lack of multicriteria maintenance decision-making methods for alternative business strategies. What is more interesting is that in terms of sustainability impacts considering TBL indicators—economic, environmental and social, the environmental dimension was rarely addressed within this context, while the social dimension was not addressed at all. This was also in contrast with other systematic reviews on the topic of SM, albeit not specifically narrowed to the reuse and remanufacturing strategies.

4.3. Sustainable Maintenance Criteria Synthesised from Reviews

The umbrella review enabled us to extract factors that previous SM reviews highlighted. However, the extent to which these factors were addressed in the literature was quite limited. Most of the existing reviews were concerned with sustainable indicators, which is contradictory to the fact that relatively few or no primary studies have been performed in the exploratory sense to test whether such indicators can be considered applicable performance metrics. Not for these reasons alone but also for gaining insights into the challenges and barriers that SM is facing, we extract an extensive number of sustainability factors (environmental, social and economic) in addition to technical and technological factors. Such insights were discussed, and several inferences were made for enabling the transition from traditional industrial maintenance towards sustainable maintenance practices.
The list comprised 87 criteria, where some were overlapping with others or addressed under different semantics. Even so, in cases of disagreement, the factors were merged for reaching a consensus between the authors. The final list comprised 43 criteria. It should be noted that the identified factors are not to be used as indicators, but are rather items identified in the literature as potential research gaps, concerns and/or challenges that prevent or impede the adoption of SM practices. Although the list is extensive, we briefly discuss them in the following. The majority identified environmental pollution [47,53,58,59], energy consumption [47,58,59,60], non-renewable consumption [5,53,58,60], maintenance costs [5,58,59], energy consumption costs [5,53,59], and health and safety of workers [19,47,49,53,58] as major concerns addressed in the existing reviews. From the technical standpoint, the RAM factors [58,59], productivity [58,59] and product quality [57,58] were the factors mostly considered. Finally, technological factors were the factors addressed the least within the domain of SM research. Specifically, data management and data analytics [19] were mostly discussed, followed by information management, data integration and knowledge management [19,51].

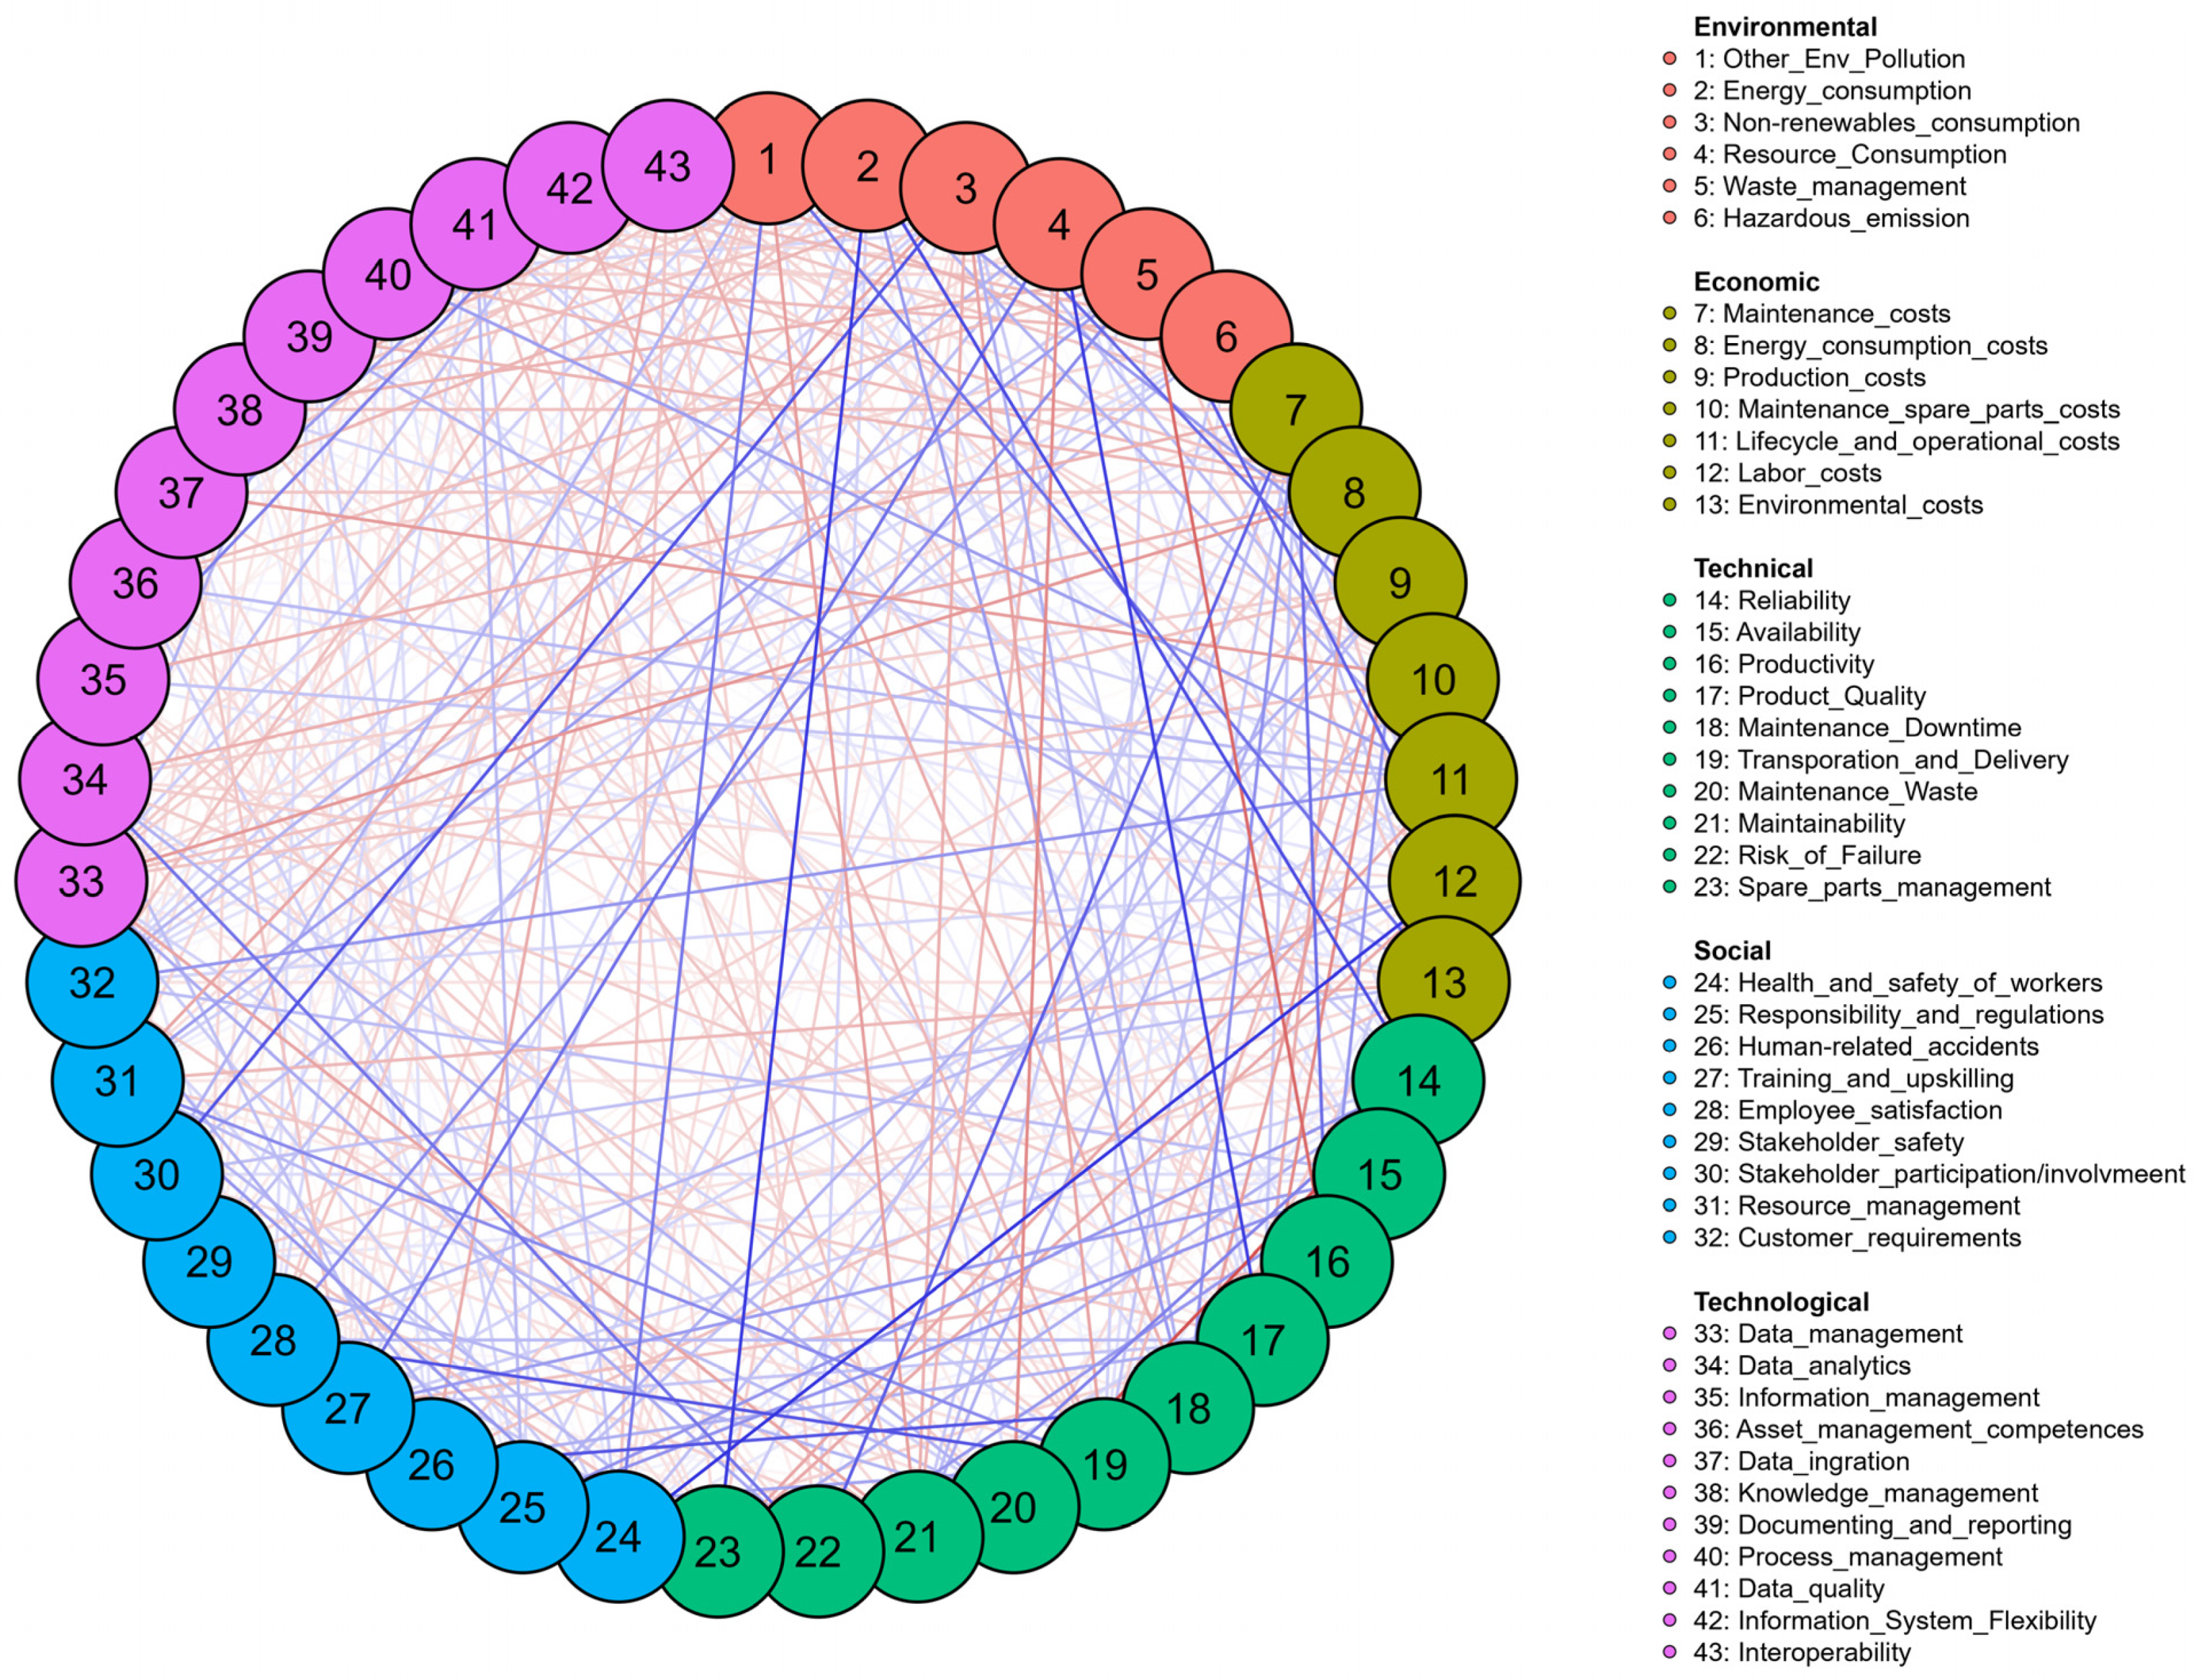
4.4. Bayesian Network Analysis

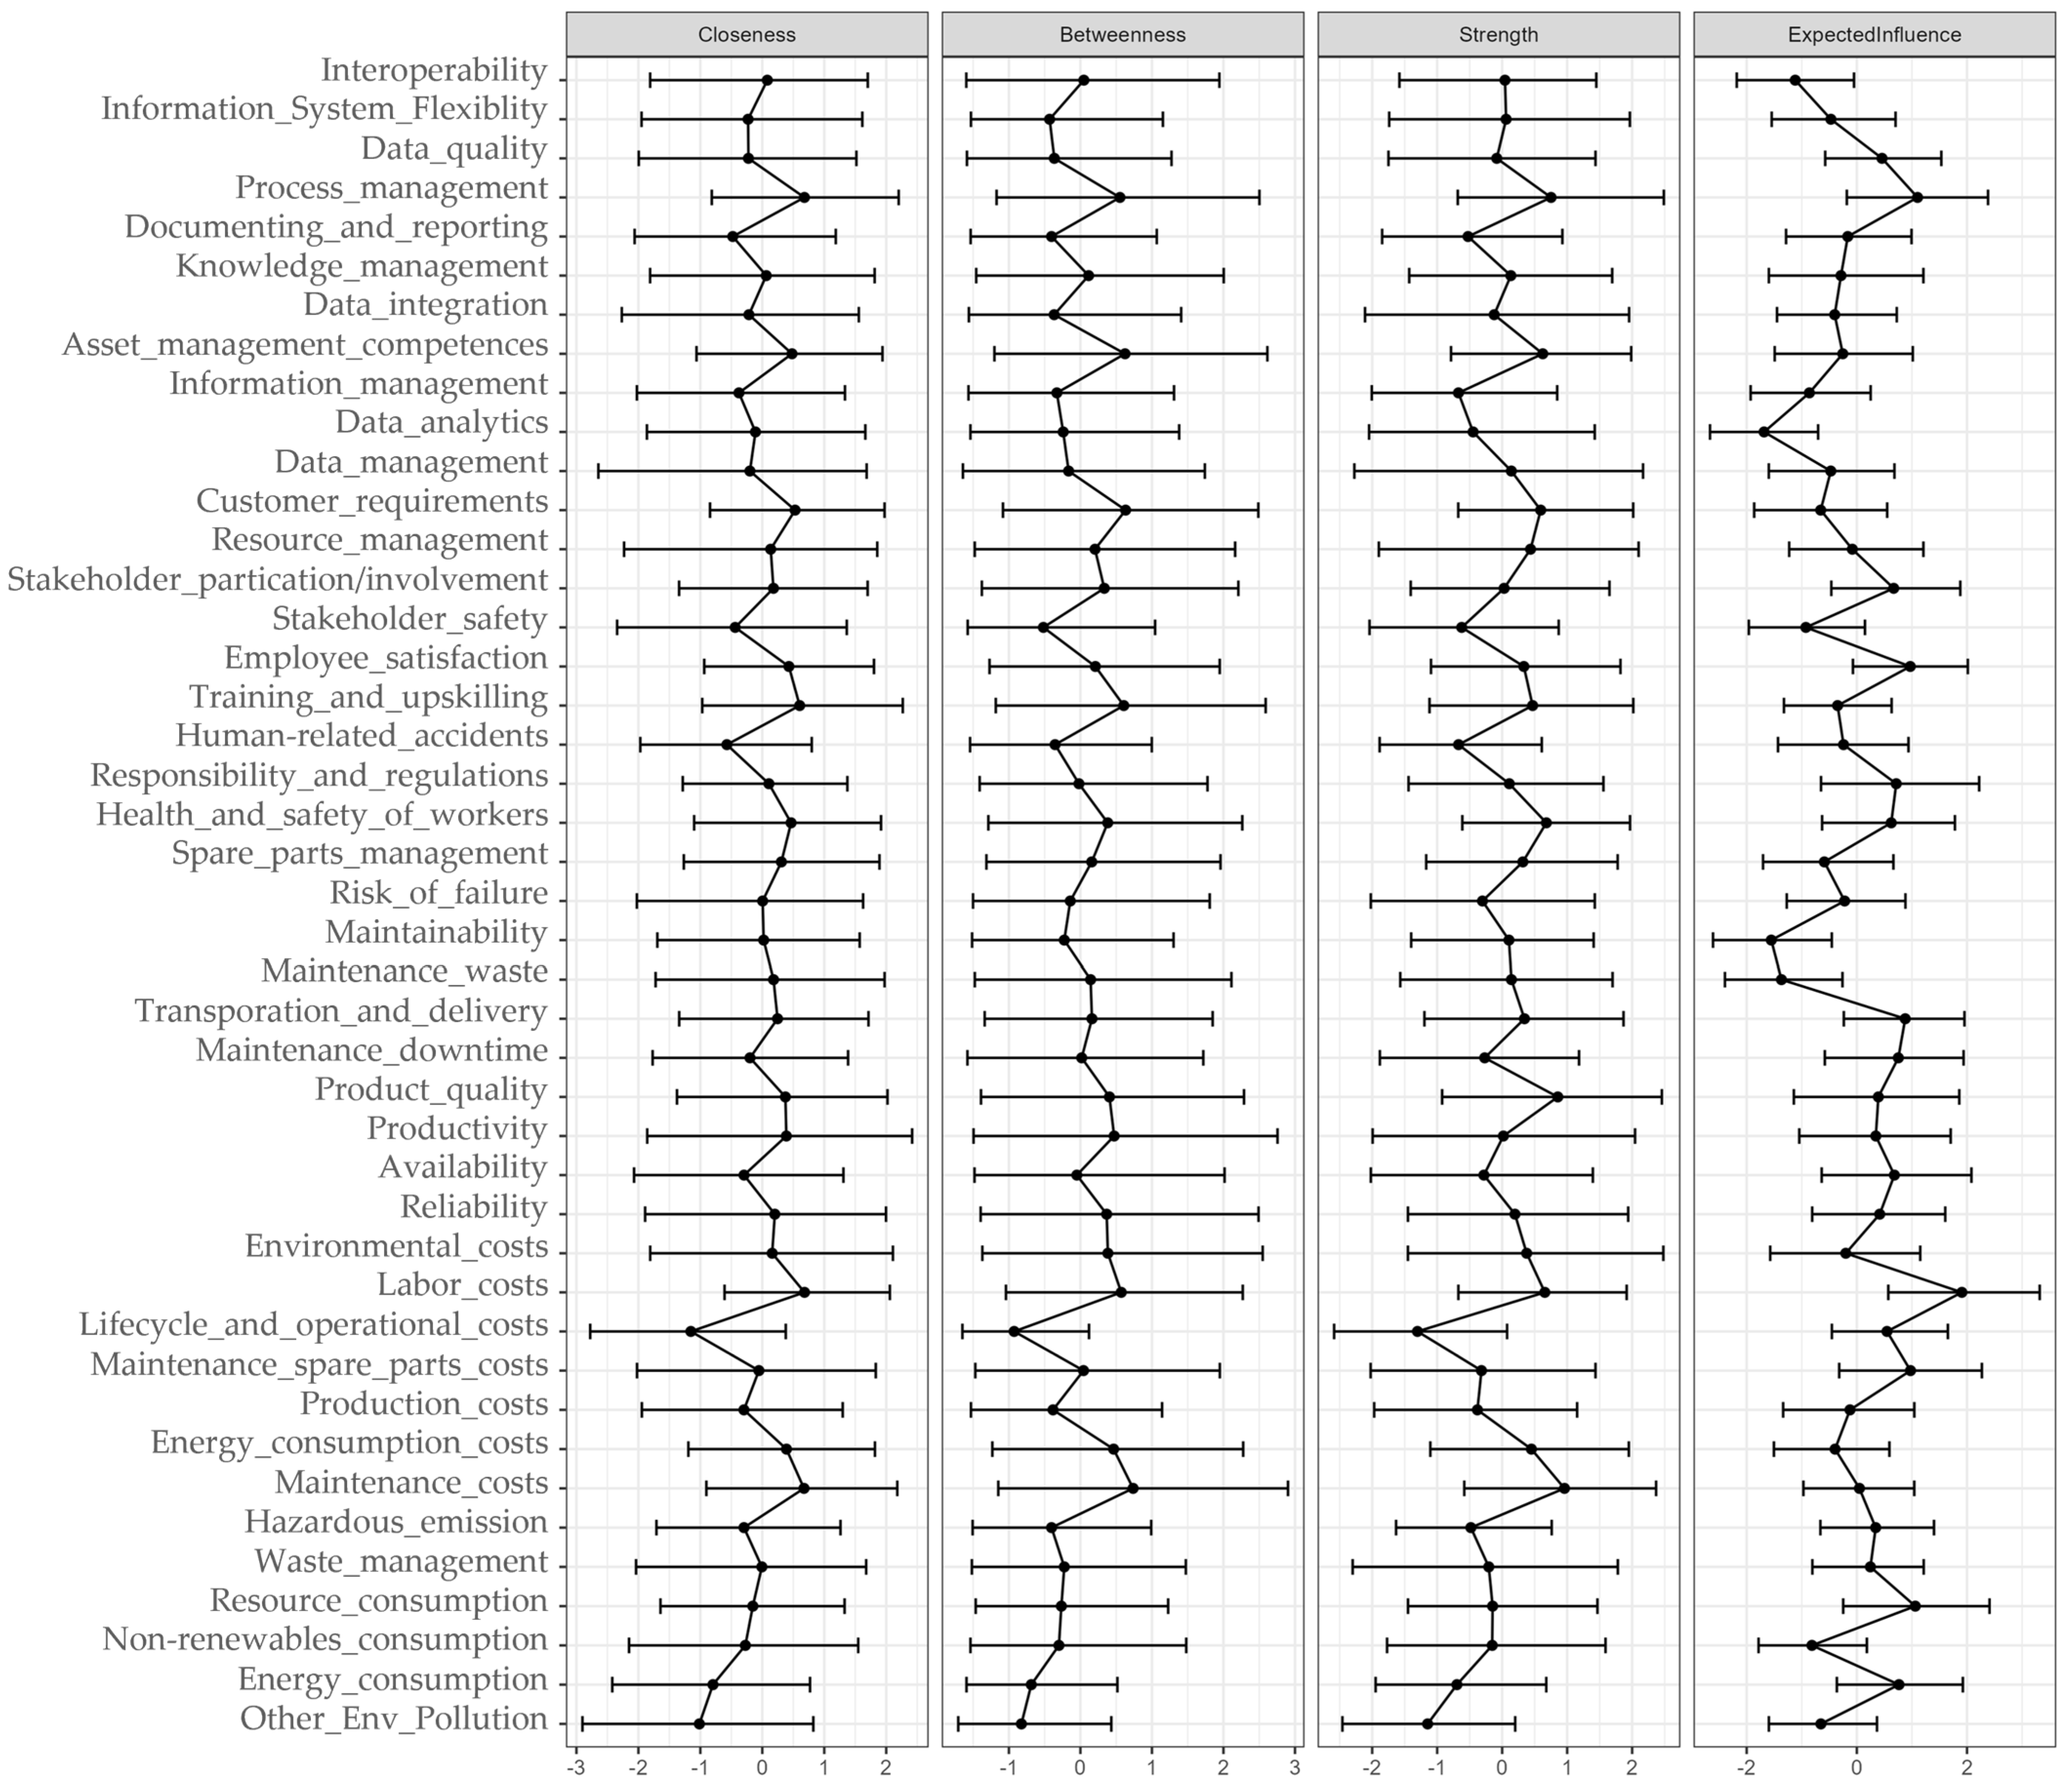
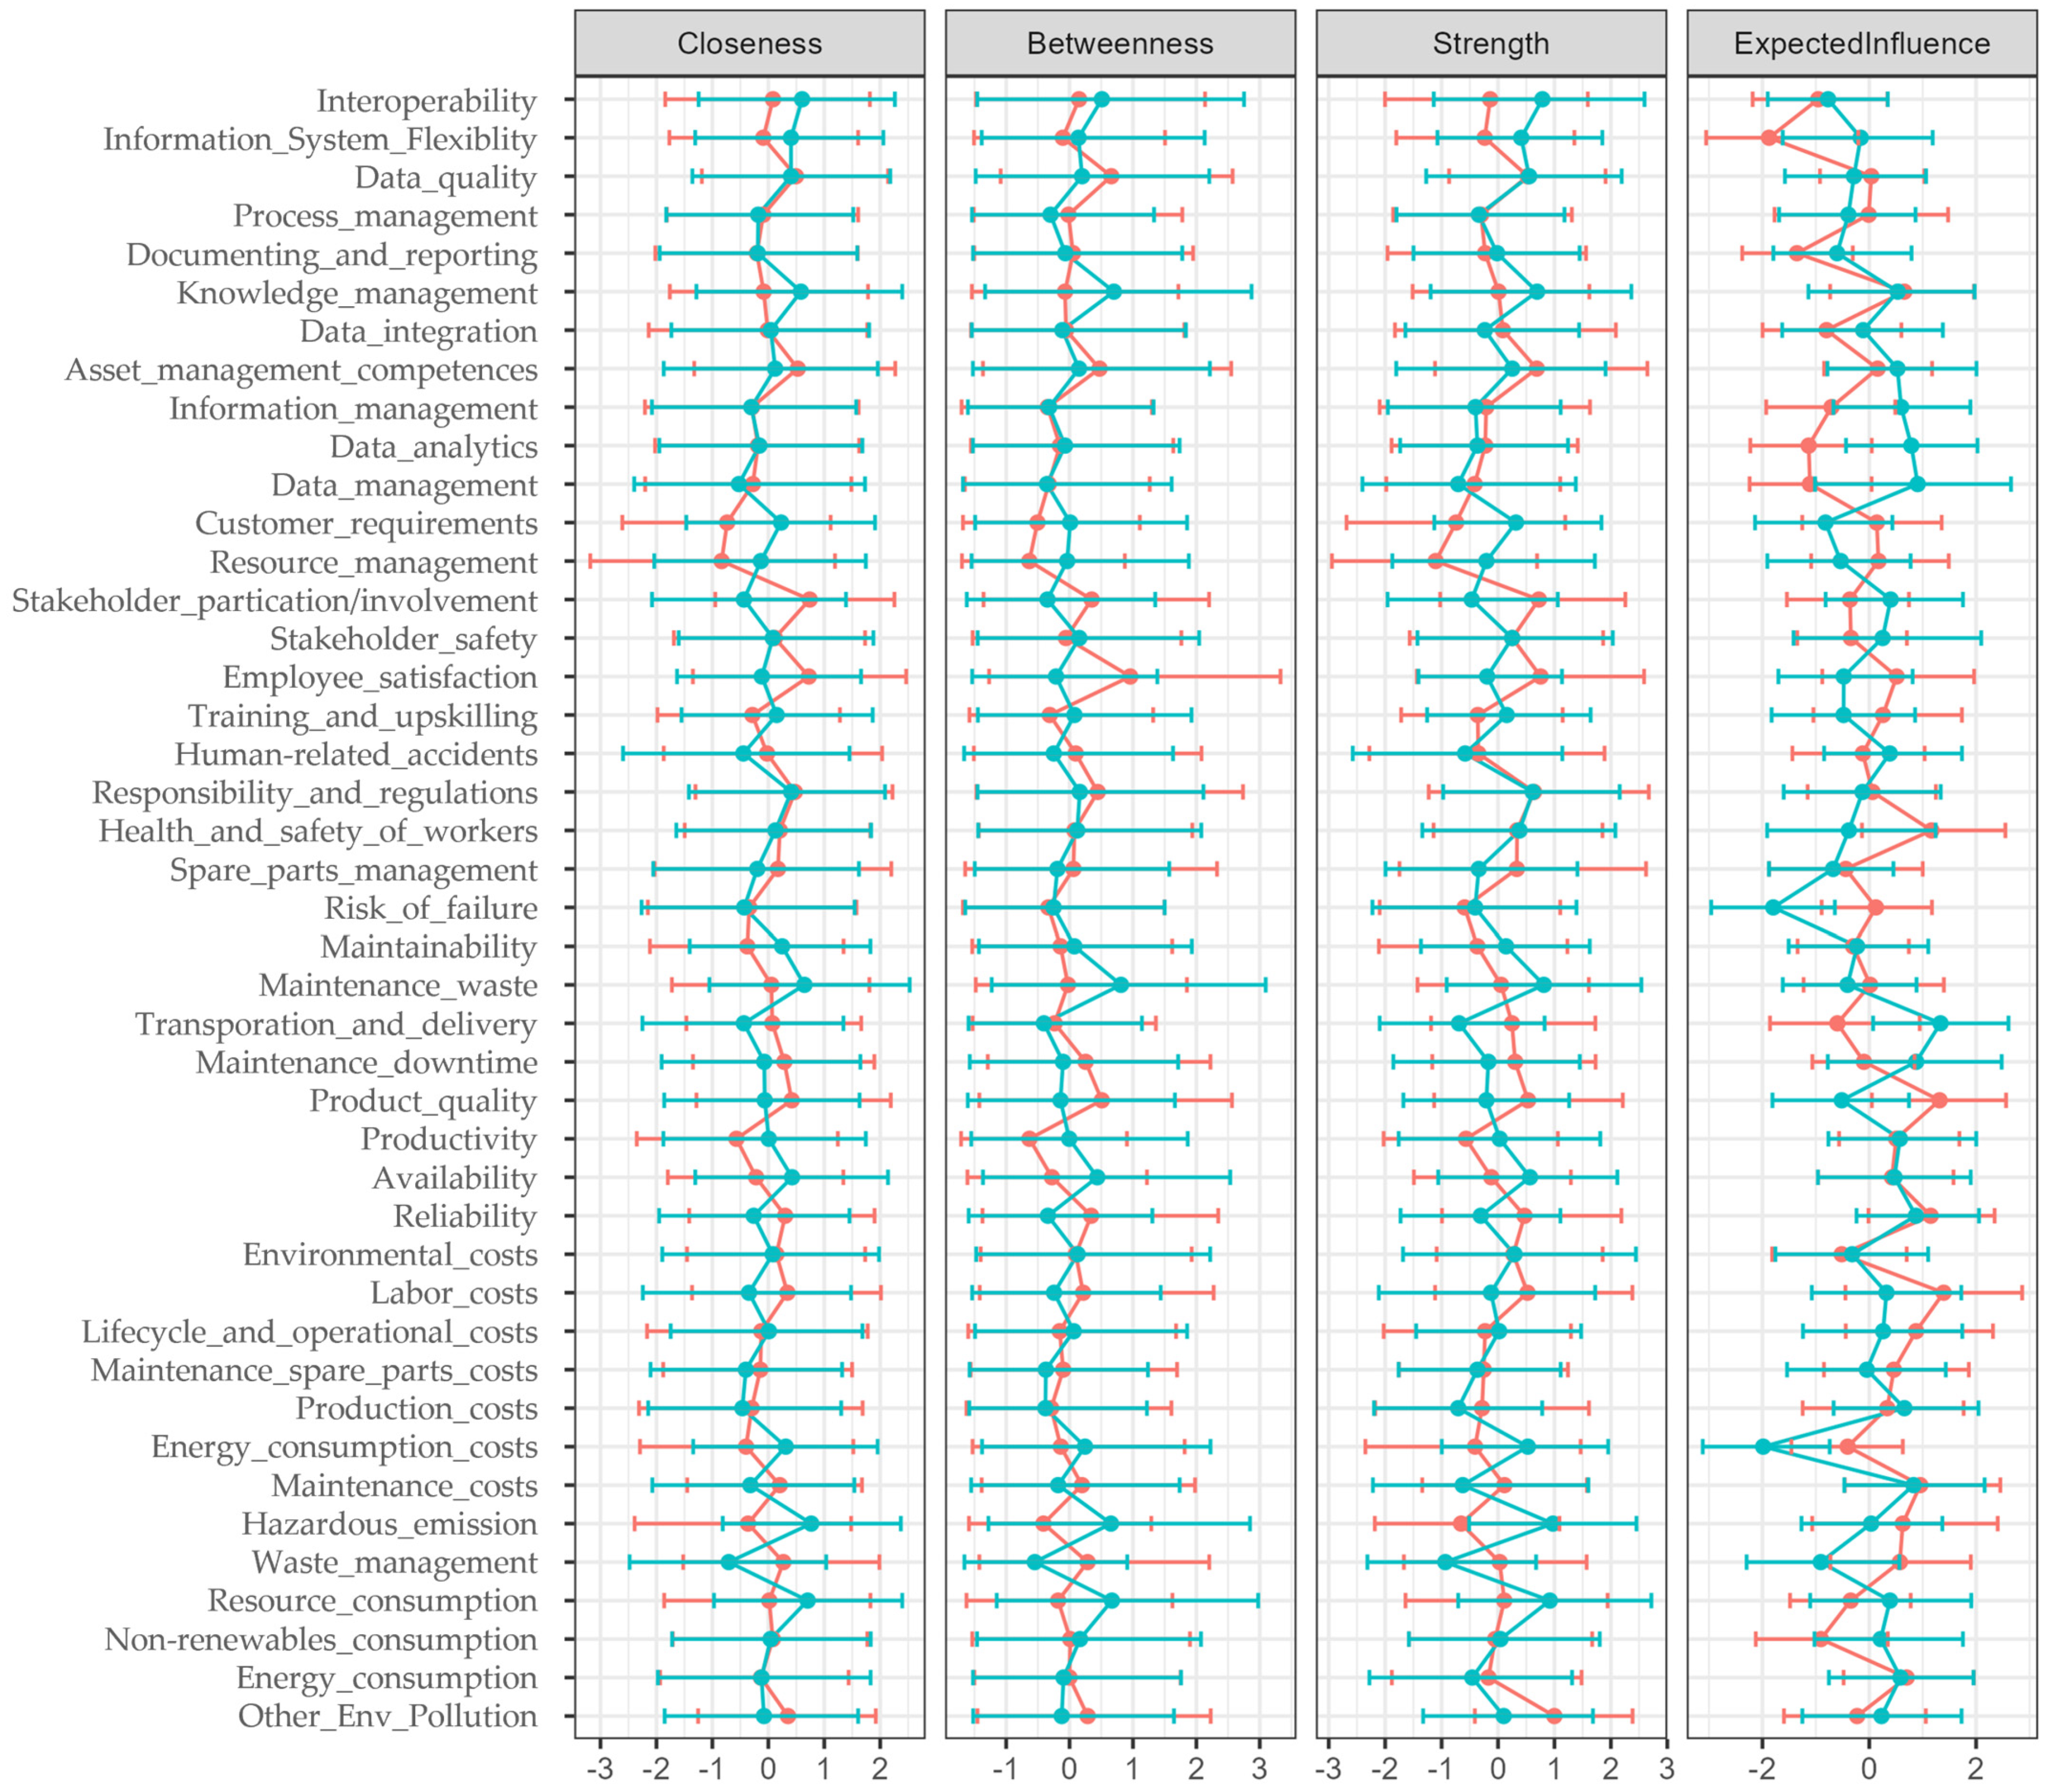
From the BNA-GCGM, including both overall and split samples, the interpretation of the results was made solely on centrality indices of nodes (variables). Namely, the spring (with repulsion) is not used but rather a circle network structure to check the association between different items in the network, i.e., to see the body of knowledge on the criteria researched within the literature. The betweenness centrality measures the extent to which a node lies in the path between other nodes that can actually represent influence in facilitating the communication or interaction between different parts of the network, which in this case was hard to interpret due to the network structure. Also, the closeness centrality shows how close a node is to the other nodes in the network for disseminating information; this also did not provide much information since the circular network structure was used. However, the strength centrality did provide valuable information since it is a measure of total weight of edges connected to a node. Finally, an expected influence centrality is a bit more complex and specific to a network because it indicates the expected, i.e., average influence a node has on the other nodes in the network. A node having a high expected influence centrality suggests that it has a significant impact on the state of the network or other nodes in the network, which in this case was used for discussion but elaborated with caution since BNA-GCGM interpretation is limited in the literature.
In the context of the analysis, the interpretation of the strength centrality refers to how prominently and frequently the specific criterion appears or is discussed across the reviews. A high strength centrality indicates a major concern or focus, ultimately indicating the importance of a particular criterion in the collective landscape. The expected influence centrality can be interpreted as the degree to which a particular criterion (node) influences the conclusion drawn from an overall UR. Unlike strength centrality, it takes the directionality (i.e., edge weight negative or positive) into account. A high influence score suggests that this criterion (node) potentially shapes the research outcome, i.e., acts as a driver or determinant for another criterion being investigated.
Considering the strength centrality, it is common that strength is a non-negative metric, considering that it represents the absolute sum of the edge weights connected to a node. Therefore, the results obtained from JASP were unusual. One of the underlying reasons why some centrality indices of nodes have a high negative strength is presumably due to a negative partial correlation matrix and the fact that weights are summed without considering the absolute values. Within such context, the extract weighted the sum of the three most positive and negative nodes. The highest negative strength centralities were lifecycle_and_operational_costs (−1.303), other_env_pollution (−1.147), energy_consumption (−0.696), information_management (−0.672), and human-related_accidents (−0.670). The highest positive strength centralities were maintenance_costs (0.959), product_quality (0.856), process_management (0.752), health_and_safety_of_workers (0.680), and labor_costs (0.656). The negative strength centrality indicates that in cases where these variables are discussed and emphasised, there is a higher probability that other factors are less likely to be included.
The least influential nodes in the network were data_analytics (−1.684), maintainability (−1.553), maintenance_waste (−1.369), interoperability (−1.118), and stakeholder_safety (−0.925). This, in turn, suggested that variation and changes in these nodes did not affect other nodes or the structure of the network. Moreover, the theoretical probability was that if a review discusses these nodes, the changes in other criteria (nodes) are significantly small. This adds to the fact that even if the criteria is discussed throughout reviews, it will not increase the probability that other criteria (nodes) will appear or elevate the score of other nodes in the network.
The most influential nodes were labor_costs (1.907), process_management (1.102), resource_consumption (1.061), maintenance_spare_parts_costs (0.974), employee_satisfaction (0.970), transportation_and_delivery (0.878), and energy_consumption (0.765). This suggested that changes in these nodes would affect changes in other nodes and the network’s overall behavior. Drawing preliminary conclusions, we inferred that if influential nodes (e.g., labor_costs, energy_consumption) are discussed within a literature review, a rise in the levels of other nodes can theoretically be expected. Consequently, this suggests that within the current body of knowledge, these criteria potentially increase the probability of elevating other nodes, i.e., increase the probability of including other nodes in the analysis. This in turn suggests that existing studies are still dealing with economic criteria (e.g., labour costs, maintenance costs) and there is still not enough research space of considering less influential nodes of environmental (e.g., energy consumption, resource consumption) and social criteria (e.g., employee satisfaction). Thus, this leads to conclusion that solution space for incorporating and addressing issues of less discussed criteria can only be researched and advanced by companies where contextual and industrial settings are of higher standards. This also suggests that most of existing maintenance functions are still profit-oriented, thus strugling with availability and fincial concerns.
After splitting the data into Pre_2021 and Post_2021 for BNA, the obtained results suggested the following. Prior to 2021, the BNA indicates that the most influential nodes (Appendix C, Table A8) were Transporation_and_Delivery (1.333), Data_management (0.9060), Maintenance_Downtime (0.8780), Reliability (0.873), Maintenance_costs (0.828), Data_analytics (0.787), and Production_costs (0.657), suggesting that changes in these nodes would lead to elevated levels in other nodes. Consequently, this suggested that the top influential nodes were mostly economic and technical (or organisational), which paints the picture that reviews up to 2021 were mostly dedicated to profit-oriented decision-making. This is supported by least influential nodes, such as energy_consumption_costs, resource_management, training_and_upskilling, and health_and_safety_of_workers, among others, which suggests that primary evidence and studies assessing these criteria were limited at the time. The post-2021 BNA show that the most impactful nodes were Labor_costs (1.392), Product_Quality (1.316), Health_and_safety_of_workers (1.164), Reliability (1.149), Maintenance_costs (0.954), Lifecycle_and_operational_costs (0.954), Energy_consumption (0.700), and Knowledge_management (0.656), among others (Appendix C, Table A9). This, in turn, suggests that although techno-economic factors are still a major concern for maintenance decision-making, the social (e.g., health and safety of workers), environmental (e.g., energy consumption), and even socio-technological (e.g., knowledge management) factors are becoming the mainstream in SM, but as suggested mostly on theoretical basis.
In sum, the findings suggests that sustainable maintenance research is no longer relying solely on individual dimension (e.g., economic, environmental), but rather has evolved into interdisciplinary research concerned with the economic impacts of environmental and social dimensions. Although environmental and social aspects may be considered separately, most of the findings still lack practical and empirical evidence. It seems tht SM scientists are still struggling to attract fundings, and as a consquence, started engaging in transforming the social and environmental impacts into monetary value, as a way to present the economic downsides of not considering these dimensions.

5. Conclusions

5.1. Concluding Remarks

The discourse and thematic analyses on the topic of SM using bibliometric data underscore the evolution and growth of sustainable maintenance as a research trend. The growth in publications, primarily driven by environmental initiatives, suggests a paradigm shift within traditional industrial maintenance to practices oriented toward sustainable development. This transition has been accompanied by the wide adoption of sustainability performance metrics and criteria, emphasising the importance and interdisciplinary benefits of sustainable maintenance practice.
Moreover, our findings revealed annual growth in SM reviews, suggesting an increased interest in addressing these challenges. However, the rise is juxtaposed by a lack of substantial evidence needed from empirical and practical studies validated within industrial settings. The limitations and potential bias in methodologies and a lack of quality assessment tools also raise concerns regarding the validity and reproducibility of certain reviews. This implies that the acquired findings should be regarded cautiously.
From the thematic mapping and MCA, the results show the need to transition from theoretical debates to practical considerations, as well as considering technological aspects within SM practice for data-driven reasoning. Although recent work has concentrated on challenges, barriers, and performance metrics, there was no general agreement about the research agenda for SM. Also, the significance of digitalisation and the utilisation of enabling technologies, including big data and augmented reality, in encouraging the widespread adoption of SM practice is progressively (un)recognised. From our results, we hypothesise that the lack of technological and data-driven aspects has slowed the adoption of and transition to SM, which we aim to assess in following exploratory studies.
Finally, from our Bayesian network analysis, several key insights can be drawn. The analysis, stratified into pre- and post-2021 periods, revealed evolving patterns and priorities of SM research. Notably, strength and expected influence centralities were instrumental in identifying the criteria that dominate the network structure. These indices revealed a clear shift from economic and technical concerns (pre-2021) to a more balanced consideration of environmental and social concerns in the post-2021 era. Consequently, we speculate that the obtained findings highlight the growing need for implementing sustainability dimensions in MDM and call for more research on cost–benefit analysis considering environmental and social impacts.

5.2. Limitations and Implications of the Study

There are several limitations identified throughout the study. Namely, the reliance on existing reviews may introduce bias, given that a substantial portion lacks explicit protocols. The validity and generalisability of our conclusions might be affected by these methodological constraints. The findings underscore the importance of adopting explicit protocols and quality assessment tools in future reviews to enhance the reliability and reproducibility of research. Furthermore, the absence of primary studies within certain thematic areas limits the depth of our insights, suggesting that overall findings from previous reviews are grounded on a theoretical basis. The need to justify the implementation of sustainable maintenance practices may be significantly complicated by this.
Given both the findings and limitations of the study, our research offers several implications. It highlights the need for more rigorous, primary research within the domain of sustainable maintenance, particularly studies conducted within industrial settings. Next, the findings are expected to guide future studies toward addressing gaps and identifying diverse sustainability dimensions, especially human (social) aspects in the upcoming Industrial “5th Wave”, i.e., Industry 5.0. Finally, the lack of integration and research associated with digital technologies suggests a slow transition towards sustainable maintenance decision-making.

5.3. Future Research Directions

Firstly, future research efforts will be dedicated to exploring the effects of sustainability-oriented activities within sustainable maintenance. This will add depth and align existing needs with explicit and data-driven maintenance studies to justify the need for transitioning to sustainable maintenance decision-making. Secondly, from the ongoing analysis, we identified several studies that were excluded since they were mixed-method type reviews, and we have decided that our following publication will include these types of studies and test whether differences exist. Finally, given the evolving nature of Industry 5.0, where focus is placed on the co-operation between the physical world—intelligent devices, systems, and automation—and human intelligence [61], we will consider conducting an exploratory psychometric study using structural equation modelling to allocate latent factors affecting the adoption of and transition towards “Maintenance 5.0”.

Supplementary Materials

The following supporting information can be downloaded at: https://www.mdpi.com/article/10.3390/su16020767/s1, The reference PRIOR checklist is available in supplementary files.

Author Contributions

Conceptualization, M.O. and S.V.; methodology, M.O., S.V. and K.R.; investigation, S.V., M.O., N.B., V.V. and K.R.; data curation, K.R., V.V., S.V., M.O. and N.B.; writing—original draft preparation, S.V. and M.O.; writing—review and editing, M.O., V.V., N.B. and S.V.; visualization, M.O.; supervision, M.O. and N.B. All authors have read and agreed to the published version of the manuscript.

Funding

This research received no external funding.

Institutional Review Board Statement

Not applicable.

Informed Consent Statement

Not applicable.

Data Availability Statement

Data is contained within the article.

Conflicts of Interest

The authors declare no conflicts of interest.

Appendix A. Source Meta-Data Descriptive Analysis

Table A1. Description of articles’ meta-data used for bibliometric analysis.
AcronymItemMissingMissing%
ABAbstract00.00
C1Affiliation00.00
AUAuthor00.00
CRTotal Citation00.00
RPCorresponding Author00.00
DTDocument Type00.00
SOJournal00.00
DEKeywords00.00
LALanguage00.00
NRNumber of Cited References00.00
PYPublication Year00.00
TITitle00.00
TCCited References15.00
DIDOI210.00
WCScience Categories315.00
IDKeywords Plus420.00
Table A2. Annual citations per year and article analysis.
YearnMean Total Citations Per ArticleMean Total Citations Per YearCitable Years
2015170.789
201817011.676
20191122.45
2020525.46.354
2021215.55.173
202257.83.92
202353.63.61
Table A3. Description of sources and articles.
DescriptionResults
Timespan2015:2023
Sources (Journals, Books, etc.)16
Documents20
Annual Growth Rate %22.28
Document Average Age2.05
Average Citations per Doc15.2
References1476
Keywords Plus (ID)102
Author’s Keywords (DE)69
Authors73
Authors of Single-authored Docs1
Single-authored Docs2
Co-Authors per Doc3.65
International Co-authorships %30
Table A4. Description of sources.
Source TitleArticles
IFAC PapersOnLine2
Journal of Cleaner Production2
Reliability Engineering & System Safety2
Sustainability2
Advances in Production Management System1
Conference on Production Systems and Logistics (CPSL)1
Digital Business1
Independent Journal of Management & Production1
International Conference on Control, Automation and Diagnosis (ICCAD)1
International Journal of Strategic Engineering Asset Management1
International Journal of Supply Chain Management (IJSCM)1
International Manufacturing Science and Engineering Conference1
Journal of Manufacturing Systems1
Journal of Quality in Maintenance Engineering1

Appendix B. Thematic Mapping and Conceptual Analysis

Table A5. Thematic evolution using abstract words (unigrams).
FromToWordsWII *IC *O *SI *
maintenance 2015–2019manufacturing 2020–2020paper; safety0.100.0520.03
maintenance 2015–2019sustainability 2020–2020maintenance; sustainable; sustainability; industrial; literature; review; focus0.400.0530.02
performance 2015–2019development 2020–2020economic0.140.1420.06
performance 2015–2019manufacturing 2020–2020performance0.140.1420.04
performance 2015–2019sustainability 2020–2020social; activities; systematic0.430.1420.03
development 2020–2020production 2021–2022development; economic; environmental; dimensions; implementation0.500.1020.02
manufacturing 2020–2020maintenance 2021–2022manufacturing; indicators; framework; industries0.210.0530.02
manufacturing 2020–2020production 2021–2022production; study; performance; identified; paper0.260.0520.02
manufacturing 2020–2020review 2021–2022conducted0.050.0520.02
sustainability 2020–2020maintenance 2021–2022maintenance; sustainability; sustainable; perspective; industrial; research; literature; activities; considered0.420.0440.02
sustainability 2020–2020production 2021–2022companies; social; focus0.120.0430.02
sustainability 2020–2020review 2021–2022review; systematic0.130.0440.02
maintenance 2021–2022maintenance 2023–2023maintenance; sustainability; sustainable; research; impact; literature; framework; analysis; based; insights; provide0.400.0470.01
maintenance 2021–2022papers 2023–2023industry; manufacturing; perspective0.170.0650.02
production 2021–2022maintenance 2023–2023paper; social; dimensions; economic; environmental; future; studies0.180.0350.01
production 2021–2022papers 2023–2023implementation; increasing0.110.0620.02
review 2021–2022maintenance 2023–2023review; conducted; systematic; purpose0.190.0440.01
* Note: WII = Weighted Inclusion Index. IC = Inclusion Index. O = Occurrences. SI = Stability Index.
Table A6. MCA clustering matrices by first two components with respect to reviews.
ReviewC1C2ContribTCCL
Franciosi, C. et al., 2018. [47]1.080.6258.75704
Franciosi, S. et al., 2020. [48]−0.18−0.22.9631
Jasiulewicz−Kaczmarek, M. et al., 2020. [26]0.080.273.37441
Vrignat, P. et al., 2022. [62]0.130.141.53301
Karki, B. R. et al., 2021. [50]−0.04−0.222.1261
de Campos, R.S. et al., 2019. [53]−0.860.5438.77122
Saihi, A. et al., 2023. [59]0.11−0.110.98111
Hami, N. et al., 2020. [60]−0.380.39.1691
Hanski, J. et al., 2020. [19]0.01−0.417.3481
Pires, S. et al., 2015. [51]−0.14−0.161.7971
Olugu, E. et al., 2022. [49]0.12−0.020.571
Orošnjak, M. et al., 2021. [5]−0.330.074.1451
Santos, A. C. D. et al., 2023. [54]0.15−0.8230.2543
Acerbi, F. et al., 2020. [20]0.03−0.5714.431
Psarommatis, F. et al., 2023. [22]0.390.136.3131
Franciosi, C. et al., 2022. [63]−0.440.218.9311
Bredebach, C., 2022. [58]0.380.145.8911
Bredebach, C., 2023. [57]−0.160.182.4101
Hallioui, A. et al., 2023. [64]0.04−0.10.4901

Appendix C. Bayesian Network Analysis Results

Table A7. Centrality indices of variables in overall BNA-GCGM network.
VariableBetweennessClosenessStrengthExpected Influence
Labor_costs0.57100.68100.65601.9070
Process_management0.55200.68000.75201.1020
Resource_Consumption−0.2660−0.1530−0.14701.0610
Maintenance_spare_parts_costs0.0430−0.0550−0.31900.9740
Employee_satisfaction0.20900.42900.33400.9700
Transporation_and_Delivery0.16100.24600.34300.8780
Energy_consumption−0.6870−0.7960−0.69600.7650
Maintenance_Downtime0.0180−0.1980−0.26800.7530
Responsibility_and_regulations−0.02000.10700.11000.7150
Availability−0.0500−0.2950−0.28100.6810
Stakeholder_participation/involvmeent0.33300.18000.03000.6690
Health_and_safety_of_workers0.38200.46500.68000.6250
Lifecycle_and_operational_costs−0.9260−1.1530−1.30300.5470
Data_quality−0.3650−0.2240−0.08300.4570
Reliability0.36700.20200.19700.4150
Product_Quality0.40600.37300.85600.3910
Productivity0.47200.38800.01900.3450
Hazardous_emission−0.4040−0.2960−0.48100.3420
Waste_management−0.2250−0.0070−0.20600.2460
Maintenance_costs0.73600.67300.95900.0470
Resource_management0.20400.13500.4370−0.0820
Production_costs−0.3830−0.2970−0.3810−0.1240
Documenting_and_reporting−0.4040−0.4770−0.5250−0.1650
Environmental_costs0.38400.16000.3770−0.2010
Risk_of_Failure−0.14200.0050−0.3030−0.2220
Human-related_accidents−0.3540−0.5720−0.6700−0.2410
Asset_management_competences0.62400.47900.6250−0.2550
Knowledge_management0.11400.06400.1330−0.2880
Training_and_upskilling0.60600.60300.4680−0.3490
Energy_consumption_costs0.46400.39000.4500−0.3950
Data_ingration−0.3670−0.2160−0.1230−0.4020
Information_System_Flexibility−0.4310−0.23000.0610−0.4710
Data_management−0.1650−0.20000.1410−0.4730
Spare_parts_management0.15800.30800.3180−0.5900
Other_Env_Pollution−0.8250−1.0150−1.1470−0.6520
Customer_requirements0.63200.52900.5930−0.6560
Non-renewables_consumption−0.3000−0.2740−0.1530−0.8150
Information_management−0.3290−0.3770−0.6720−0.8610
Stakeholder_safety−0.5180−0.4370−0.6230−0.9250
Interoperability0.04800.08100.0430−1.1180
Maintenance_Waste0.14200.18100.1430−1.3690
Maintainability−0.22600.02200.1040−1.5530
Data_analytics−0.2410−0.1100−0.4470−1.6840
Table A8. Centrality indices of variables in Prior_2021 BNA-GCGM network.
VariableBetweennessClosenessStrengthExpected Influence
Transporation_and_Delivery−0.4050−0.4370−0.69001.3330
Data_management−0.3560−0.5260−0.70500.9060
Maintenance_Downtime−0.1030−0.0730−0.17200.8780
Reliability−0.3420−0.2610−0.30600.8730
Maintenance_costs−0.1800−0.3210−0.62600.8280
Data_analytics−0.0710−0.1600−0.36500.7870
Production_costs−0.3810−0.4640−0.70600.6570
Information_management−0.3210−0.3050−0.39900.5980
Energy_consumption−0.0950−0.1210−0.45700.5840
Productivity−0.00500.00800.03000.5740
Knowledge_management0.69900.58300.69300.5330
Asset_management_competences0.14900.12200.25200.5270
Availability0.43700.42500.56600.4720
Stakeholder_participation/involvmeent−0.3490−0.4360−0.46600.4000
Resource_Consumption0.66800.70300.91800.3870
Human-related_accidents−0.2490−0.4460−0.58300.3830
Labor_costs−0.2440−0.3450−0.12500.3220
Lifecycle_and_operational_costs0.06500.01000.02000.2590
Stakeholder_safety0.15300.08100.25000.2500
Other_Env_Pollution−0.1240−0.07800.10100.2290
Non-renewables_consumption0.16500.04100.04300.2140
Hazardous_emission0.65300.76700.97400.0350
Maintenance_spare_parts_costs−0.3730−0.4010−0.3660−0.0450
Data_ingration−0.11400.0460−0.2340−0.1140
Responsibility_and_regulations0.16100.40800.6160−0.1260
Information_System_Flexibility0.14100.40500.4110−0.1610
Maintainability0.07600.24700.1430−0.2280
Data_quality0.19800.40500.5520−0.2870
Environmental_costs0.12700.07800.2920−0.3200
Health_and_safety_of_workers0.12200.12800.3810−0.3820
Process_management−0.3000−0.1810−0.3390−0.3910
Maintenance_Waste0.81100.64500.8120−0.4060
Employee_satisfaction−0.2130−0.1170−0.1930−0.4780
Training_and_upskilling0.07700.14900.1550−0.4800
Product_Quality−0.1430−0.0640−0.2060−0.5150
Resource_management−0.0380−0.1330−0.2050−0.5350
Documenting_and_reporting−0.0670−0.1890−0.0170−0.6020
Spare_parts_management−0.1920−0.1970−0.3410−0.6760
Interoperability0.51000.60400.7860−0.7710
Customer_requirements0.01000.22800.3180−0.8190
Waste_management−0.5480−0.7070−0.9340−0.9070
Risk_of_Failure−0.2520−0.4310−0.4060−1.7980
Energy_consumption_costs0.24300.31100.5280−1.9850
Table A9. Centrality indices of variables in Post_2021 BNA-GCGM network.
VariableBetweennessClosenessStrengthExpected Influence
Labor_costs0.21400.34100.52201.3920
Product_Quality0.50900.41800.53201.3160
Health_and_safety_of_workers0.07700.20500.33801.1640
Reliability0.34000.30100.46901.1490
Maintenance_costs0.19600.20400.11300.9540
Lifecycle_and_operational_costs−0.1550−0.1250−0.22900.8760
Energy_consumption−0.0010−0.1320−0.16900.7000
Knowledge_management−0.0710−0.08300.00900.6560
Hazardous_emission−0.4120−0.3620−0.65400.6270
Waste_management0.28500.26900.03000.5730
Employee_satisfaction0.95700.72300.75500.5120
Productivity−0.6330−0.5700−0.56800.5040
Maintenance_spare_parts_costs−0.1010−0.1430−0.25300.4610
Availability−0.2780−0.2190−0.12000.4240
Production_costs−0.2900−0.2980−0.28400.3360
Training_and_upskilling−0.3120−0.2840−0.35900.2560
Resource_management−0.6350−0.8350−1.10500.1720
Asset_management_competences0.47300.52600.68600.1560
Customer_requirements−0.5060−0.7360−0.74300.1410
Risk_of_Failure−0.3340−0.3410−0.59200.1240
Responsibility_and_regulations0.44500.47400.63800.0610
Data_quality0.65800.49400.52600.0380
Maintenance_Waste−0.02500.05400.05500.0170
Process_management−0.0170−0.0900−0.3000−0.0110
Maintenance_Downtime0.25300.28500.3030−0.1000
Human-related_accidents0.0970−0.0230−0.3500−0.1210
Other_Env_Pollution0.28600.35100.9990−0.2270
Maintainability−0.1420−0.3750−0.3660−0.3010
Stakeholder_safety−0.05700.11700.2540−0.3440
Resource_Consumption−0.18000.01700.1110−0.3470
Stakeholder_participation/involvmeent0.34900.74000.7240−0.3610
Energy_consumption_costs−0.1380−0.3980−0.4070−0.4040
Spare_parts_management0.06100.17200.3330−0.4400
Environmental_costs0.09800.14500.2710−0.5160
Transporation_and_Delivery−0.23600.07200.2480−0.5970
Information_management−0.3450−0.2910−0.2100−0.7070
Data_ingration−0.0550−0.01000.0870−0.8000
Non-renewables_consumption0.01100.0800−0.0510−0.9060
Interoperability0.14900.0830−0.1390−0.9550
Data_management−0.3290−0.2760−0.4140−1.1100
Data_analytics−0.1520−0.1860−0.2260−1.1340
Documenting_and_reporting0.0540−0.2050−0.2290−1.3540
Information_System_Flexibility−0.1060−0.0900−0.2360−1.8750

References

  1. Orošnjak, M.; Brkljač, N.; Šević, D.; Čavić, M.; Oros, D.; Penčić, M. From Predictive to Energy-Based Maintenance Paradigm: Achieving Cleaner Production through Functional-Productiveness. J. Clean. Prod. 2023, 408, 137177. [Google Scholar] [CrossRef]
  2. Karuppiah, K.; Sankaranarayanan, B.; Ali, S.M. On Sustainable Predictive Maintenance: Exploration of Key Barriers Using an Integrated Approach. Sustain. Prod. Consum. 2021, 27, 1537–1553. [Google Scholar] [CrossRef]
  3. Hami, N.; Ibrahim, Y.M.; Yamin, F.M.; Shafie, S.M.; Abdulameer, S.S. The Moderating Role of Sustainable Maintenance on the Relationship between Sustainable Manufacturing Practices and Social Sustainability: A Conceptual Framework. Int. J. Eng. Adv. Technol. 2019, 8, 222–228. [Google Scholar] [CrossRef]
  4. Jasiulewicz-Kaczmarek, M. Sustainability: Orientation in Maintenance Management—Theoretical Background. In EcoProduction and Logistics: Emerging Trends and Business Practices; Springer: Berlin/Heidelberg, Germany, 2013; pp. 117–134. [Google Scholar]
  5. Orošnjak, M.; Jocanović, M.; Čavić, M.; Karanović, V.; Penčić, M. Industrial Maintenance 4(.0) Horizon Europe: Consequences of the Iron Curtain and Energy-Based Maintenance. J. Clean. Prod. 2021, 314, 128034. [Google Scholar] [CrossRef]
  6. Samadhiya, A.; Agrawal, R.; Garza-Reyes, J.A. Integrating Industry 4.0 and Total Productive Maintenance for Global Sustainability. TQM J. 2022, 36, 24–50. [Google Scholar] [CrossRef]
  7. Orošnjak, M.; Šević, D. Benchmarking Maintenance Practices for Allocating Features Affecting Hydraulic System Maintenance: A West-Balkan Perspective. Mathematics 2023, 11, 3816. [Google Scholar] [CrossRef]
  8. Taddese, G.; Durieux, S.; Duc, E. Sustainability Performance Indicators for Additive Manufacturing: A Literature Review Based on Product Life Cycle Studies. Int. J. Adv. Manuf. Technol. 2020, 107, 3109–3134. [Google Scholar] [CrossRef]
  9. United Nations. United Nations Transforming Our World: The 2030 Agenda for Sustainable Development; United Nations: San Francisco, CA, USA, 2015. [Google Scholar]
  10. Elia, V.; Gnoni, M.G.; Tornese, F. Measuring Circular Economy Strategies through Index Methods: A Critical Analysis. J. Clean. Prod. 2017, 142, 2741–2751. [Google Scholar] [CrossRef]
  11. Turner, C.; Okorie, O.; Oyekan, J. XAI Sustainable Human in the Loop Maintenance. IFAC-PapersOnLine 2022, 55, 67–72. [Google Scholar] [CrossRef]
  12. Singh, S.; Khamba, J.S.; Singh, D. Analysis and Directions of OEE and Its Integration with Different Strategic Tools. Proc. Inst. Mech. Eng. Part. E J. Process Mech. Eng. 2021, 235, 594–605. [Google Scholar] [CrossRef]
  13. Kanisuru, A.M. Sustainable Maintenance Practices and Skills for Competitive Production System. In Skills Development for Sustainable Manufacturing; InTech: London, UK, 2017. [Google Scholar]
  14. Jasiulewicz-Kaczmarek, M.; Antosz, K.; Wyczółkowski, R.; Mazurkiewicz, D.; Sun, B.; Qian, C.; Ren, Y. Application of Micmac, Fuzzy Ahp, and Fuzzy Topsis for Evaluation of the Maintenance Factors Affecting Sustainable Manufacturing. Energies 2021, 14, 1436. [Google Scholar] [CrossRef]
  15. Saihi, A.; Ben-Daya, M.; As’ad, R. An Investigation of Sustainable Maintenance Performance Indicators: Identification, Expert Validation and Portfolio of Future Research. IEEE Access 2022, 10, 124259–124276. [Google Scholar] [CrossRef]
  16. Franciosi, C.; Di Pasquale, V.; Iannone, R.; Miranda, S. Multi-Stakeholder Perspectives on Indicators for Sustainable Maintenance Performance in Production Contexts: An Exploratory Study. J. Qual. Maint. Eng. 2020, 27, 308–330. [Google Scholar] [CrossRef]
  17. Sari, E.; Ma’aram, A.; Shaharoun, A.M.; Chofreh, A.G.; Goni, F.A.; Klemeš, J.J.; Marie, I.A.; Saraswati, D. Measuring Sustainable Cleaner Maintenance Hierarchical Contributions of the Car Manufacturing Industry. J. Clean. Prod. 2021, 312, 127717. [Google Scholar] [CrossRef]
  18. Roda, C.; Voisin, I.; Miranda, A.; Macchi, S.; Iung, M. Sustainable Maintenance Performances and EN 15341: 2019: An Integration Proposal. In Proceedings of the IFIP International Conference on Advances in Production Management Systems, Nantes, France, 5–9 September 2021; Springer: Berlin/Heidelberg, Germany, 2021. [Google Scholar]
  19. Hanski, J.; Ojanen, V. Sustainability in Strategic Asset Management Frameworks: A Systematic Literature Review. Int. J. Strateg. Eng. Asset Manag. 2020, 3, 263. [Google Scholar] [CrossRef]
  20. Acerbi, F.; Polenghi, A.; Roda, I.; Macchi, M.; Taisch, M. Exploring Synergies Between Circular Economy and Asset Management. In Proceedings of the Advances in Production Management Systems. The Path to Digital Transformation and Innovation of Production Management Systems, Novi Sad, Serbia, 30 August–3 September 2020; pp. 695–702. [Google Scholar]
  21. Farsi, M.; Mishra, R.K.; Erkoyuncu, J.A. Industry 5.0 for Sustainable Reliability Centered Maintenance. In Proceedings of the 10th International Conference on Through-Life Engineering Services 2021 (TESConf 2021), Online, 16–18 November 2021. [Google Scholar] [CrossRef]
  22. Psarommatis, F.; May, G.; Azamfirei, V. Envisioning Maintenance 5.0: Insights from a Systematic Literature Review of Industry 4.0 and a Proposed Framework. J. Manuf. Syst. 2023, 68, 376–399. [Google Scholar] [CrossRef]
  23. Cortés-Leal, A.; Cárdenas, C.; Del-Valle-Soto, C. Maintenance 5.0: Towards a Worker-in-the-Loop Framework for Resilient Smart Manufacturing. Appl. Sci. 2022, 12, 11330. [Google Scholar] [CrossRef]
  24. Zhang, C.; Wang, Z.; Zhou, G.; Chang, F.; Ma, D.; Jing, Y.; Cheng, W.; Ding, K.; Zhao, D. Towards New-Generation Human-Centric Smart Manufacturing in Industry 5.0: A Systematic Review. Adv. Eng. Inform. 2023, 57, 102121. [Google Scholar] [CrossRef]
  25. Aheleroff, S.; Huang, H.; Xu, X.; Zhong, R.Y. Toward Sustainability and Resilience with Industry 4.0 and Industry 5.0. Front. Manuf. Technol. 2022, 2, 951643. [Google Scholar] [CrossRef]
  26. Jasiulewicz-Kaczmarek, M.; Legutko, S.; Kluk, P. Maintenance 4.0 Technologies—New Opportunities for Sustainability Driven Maintenance. Manag. Prod. Eng. Rev. 2020, 11, 74–87. [Google Scholar] [CrossRef]
  27. Jasiulewicz-Kaczmarek, M.; Antosz, K. Industry 4.0 Technologies for Maintenance Management—An Overview. In Proceedings of the Lecture Notes in Mechanical Engineering; Springer Science: Berlin/Heidelberg, Germany; Business Media Deutschland GmbH: Frankfurt, Germany, 2023; pp. 68–79. [Google Scholar]
  28. Triguero, I.; García-Gil, D.; Maillo, J.; Luengo, J.; García, S.; Herrera, F. Transforming Big Data into Smart Data: An Insight on the Use of the K-nearest Neighbors Algorithm to Obtain Quality Data. WIREs Data Min. Knowl. Discov. 2019, 9, e1289. [Google Scholar] [CrossRef]
  29. McKenzie, J.E.; Brennan, S.E. Overviews of Systematic Reviews: Great Promise, Greater Challenge. Syst. Rev. 2017, 6, 185. [Google Scholar] [CrossRef] [PubMed]
  30. Grant, M.J.; Booth, A. A Typology of Reviews: An Analysis of 14 Review Types and Associated Methodologies. Health Inf. Libr. J. 2009, 26, 91–108. [Google Scholar] [CrossRef] [PubMed]
  31. Pollock, M.; Fernandes, R.M.; Pieper, D.; Tricco, A.C.; Gates, M.; Gates, A.; Hartling, L. Preferred Reporting Items for Overviews of Reviews (PRIOR): A Protocol for Development of a Reporting Guideline for Overviews of Reviews of Healthcare Interventions. Syst. Rev. 2019, 8, 335. [Google Scholar] [CrossRef] [PubMed]
  32. Bougioukas, K.I.; Liakos, A.; Tsapas, A.; Ntzani, E.; Haidich, A.B. Preferred Reporting Items for Overviews of Systematic Reviews Including Harms Checklist: A Pilot Tool to Be Used for Balanced Reporting of Benefits and Harms. J. Clin. Epidemiol. 2018, 93, 9–24. [Google Scholar] [CrossRef] [PubMed]
  33. Aromataris, E.; Munn, Z. JBI Manual for Evidence Synthesis; JBI: Adelaide, South Australia, 2021; ISBN 978-0-6488488-0-6. [Google Scholar]
  34. Page, M.J.; McKenzie, J.E.; Bossuyt, P.M.; Boutron, I.; Hoffmann, T.C.; Mulrow, C.D.; Shamseer, L.; Tetzlaff, J.M.; Akl, E.A.; Brennan, S.E.; et al. The PRISMA 2020 Statement: An Updated Guideline for Reporting Systematic Reviews. Syst. Rev. 2021, 10, 89. [Google Scholar] [CrossRef] [PubMed]
  35. Cobo, M.J.; López-Herrera, A.G.; Herrera-Viedma, E.; Herrera, F. An Approach for Detecting, Quantifying, and Visualizing the Evolution of a Research Field: A Practical Application to the Fuzzy Sets Theory Field. J. Informetr. 2011, 5, 146–166. [Google Scholar] [CrossRef]
  36. Aria, M.; Cuccurullo, C. bibliometrics: An R-tool for comprehensive science mapping analysis. J. Informetr. 2021, 11, 959–975. [Google Scholar] [CrossRef]
  37. Briganti, G.; Fried, E.I.; Linkowski, P. Network Analysis of Contingencies of Self-Worth Scale in 680 University Students. Psychiatry Res. 2019, 272, 252–257. [Google Scholar] [CrossRef]
  38. Fruchterman, T.M.J.; Reingold, E.M. Graph Drawing by Force-Directed Placement. Softw. Pract. Exp. 1991, 21, 1129–1164. [Google Scholar] [CrossRef]
  39. da Leme, D.E.C.; Alves, E.V.d.C.; Lemos, V.d.C.O.; Fattori, A. Network Analysis: A Multivariate Statistical Approach for Health Science Research. Geriatr. Gerontol. Aging 2020, 14, 43–51. [Google Scholar] [CrossRef]
  40. Adler, R.; Ewing, J.; Taylor, P. Copula Gaussian Graphical Models and Their Application to Modeling Functional Disability Data. Ann. Appl. Stat. 2011, 5, 969–993. [Google Scholar] [CrossRef]
  41. JASP. How to Perform a Network Analysis in JASP. Available online: https://jasp-stats.org/2018/03/20/perform-network-analysis-jasp/ (accessed on 1 May 2023).
  42. Wagenmakers, E.-J.; Kucharsky, S.; van Doorn, J.; van den Bergh, D. Accessible and Sustainable Statistics with JASP. OSF 2023. preprint. [Google Scholar] [CrossRef]
  43. Kalantari, E.; Kouchaki, S.; Miaskowski, C.; Kober, K.; Barnaghi, P. Network Analysis to Identify Symptoms Clusters and Temporal Interconnections in Oncology Patients. Sci. Rep. 2022, 12, 17052. [Google Scholar] [CrossRef] [PubMed]
  44. Robinaugh, D.J.; Millner, A.J.; McNally, R.J. Identifying Highly Influential Nodes in the Complicated Grief Network. J. Abnorm. Psychol. 2016, 125, 747–757. [Google Scholar] [CrossRef]
  45. Hespanhol, L.; Vallio, C.S.; Costa, L.M.; Saragiotto, B.T. Understanding and Interpreting Confidence and Credible Intervals around Effect Estimates. Braz. J. Phys. Ther. 2019, 23, 290–301. [Google Scholar] [CrossRef]
  46. Foygel, R.; Drton, M. Extended Bayesian Information Criteria for Gaussian Graphical Models. In Proceedings of the Advances in Neural Information Processing Systems; Lafferty, J., Williams, C., Shawe-Taylor, J., Zemel, R., Culotta, A., Eds.; Curran Associates, Inc.: Brooklyn, NY, USA, 2010; Volume 23. [Google Scholar]
  47. Franciosi, C.; Iung, B.; Miranda, S.; Riemma, S. Maintenance for Sustainability in the Industry 4.0 Context: A Scoping Literature Review. IFAC-PapersOnLine 2018, 51, 903–908. [Google Scholar] [CrossRef]
  48. Franciosi, C.; Voisin, A.; Miranda, S.; Riemma, S.; Iung, B. Measuring Maintenance Impacts on Sustainability of Manufacturing Industries: From a Systematic Literature Review to a Framework Proposal. J. Clean. Prod. 2020, 260, 121065. [Google Scholar] [CrossRef]
  49. Olugu, E.U.; Wong, K.Y.; Chung Ee, J.Y.; Mammedov, Y.D. Incorporating Sustainability and Maintenance for Performance Assessment of Offshore Oil and Gas Platforms: A Perspective. Sustainability 2022, 14, 807. [Google Scholar] [CrossRef]
  50. Karki, B.R.; Porras, J. Digitalization for Sustainable Maintenance Services: A Systematic Literature Review. Digit. Bus. 2021, 1, 100011. [Google Scholar] [CrossRef]
  51. de Pires, S.P.; Sénéchal, O.; Deschamps, F.; Loures, E.R.; Perroni, M.G. Industrial Maintenance for Sustainable Performance: A Systematic Literature Review. In Proceedings of the 23rd International Conference on Production Research, Verlagsort, Manila, Philippines, 1–4 August 2015. [Google Scholar]
  52. Lê, S.; Josse, J.; Husson, F. FactoMineR: An R. Package for Multivariate Analysis. J. Stat. Softw. 2008, 25, 1–18. [Google Scholar] [CrossRef]
  53. de Campos, R.S.; Simon, A.T. Insertion of Sustainability Concepts in the Maintenance Strategies to Achieve Sustainable Manufacturing. Indep. J. Manag. Prod. 2019, 10, 1908–1931. [Google Scholar] [CrossRef]
  54. de Santos, A.C.J.; Cavalcante, C.A.V.; Wu, S. Maintenance Policies and Models: A Bibliometric and Literature Review of Strategies for Reuse and Remanufacturing. Reliab. Eng. Syst. Saf. 2023, 231, 108983. [Google Scholar] [CrossRef]
  55. Sachs, J.D. From Millennium Development Goals to Sustainable Development Goals. Lancet 2012, 379, 2206–2211. [Google Scholar] [CrossRef]
  56. Orosnjak, M. Maintenance Practice Performance Assessment of Hydraulic Machinery: West Balkan Meta-Statistics and Energy-Based Maintenance Paradigm. In Proceedings of the 2021 5th International Conference on System Reliability and Safety (ICSRS), Palermo, Italy, 24–26 November 2021; IEEE: Piscataway, NJ, USA, 2021; pp. 108–114. [Google Scholar]
  57. Bredebach, C. Is Sustainable Maintenance A Support-Or Standalone Function? A Definition. In Proceedings of the Conference on Production Systems and Logistics, Stellenbosch, South Africa, 14–17 November 2023; Publish-Ing in cooperation with TIB—Leibniz Information Centre for Science and Technology University Library: Hanover, Germany, 2023; pp. 23–33. [Google Scholar]
  58. Bredebach, C. What Role Does Maintenance Play in Achieving Sustainability in Manufacturing?—A Scoping Literature Review. In Proceedings of the ASME 2022 17th International Manufacturing Science and Engineering Conference, West Lafayette, IN, USA, 27 June–1 July 2022; The American Society of Mechanical Engineers: West Lafayette, IN, USA, 2022. [Google Scholar]
  59. Saihi, A.; Ben-Daya, M.; As’ad, R.A. Maintenance and Sustainability: A Systematic Review of Modeling-Based Literature. J. Qual. Maint. Eng. 2023, 29, 155–187. [Google Scholar] [CrossRef]
  60. Ibrahim, Y.M.; Hami, N.; Othman, S.N. Integrating Sustainable Maintenance into Sustainable Manufacturing Practices and Its Relationship with Sustainability Performance: A Conceptual Framework. Int. J. Energy Econ. Policy 2019, 9, 30–39. [Google Scholar] [CrossRef]
  61. Nahavandi, S. Industry 5.0—A Human-Centric Solution. Sustainability 2019, 11, 4371. [Google Scholar] [CrossRef]
  62. Vrignat, P.; Kratz, F.; Avila, M. Sustainable Manufacturing, Maintenance Policies, Prognostics and Health Management: A Literature Review. Reliab. Eng. Syst. Saf. 2022, 218, 108140. [Google Scholar] [CrossRef]
  63. Franciosi, C.; Miranda, S.; Veneroso, C.R.; Riemma, S. Improving Industrial Sustainability by the Use of Digital Twin Models in Maintenance and Production Activities. IFAC-PapersOnLine 2022, 55, 37–42. [Google Scholar] [CrossRef]
  64. Hallioui, A.; Herrou, B.; Katina, P.F.; Santos, R.S.; Egbue, O.; Jasiulewicz-Kaczmarek, M.; Soares, J.M.; Marques, P.C. Total Productive Maintenance (STPM). Sustainability 2023, 15, 12362. [Google Scholar] [CrossRef]
Figure 1. OoSR flow chart for synthesis of review studies.
Sustainability 16 00767 g001
Figure 2. Collaborative-authorship network of sustainable maintenance reviews.
Sustainability 16 00767 g002
Figure 3. Triplot of authors (left), keywords (middle) and source (right).
Sustainability 16 00767 g003
Figure 4. Number of cited references (black line)—deviation from the 5-year median (red line).
Sustainability 16 00767 g004
Figure 5. Word clouds of (a) WoS-indexed keywords plus (b) author keywords; (c) title bigrams; (d) title trigrams; (e) abstract bigrams; (f) abstract trigrams.
Sustainability 16 00767 g005
Figure 6. VosViewer co-occurrence analysis of all included keywords.
Sustainability 16 00767 g006
Figure 7. VosViewer co-citation analysis of references across the synthesised reviews.
Sustainability 16 00767 g007
Figure 8. VosViewer co-citation analysis of sources with a minimum of two citations.
Sustainability 16 00767 g008
Figure 9. Bibliographic coupling of author-related research.
Sustainability 16 00767 g009
Figure 10. Thematic evolution analysis using abstract unigrams.
Sustainability 16 00767 g010
Figure 11. Thematic evolution analysis using abstract unigrams.
Sustainability 16 00767 g011
Figure 12. Thematic mapping using abstract bigrams.
Sustainability 16 00767 g012
Figure 13. Thematic mapping network.
Sustainability 16 00767 g013
Figure 14. Historiograph of published reviews on the topic of sustainable maintenance.
Sustainability 16 00767 g014
Figure 15. Factorial analysis of conceptual structure using MCA and abstract bigrams.
Sustainability 16 00767 g015
Figure 16. Dendrogram of MCA using abstract bigrams.
Sustainability 16 00767 g016
Figure 17. Sustainable maintenance factors addressed. (a) Circular bar plot; (b) proportion and percentage of criteria (factors); (c) stacked bar chart depicting proportion of factors discussed. (The full list of references of reviews included are given in the Appendix B, Table A6).
Sustainability 16 00767 g017
Figure 18. BNA network overall structure.
Sustainability 16 00767 g018
Figure 19. Centrality plot of BNA.
Sustainability 16 00767 g019
Figure 20. The results of Pre_2021 (left) and Post_2021 (right) network analysis.
Sustainability 16 00767 g020
Figure 21. Centrality plot of BNA Pre 2021 (blue) and Post 2021 (red).
Sustainability 16 00767 g021
Table 1. Search strings used for synthesis of papers.
Description/Keywords/ActivityScholarWoSSCOPUSTotal
“sustainable maintenance” AND “systematic literature review”3935161559
“sustainable asset management” AND “systematic literature review”7501792
“physical asset management” AND “systematic literature review” AND sustainab*115034149
“energy-based maintenance” AND “systematic literature review”120315
“energy-oriented maintenance” AND “systematic literature review”2601339
Sum6215228854
Screening 71
Final 20
Table 2. Inclusion/Exclusion criteria.
CriteriaSubcriteriaDescription of Criteria
Inclusion Criteria 1 (IC)Full-text papers (FTP).Posters, abstracts, editorials, etc., must not be included.
English language (ENG).Only papers written in English language.
Only reviews (OR).Explicitly systematic reviews, or at least review study.
Time Frame (TF).Time frame is set to 2000–2023.
Exclusion Criteria 1 (EC)Non-Related 1 (NR1).Reviews that are not related to manufacturing (e.g., facility).
Non-Related 1(NR2).Opinion-based or theoretical paper not a review.
Loosely Related 1 (LR1).Papers are not reviews, include expert opinion and research.
Loosely Related 2 (LR2).Reviews without primary focus on sustainable maintenance.
Closely Related (CR)Explicitly addressing RQ.Reviews strictly addressing proposed RQs.
Table 3. Thematic model parameters.
ParameterEstimationValue
Number of wordsNumber of words included per review aspect (e.g., abstract)250
Minimum cluster frequencyPer thousand docs5
Weight IndexWeighted by Word-Occurrences0.1
Label size-0.3
Number of labelsFor each cluster7
Clustering algorithmWalk trap-
Time slicesNumber of cutting points3
   Year 1-2019
   Year 2-2020
   Year 3-2022
Table 4. Descriptive statistics of meta-data records of included reviews.
Studies of Meta- and Bibliometric-Data Records
Characteristicn%RangeSumMedianAvg.SE *St.devIQR *VarMinMax
Authors201.07733.503.650.3861.7252.2502.97618
Years201.08-2021.502020.950.4732.1143.0004.47120152023
#studies included160.8707474046.6885.2020.8019.25432.62494
TS-TE (search) *170.85735542032.587.1429.4558.00867.4-73
TS-TE (included) *190.95231579.08.2631.546.7311.545.32-23
Characteristics#%Characteristics#%
Literature sources covered Study types included in the review
  SCOPUS130.65Journals160.80
  WoS130.65Conferences130.65
  SB60.30Books (book chapters)60.30
  IEEE40.20Other types of studies included10.05
  Emerald20.10NA/ND40.20
  EBSCO20.10Search Strategy explicit = Yes (No)11 (9)0.55 (0.45)
  Other20.10Research Question = Yes (No)15 (5)0.75 (0.25)
  NA/ND50.25
Protocols used by reviews QAT utilised
 PRISMA40.20 Yes (No)2 (18)0.10 (0.90)
 EBSE20.10Funding
 Other30.15 Yes (No)5 (15)0.40 (0.60)
 NA/ND110.55
* Note: SE = Standard Error. IQR = Inter-Quartile Range. TS-TE (search) = TimeStart-TimeEnd of the search span. TS-TE (included) = TimeStart-TimeEnd of included articles within time span.
Table 5. Summary of the network analysis.
Number of NodesNumber of Non-Zero NodesSparsity
43457/9030.494
Table 6. Summary of the network analysis using pre-2021 and post-2021 split
NetworkNumber of NodesNumber of Non-Zero NodesSparsity
Pre-202143451/9030.501
Post-202143471/9030.478
Disclaimer/Publisher’s Note: The statements, opinions and data contained in all publications are solely those of the individual author(s) and contributor(s) and not of MDPI and/or the editor(s). MDPI and/or the editor(s) disclaim responsibility for any injury to people or property resulting from any ideas, methods, instructions or products referred to in the content.

