Abstract
This paper proposes a market flow methodology to assess Chilean employment support policies between 1996 and 2019 based on the probability of finding or losing a job and market flow analysis. The proposed methodology is analyzed with data obtained from the National Institute of Statistics (INE), establishing flows and probabilities of entry and exit from employment and their contributions to the variability of unemployment to clarify the behavior of Chilean employment support and select the type of measures through which to provide improved recovery and job protection and the other possible improvements to be made. Employment is an essential issue of a country’s sustainability. The results show the efficiency of the proposed approach in evaluating employment support policies in different countries.
1. Introduction
Developing countries continuously search for ways to maintain sustained economic growth over time or at least national stability. Nations turn to the analysis of different markets to develop better responses to achieve this objective; one of these markets corresponds to employment support. Employment and unemployment are areas of great importance for a nation and its individuals, and these two situations can determine the well-being of a country depending on which of the two is on the rise or fall. These states and others converge in employment support, where employment supply and demand converge. This market can be affected by different social, cultural, national, and international factors. Thus, studying and understanding it is vital for developing policies or actions that regulate, protect, or improve this market.
Two crises from the last three decades that have significantly impacted the world’s employment support stand out. First, the Asian crisis originated in Wuhan from 1996 to 1999, and the subprime crisis originated in the United States in 2008. Another crisis, which originated with the appearance of the coronavirus disease 2019 (COVID-19), forced governments to contain and eradicate the disease from within its borders. The Organization for Economic Cooperation and Development (OECD) has stated that containment measures taken by most governments have managed to stop the spread of the virus and reduce the number of deaths. However, such measures have also slowed economic activity in many sectors, widened inequalities, disrupted education, and undermined confidence in the future [1]. One of the consequences that such economic measures have brought about is an increase in unemployment due to confinement measures and social distancing. Although Chile has seen an increase in the unemployment rate due to COVID-19, its labor problem arose before the pandemic—during the social outbreak of 2019—and was enhanced by the global pandemic.
These historic episodes led countries to implement public employment policies to avoid a sharp and sustained decline in unemployment due to recessions. In this context, Chile also responded with a range of public policies, some of which were evaluated to identify their degree of effectiveness both for the employment support and other areas of social protection. The world is facing an unprecedented crisis that can sink deep into countries’ employment support. Chile is no stranger to this situation, and thus, this study seeks to analyze the history of the Chilean employment support, focusing our gaze on the inflows and outflows of employment, its dynamism, and the understanding of which type of policies best contribute to protecting or creating jobs.
The role of inflows and outflows in the dynamics of unemployment in three European nations—the UK, France, and Spain—is examined by Petrongolo and Pissarides [2]. Administrative and labor force survey data are used in this comparison. Additionally, ref. [3] uses data from the Spanish Labor Force Survey from 1987 to 2010 to evaluate the dynamics of the Spanish labor market, propose transition rates in a three-state model, and compare the findings with those from the US and the UK. Sengul [4] breaks down changes in unemployment into contributions from inflow and outflow rates by analyzing the rates of influx into and out of unemployment in Turkey. The results show that the volatility of inflow rates mainly drives variations in unemployment. Using data from the Economically Active Population Survey (EAPS), Kim and Lee [5] examined the dynamics of unemployment in Korea from 2000 to 2011, examining the size and cyclicality of gross workflows and the corresponding transition rates between the phases of the labor market that are employment, unemployment, and inactivity. Ref. [6] use microdata from the Greek Labor Force Survey (1998–2013) to examine the influx and outflow of unemployment. The ins and outs of unemployment change with individual-specific heterogeneity (gender, age, education, etc.), according to multinomial regression approaches. The impact of this heterogeneity is different in the pre-and post-2008 periods.
In order to measure the US monthly time series of stocks and flows of involuntary part-time work from 1976 to the present, ref. [7] recently devised and put into practice a technique. This research compares the dynamics of involuntary part-time work and unemployment to make the case that they represent the functioning of different labor adjustment channels. For 18 OECD nations over the past 40 years, Lydon and Simmons [8] assess the inflows into and outflows from unemployment by gender. The authors above demonstrate, using data on output by sector, that the varying gender makeup by sector is a plausible explanation for these outcomes for each country. Furthermore, in ref. [9], the authors apply a Bayesian model averaging technique to estimate the robust determinants of the inflow rate into and outflow rate from unemployment, mitigating model uncertainty. The primary factor influencing outflows from unemployment is the amount spent on a passive employment support policy. On the other hand, the length of benefit entitlement is the primary factor influencing the inflows into unemployment.
Borowczyk-Martins and Lalé [10] use data from the US Current Population Survey (CPS) to analyze stocks and flows of involuntary part-time work from 1976 to 2019 (spanning five economic downturns). An extensive explanation of the cyclical dynamics of involuntary part-time employment is possible thanks to the time series obtained. From an empirical and theoretical standpoint, Fontaine [11] investigates the conditional contributions of the ins and outs of French unemployment. The author above uses French data to construct a sign limitation VAR model based on a New Keynesian DSGE theoretical framework. The results of this VAR model show that different shocks have different contributions from transition rates in explaining unemployment. The recent decline in unemployment and the increase in part-time employment and labor market engagement among Germans in their prime are examined by Carrillo-Tudela et al. [12]. Changes in their outflows caused the observed variations in registered and unregistered unemployment stocks after 2002, according to counterfactual simulations utilizing estimated transition probabilities. Furthermore, ref. [13] developed a decomposition for the unemployment rate that enables evaluating the contributions of the different labor market flow rates over varied time intervals. Data from Brazil and the United States are used to test the suggested methodology.
While the paragraphs mentioned above provide a comprehensive exploration of unemployment dynamics in various European nations and the United States, understanding the intricacies of Chilean employment support requires a distinct lens. Limited insights are available in the provided information regarding Chile’s specific context. To bridge this gap, it is essential to develop a methodology considering the inflow and outflow rates of unemployment in Chile, utilizing methodologies comparable to those employed in studies in the UK, France, Spain, Turkey, Korea, and Greece. By examining the volatility of inflow rates, individual-specific heterogeneity, and the impact of policy interventions, researchers could contribute valuable insights into the unique factors shaping unemployment dynamics in the Chilean labor market. Such an analysis would complement the existing literature and enhance our understanding of the global diversity in labor market dynamics and the factors influencing unemployment trends across different countries.
This paper seeks to propose a methodology to describe Chilean employment support for the period 1996–2019 and contrast it with recent employment support policies. It seeks to examine Chilean employment support using a methodology for employment entry and exit flows to verify the relationship between the behavior of the GDP and the subprime crisis. In this way, it seeks to assess measures implemented in Chile against the 2020 recession by contrasting them against the behavior of the Chilean employment support and previous studies. The temporal scope of the data is from 1996 to 2019; the year 2020 was omitted due to irregularity in the information due to the pandemic. The policies implemented by the government are studied by understanding previous studies and their relationship with the current methodology; no conclusions are drawn about their quantitative effectiveness due to the limited information.
The data used have the characteristic of being publicly accessible, so it can be obtained from the National Institute of Statistics (INE), whether it is published from 2010 to the present on its website or requested historical information through a citizen service portal. It is essential to mention that the time series are linked based on the 2002 census. Nonoverlapping moving quarters were used for construction and development from January to March and April to June, July–September, and October–December. Short-term unemployment was considered for workers looking for work between 0 and 12 weeks, corresponding to the period between surveys. The data were analyzed following the proposed methodology.
This paper proposes a market flow methodology to assess Chilean employment support policies between 1996 and 2019 based on the proposals of [14,15]. The proposed methodology is analyzed with data obtained from the National Institute of Statistics (INE) establishing flows and probabilities of entry to and exit from employment and their contributions to the variability in the level of unemployment, which allows us to clarify how the Chilean employment support behaves and to select the type of measure that provides better recovery and employment protection and what possible improvements can be made.
2. Proposed Methodology
Ignoring movements within and outside of the workforce (assumption of a fixed labor force) and ignoring any heterogeneity suggesting that some workers are more or less likely to find or lose a job (assumption of homogeneity), we propose a methodology through which to assess the active policies of the Chilean market based on the analysis of market flow and the probabilities of finding or losing employment. The methodology has been adapted from [14,15]. The Scheme 1 describes the steps of the proposed methodology.
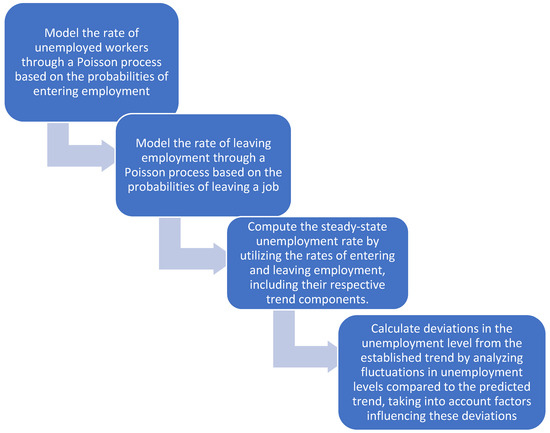
Scheme 1.
Step of the proposed methodology.
The study [14] develops a methodology through which to calculate the probabilities of finding a job or entering a job () and of losing or leaving employment () and their respective rates or flows, which are estimated using publicly available monthly employment support data in the United States. One of the main factors this paper addresses is what happens to workers between surveys. The National Employment Survey classifies workers as employed and unemployed if they work or not during the reference week, respectively; therefore, what happens to workers during the two surveys is not reported, which produces underestimated results because workers can find or lose a job and vice versa during this period. Such a situation is known as temporary aggregation bias, and the methodology seeks to ignore this bias considering short-term unemployment. Reference [15] studies the monthly flows calculated and their contribution to the variation in the unemployment level.
The short-term unemployment ratio is calculated using the spliced series provided by the INE and the database without splicing [16]. As a result, we define the following as the ratio of short-term unemployment to total unemployment:
where and correspond to the information obtained from the database without splicing, and and correspond to the information obtained from the spliced series.
We take a look at a continuous time environment model where data are only available on discrete dates, for , referring to the interval as period t. The objective of the proposed methodology is to find the probability of entering a job (finding a job) and the probability of leaving a job in period based on available data. During period t, all unemployed workers find jobs according to a Poisson process with a rate of . All employed workers lose their jobs according to a Poisson process with a rate of , where and are defined as the rate of entering employment and the rate of leaving employment, respectively, and and are the corresponding probabilities; that is, is the probability that a worker who begins period unemployed finds at least one job during the period, and similarly, .
The time elapsed since the last measurement date is denoted by . In addition, is the number of employed workers at time , is indicated by the number of unemployed workers at is indicated by , and the short-term unemployment is represented by , which is the number of unemployed workers who are unemployed at time but were employed at some point . The fact that for every worker is considered. Conveniently, the entire quantity of short-term unemployment at period can be defined as (1). The following describes the evolution of total unemployment (2) and short-term unemployment (3) for and :
When employees quit their jobs immediately, , the unemployment rate rises; conversely, when jobless individuals obtain employment at an instantaneous rate, , the unemployment rate falls. When workers quit their jobs, their unemployment rate rises; conversely, it falls when they find new jobs. In this way, the probability of finding a job is calculated using Equation (4):
Given an initial condition for , this differential equation can be solved for and by building in the following way:
The number of unemployed workers to date equals the number of unemployed workers to date who do not find work (fraction ) plus short-term unemployed workers , that is, those workers who are currently unemployed but had a job at some point during period . Conversely,
To express the probability of finding a job as a function of unemployment and short-term unemployment, assuming a constant risk rate within the quarter, it is possible to calculate the corresponding monthly outflow risk rate, that is, the rate of finding employment, , as follows:
The result of Equation (5) is used, and the expression is divided into three subexpressions to express the rate on a monthly basis to facilitate a comparison with the rates of other studies, according to the adjustment made by [17]. Differential Equation (2) onward can also be solved to obtain an implicit expression for the rate of exit from employment :
where is the size of the labor force during period t, which is assumed constant since entry or exit from the labor force is not allowed. Since , the right-hand side of the expression is increased by . Given the probability of finding a job from Equation (6) and data on unemployment and employment, Equation (8) uniquely defines the probability of a worker leaving his or her job , which can be solved by mathematical software; in this case, MATLAB is used.
The quantification and examination of the contributions of the inflows and outflows of unemployment to the variability of unemployment are determined, considering that the proposed methodology proposes and argues that if unemployment is constant, a good approximation measure corresponds to the following:
This approximation is defined as the steady-state unemployment rate (. This approximation can also be applied to the trend of the series , where and denote the trend components of the series obtained through the HP filter [18]:
Log-linearizing relative to its trend value leads us to the following decomposition:
Equation (11) express the deviations in the unemployment level from the trend as a sum of factors that depend separately on the deviations in the rates to find and leave employment with respect to their respective trends, together with a residual term. Equation (11) can be expressed as follows:
If we use the variance of Equation (12) to examine the variability of unemployment, then we obtain the following:
From Equation (13), we find that , and the three betas serve to decompose the total variation in into separate components that derive from the fluctuations of the rates of exit and entry to employment, together with a residual component.
3. Computational Results
Through the proposed methodology, it is possible to calculate the probabilities of entry and exit from employment, their respective flows, and their contribution to the variability in the employment level. The results obtained and integrated with the historical information on the employment support allow us to establish the below results. The data were analyzed by using MATLAB 9.14.
For the study, a recession period (year) was established when the rate of variation (annual percentage) of GDP was negative from 1996 to 2019. Two years were observed in Figure 1 within what was established as a recession. The recessions were in the year 1999, resulting from the Asian crisis with a percentage variation in GDP of −0.41 percent, and the year 2009, due to the subprime crisis, generating a decline in the economy of −1.56 percent.
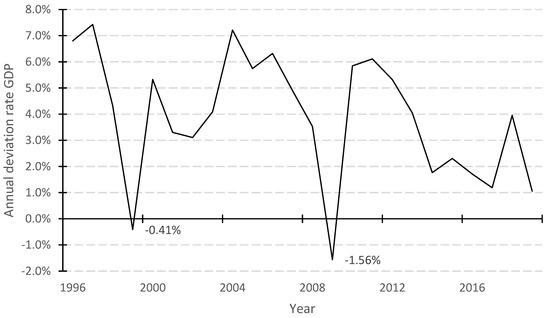
Figure 1.
Annual variation rate of GDP (annual %) in Chile from 1996 to 2019. Source: Own elaboration.
3.1. Probability of Entering Employment
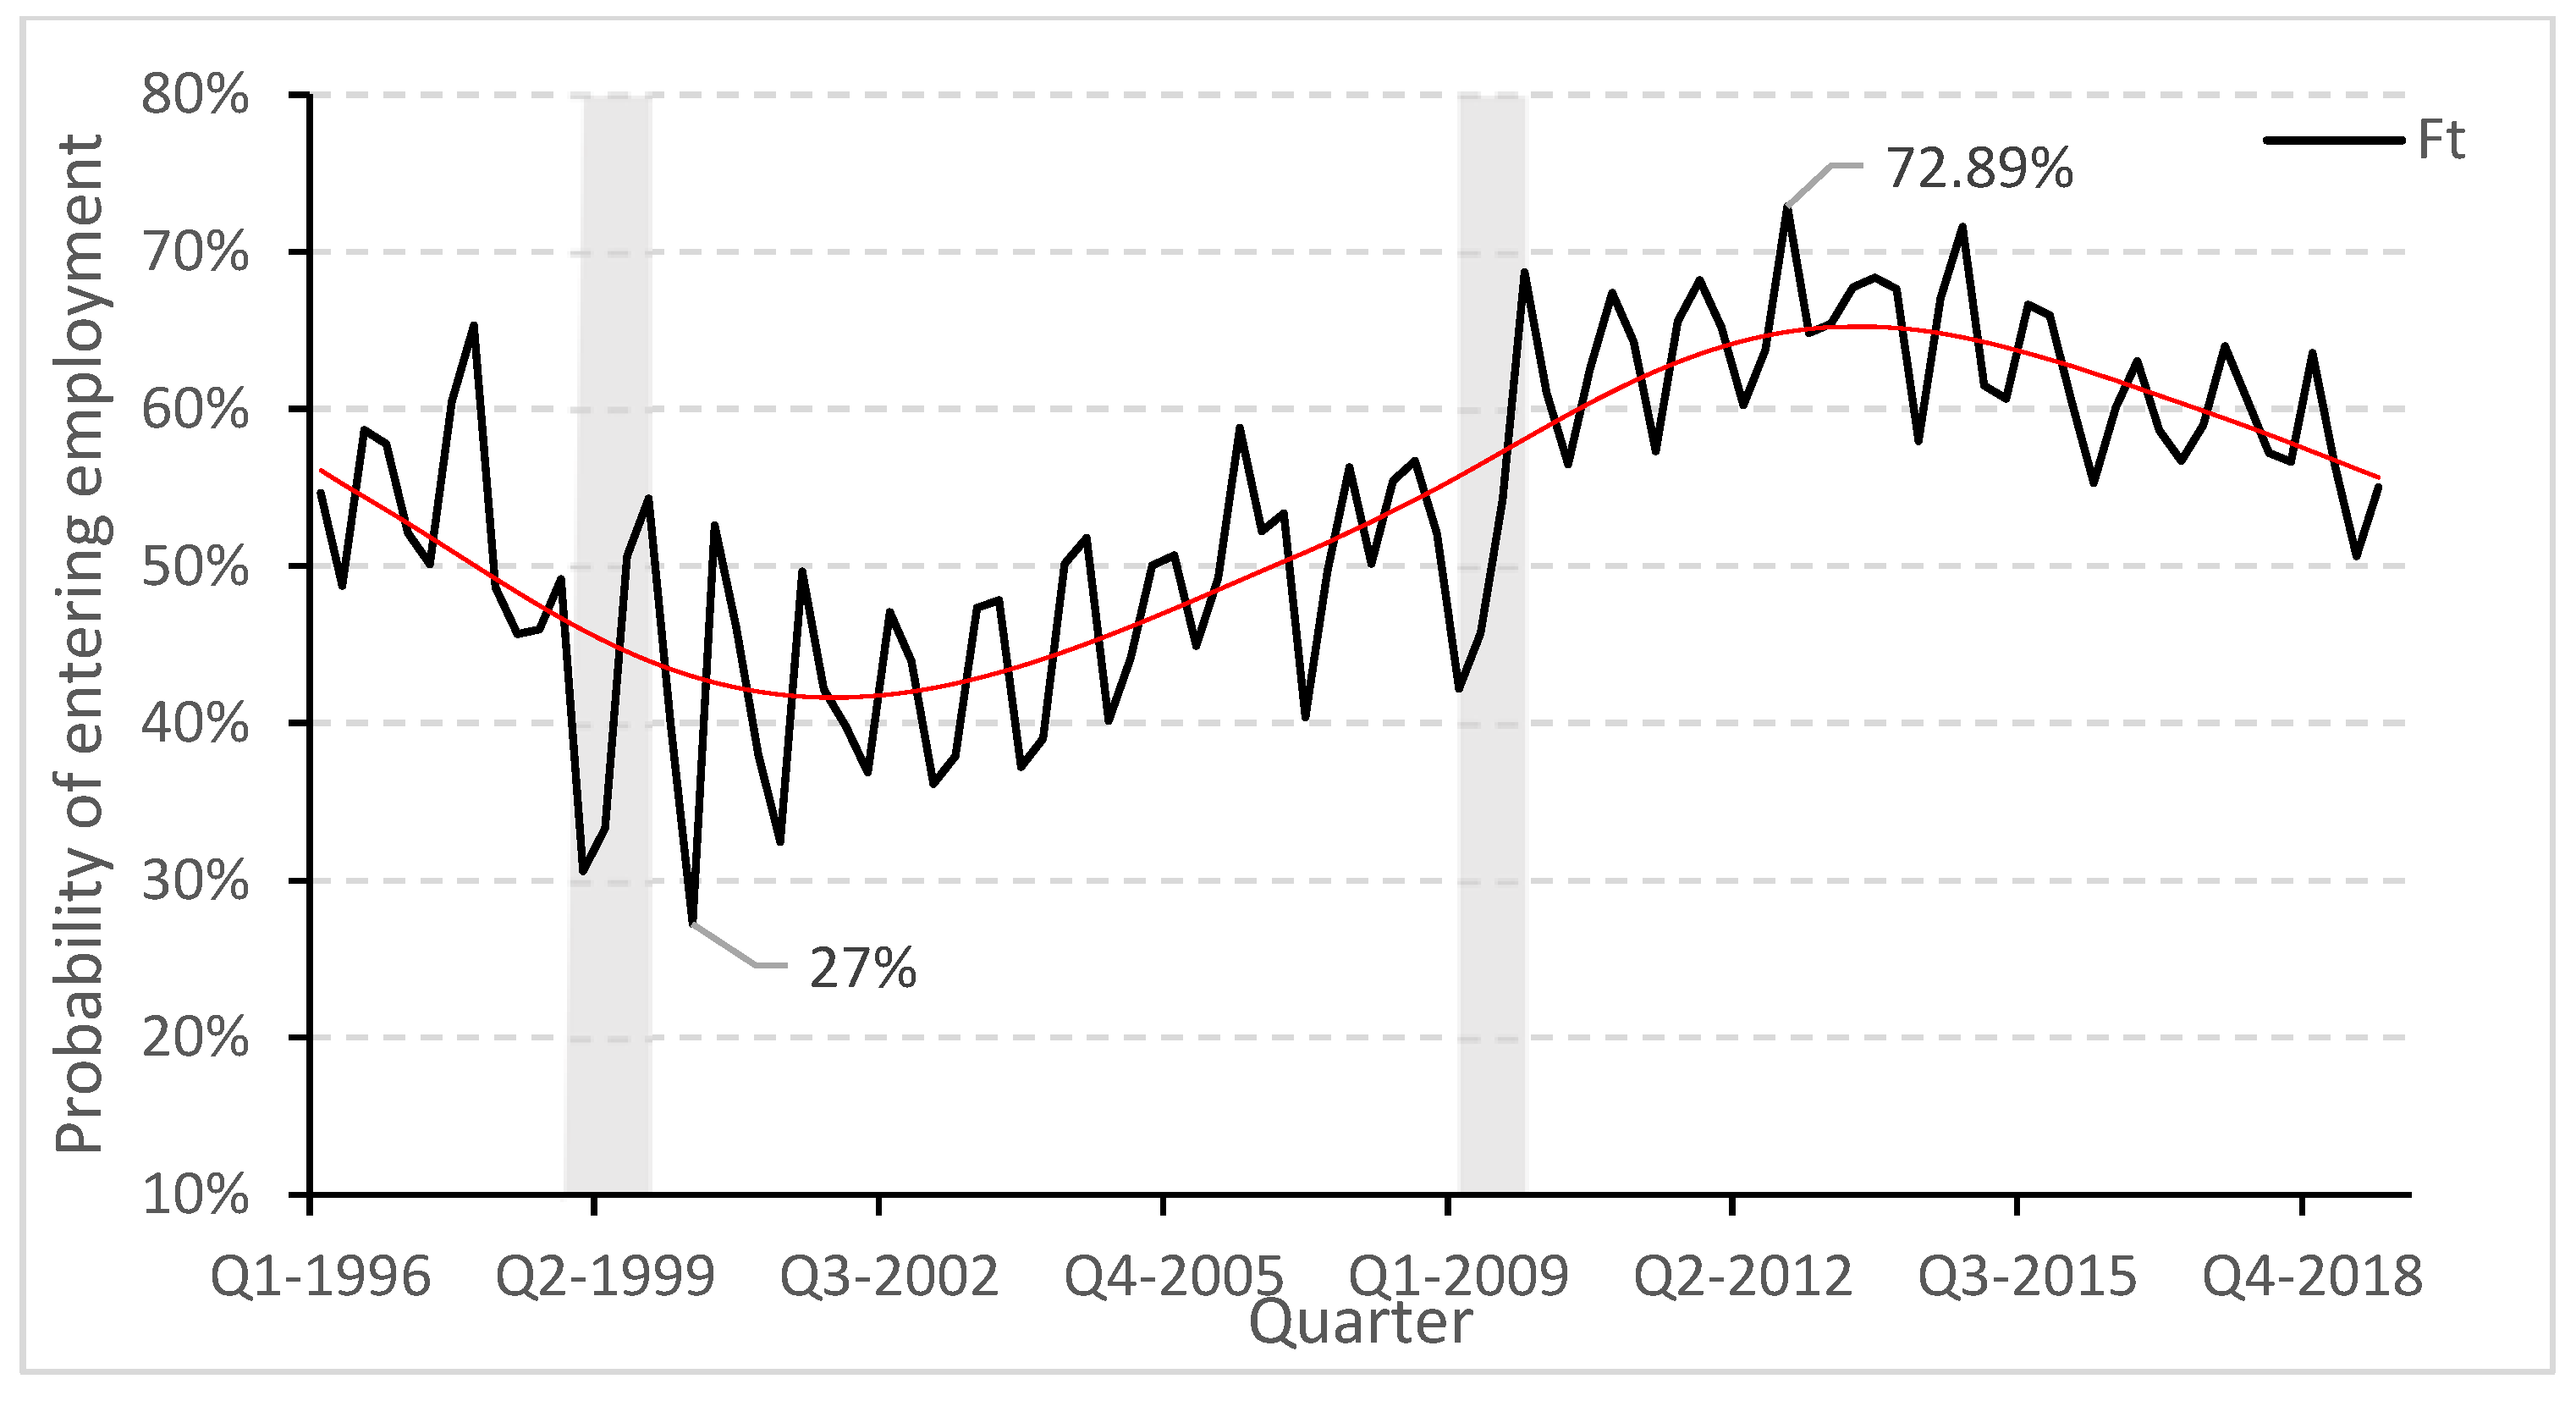
Following Equations (6) and (8), it is determined that the average probability of entering employment is 53.60% for the entire period under study. Figure 2 shows that the lowest probability of finding a job is recorded after the Asian crisis, with a value of 27.23% in the second half of 2000, to later having an upward trend, reaching a maximum of 72.89% in the fourth quarter of 2012. Although the subprime crisis occurred in 2008, there was a rapid recovery and continuous upward trend until 2012, which could be attributed to economic reactivation. Ffrench and Heresi [19] affirm that the recessive gap that existed in 2008, plus the decrease of 1.0% in GDP in 2009—despite the destruction caused by the strong earthquake of 27 February 2010 (27-F)—implied a significant space for GDP to be effectively increased based on recovery, beyond the generation of new capacity or potential GDP. In contrast, the crisis of 1999 led to an economic setback exacerbated by the delayed national responses, as can be observed in the trend of in Figure 2, which remains at a low level until 2003.
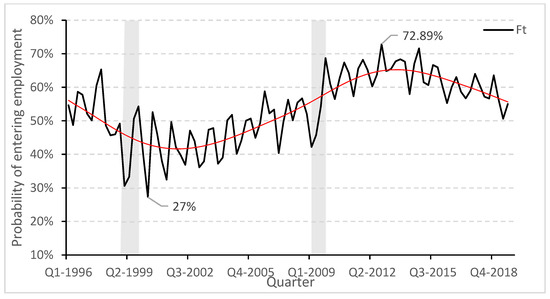
Figure 2.
Probability of entering employment in Chile from 1996 to 2019. Source: Own elaboration.
After 2012, there is a clear downward trend, from which it is shown that entering the stock of employees has become increasingly difficult. We can complement this situation with the fall of the country’s economy. Figure 2 shows a downward trend in the growth of national GDP after 2012. For the recession years, that is, during the Asian and subprime crises, the average quarterly probability of finding employment is 42.20% and 52.71%, respectively. The trend line in Figure 2 was calculated using a Hodrick–Prescott filter with a smoothing parameter. The gray bars correspond to the years in which GDP percentage growth was negative: 1999 and 2009.
3.2. Probability of Leaving Employment
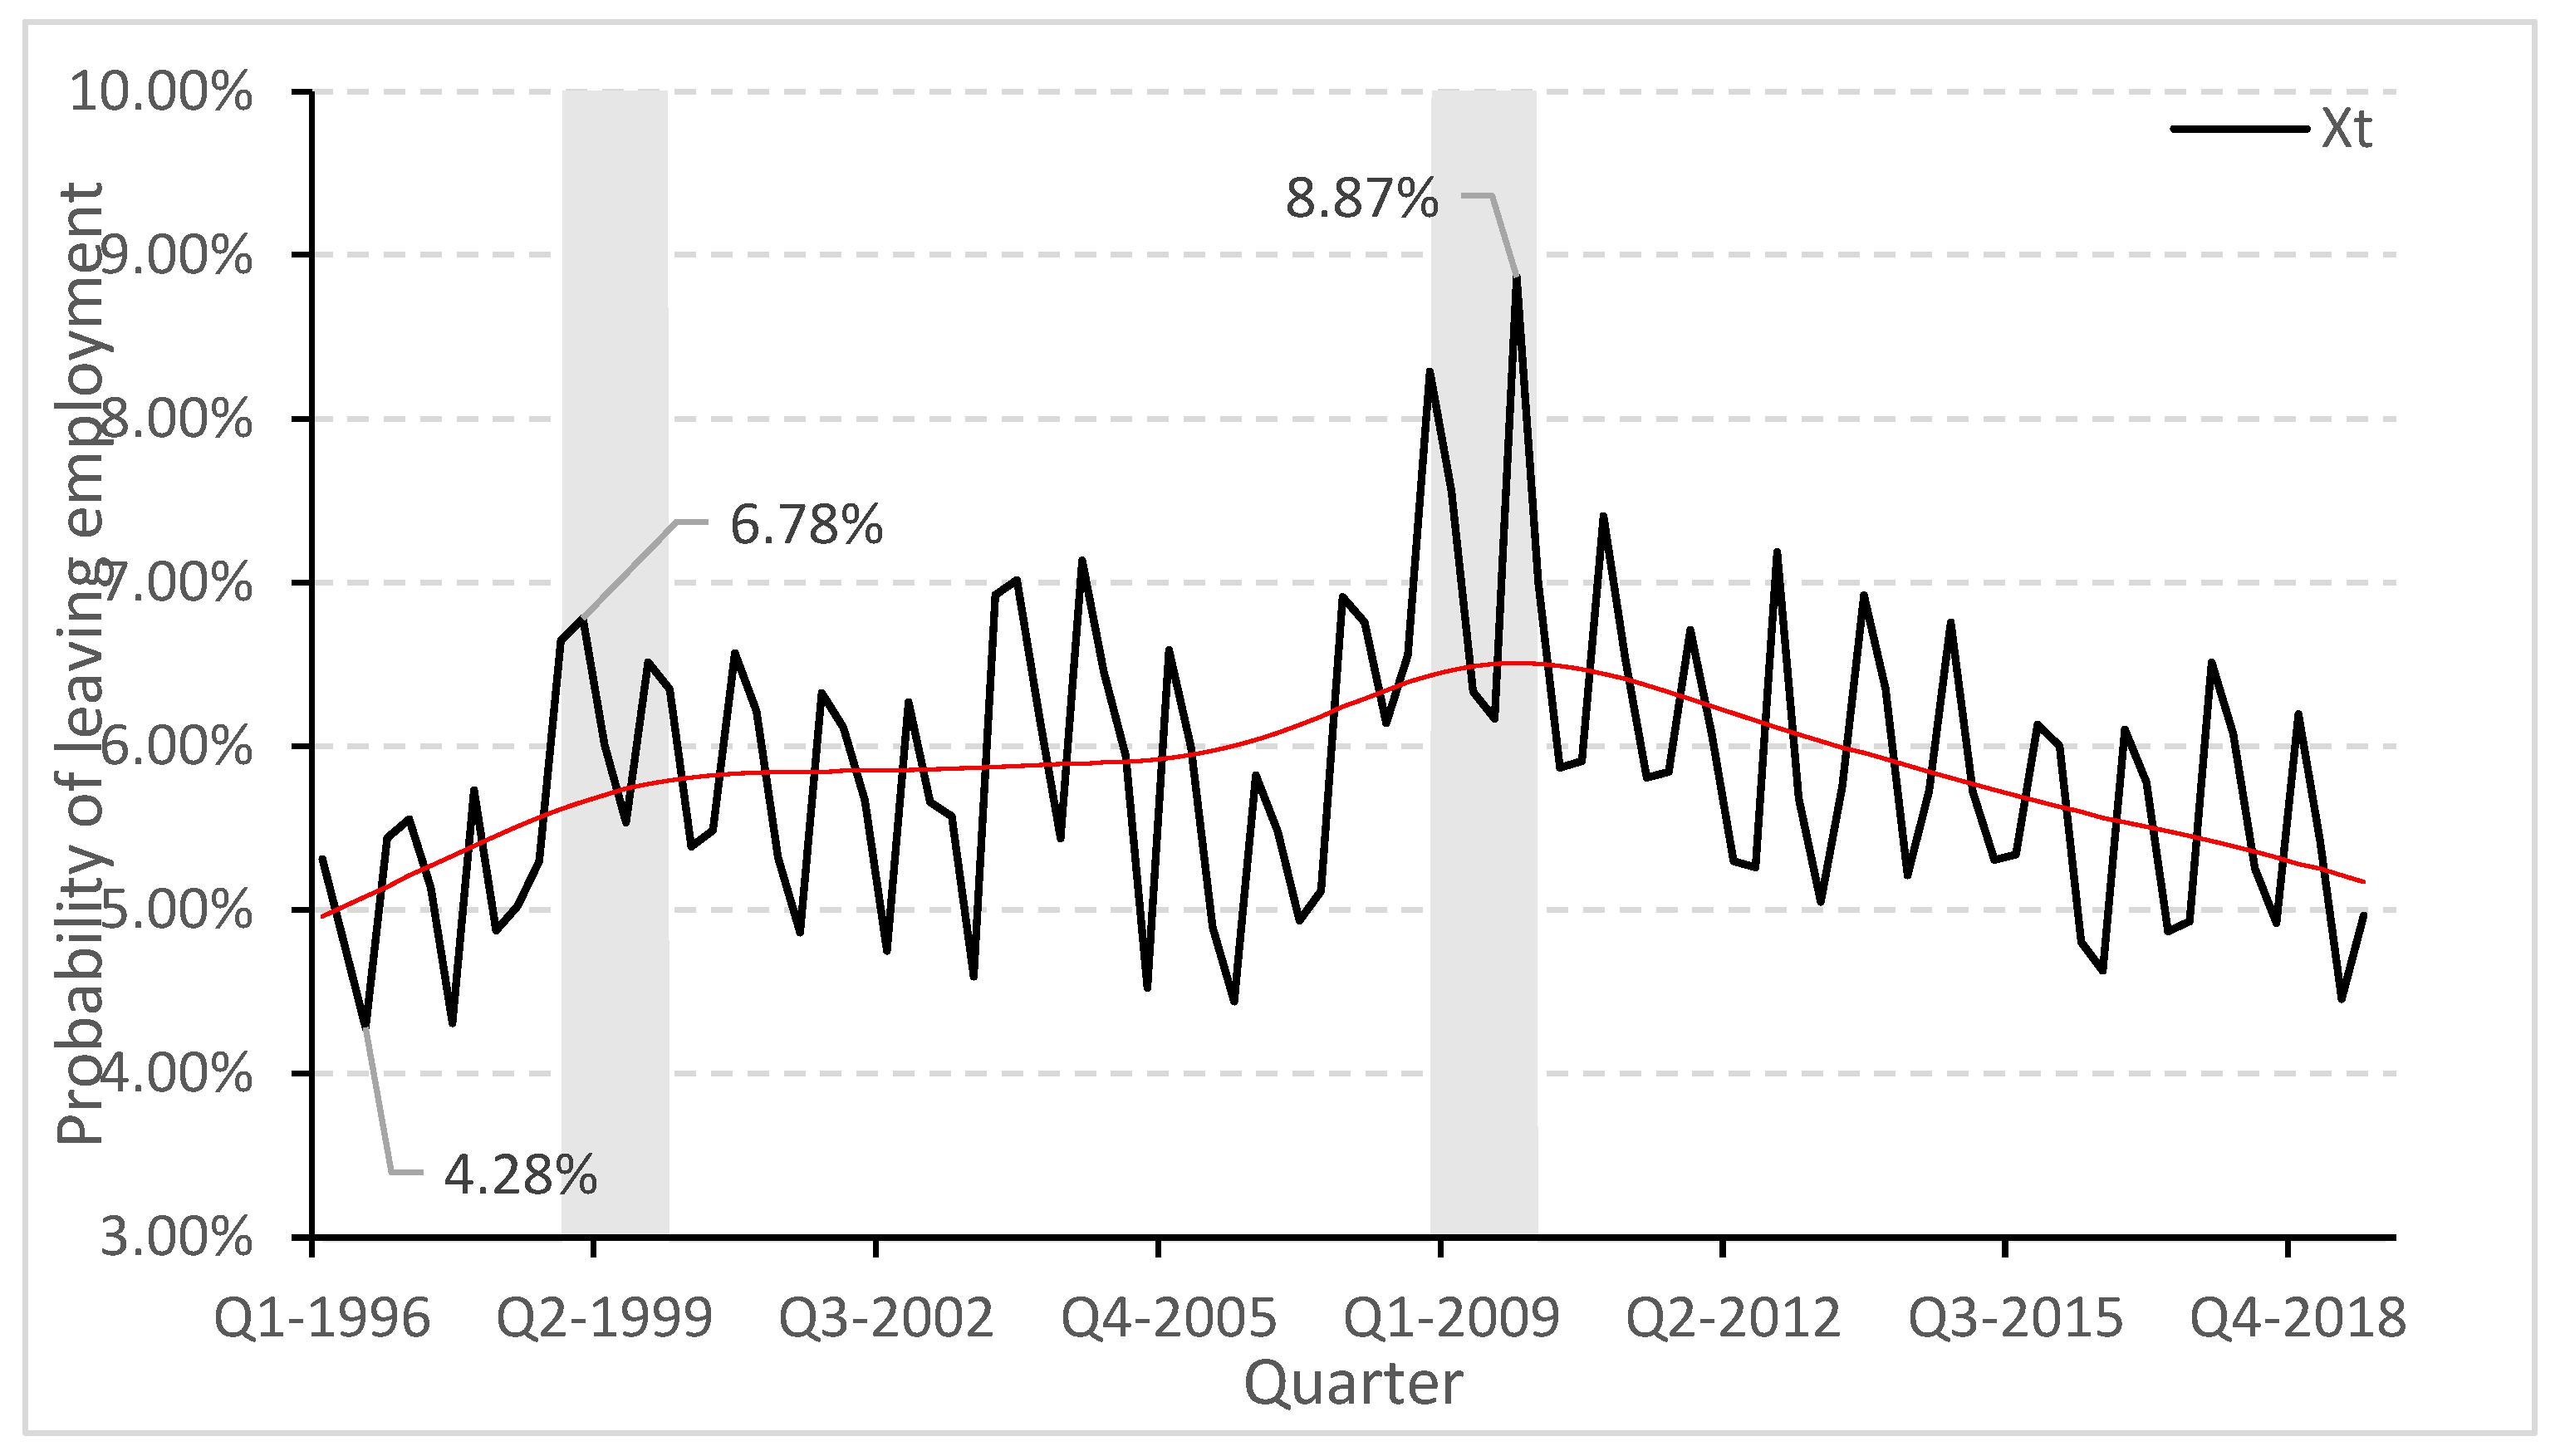
The probability of a worker leaving his or her job for the entire study period is, on average, 5.84%. It is also observed in Figure 3 that there is a rise in this probability during periods of economic recession. During the Asian crisis, there was an increase in the number of workers leaving their jobs, 1.91 percentage points since the first quarter of 1998, reaching 6.78% in the first quarter of 1999. After 1999, the trend presented stability, interrupted by the subprime crisis. This way, the maximum value appears during this period, at 8.87% in the fourth quarter of 2009. However, similar to the probability followed by the 2009 crisis, we see rapid recovery, stabilization, and a downward trend.
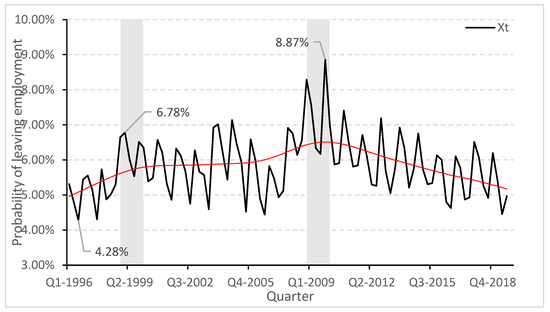
Figure 3.
Probability of leaving employment in Chile from 1996 to 2019. Source: Own elaboration.
Figure 3 shows that during the entire study period, the lowest probability of a worker leaving his or her job is presented in the second quarter of 1996. As mentioned previously, until 1997, Chile was in a golden age; therefore, it is not strange that the minimum is found at the beginning of the period, but it is appreciated that very close values are presented at the end of our study period. The decrease in the probability of the outflow of employment is attributable to a possible type of stability in the national economy that reduces the degree of job loss. The quarterly average values for the years of economic recession were 6.21% in 1999 and 7.23% in 2009. The trend line in Figure 3 and the analysis is similar to Figure 2.
3.3. National and International Employment Flows
The dynamism of the Chilean employment support is still very close to that of several Anglo-Saxon countries, as observed in Figure 4, which presents the monthly flows for countries that are in the Organization for Economic Cooperation and Development (OECD) carried out by [17]. Chile presents an average monthly employment outflow of 2.01% and an average monthly employment inflow of 26.39%. These results are similar to those of other authors who use the same methodology, with the study of [16] presenting the slightest difference. Naudon and Pérez [20] also obtained similar results using data from the occupation and unemployment survey for Greater Santiago (EOD) but with a higher outflow of employment.
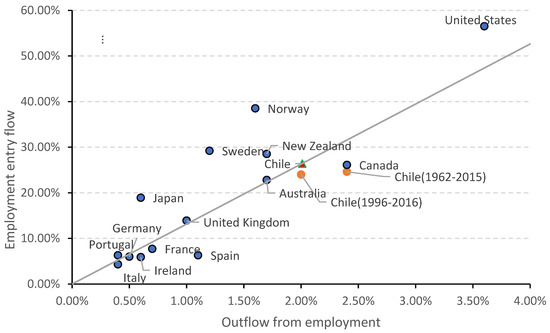
Figure 4.
Average monthly flows in OECD countries. Source: Own elaboration.
Following [20], we draw a line from the origin, where its slope is conditioned, to the steady-state unemployment rate in Chile, for an unemployment rate of 7.06% obtained through (9), with the average values of the flows for entry and exit from employment. This approach allows us to visualize that the countries on the line present a lower unemployment rate than Chile in the period under study, while those countries below the line present a higher steady-state unemployment rate. The line allows us to visualize that in Chile, despite having a more dynamic labor market, the unemployment rate is very similar in value to that of countries with less dynamism in their labor markets, such as Germany, at a rate of 7.69%. It is also possible to observe that the country with the stationary unemployment rate closest to that of Chile is Australia, at 6.94%.
If both probabilities, both entry and exit from employment, maintain the downward trend that has been in place since 2013, added to the fact that the unemployment rate in Chile already shows a value similar to that of European countries, then Chilean employment support would begin to approach the level of dynamism of European employment support.
3.4. Variance in Unemployment
Following the methodology of [15], it is possible to note the contributions of both inflows and outflows to the variation in the unemployment rate. The approximation is also taken into account, , as carried out by [14], due to its almost perfect correlation, which allows for visualization with the real unemployment rate.
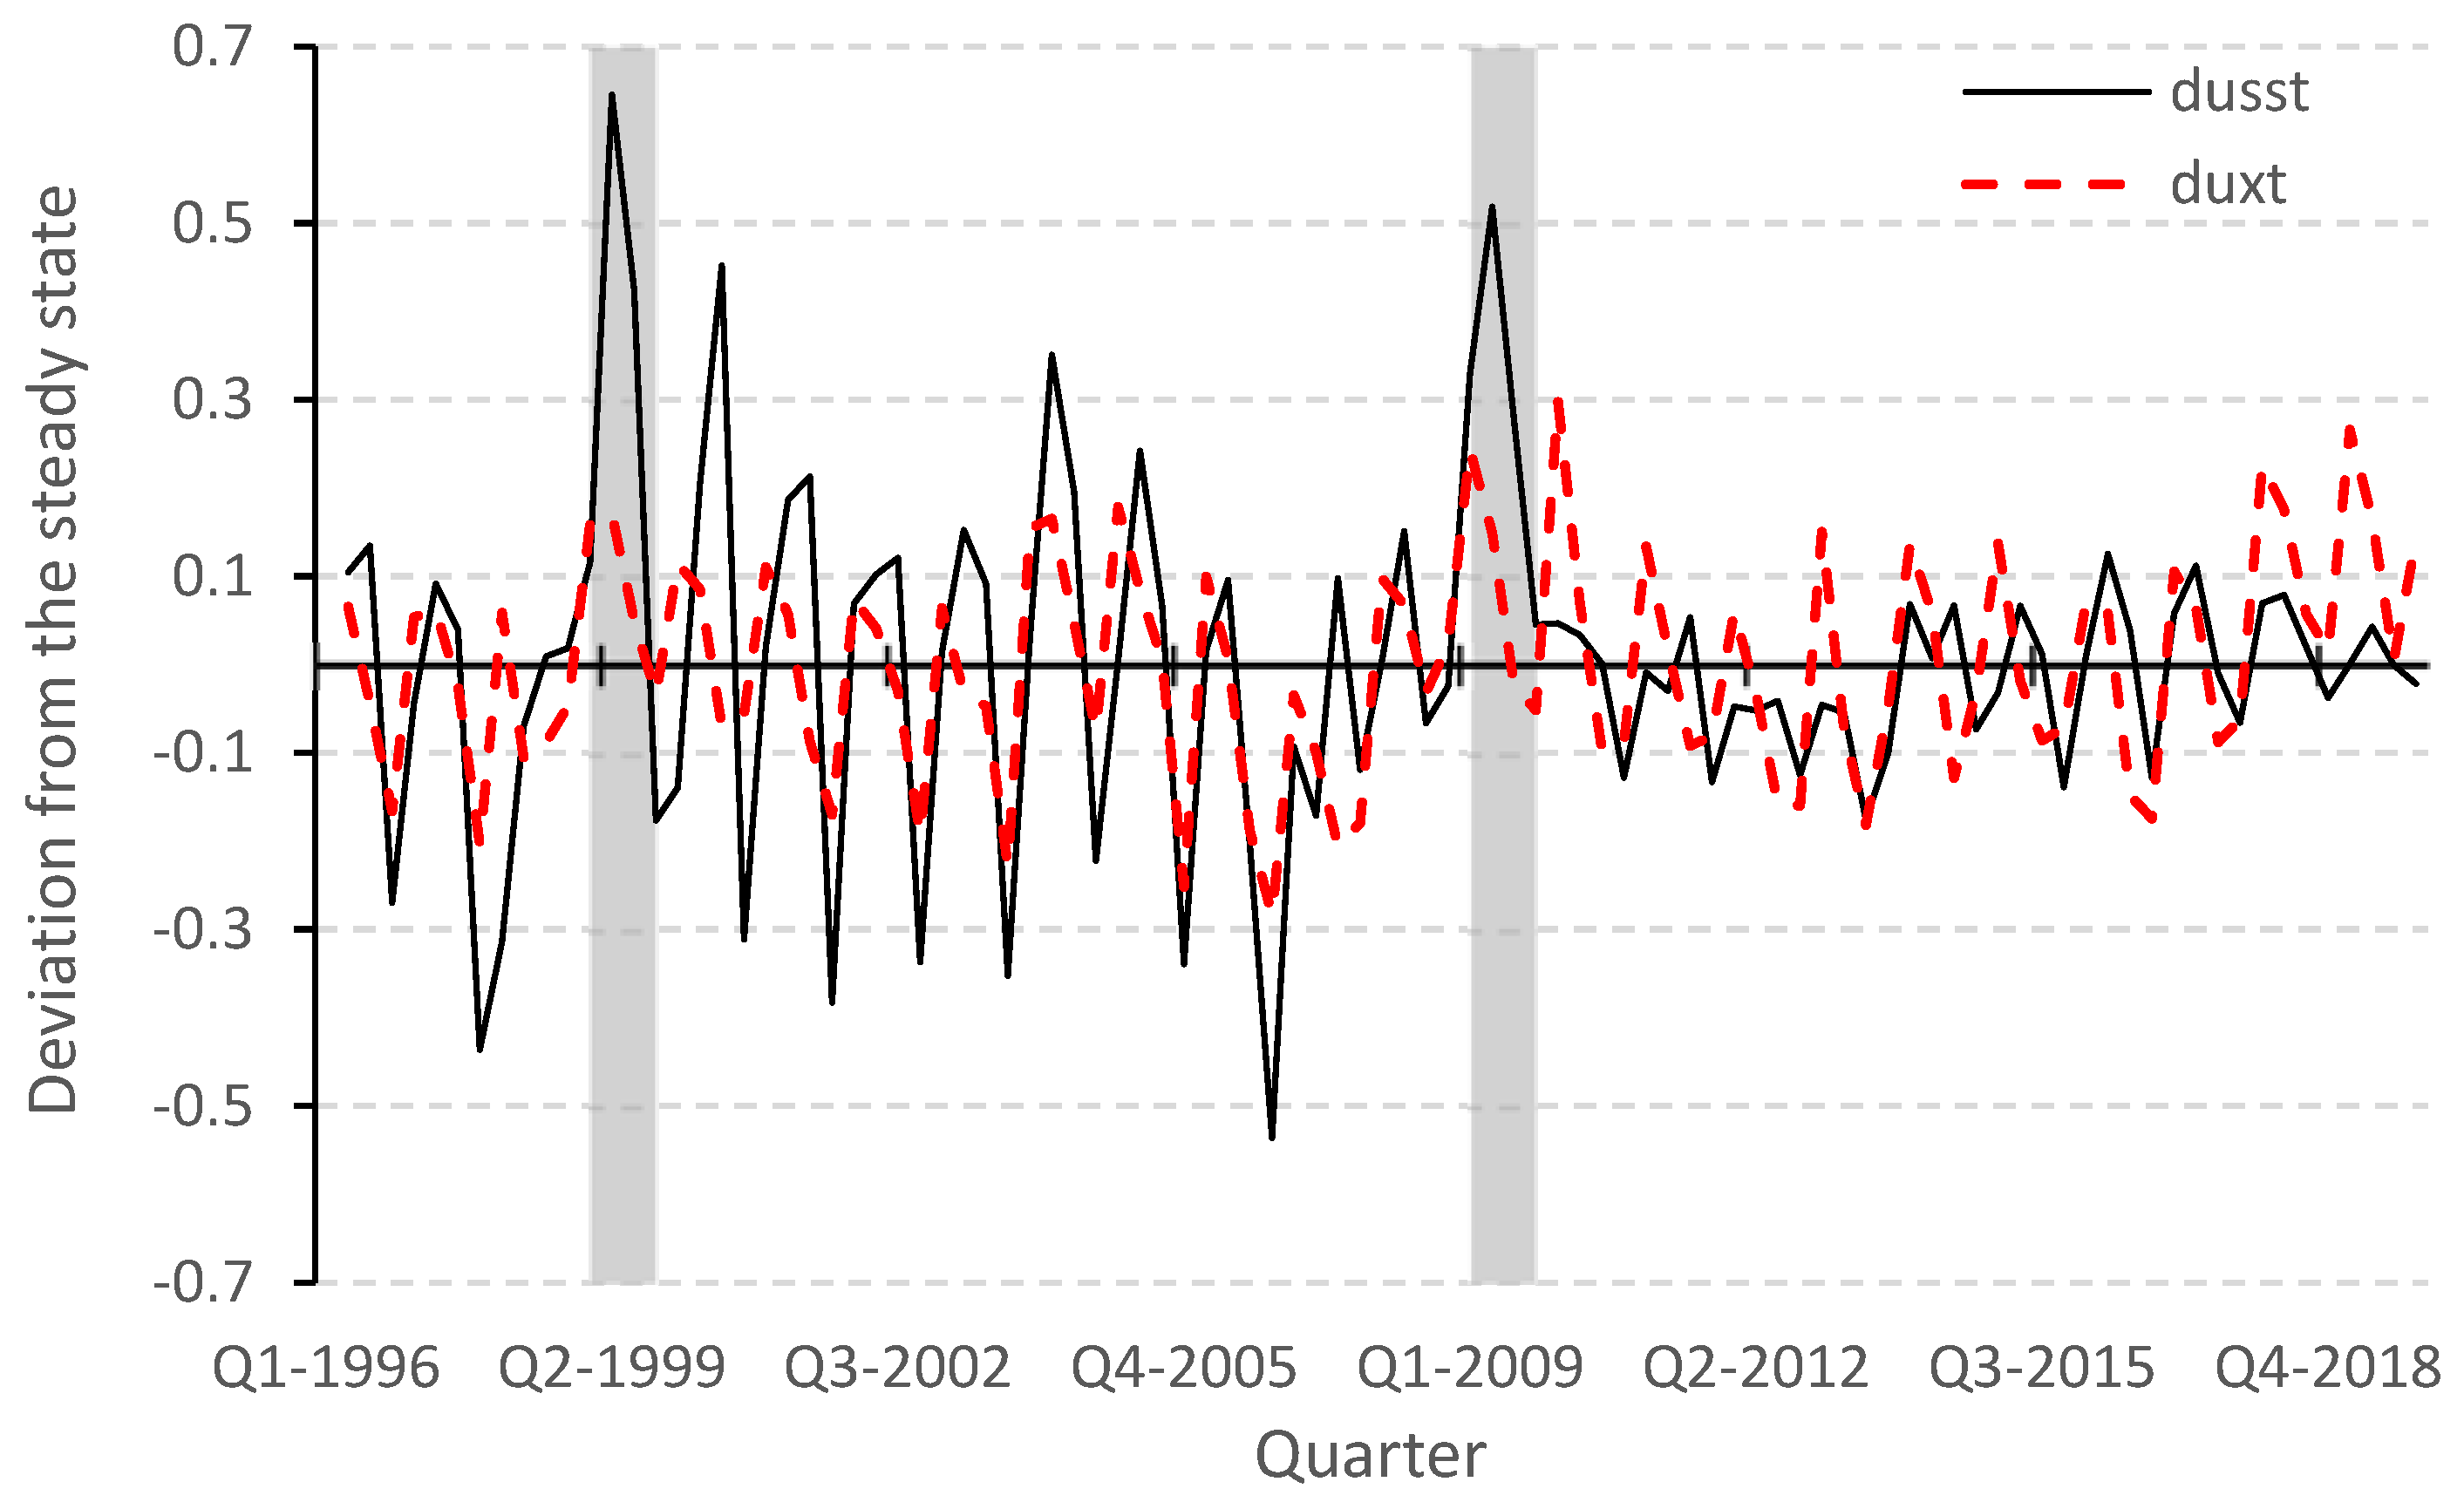
Figure 5 shows how the above factors contribute to the deviations in the steady-state unemployment rate with respect to its trend,, and the deviations with respect to the trend of the inflow to employment . Throughout the period, it is observed that moves with the deviations in the unemployment rate, except for the values presented after the third quarter of 2017, where the deviations present a lower contribution to , becoming inverse to the movement of steady-state unemployment.
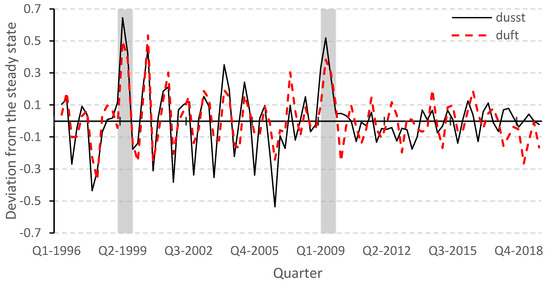
Figure 5.
Contributions of the deviations in the inflow to employment with respect to the steady state. Source: Own elaboration.
Figure 6 presents the contributions for the entire period under the study of to . Similar to , presents movements similar to but with a lower contribution than that of . After the third quarter of 2017, it is observed that the employment exit rate continues to maintain movements similar to steady-state unemployment, very contrary to the information presented in Figure 3 for the entry rate. This approach allows us to suggest that the outflow of employment increases its contributions to the variability in the level of steady-state unemployment at the end of the study period.

Figure 6.
Contributions of the deviations in the rate of exiting employment with respect to the steady state. Source: Own elaboration.
Figure 4 and Figure 5 show that the greatest contributions to the variability in the level of unemployment are from the employment entry rate because it presents movements closer to the deviations in the level of unemployment from the steady state, which is quantified and corroborated in percentages in Equation (13).
Table 1 presents the contributions to the variability in the level of unemployment and the correlations with the deviations in the level of real unemployment with respect to its trend. The exit rate from employment contributes 35% to the variance in the level of unemployment, while the inflow to employment contributes 65%. The aforementioned result is similar to that found by [20] for the period 1960–2015 using data from the occupation and unemployment survey (EOD) for the greater Santiago area carried out by the University of Chile. The above study finds a contribution percentage of the employment entry rate of 53%. López [16] finds very similar results, where 55% of the variability in the level of unemployment can be explained by the employment entry rate.

Table 1.
Analysis of the variance in the level of unemployment for the period from 1996 to 2019.
The only study on Chile in which the conclusion differs from those of the abovementioned studies is that carried out by [21] for the period from 1986 to 2015 with data from the National Employment Survey. The above authors use a similar methodology, but with variations. Moreover, unlike the methodologies used in all the above-mentioned studies, that in this study presents three states since it considers the contributions to the degree of unemployment variability, which can generate changes, to be inactive. Since the rate of entry into employment presents the greatest contribution to the variability in the level of unemployment, the best approach is to formulate and implement policies that increase the number of jobs or policies that facilitate entry into employment.
To visualize the contributions of the inflows and outflows of employment in time intervals, the entire period is divided into five subperiods, and the results are presented in Table 2. These results are complemented with those obtained for the calculated probabilities.
Table 2.
Contributions by time interval.
Table 2 allows us to visualize that prior to 1999, the inflow makes a greater contribution to the variability in the level of unemployment than the outflow does. In this period, it is seen in Figure 3 and Figure 4 that the probability is down and that is on the rise. In 1999 and during the Asian crisis, the contribution of inflow to employment increases its contribution to 85.17%, added to the fact that the probability in 1999 shows a decrease in its increase and a stable trend and that the probability follows a more noticeable downward trend. Therefore, it is clearly attributable that the crisis is related to the lack of job creation rather than to the destruction of the abovementioned factors, which is in accordance with what the results of [22], who determined that the increase in the level of unemployment in the period 1998–2002 is due to the fall in the level of job creation not being accompanied by an equal fall in the size of the economically active population (EAP).
After 1999, the values of such contributions begin to reverse, the size of the contribution from the inflow begins to decrease, and the size of the contribution from the outflow begins to increase. For 2009, in the contributions, we observe very close values, with a difference of only 4.83 percentage points. If we look at the probabilities, then we see that there is a drop in and an increase in for the subsequent recovery of both probabilities to an optimal state, where probability increases and probability decreases. We suggest that such rapid recovery indicates that the economic damage from the subprime crisis is less due to a properly regulated and capitalized banking system and more due to other factors.
For the last period (2010 to 2019), for the first time, the deviations in the outflow of employment with respect to its trend contribute to a greater extent to the variability in the level of unemployment, at 86.69%. For this period, it is important to point out that although the size of the contribution of the outflow increases, the probability of a worker leaving his or her job shows a downward trend, as does the probability of him or her entering a job, but the latter shows a downward trend, dropping only after 2015. Probability is on the decline, and the contribution of the outflow is greater in the period 2010–2019, which allows us to establish that the degrees of layoffs or the destruction of jobs are greater than those of job creation. However, it should be considered that as probability is also on the decline, contributions can be reversed due to the accumulation of the unemployed population that could not enter employment, which would cause a greater drop in probability .
The general results allow us to establish that the inflow at a historical level contributes more to the variability in the level of unemployment than the outflow does, and thus, the measures on which the efforts should focus are active policies for the employment support that seek to achieve job creation. However, without prejudice to the foregoing, the results for the period 2009–2019 should be considered: if the inflow is stabilized, then its contribution to the variability in the level of unemployment is reversed, and efforts should be made in terms of the creation of pro-protection policies for employment. It is also possible that the dynamism of Chilean employment support will decrease over time and that the unemployment rate will be maintained.
3.5. National Policies
Table 3 presents the national response measures taken to end the economic crisis and reduce its effects on national employment support.
Table 3.
Active employment policies implemented during the COVID-19 pandemic.
Numerical superiority is observed according to the number of measures taken to protect employment, at 58.82%, compared to of the number of those that seek to create employment, at 41.18%. Regarding investment, the results are diametrically opposite: approximately 66% of the total investment is for policies that seek or are related to the creation of jobs, which shows that there are measures with high costs. In the case in which no positive results are obtained, losses can lead to a sharp decline in the amount of resources available, and if we consider unemployment in the Chilean employment support as being more affected by job creation, then the negative effects of these policies have even greater economic impacts.
Those policies into which more resources are injected, or in the words of [23], one of the most expensive policies, are those related to private investment and to investment in public works. As announced by President Sebastián Piñera on 16 August 2020, the amount of policies geared toward private investment account for USD 24,521 million, while the amount of policies geared toward investment in public works account for USD 9360 million. The approximate total investment level in the “Chile recovers step-by-step plan” reaches a value of USD 34 billion, which is to be invested in the period from 2020 to 2021. Although the abovementioned hiring incentive programs are geared toward private investment, in this case, a revision to the recovery plan is made, at USD 2 billion. The rest of the values belong to the categories of training and assistance, but no investments are made because such investments are executed through alliances with free benefits.
Regarding the protection of jobs, the following two factors can be highlighted: tax measures that seek to protect employment indirectly and employment protection laws that seek to protect employment directly. Tax measures involve a higher level of investment than does Law 21,227, at USD 16,750 million and USD 2000 million, respectively. A specific impact evaluation by policy or program is not feasible due to the short time from the implementation period of these policies to the completion of this study, and thus, it is impossible to know whether or not these policies are optimal. However, whether it is plausible to infer possible effects from previous studies based on the behavior of the employment support remains to be seen. Based on our results, investing resources and efforts in formulating policies that encourage job creation is the best option; if only investment is considered, then the above two actions can be fully accomplished, but in terms of the resources allocated and the effects generated should be understood.
3.6. Private Investment
Private investment is the policy that is most promoted by the government. Although programs related to the priority management of projects, support for entrepreneurs, SMEs, and MSMEs, among others, are associated, the operation of this type of policy have been questioned. Kluve and Rani [23] state that this type of policy has positive short-term effects that decline over time. Scocco [24] presents a possible cause if the focus is on supporting entrepreneurs, SMEs and MSMEs, noting that the decrease in the number of positive effects is a consequence of the lack of advice over time, which is in accordance with [25], who establishes that the positive results of many entrepreneurship support programs are related to the combination of credit support and technical assistance.
Scocco [24] also mentions that this type of policy, unlike public employment policies, has positive effects on employment but negative effects on income, which can be explained by the fact that many of these policies seek to increase the number of entrepreneurs, SMEs, or MSMEs because doing so increases the employment rate. This is even more true if we consider that approximately 46% of workers are employed by SMEs and microenterprises (Fifth Survey Longitudinal of Companies), but the income is usually at a low level. The Microentrepreneurship Survey of June 2020 (EME) found that almost 50% of microentrepreneurs obtain profits that are equal to only the minimum wage and that more than 70% use their own resources or loans to finance activities; therefore, the small number of positive effects on income are justified. The amount of investment in this type of policy is justified if we consider the aforementioned factors because these activities tend to fail due to the lack of resources of those who carry them out. Additionally, the relationship between SMEs and the large enterprise sector regarding wages often involves a discrepancy. Due to their limited resources and economies of scale, SMEs may offer lower wages than their larger counterparts. This wage disparity can stem from SMEs’ financial constraints, impacting their ability to match the higher salaries provided by more giant corporations. As a result, employees in SMEs may receive comparatively lower remuneration, reflecting the challenges these smaller enterprises encounter in maintaining competitive compensation structures.
While private investment is heavily endorsed by the government as a pivotal policy for economic growth and job creation, potential drawbacks and limitations must be carefully considered. While well-intentioned, the emphasis on supporting entrepreneurs, SMEs, and MSMEs raises concerns about the long-term sustainability of positive outcomes. Some authors highlight the diminishing effects over time, indicating that the initial short-term benefits tend to wane. Indeed, a narrow focus on supporting smaller enterprises may lead to positive effects on employment but negative impacts on income. The justification for the substantial investment in this policy lies in the challenges faced by microentrepreneurs, who often operate with limited resources and need help accessing credit and technical assistance. However, the associated wage disparities within SMEs, where nearly half of the workforce is employed, raise concerns about income inequality. Many microentrepreneurs earn profits equivalent to the minimum wage, and the majority rely on personal resources or loans for financing. In light of these challenges, alternative policy approaches that incorporate a combination of credit support, technical assistance, and a more equitable distribution of income merit consideration to ensure sustained positive impacts on employment and income levels.
3.7. Public Sector Employment
One of the implemented policies seeks to increase the supply of jobs through public works programs with an investment of USD 9360 million. Both global and regional studies agree that most of such programs are less effective than other types of PAML programs. Kluve and Rani [23] state that this type of policy has high government costs and that its effects are mostly positive in the short term, decreasing and even becoming negative in the long term. Martínez [25], in an analysis of various evaluations of PAMT programs in Latin America and the Caribbean (LAC), obtained similar conclusions and added that these policies have a positive impact on income but not on the level of employment.
The possible small impact of such policies in the medium and long terms on employment may be related to the findings of [26], who established that the beneficiaries of these programs are inactive, and thus, this situation does not reduce the level of unemployment in a way that can be considered positive. This effect does not present a designation to date; therefore, we establish this effect as a “phantom unemployment effect”. The term “phantom unemployment effect” refers to a situation in which particular employment or job creation programs, mainly those implemented by the public sector, may temporarily reduce official unemployment figures without creating sustained, meaningful employment opportunities. The concept implies that the beneficiaries of these programs might be classified as employed during the implementation period. However, their temporary employment status only contributes substantially to long-term employment stability. Once the specific projects or programs conclude, individuals considered employed during the initiative may return to unemployment, potentially causing a rebound in overall unemployment levels. This phenomenon suggests that the positive impact on employment, as indicated by short-term measures, may be less substantial and lasting than it initially appears, and the overall effectiveness of such programs in addressing persistent unemployment challenges may be limited.
Such a policy in an economic recession is a dubiously beneficial choice when we consider the costs. Although such policies positively affect the income of the beneficiary families, it must be taken into account that once the period of many of the projects is over, the beneficiaries return to being unemployed, and the level of unemployment may even increase in the long term due to the income levels of the workers changing from inactive to busy during the program.
3.8. Hiring Incentives
The implemented hiring incentives exhibit two aims. The first aim seeks to increase the level of hiring of new personnel for companies, and the second aim seeks to reinstate personnel who had to pause their activities as a result of the pandemic/resection. Kluve and Rani [23], in a study of the European continent, mention that this type of policy increases by 30 to 50%; conversely, Escudero et al. [27] conclude that wage subsidies can increase , particularly if they are assigned directly to individuals as a complement to their income, which is in line with the steps taken by Chile. This type of policy has already been used previously in Chile during recessions. Moreover, during the subprime crisis, the policy focused on low-income youth, as mentioned by [19]. The conclusions of the abovementioned program are as follows: “It can be seen that the estimated impact on occupancy shows a drop in effect for 2010 compared to 2009. This situation allows us to hypothesize that the subsidy has a countercyclical impact”. It is mentioned that this measure can boost employment in periods with high levels of unemployment among vulnerable groups and with low participation. This type of policy is usually assigned to a low-income population that faces difficulty finding employment; in the case of the current policy, it is assigned to a much higher age range and with fewer restrictions.
Because the majority of the effects of this type of policy are presented as positive, the effect of its implementation on the creation of jobs is successful, and there is the future possibility of evaluating the impacts of this program when the age range of the beneficiaries is extended and restrictions are relaxed. Although the reduction in the number of requirements increases the number of beneficiaries and decreases the level of unemployment, this situation can generate negative consequences due to the effects mentioned in Table 3.
3.9. Job Search Assistance
There are two policies of this type implemented during the recession, and both present zero investment due to the formation of alliances. This type of policy usually involves enrollment and monitoring, but in most cases, these actions are taken to complement other programs. This situation is evident in Table 14 of [24], where there are 11 policies of this type associated with another type of program and none by itself. However, if we isolate these policies, then, we can see that they have a positive effect only in the short term, unless parameters that change preferences or employability exist, according to [23]. It should also be considered that in a pandemic or recession, the number of jobs decreases, which is why this type of policy loses its effectiveness [28]. For this type of policy, there is very little information that allows for us to draw a conclusion with greater support, but we can attribute this situation to workers’ preference for other types of channels to obtain employment, such as word of mouth, recommendations, and digital channels that are more personal in nature.
Job search assistance policies typically involve enrollment and monitoring, often in collaboration with external partners or organizations. While these initiatives might be cost-effective regarding direct financial investment, their effectiveness in reducing unemployment or facilitating long-term job placements can be subject to certain limitations. Firstly, the effectiveness of job search assistance programs may be influenced by the overall economic conditions and job opportunities in the labor market. In periods of economic recession or downturn, when job openings are scarce, individuals seeking employment may face more significant challenges in securing suitable positions, even with assistance. Secondly, the success of job search assistance relies on the methods employed and the preferences of job seekers. If individuals prefer alternative channels for job searches, such as personal networks, online platforms, or recommendations, the impact of formal job search assistance programs may be diminished.
Additionally, the duration of effectiveness is a crucial factor. Job search assistance programs might yield positive outcomes in the short term by helping individuals secure immediate employment. However, the sustainability of these placements and their ability to contribute to long-term career development may vary. Furthermore, the effectiveness of minimal investment in job search assistance could be contingent on the specific demographics and needs of the job-seeking population. Tailoring assistance programs to address different groups’ unique challenges, such as young job seekers, career changers, or individuals with specific skill sets, could enhance their impact.
Training
Among the different types of PAML programs, the most used and evaluated both globally and regionally is investment in human capital. Card et al. [29], in their study of 857 estimates of PAML effects, approximately find that 50% of such programs are education or training programs. Kluve and Rani [23], in a study on ALyC, analyze 152 estimates of impacts, where 126 are for training and education, an approach repeated in many studies. Only one program that involves training is presented until the date established during the recession caused by the pandemic, and through an alliance with Coursera, free licenses are delivered digitally for various disciplines.
Regarding the efficacy of these studies, the results are mixed. Card et al. [29] establish that these policies are mostly effective in the medium and long terms, which differs from the results of [23,24,27], who establish that these programs are effective mostly in the short term, although specifically for ALyC. One hypothesis is that this response, which is contrary to that in the world sample, is a consequence of the procyclical nature of this type of policy in the region [25] because the same economic boom can reduce the degree of efficiency of such programs. An important point to bear in mind is that this type of policy is not necessarily aimed at the unemployed, since employed personnel can be trained, which also reduces the degree of the effect of such policies on the level of unemployment.
The findings outline a comprehensive analysis of the Chilean employment support dynamics from 1996 to 2019. It focuses on the probabilities of entering and leaving employment, their contributions to employment variability, and the impact of historical economic crises. The key findings include the following:
- Probability of Entering Employment: The average probability of entering employment over the study period is 53.60%. The analysis reveals fluctuations in this probability, with a notable decrease after the Asian crisis in 1999, reaching a low of 27.23% in 2000, followed by an upward trend until a peak of 72.89% in 2012. Despite the 2008 subprime crisis, a rapid recovery and continuous upward trend were observed until 2012, which can be attributed to economic reactivation.
- Probability of Leaving Employment: The average probability of leaving employment is 5.84%, showing an increase during economic recessions. The Asian crisis in 1999 and the subprime crisis in 2009 led to higher probabilities of workers leaving their jobs. However, both crises were followed by rapid recovery, stabilization, and a downward trend in the probability of leaving employment.
- National and International Employment Flows: The Chilean employment support exhibits dynamics similar to those of several Anglo-Saxon countries. The monthly flows for OECD countries indicate an average monthly employment outflow of 2.01% and an inflow of 26.39% in Chile. Despite the dynamic employment support, the unemployment rate in Chile is similar to countries with less dynamic labor markets, such as Germany.
- Variance in Unemployment: The study employs a methodology to assess the contributions of inflows and outflows to the variation in the unemployment rate. The analysis suggests that the employment entry rate contributes more significantly to the variability in the level of unemployment (65%) compared to the exit rate (35%).
- National Policies during the COVID-19 Pandemic: The study evaluates active employment policies implemented during the pandemic, including private investment, public sector employment, hiring incentives, job search assistance, and training. Results indicate a numerical superiority of measures to protect employment (58.82%), with approximately 66% of total investment directed toward job creation.
- Private Investment: The government emphasizes private investment policies, aiming to support entrepreneurs, SMEs, and MSMEs. While these policies have positive short-term effects, studies suggest diminishing impacts over time. Private investment policies may positively impact employment but negatively affect income.
- Public Sector Employment: Public works programs to increase job supply are highlighted with an investment of USD 9360 million. Studies suggest that such policies have high government costs and positive short-term effects, diminishing in the long term.
- Hiring Incentives: Implemented hiring incentives show positive effects, particularly in countering cyclical impacts. These policies aim to increase hiring, with positive short-term outcomes observed in similar programs during the subprime crisis.
- Job Search Assistance and Training: Policies related to job search assistance and training present mixed results. While training programs are widely used globally, their effectiveness varies, with some studies suggesting positive impacts in the medium and long term, contrasting with regional findings of short-term effectiveness.
The results emphasize the need for policies encouraging job creation, focusing on active measures to increase employment. The study suggests that despite the dynamic nature of Chilean employment support, efforts should be directed toward creating pro-employment policies, especially during economic downturns.
4. Concluding Remarks
This paper proposes a methodology involving market flows to assess Chilean employment support policies between 1996 and 2019 based on the proposals of [14,15]. The proposed methodology is analyzed with data obtained from the National Institute of Statistics (INE), establishing flows and probabilities of entry and exit from employment and their contributions to the variability in the level of unemployment. The results contribute positively to the limited amount of information available regarding the methodology in question.
To date, and present values that are very similar to those found prior to the Asian crisis, with the exception that to date, the probability of a worker leaving employment shows a downward trend. Chile, despite having a dynamic employment support comparable to that of Anglo-Saxon countries, presents unemployment rates very similar to those of countries with lesser dynamism, such as Germany, France, and Italy. If we combine this result with the decreasing probabilities and , then there is the possibility that Chilean employment support will begin to approach the dynamic behavior of European markets.
Through the methodology in this work, it is possible to establish that historically, the Chilean employment support has been more affected by variations in the inflow to employment. Because the deviations of steady-state unemployment with respect to its trend are more affected by the variations in the deviations of the rate of entry to employment with respect to its trend, at 65.14%, which translates into the lack of job creation or high variations in the existence of jobs being seen as the main cause of unemployment, focusing on the development of policies in favor of job creation is most beneficial.
The use of a longer study period than those in other studies and the fractioning of this period allow us to visualize that after the subprime crisis (2010–2019), the contributions are invested, becoming increasingly significant in terms of the impact of the loss of jobs on the level of unemployment. With an approximate 87% contribution to the variability in the level of unemployment, if such job losses are maintained over time, then Chilean employment support will be more affected by the destruction than by the creation of jobs. Moreover, attention should be paid to the effectiveness of employment protection policies and to how to improve them. It should also be considered that the probability is on the decline and, thus, that contributions can be reversed due to the accumulation of the unemployed population, which causes a decline in the probability .
If we consider that the measures applied to the Chilean employment support to deal with the economic crisis are set in a certain way according to the dynamism of this labor market during the study period, then very important exceptions can be realized. Private investment policies that also involve the contemplation of whether or not to provide hiring incentive programs possibly have the greatest positive impact on the level of unemployment among all policies. Regarding public employment policies, if the phantom unemployment effect is not treated, then we see negative effects in the long term. Regarding intermediation and training, they may not have a strong impact on unemployment because these types of policies depend on the economic cycle itself. If we consider the period of recession through which the country is going, then the effects of such policies are diminished, but if it is possible to carry out low-cost programs such as those presented above, then their implementation can have a positive impact.
Within public employment policies, emphasis should be placed on the effect generated after the end of the program to avoid an increase in the level of long-term unemployment (phantom unemployment). A labor relocation program that meets the needs of workers and can integrate them into other projects in the public area can reduce the long-term negative effect. Otherwise, such policies are not a good option in periods of recession because their positive impacts are minimal both outside and within recessive periods; thus, it is advisable to optimize and control the use of resources for these policies.
Because private investment in projects has advisory problems for beneficiaries, additional help should be provided; moreover, platforms that facilitate access to information and their associated training programs should be taken into account because beneficiaries may not have the necessary knowledge to efficiently develop certain projects.
Training and education programs can be an optimal way to increase workers’ employability, thus reducing unemployment in the short or medium term. Associating this type of program with job search assistance is usually more beneficial, especially if a work practice accompanies it; the latter can mutate into digital forms if we consider the world events at the time of this study. Although this type of program tends to have positive effects if it is implemented on the population of young individuals aged between 18 and 25 years, training for all age ranges of the population should be provided in the same way that the information that makes known the existence of these programs to the population is provided.
Employment subsidy programs have mostly positive effects on employment, increasing the probability of a worker entering employment; therefore, it is recommended that the amount of investment in this type of policy be increased to increase the duration of such a policy. Additionally, a future analysis of the policy presented in this study would be beneficial for the literature because it would present a program with very few restrictions and an upper limit for the age of the beneficiaries that would be higher than usual. In general, for all policies, additional in-depth evaluations should be carried out because many such policies in the literature are studied only in terms of their effect on income, or priority is given to their effect on employment support.
The extensive analysis of Chilean employment support spanning the years 1996 to 2019 provides valuable insights into the dynamics of employment probabilities, their contributions to unemployment variability, and the impacts of historical economic crises. The study underscores the significance of active policies fostering job creation, particularly during times of recession. Notably, the probability of entering employment emerges as a critical driver of unemployment fluctuations, contributing substantially more to variability than the exit rate. Despite the Chilean labor market’s dynamism, mirrored by international flows, the unemployment rate aligns with countries with less dynamic markets. As the nation navigates the challenges posed by the COVID-19 pandemic, the evaluation of implemented policies reveals a numerical emphasis on measures to protect existing employment. While private investment policies and hiring incentives show positive short-term effects, considerations of long-term impacts and potential diminishing returns are vital. The findings advocate for a nuanced approach, balancing protective measures with a sustained focus on creating jobs, supported by robust policies and strategic investments. As Chile progresses, the study suggests that continuous monitoring and adaptation of policies will be crucial for maintaining a dynamic and resilient employment support.
To promote the use of search assistance programs such as digital job fairs, the costs of these policies are meager, and the current situation presents an opportunity to increase their use. Regarding the methodology and study, a survey allowing information on the employment status of the national population to be obtained monthly would facilitate the understanding and analysis of the employment support policies.
As future research works, we propose the following aspects:
- Test different variables for measuring the robustness tests.
- Apply different criteria for measuring market labor policies and their impact on the employment rate.
- Make a comprehensive evaluation of the employment subsidy program presented in the study, focusing on its long-term impact and effectiveness across different age groups.
- Explore the effectiveness of private investment policies and hiring incentive programs in the long term.
- Analyze the design and implementation of labor relocation programs aimed at integrating workers into other public projects after the conclusion of employment programs.
- Evaluate the long-term impact of specific policies, understand post-program effects dynamics, explore the digital transformation of training programs, and implement more frequent surveys for real-time insights into the employment support.
Author Contributions
Conceptualization, Y.A.C.-R.; Methodology, Y.A.C.-R., R.L., G.M.-V. and J.W.E.; Software, Y.A.C.-R. and R.L.; Validation, R.L. and J.W.E.; Formal analysis, Y.A.C.-R.; Investigation, Y.A.C.-R. and G.M.-V.; Data curation, Y.A.C.-R.; Writing—original draft, R.L. and J.W.E.; Visualization, Y.A.C.-R. and J.W.E.; Supervision, R.L.; Project administration, G.M.-V.; Funding acquisition, R.L. All authors have read and agreed to the published version of the manuscript.
Funding
We are grateful for the grants from projects UBIOBIO GI 2380142, UBIOBIO 2260222 IF/R, and ANID FONDECYT REGULAR 1230125.
Data Availability Statement
Data are contained within the article.
Conflicts of Interest
The authors declare no conflict of interest.
References
- OECD. La Economía Mundial en la Cuerda Floja. 2020. Available online: https://www.oecd.org/perspectivas-economicas/junio-2020/#key-impacts (accessed on 18 May 2023).
- Petrongolo, B.; Pissarides, C.A. The ins and outs of European unemployment. Am. Econ. Rev. 2008, 98, 256–262. [Google Scholar] [CrossRef]
- Silva, J.I.; Vázquez-Grenno, J. The ins and outs of unemployment in a two-tier labor market. Labour Econ. 2013, 24, 161–169. [Google Scholar] [CrossRef]
- Sengul, G. Ins and outs of unemployment in Turkey. Emerg. Mark. Financ. Trade 2014, 50, 28–44. [Google Scholar] [CrossRef]
- Kim, S.; Lee, J. Accounting for ins and outs of unemployment in korea. Korea World Econ. 2014, 15, 17–44. [Google Scholar]
- Daouli, J.; Demoussis, M.; Giannakopoulos, N.; Lampropoulou, N. The ins and outs of unemployment in the current Greek economic crisis. South-East. Eur. J. Econ. 2015, 13, 2. [Google Scholar]
- Borowczyk-Martins, D.; Lalé, E. The ins and outs of involuntary part-time employment. Labour Econ. 2020, 67, 101940. [Google Scholar] [CrossRef]
- Lydon, R.; Simmons, M. The ins and outs of the gender unemployment gap in the OECD. Cent. Bank Irel. Res. Tech. Pap. 2020, 8, 1–55. [Google Scholar]
- Ductor, L.; Grechyna, D. Determinants of ins and outs of unemployment. Appl. Econ. Lett. 2020, 27, 892–898. [Google Scholar] [CrossRef]
- Borowczyk-Martins, D.; Lalé, E. Data for the ins and outs of involuntary part-time employment. Data Brief 2021, 34, 106686. [Google Scholar] [CrossRef]
- Fontaine, I. The Conditional Ins and Outs of French Unemployment. Macroecon. Dyn. 2021, 25, 1810–1841. [Google Scholar] [CrossRef]
- Carrillo-Tudela, C.; Launov, A.; Robin, J.M. The fall in German unemployment: A flow analysis. Eur. Econ. Rev. 2021, 132, 103658. [Google Scholar] [CrossRef]
- Moreira, A.; Foguel, M.N.; Corseuil, C.H. The ins and outs of unemployment over different time horizons. Empir. Econ. 2021, 60, 2533–2556. [Google Scholar] [CrossRef]
- Shimer, R. Reassessing the ins and outs of unemployment. Rev. Econ. Dyn. 2021, 15, 127–148. [Google Scholar] [CrossRef]
- Fujita, S.; Ramey, G. The cyclicality of separation and job finding rates. Int. Econ. Rev. 2009, 50, 415–430. [Google Scholar] [CrossRef]
- López, F. Dinámica de los flujos de entrada y salida de desempleo en Chile 1996–2016. Rev. Anál. Econ. 2018, 33, 3–4. [Google Scholar]
- Elsby, M.W.; Hobjin, B.; Sahin, A. Unemployment Dynamics in the OECD. Rev. Econ. Statics 2013, 95, 530–548. [Google Scholar] [CrossRef]
- Hodrick, R.J.; Prescott, E. Post-War U.S. Business Cycles: An Empirical Investigation; Discussion Papers 451; Center for Mathematical Studies in Economics and Management Science, Northwestern University: Evanston, IL, USA, 1981. [Google Scholar]
- Ffrench-Davis, R.; Heresi, R. La Economía chilena frente a la crisis financiera: Respuestas contra cíclicas y desafíos pendientes. Universidad de Chile. Departamento de Economía. 2014. Available online: https://repositorio.uchile.cl/handle/2250/122759 (accessed on 18 May 2023).
- Naudon, A.; Pérez, A. Unemployment Dynamics in Chile: 1960–2015. Banco Central de Chile. Econ. Chil. 2018, 21, 1. [Google Scholar]
- Marcel, M.; Naudon, A. Documento de Trabajo N° 787: Transiciones Laborales y la Tasa de Desempleo en Chile. 2016. Available online: https://www.bcentral.cl/detalle-noticias-y-publicaciones/-/asset_publisher/Exzd7l9NC3Y6/content/id/1772784 (accessed on 18 May 2023).
- Cowan, C.A.; McDonnell, P.A.; Levit, K.R.; Zezza, M.A. Burden of health care costs: Businesses, households, and governments, 1987–2000. Health Care Financ. Rev. 2002, 23, 131. [Google Scholar]
- Kluve, J.; Rani, U. A Review of the Effectiveness of Active Labour Market Programmes with a Focus on Latin America and the Caribbean; ILO: Geneva, Switzerland, 2016. [Google Scholar]
- Scocco, N. El Impacto de las políticas activas del mercado del trabajo: El caso de Chile en América Latina. Universidad de San Andrés. 2018. Available online: http://hdl.handle.net/10908/16553 (accessed on 18 May 2023).
- Martínez, D. Políticas Activas de Mercado de Trabajo para generar empleo y mejorar la calidad de los empleos en América Latina. Santiago Com. Econ. Am. Lat. Caribe 2016, 30, 1–73. [Google Scholar]
- Buchelli-Aguirre, E.E. Analysis of the perception of city-region (Bogotá-Cundinamarca) and marketing management in the productive projects of the internally displaced people located in the municipality of Fusagasuga, Cundinamarca, Colombia. Cuad. Contab. 2010, 11, 239–271. [Google Scholar]
- Escudero, V.; López Mourelo, E.; Pignatti, C. Soluciones Eficaces Políticas Activas del Mercado de Trabajo en América Latina y el Caribe; Studies on Growth with Equity; ILO: Geneva, Switzerland, 2016. [Google Scholar]
- Farné, S. Programas de Empleo Público en América Latina. 2016. Available online: https://repositorio.cepal.org/items/878a1dea-a79b-4c71-b7b0-5f93b271e2ce (accessed on 18 May 2023).
- Card, D.; Kluve, J.; Weber, A. What works? A meta analysis of recent active labor market program evaluations. J. Eur. Econ. Assoc. 2018, 16, 894–931. [Google Scholar] [CrossRef]


Disclaimer/Publisher’s Note: The statements, opinions and data contained in all publications are solely those of the individual author(s) and contributor(s) and not of MDPI and/or the editor(s). MDPI and/or the editor(s) disclaim responsibility for any injury to people or property resulting from any ideas, methods, instructions or products referred to in the content. |
© 2024 by the authors. Licensee MDPI, Basel, Switzerland. This article is an open access article distributed under the terms and conditions of the Creative Commons Attribution (CC BY) license (https://creativecommons.org/licenses/by/4.0/).