
The Connection between Phuket’s Water Supply and the Hotel Sector’s Water Use for Assessment of Tourism Carrying Capacity

 , ,
, ,
Abstract
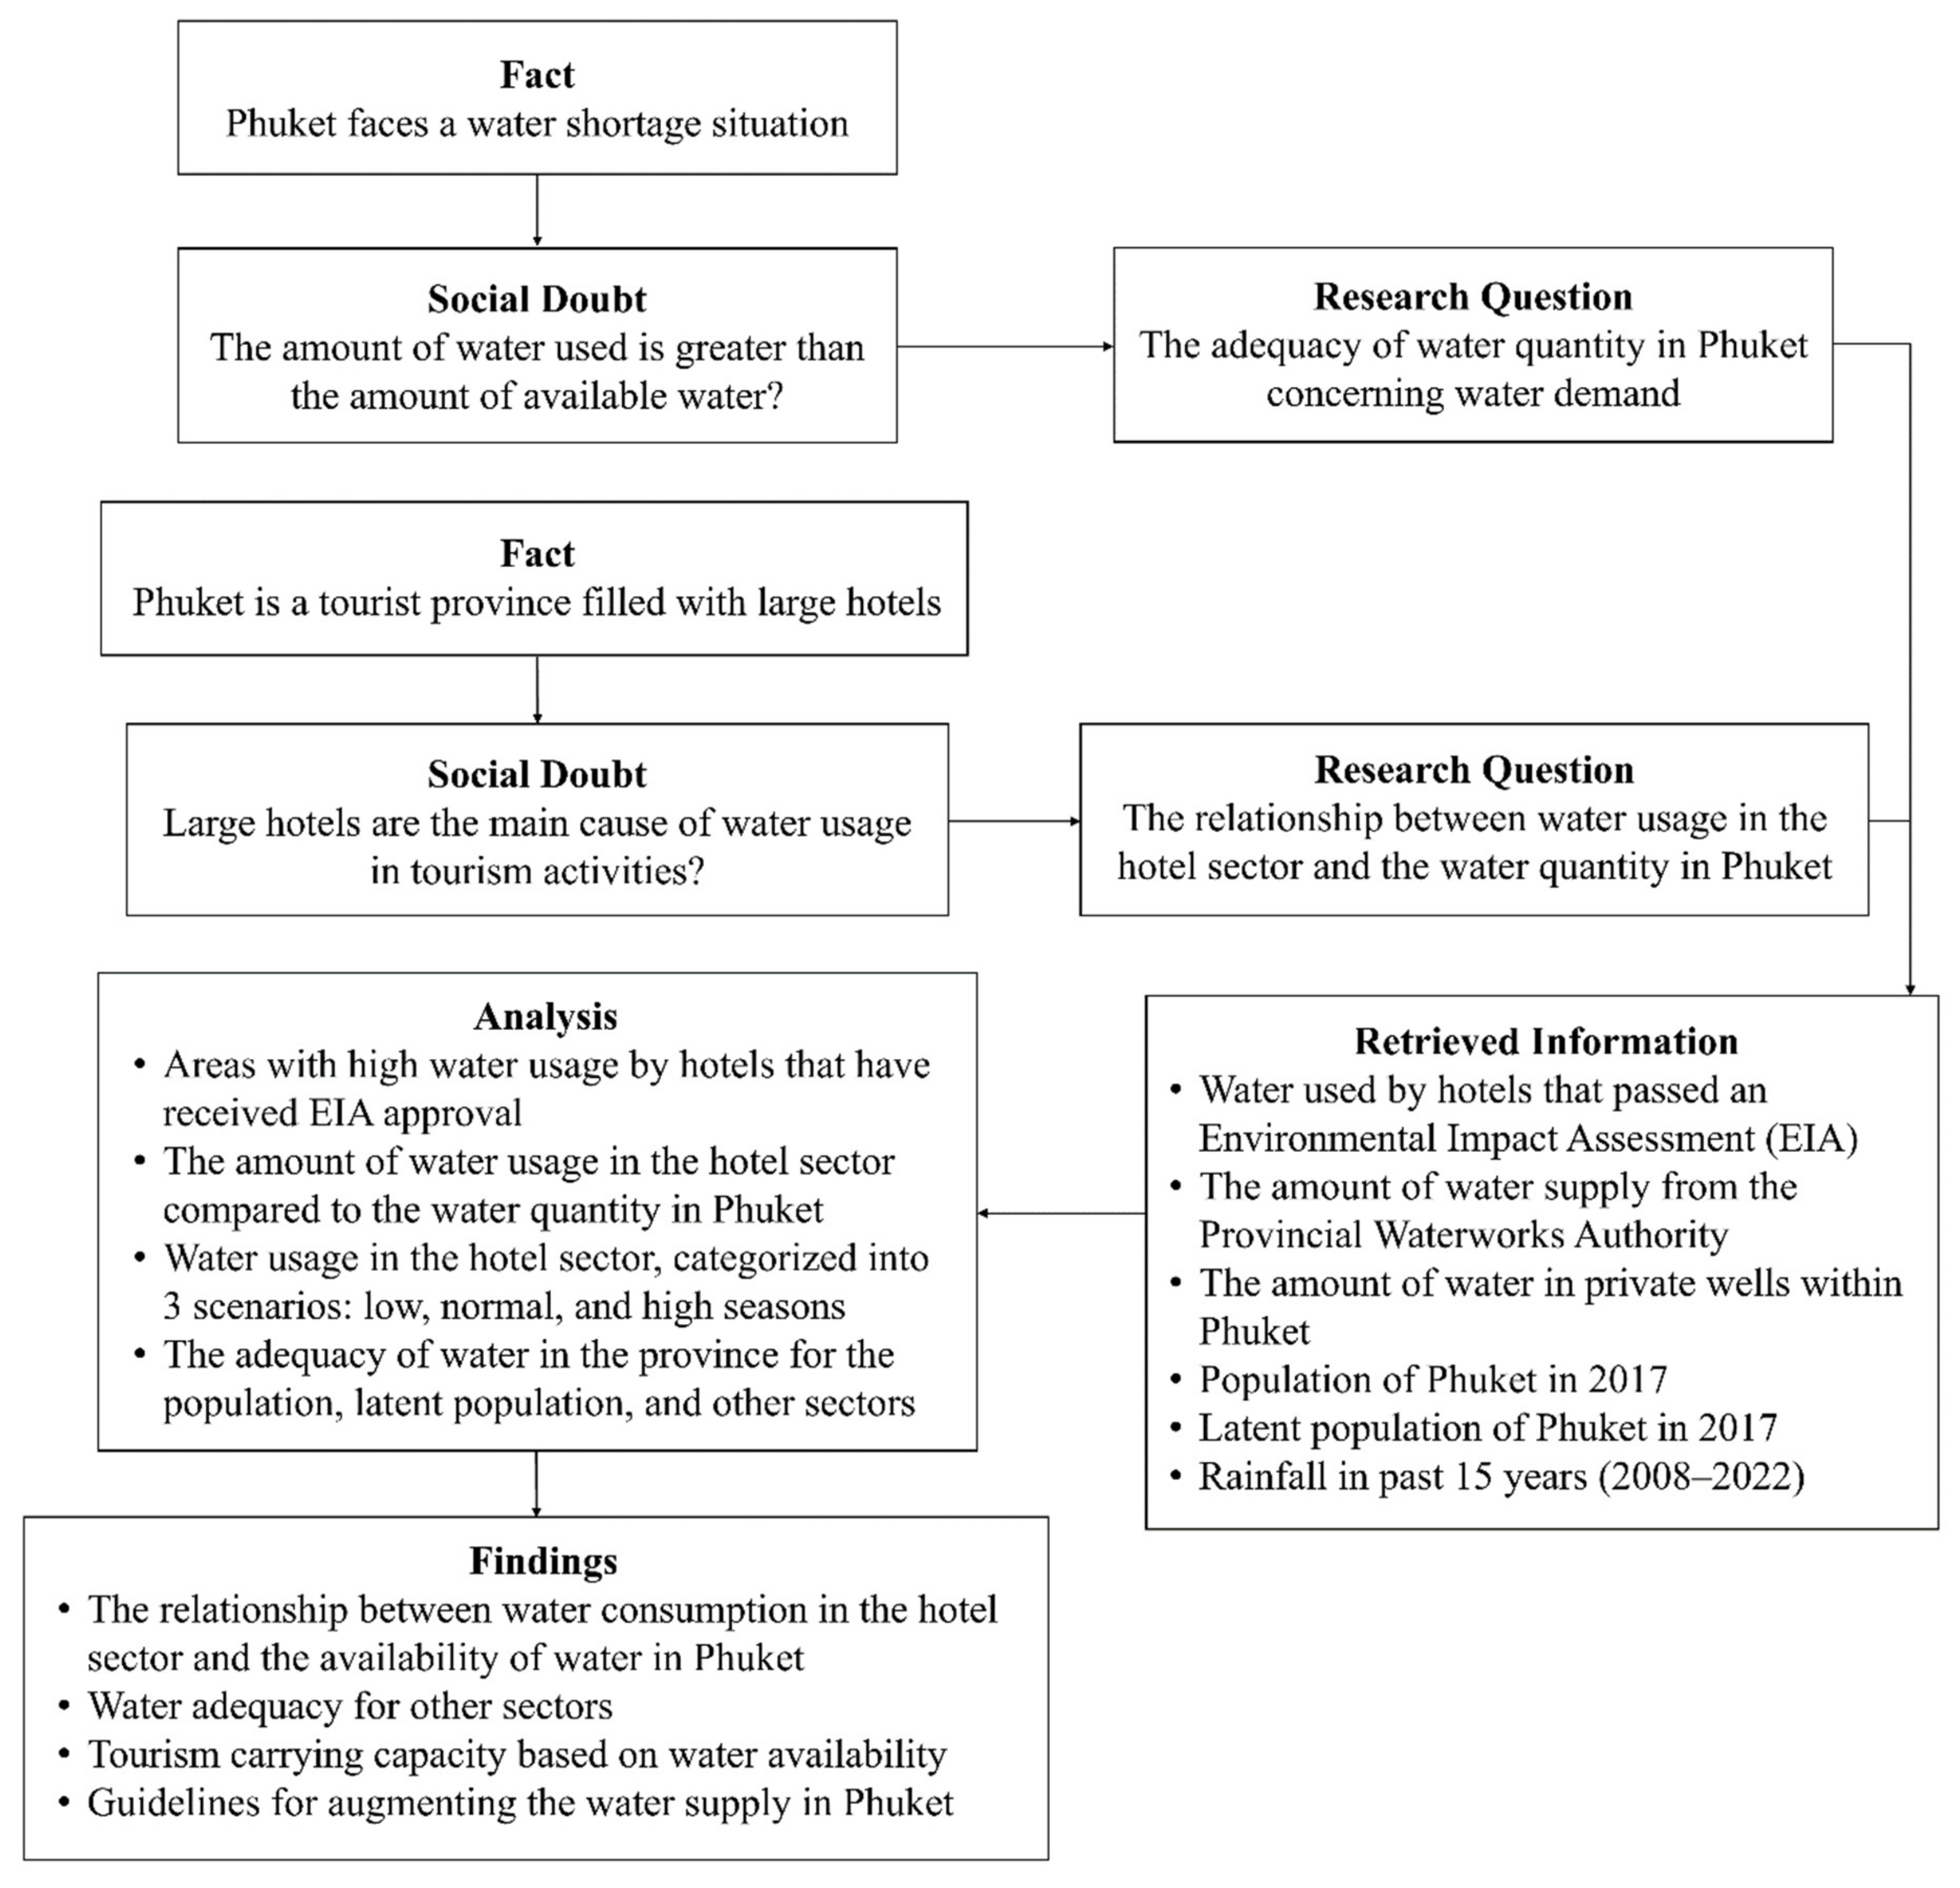
1. Introduction
2. Materials and Methods
2.1. Study Area
2.2. Data Collection
- (1)
- Analysis of water quantity in Phuket Province that can be calculated from the following equation:where Xt = Total water amount in Phuket province (m3/year)Xt = Xa + Xb + XcXa = water amount from the Provincial Waterworks Authority, Phuket branch (m3/year)Xb = water amount from private water reservoirs (m3/year)Xc = water amount that the hotels stored and produced themselves (m3/year)
- (2)
- Analysis of the water adequacy for use in the province for the population, latent population, and other sectors.
- (3)
- Analysis of the water amount used by the hotels, divided into (1) the water amount used by EIA hotels and is currently in operation, and (2) the water amount used by EIA hotels but are not operating (there is potential for future operation).
- (4)
- Simulation of water situations to predict the amount of water used during and outside the tourist season, divided into two cases: (1) calculation of daily water use with the assumption that a high season scenario accounts for 100% and a low season scenario accounts for 60% of water use in each hotel (according to [36]) and (2) calculation of annual water use by assuming three situations, divided into a low case scenario accounting for 60% of water use in hotels, a high case scenario accounting for 100% of water use in hotels, and a normal case scenario accounting for water use according to season.
- (5)
- Analysis of the proportion between the amount of water used in the hotel sector and the amount of water in Phuket Province, divided into two cases: (1) Hotels do not have the potential to store and produce their own water, and (2) Some hotels have the potential to store and produce their own water.
- (6)
- Assessment of the tourism carrying capacity, calculated from the following equations (adapted from [21,39]):where Wc = total water consumption (L/day)Wc = (A × Wa) + (B × Wb)A = number of population according to civil registration (person)B = latent population (person)Wa = average water use rate of the population according to the civil registration (L/person/day)Wb = average water use rate of the latent population (L/person/day)where TCCw = tourism carrying capacity (person)TCCw = (Ws − Wc)/WtWs = amount of water used in the province (L/day)Wc = total water use (L/day)Wt = average water use rate of tourists (L/person/day)
- (7)
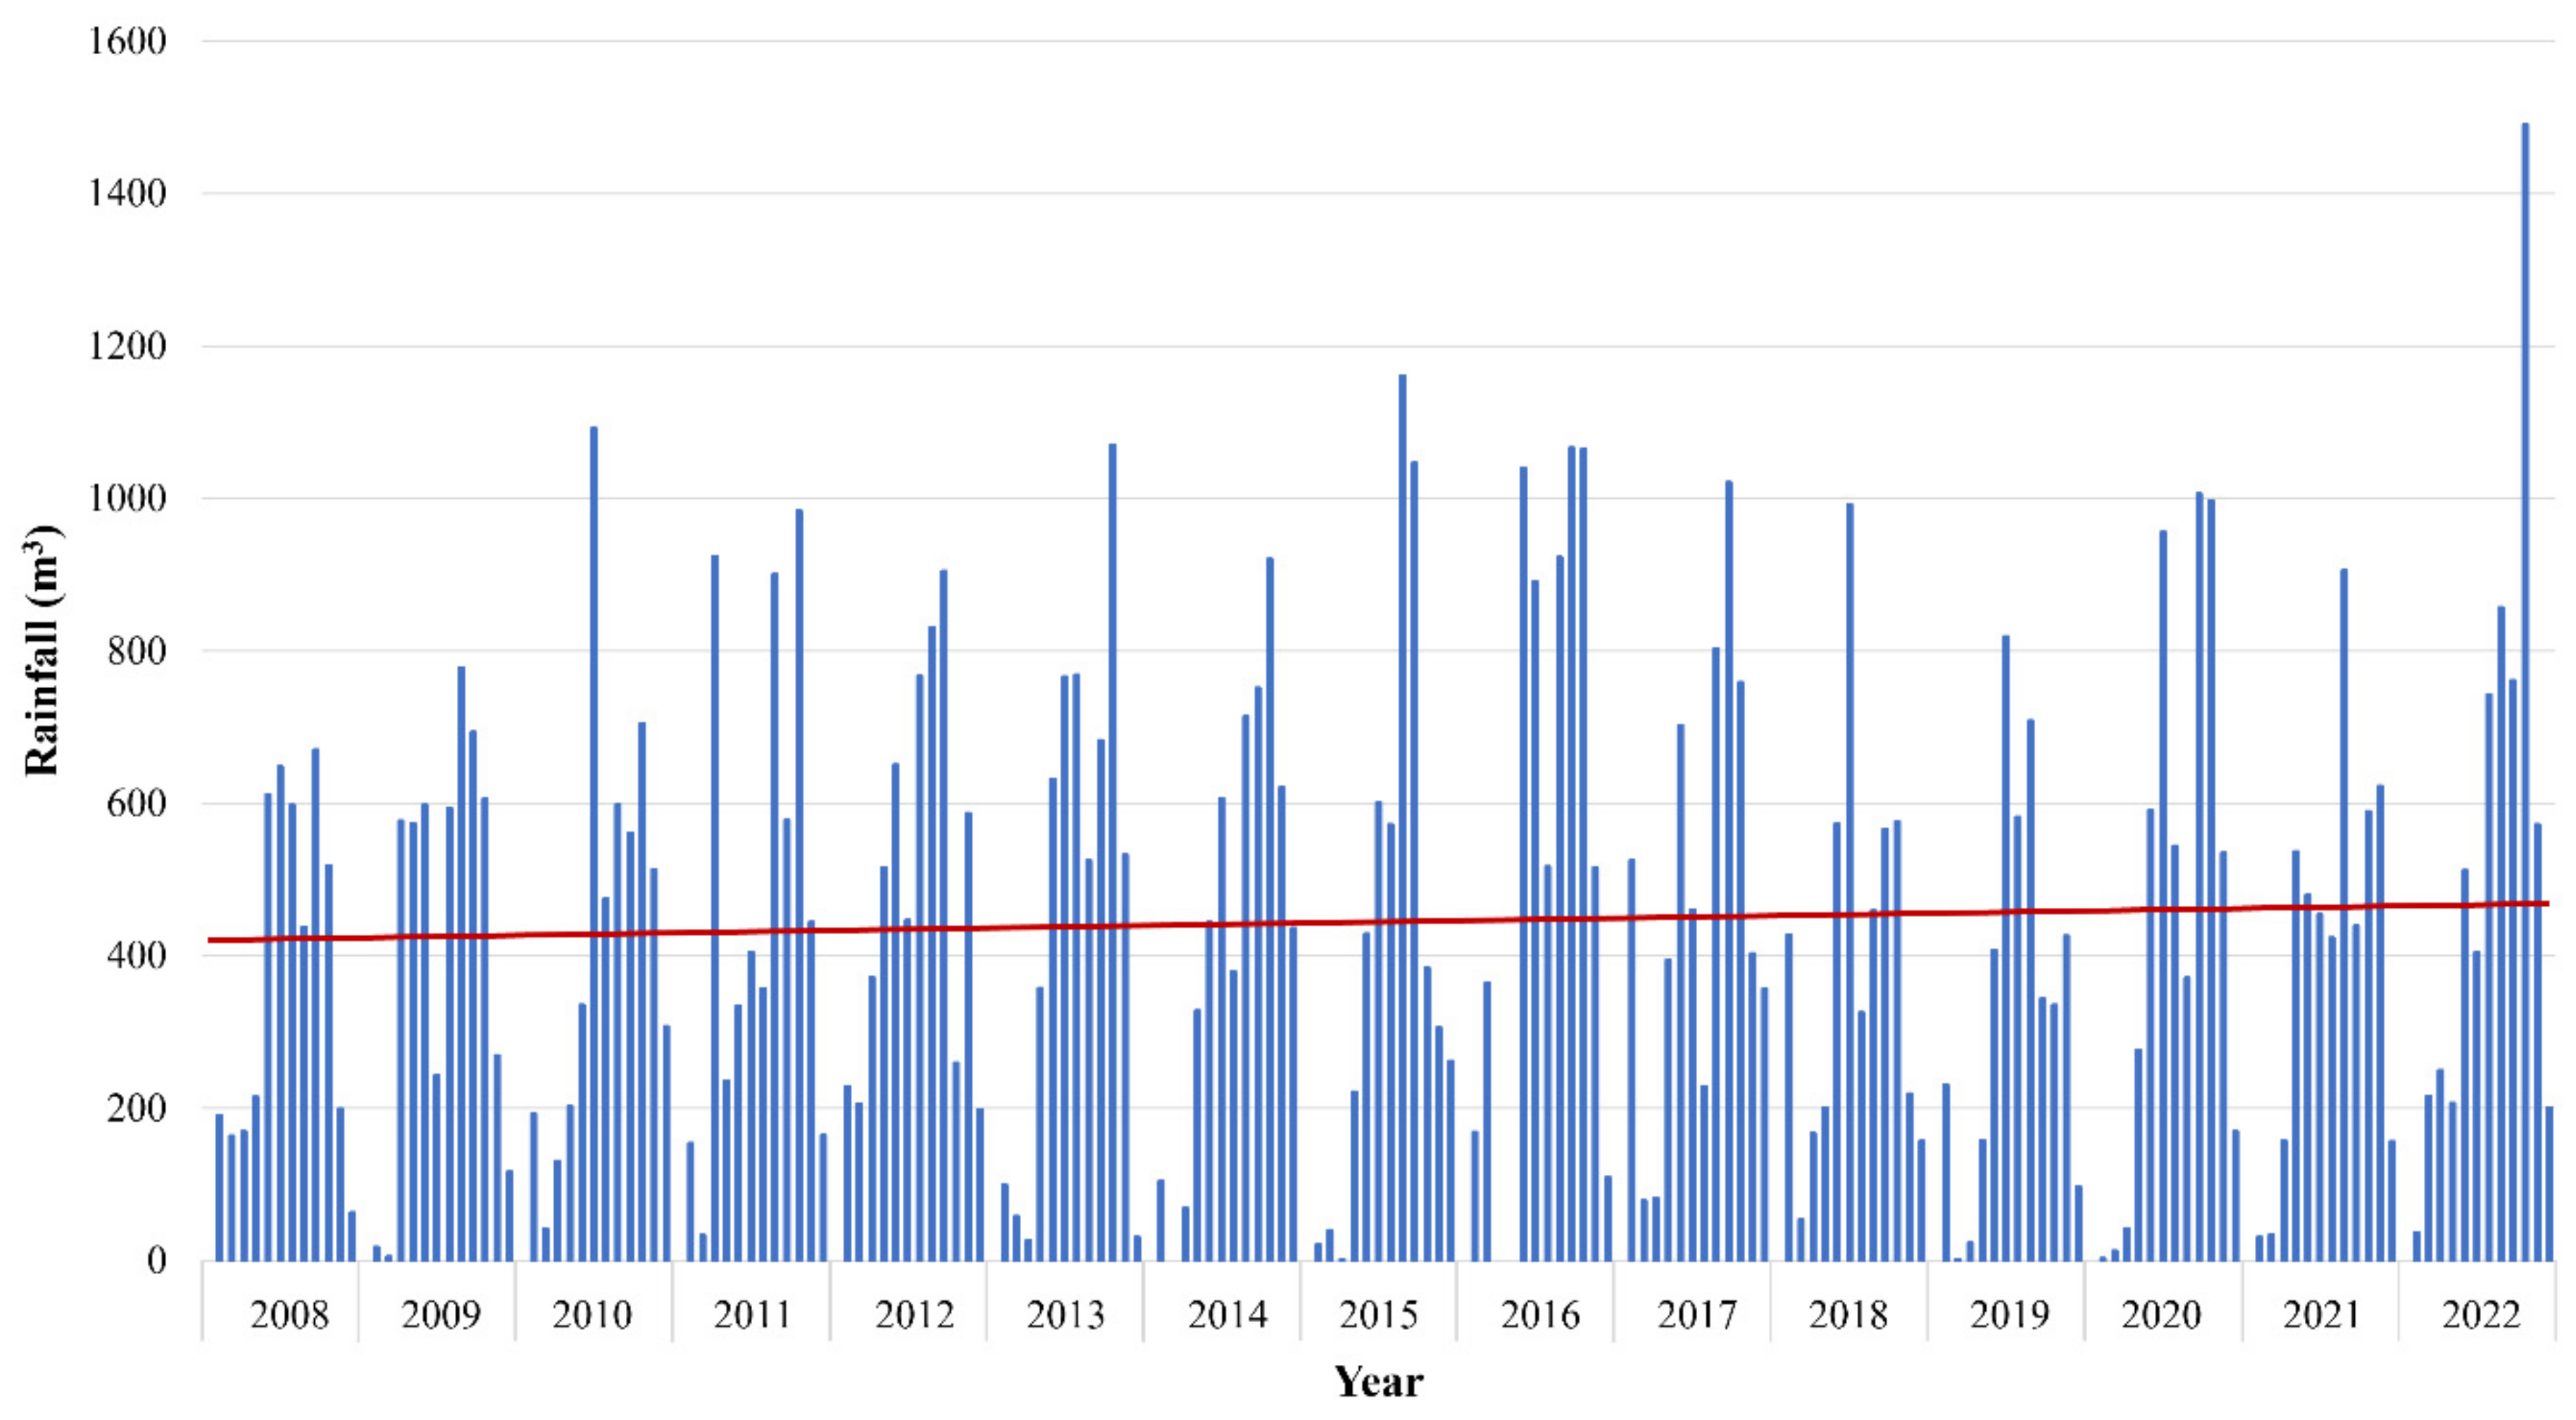
- Analysis of rainfall data from the Meteorological Department as a basis to evaluate the potential for increasing the amount of water availability in Phuket Province.
3. Results and Discussion
3.1. The Quantity of Water in Phuket Province
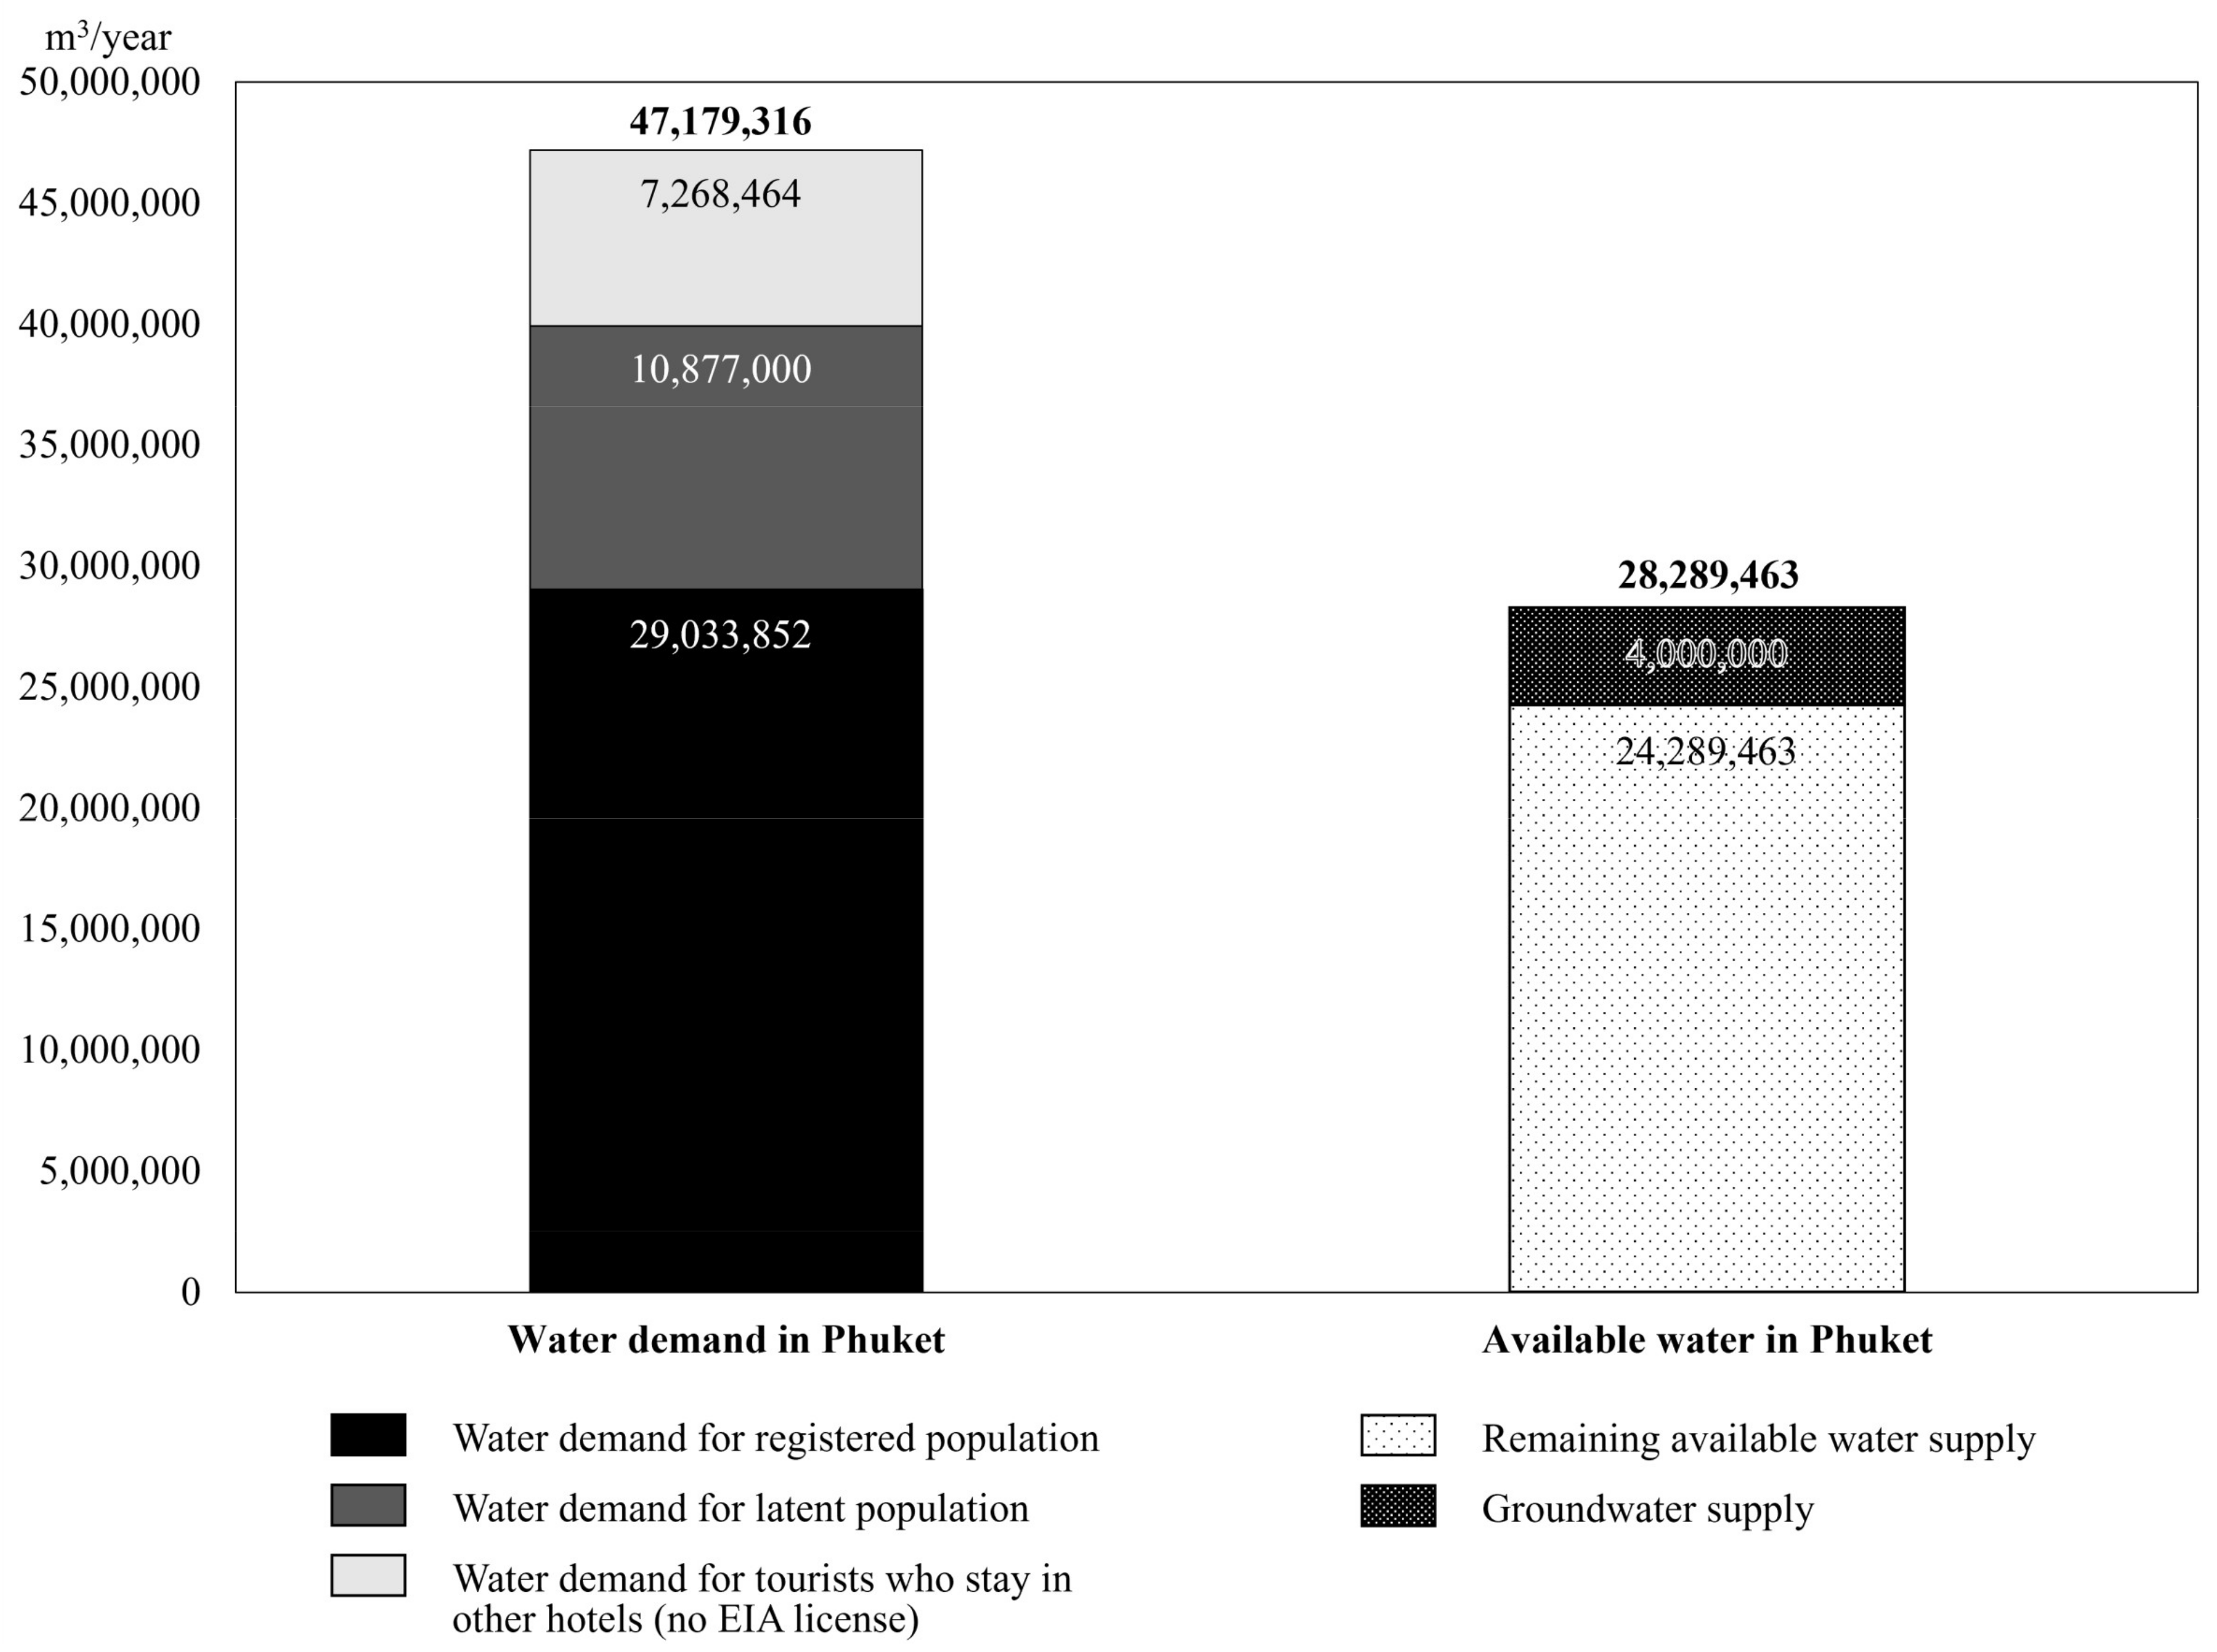
3.2. The Adequacy of Water in Phuket for the Population, Latent Population, and Other Hotels If EIA Hotels Are Prioritized
3.3. Water Consumption of Hotels Requiring an Environmental Impact Assessment (EIA)
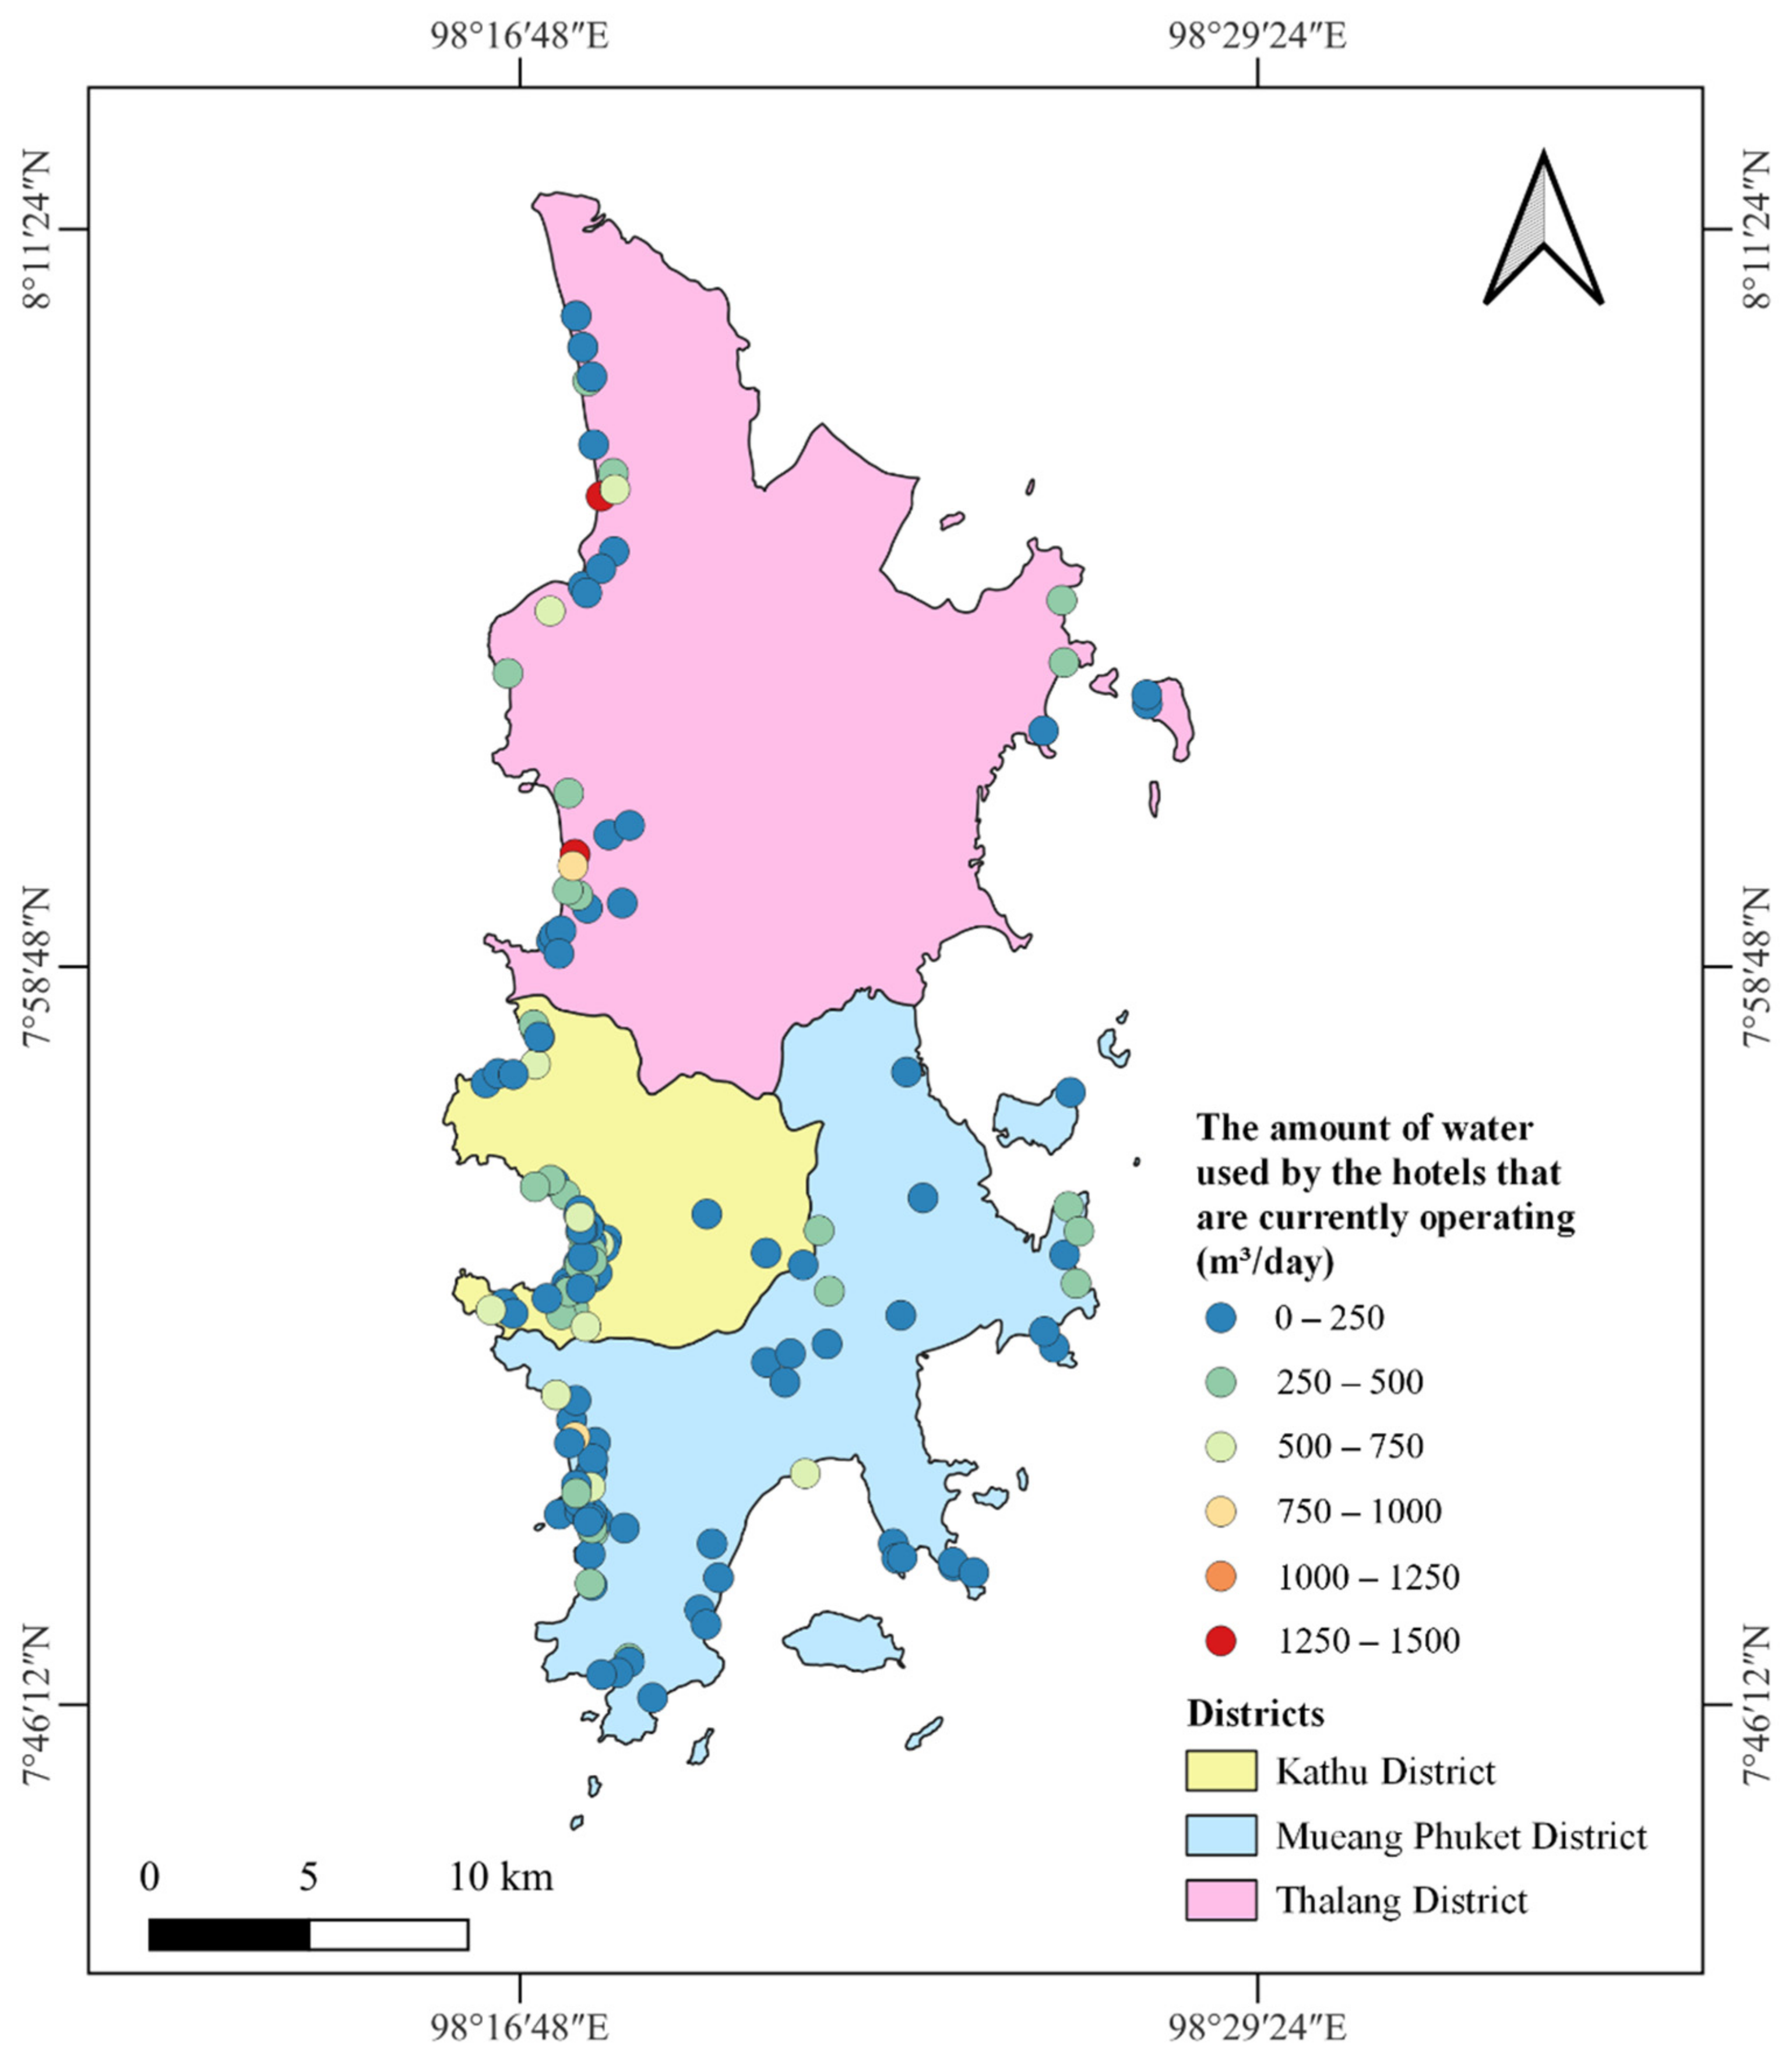
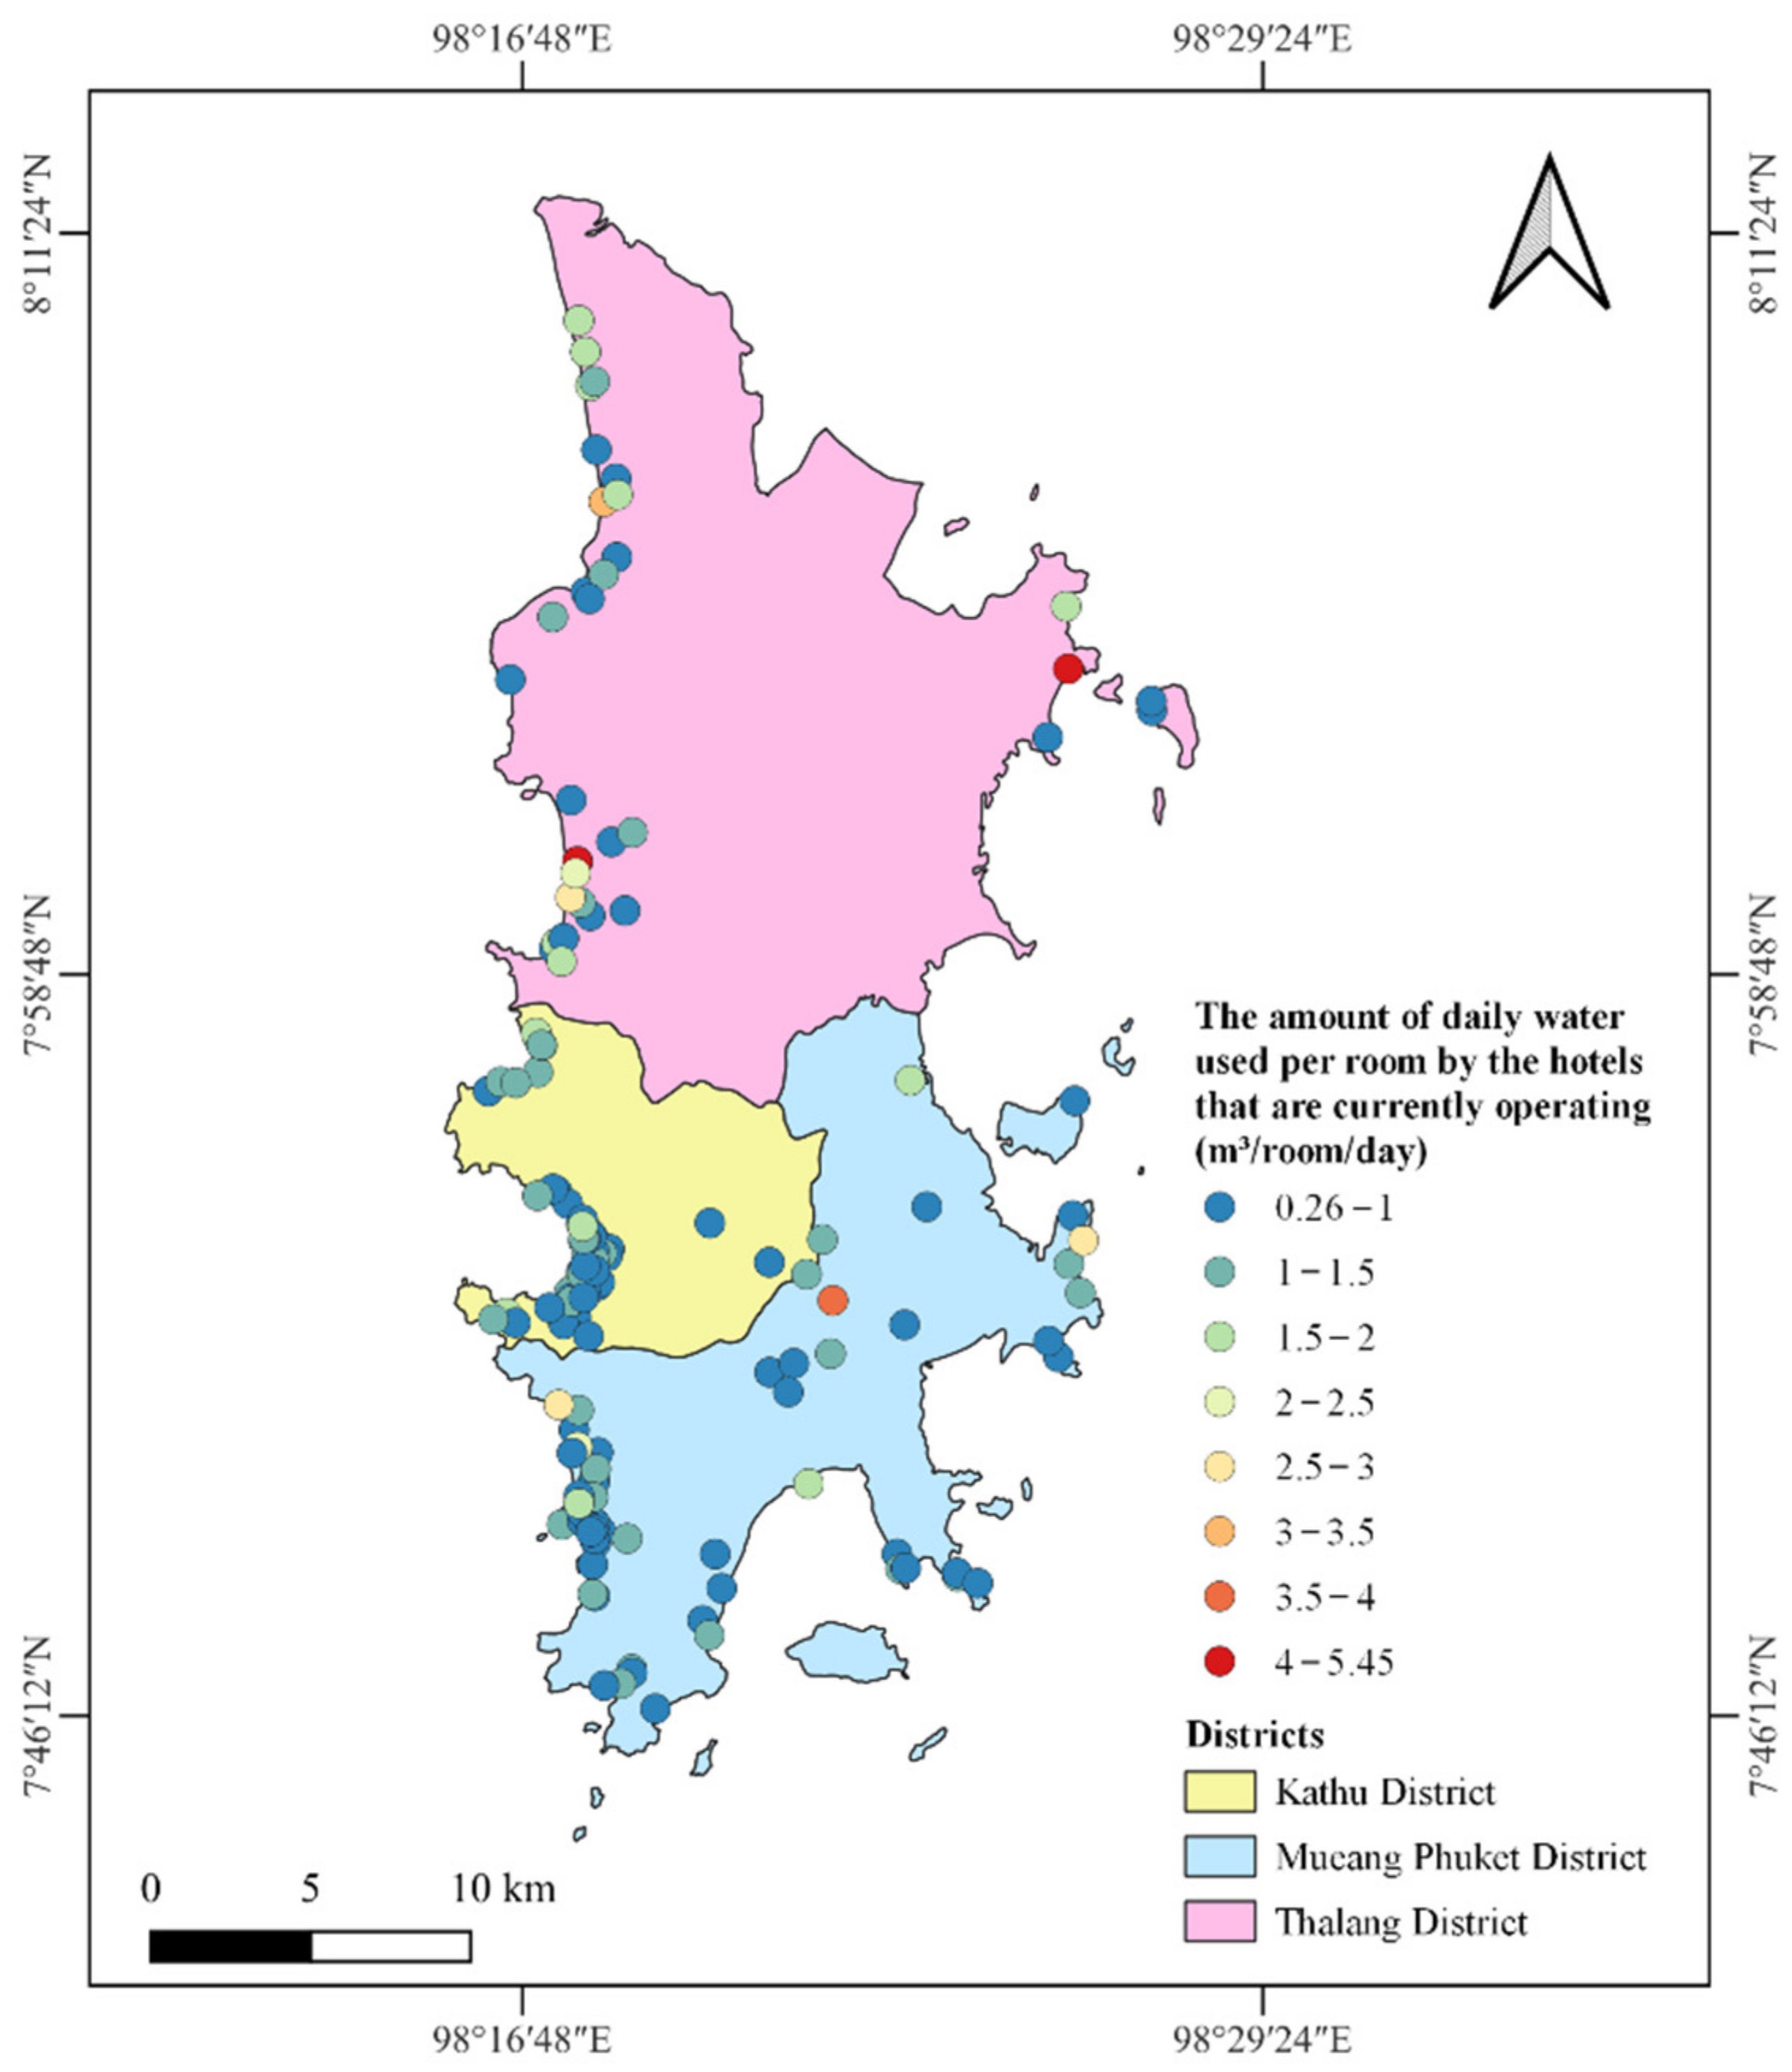
3.3.1. The Water Consumption of the Hotels That Requires an Environmental Impact Assessment (EIA) and Are Currently Operating
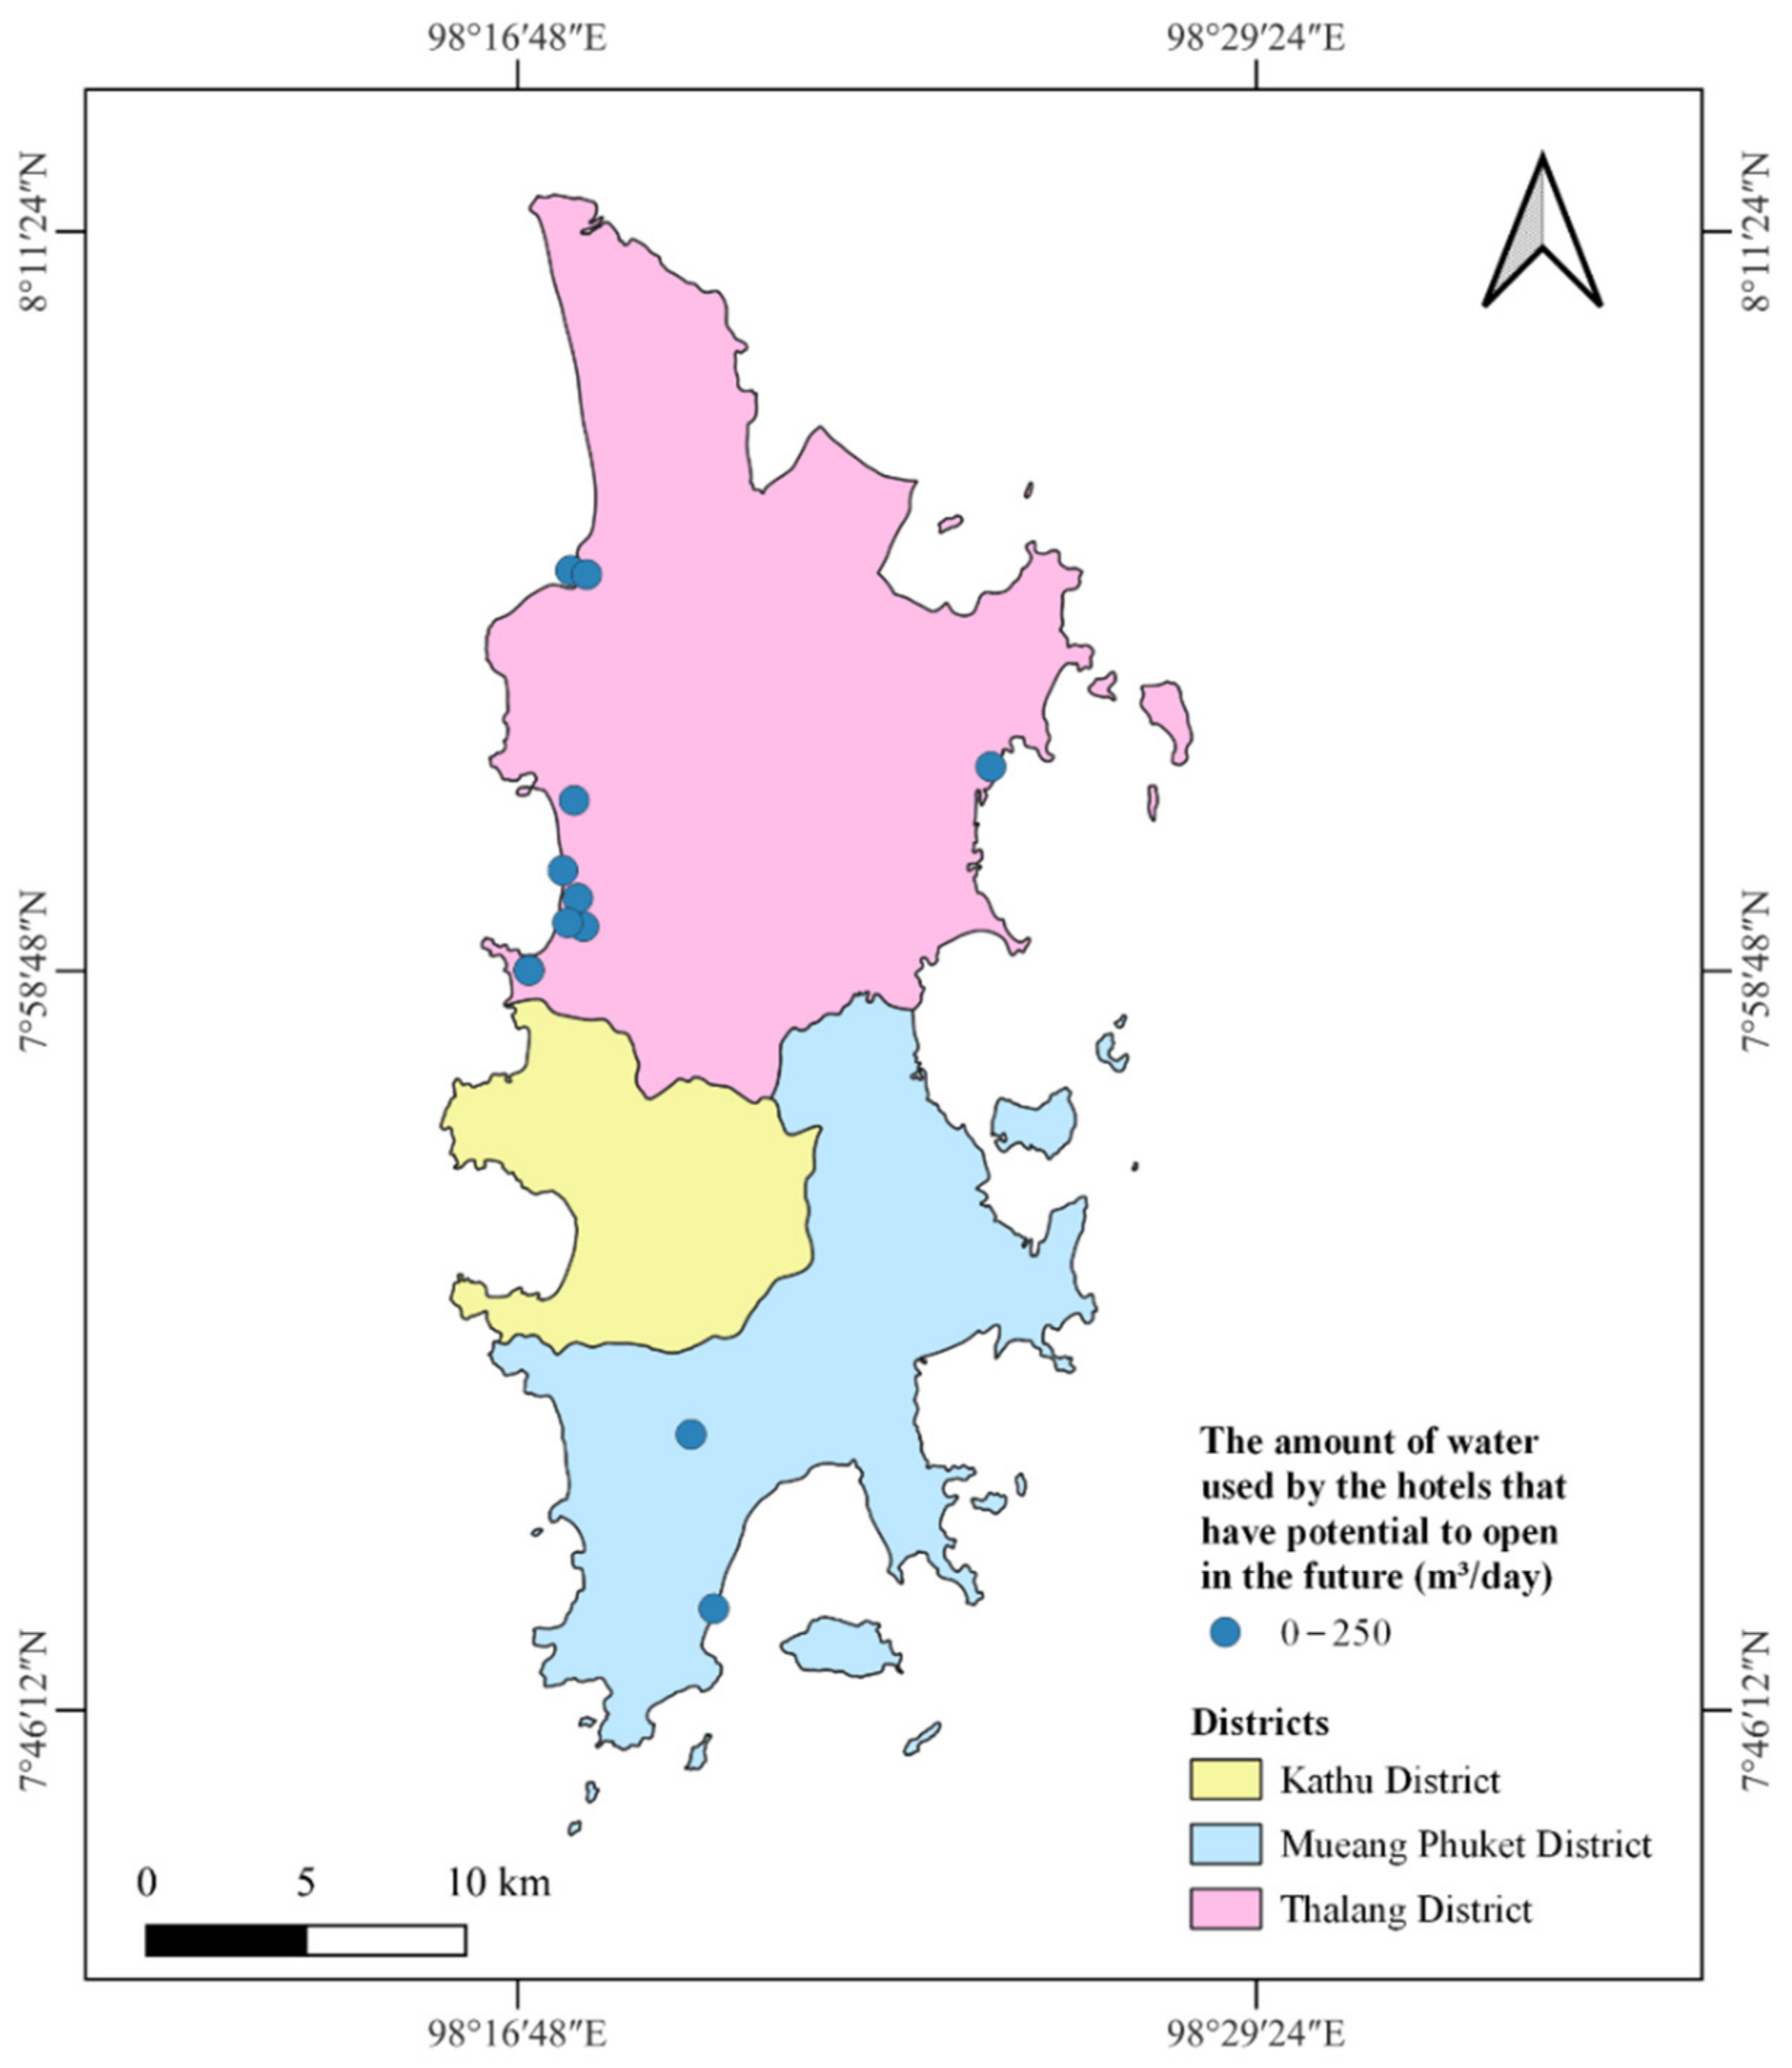
3.3.2. The Amount of Water Used by the Hotels That Require an Environmental Impact Assessment (EIA) and Have the Potential to Open in the Future
3.4. Simulation of the Water Consumption Situation in the Hotel Sector
3.4.1. Daily Water Consumption
3.4.2. Annual Water Consumption
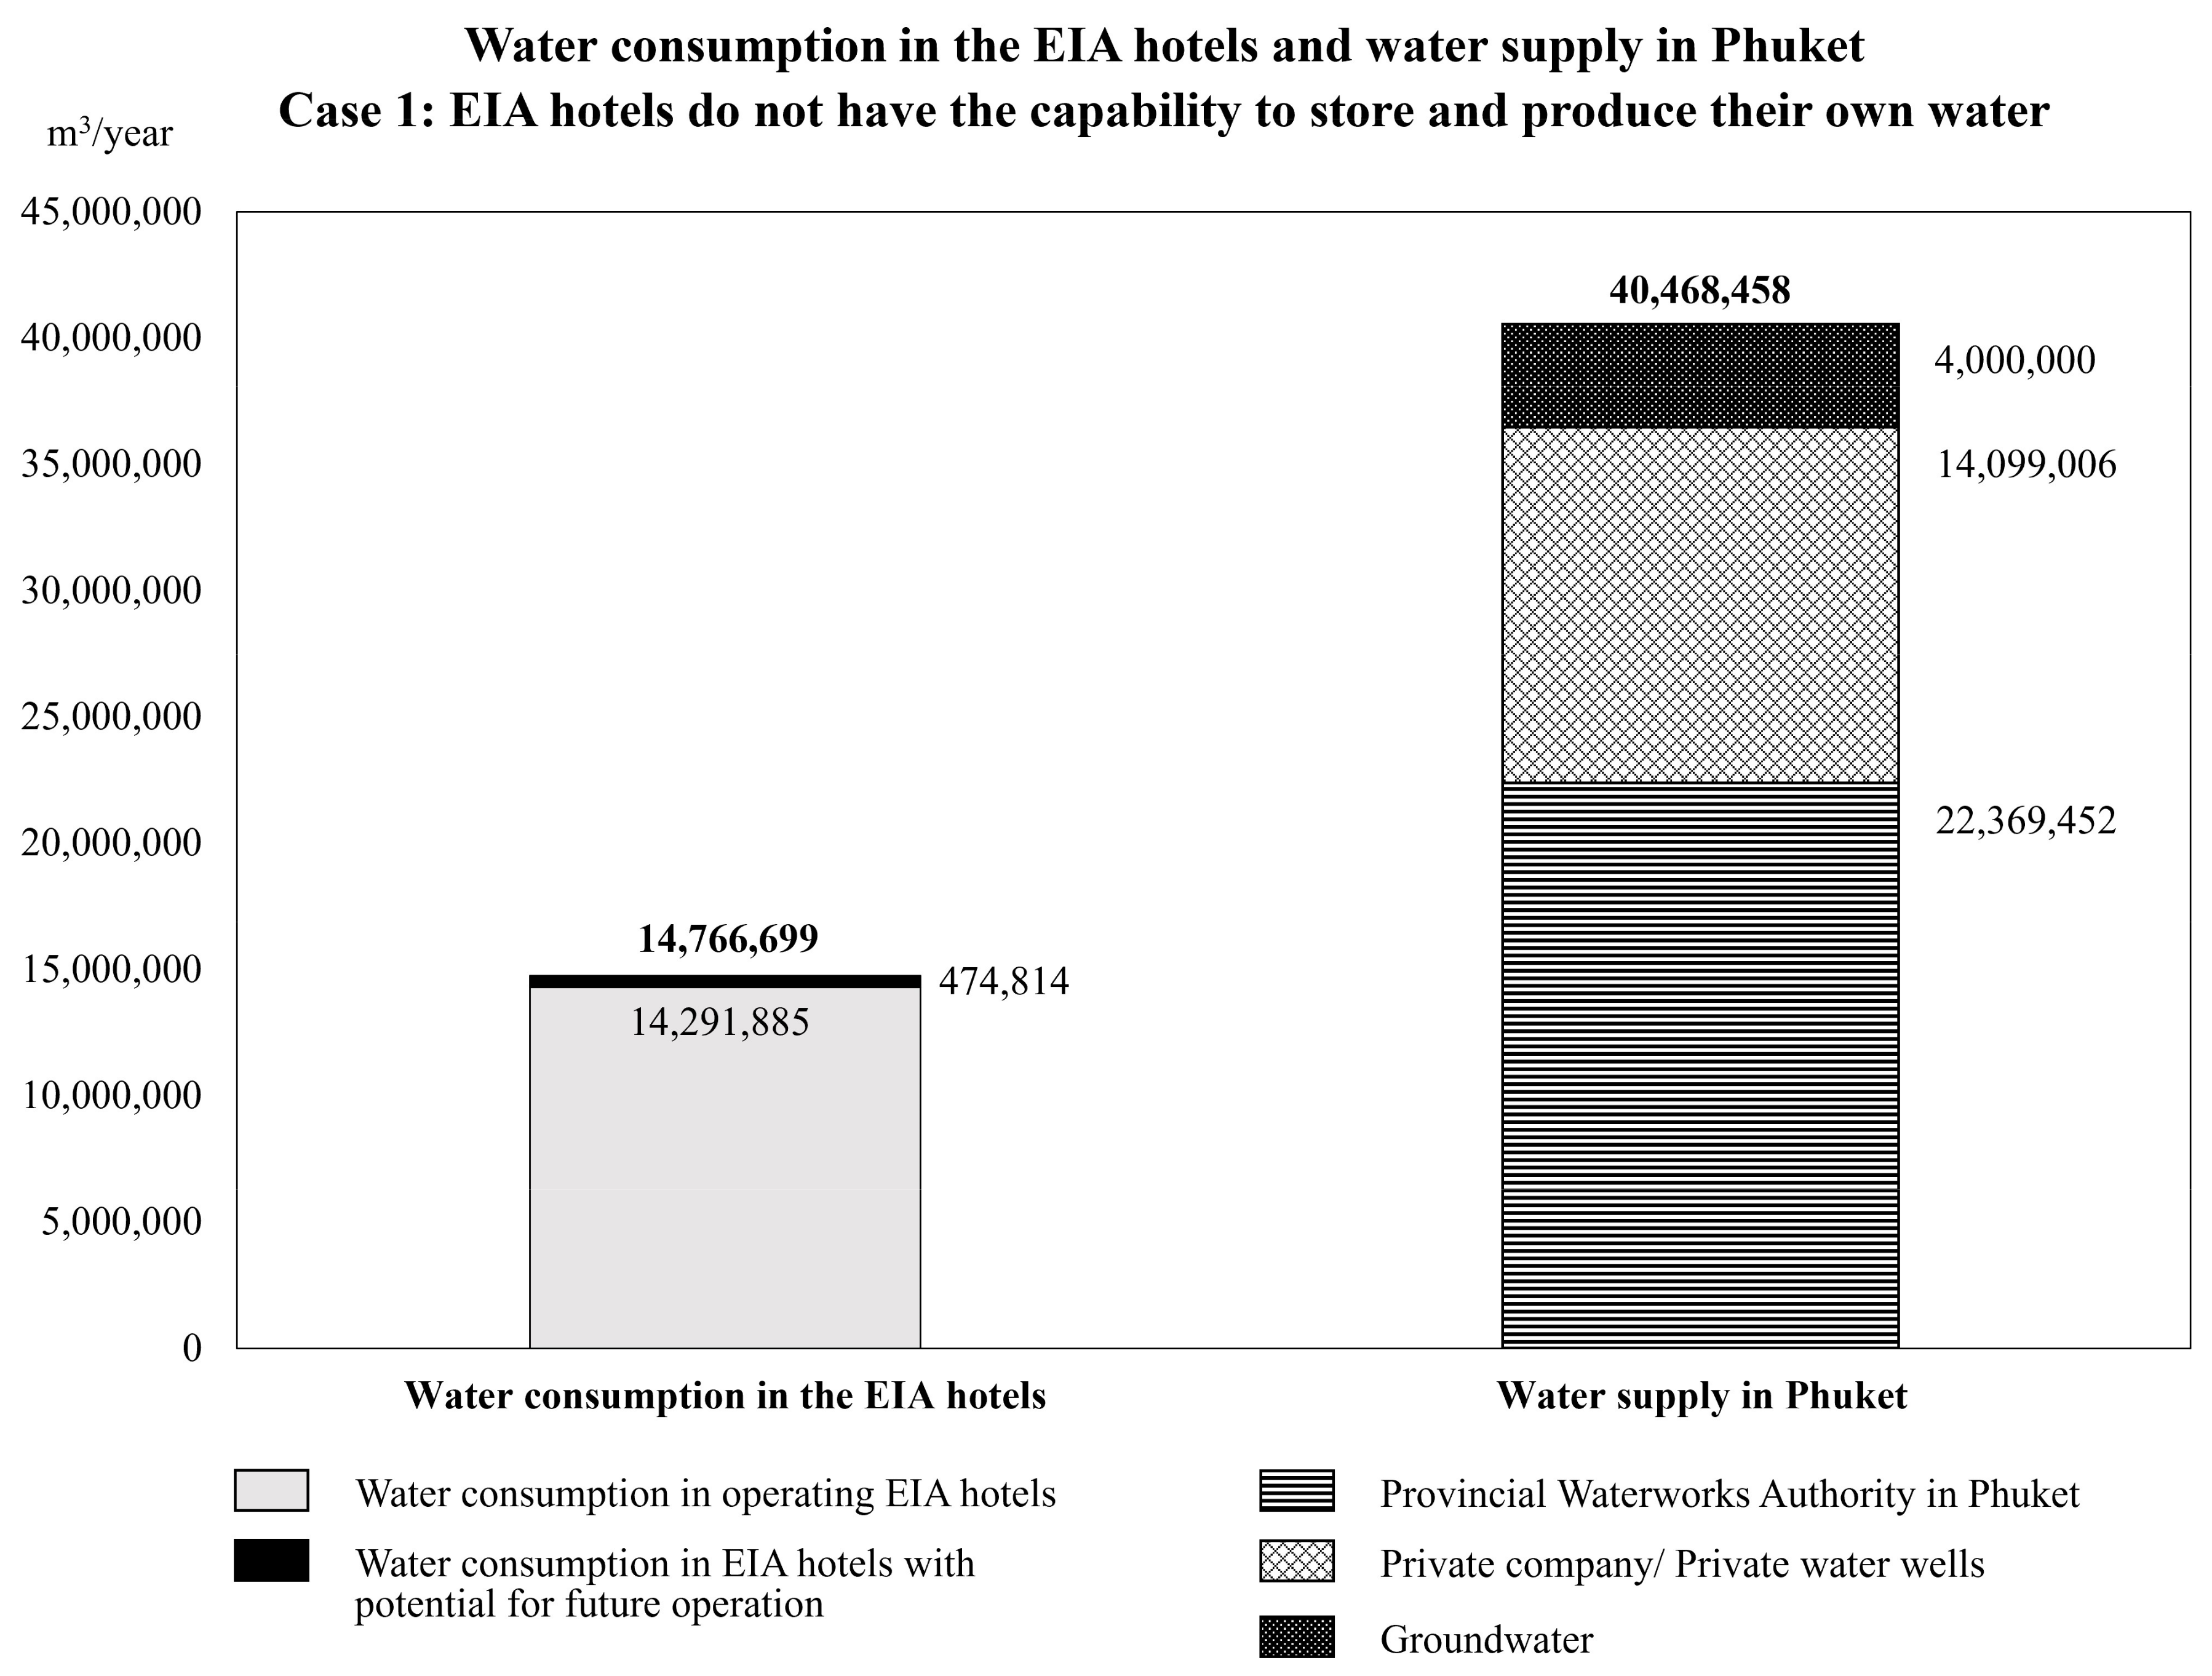
3.5. The Relationship between the Amount of Water Used in the EIA Hotels and the Amount of Water in Phuket
3.5.1. Case 1: EIA Hotels Do Not Have the Capability to Store and Produce Their Own Water
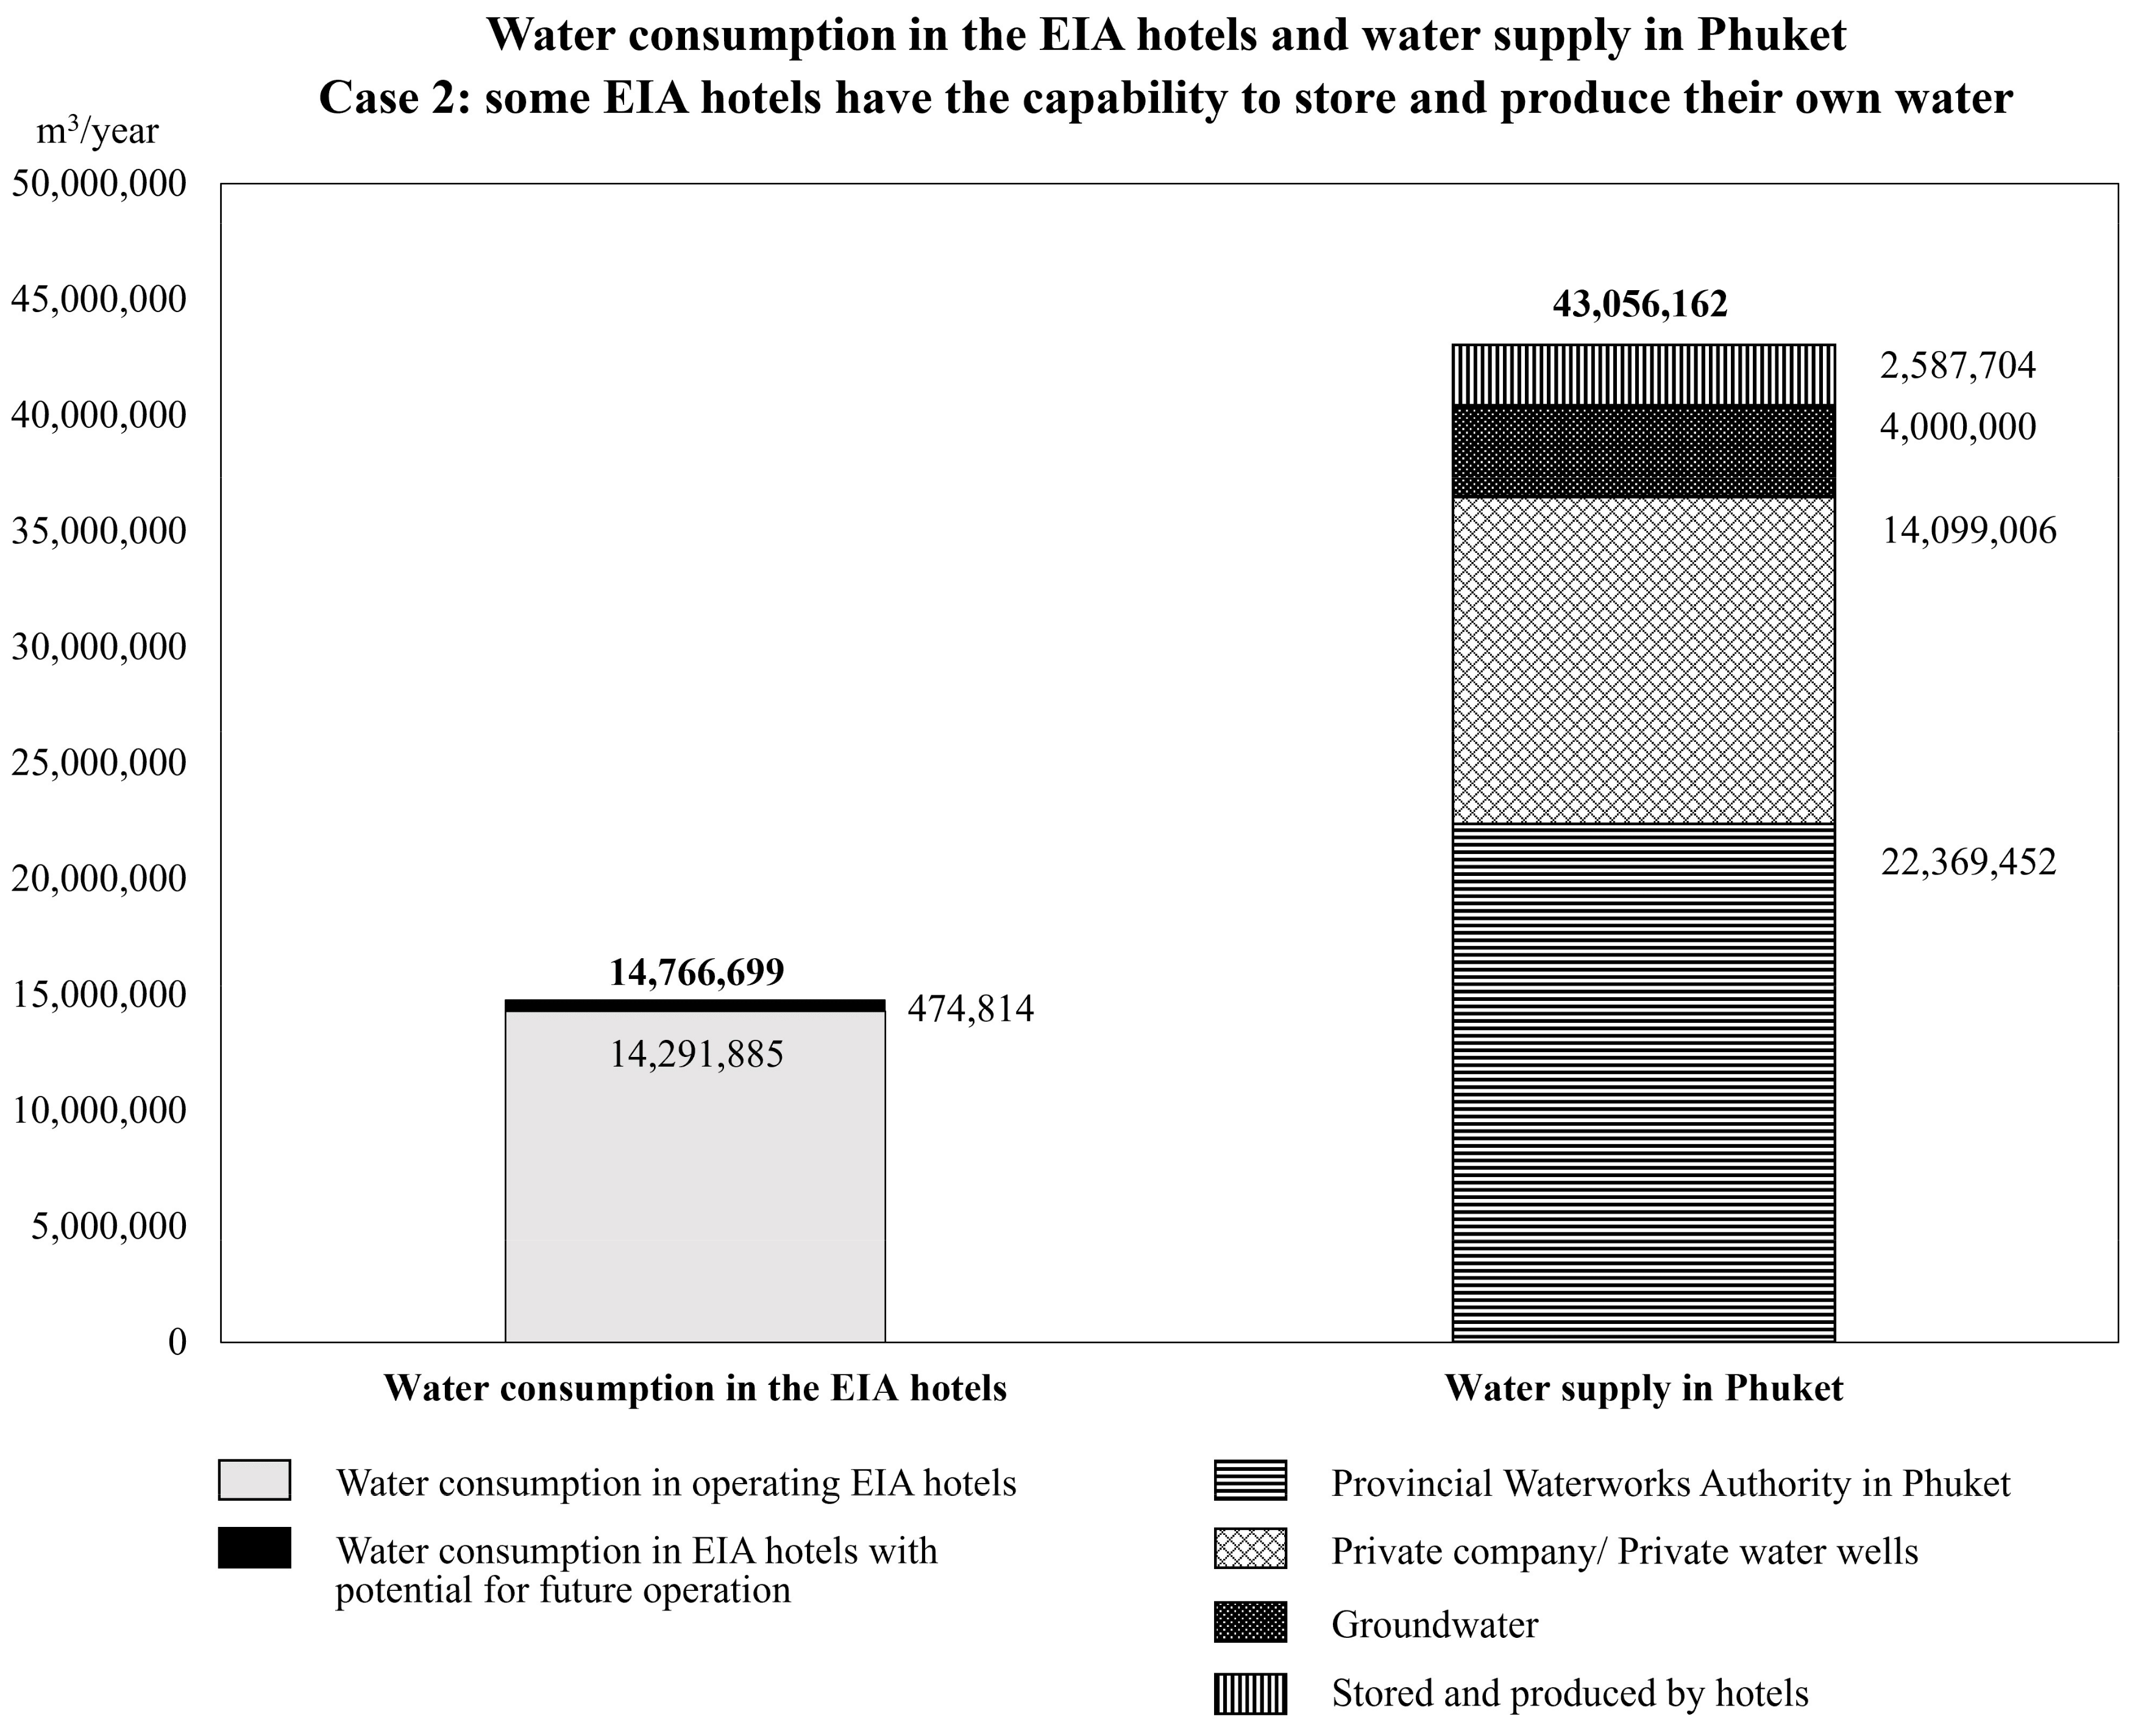
3.5.2. Case 2: Some EIA Hotels Have the Capacity to Store and Produce Their Own Water
3.6. Assessment of the Tourism Carrying Capacity in Terms of Water
3.7. Guidelines for Augmenting the Water Supply in Phuket Province
4. Conclusions
Author Contributions
Funding
Institutional Review Board Statement
Informed Consent Statement
Data Availability Statement
Acknowledgments
Conflicts of Interest
References
- Cashman, A.; Cumberbatch, J.; Moore, W. The effects of climate change on tourism in small states: Evidence from the Barbados case. Tour. Rev. 2012, 67, 17–29. [Google Scholar] [CrossRef]
- Barberán, R.; Egea, P.; Gracia-de-Rentería, P.; Salvador, M. Evaluation of water saving measures in hotels: A Spanish case study. Int. J. Hosp. Manag. 2013, 34, 181–191. [Google Scholar] [CrossRef]
- Hadjikakou, M.; Miller, G.; Chenoweth, J.; Druckman, A.; Zoumides, C. A comprehensive framework for comparing water use intensity across different tourist types. J. Sustain. Tour. 2015, 23, 1445–1467. [Google Scholar] [CrossRef]
- Becken, S.; Scott, N. Green Urban Development in Asia and the Pacific—Water Issues for Tourism. In Green Development of Asia-Pacific Cities-Building Better Cities towards 2030; Zhao, Z., Ed.; World Scientific: Singapore, 2018. [Google Scholar]
- Arabadzhyan, A.; Figini, P.; García, C.; González, M.; González, Y.E.L.; León, C.J. Climate change, coastal tourism, and impact chains—A literature review. Curr. Issues Tour. 2021, 24, 2233–2268. [Google Scholar] [CrossRef]
- Ougougdal, H.A.; Khebiza, M.Y.; Messouli, M.; Lachir, A. Assessment of Future Water Demand and Supply under IPCC Climate Change and Socio-Economic Scenarios, Using a Combination of Models in Ourika Watershed, High Atlas, Morocco. Water 2020, 12, 1751. [Google Scholar] [CrossRef]
- Taecharungroj, V.; Mathayomchan, B. Analysing Trip Advisor reviews of tourist attractions in Phuket, Thailand. Tour. Manag. 2019, 75, 550–568. [Google Scholar] [CrossRef]
- Sinlapasate, N.; Buathong, W.; Prayongrat, T.; Sangkhanan, N.; Chutchakul, K.; Soonsawad, C. Tourism Carrying Capacity Toward Sustainable Tourism Development: A Case Study of Phuket World Class Destination. ABAC J. 2020, 40, 140–159. [Google Scholar]
- Phakdee-Auksorn, P.; Sastre, R.; Pattaro, P.; Soonsan, N.; Dachum, P. An Analysis of International Tourist Motivations towards Phuket Food Attractiveness. J. Qual. Assur. Hosp. Tour. 2023, 2023, 1–28. [Google Scholar] [CrossRef]
- Royal Irrigation Department. Preliminary Feasibility Study and Environmental Impact on Solving Water Shortage and Flood Relief in Phuket; Royal Irrigation Department: Bangkok, Thailand, 2020. (In Thai)
- Kanchanapiya, P.; Tantisattayakul, T. Analysis of wastewater reuse options using a multicriteria decision tool for Phuket, Thailand. J. Environ. Manag. 2023, 334, 117426. [Google Scholar] [CrossRef]
- Project Management Office. Royal Irrigation Department. Provincial River Basin Development Master Plan Report—Phuket Province; Royal Irrigation Department: Bangkok, Thailand, 2018. (In Thai)
- Banmuang. Available online: https://shorturl.at/pxAHY (accessed on 18 July 2023). (In Thai).
- Government Public Relations Department (Phuket). Available online: https://shorturl.at/dehuB (accessed on 18 July 2023). (In Thai).
- Seeduka, D. Hotel Water Consumption: A Case Study in Phuket Province. Master’s Thesis, Prince of Songkla University, Songkla, Thailand, 2013. (In Thai). [Google Scholar]
- Vongtanaboon, S. Water Resource Assessment and Management in Phuket, Thailand. Interlocal Adaptations to Climate Change in East and Southeast Asia: Sharing Lessons of Agriculture, Disaster Risk Reduction, and Resource Management; Springer: Cham, Switzerland, 2022; pp. 153–156. [Google Scholar]
- United Nations. Available online: https://shorturl.at/wRTU4 (accessed on 31 May 2023).
- World Meteorological Organization. Available online: https://shorturl.at/hpY18 (accessed on 18 July 2023).
- Pathirana, G.; Oh, J.; Cai, W.; An, S.; Min, S.; Jo, S.; Shin, J.; Kug, J. Increase in convective extreme El Niño events in a CO2 removal scenario. Sci. Adv. 2023, 9, eadh2412. [Google Scholar] [CrossRef]
- Voosen, P. Critical El Niño monitor gets an upgrade—Revamped tropical Pacific buoys could aid in forecasts of atmospheric rivers. Oceanography 2023, 380, 445. [Google Scholar]
- Puangkaew, N.; Ongsomwang, S. Remote Sensing and Geospatial Models to Simulate Land Use and Land Cover and Estimate Water Supply and Demand for Water Balancing in Phuket Island, Thailand. Appl. Sci. 2021, 11, 10553. [Google Scholar] [CrossRef]
- Mendoza, E.; Ferrero, G.; Slokar, Y.M.; Amores, X.; Azzellino, A.; Buttiglieri, G. Water management practices in Euro-Mediterranean hotels and resorts. Int. J. Water Resour. Dev. 2022, 39, 485–506. [Google Scholar] [CrossRef]
- Dube, K. South African Hotels and Hospitality Industry Response to Climate Change-Induced Water Insecurity under the Sustainable Development Goals Banner. In Water-Energy-Nexus in the Ecological Transition: Natural-Based Solutions, Advanced Technologies and Best Practices for Environmental Sustainability; Springer: Cham, Switzerland, 2022; pp. 249–252. [Google Scholar]
- Deyà-Tortella, B.; Garcia, C.; Nilsson, W.; Tirado, D. Hotel Water Demand: The Impact of Changing from Linear to Increasing Block Rates. Water 2019, 11, 1604. [Google Scholar] [CrossRef]
- Dinarès, M.; Saurí, D. Water consumption patterns of hotels and their response to droughts and public concerns regarding water conservation: The case of the Barcelona hotel industry during the 2007–2008 episode. Doc. D’anàlisi Geogràfica 2015, 61, 623–649. [Google Scholar] [CrossRef]
- Tortella, B.D.; Tirado, D. Hotel water consumption at a seasonal mass tourist destination. The case of the island of Mallorca. J. Environ. Manag. 2011, 92, 2568–2579. [Google Scholar] [CrossRef] [PubMed]
- Gopalakrishnan, C.; Cox, L.J. Water Consumption by the Visitor Industry: The Case of Hawaii. Int. J. Water Resour. Dev. 2003, 19, 29–35. [Google Scholar] [CrossRef]
- Alhudaithi, M.; Arregui, F.J.; Cobacho, R. Proposal of a Water Consumption Efficiency Indicator for the Hotel Sector. Water 2022, 14, 3828. [Google Scholar] [CrossRef]
- Rico, A.; Olcina, J.; Baños, C.; Garcia, X.; Sauri, D. Declining water consumption in the hotel industry of mass tourism resorts: Contrasting evidence for Benidorm, Spain. Curr. Issues Tour. 2020, 23, 770–783. [Google Scholar] [CrossRef]
- Gabarda-Mallorquí, A.; Garcia, X.; Ribas, A. Mass tourism and water efficiency in the hotel industry: A case study. Int. J. Hosp. Manag. 2017, 61, 82–93. [Google Scholar] [CrossRef]
- Eddine Mechri, H.; Amara, S. Investigation and analysis of energy and water use of hotel buildings in Tunisia. Energy Build. 2021, 241, 110930. [Google Scholar] [CrossRef]
- Phuket Provincial Office, Strategy and Information Group for Development of Phuket Province. Available online: https://shorturl.at/bkmpI (accessed on 18 July 2023). (In Thai).
- Provincial Development and Strategy Group Phuket Provincial Office. Summary of Phuket Province Information. Phuket Province; Provincial Development and Strategy Group Phuket Provincial Office: Phuket, Thailand, 2016. (In Thai)
- Environmental Impact Assessment Information Center Office of Natural Resources and Environmental Policy and Planning. Available online: https://shorturl.asia/GKb3M (accessed on 13 January 2023). (In Thai).
- Provincial Waterworks Authority. Provincial Waterworks Authority, Phuket Branch 2017. Available online: https://en.pwa.co.th/province/branch/5550223 (accessed on 17 February 2023). (In Thai)
- Kerdsin, W.; Keson, J.; Samaae, S.; Pinkaew, S. Research Project for Water Management in Phuket Province; Prince of Songkla University: Phuket, Thailand, 2019. (In Thai) [Google Scholar]
- National Statistical Office, Ministry of Digital Economy and Society. Available online: https://shorturl.asia/2UVmW (accessed on 4 April 2023). (In Thai)
- Meteorological Department. Available online: https://shorturl.asia/wNOvj (accessed on 29 April 2023).
- Department of National Parks, Wildlife and Plant Conservation. Project to Study the Carrying Capacity of the Erawan National Park Area. Kanchanaburi Province. 2006. Available online: https://www.dnp.go.th/nprd/detailproject/data/erawan/ccerawan5.pdf (accessed on 21 November 2023). (In Thai)
- Information and Communication Division Provincial Office. Available online: https://shorturl.asia/sIWB2 (accessed on 23 April 2023). (In Thai).
- Samaae, S.; Surussavadee, C.; Buapet, P. Analysis of Surface-Water Resource Amount for Water Management in Phuket Province, Thailand. In The Graduate Research Conference (GRC); Khan Kaen University: Khon Kaen, Thailand, 2013. (In Thai) [Google Scholar]
- Ministry of Tourism and Sports. Available online: https://shorturl.asia/ucoMU (accessed on 18 June 2023). (In Thai)
- Zaki, M.K.; Noda, K.A. Systematic Review of Drought Indices in Tropical Southeast Asia. Atmosphere 2022, 13, 833. [Google Scholar] [CrossRef]
- Weather and Climate Services for ASEAN. Available online: https://shorturl.asia/1Rbms (accessed on 1 June 2023).
- Nutiprapun, P.; Hermhuk, S.; Nanami, S.; Itoh, A.; Kanzaki, M.; Marod, D. Effects of El Niño drought on seedling dynamics in a seasonally dry tropical forest in Northern Thailand. Glob. Chang. Biol. 2023, 29, 451–461. [Google Scholar] [CrossRef] [PubMed]
- Madge, G. 2023 Set to be Tenth Consecutive Year at 1 °C or Above. Available online: https://shorturl.asia/Zmazk (accessed on 1 June 2023).
- Workpoint Today. Available online: https://shorturl.asia/p9Tqv (accessed on 18 June 2023). (In Thai).
- Pilangam, S.; Sreshthaputra, A. Water usage and demand estimation of water use for hotels in Bangkok. In Proceedings of the 5th Building Technology Conference on Energy and Environment (BTAC 2018), Singapore, 24 September 2023. (In Thai). [Google Scholar]
- Prueksakorn, K.; Gonzalez, J.C.; Keson, J.; Wongsai, S.; Wongsai, N.; Akkajit, P. A GIS-based tool to estimate carbon stock related to changes in land use due to tourism in Phuket Island, Thailand. Clean. Technol. Environ. Policy 2018, 20, 561–571. [Google Scholar] [CrossRef]
- Faculty of Hospitality and Tourism, Prince of Songkla University (Phuket Campus). Tourist Arrivals to Phuket 2019. Available online: https://shorturl.asia/xKLk9 (accessed on 26 November 2023). (In Thai).
- Phuket Province Statistics Report. Available online: https://shorturl.asia/OfPHk (accessed on 26 November 2023). (In Thai).
- Manager Online. Available online: https://shorturl.asia/zamt9 (accessed on 26 November 2023). (In Thai).
- Manager Online. Available online: https://shorturl.asia/4xUMu (accessed on 26 November 2023). (In Thai).
- Nguyen, H.A.T.; Sophea, T.; Gheewala, S.H.; Rattanakom, R.; Areerob, T.; Prueksakorn, K. Integrating remote sensing and machine learning into environmental monitoring and assessment of land use change. Sustain. Prod. Comsum. 2021, 27, 1239–1254. [Google Scholar] [CrossRef]


| Retrieved Information | Type of Data | Reference Sources |
|---|---|---|
| Water used by hotels that passed an Environmental Impact Assessment (EIA) | -number of rooms -total water consumption (m3/day) -water sources | Environmental Impact Assessment Information Center Office of Natural Resources and Environmental Policy and Planning [34] |
| The amount of water supply from the Provincial Waterworks Authority | -amount of water produced -amount of water distributed -amount of water sold | Provincial Waterworks Authority, Phuket Branch [35] |
| The amount of water in private wells within Phuket | -amount of water | Performance report from Phuket Water Management Research Project [36] |
| Population of Phuket in 2017 | -number of people | Phuket Provincial Office, Strategy and Information Group for Development of Phuket Province [32] |
| Latent population of Phuket in 2017 | -number of latent people | National Statistical Office, Ministry of Digital Economy and Society [37] |
| Rainfall in past 15 years (2008–2022) | -monthly rainfall | Meteorological Department [38] |
| Population (Person) | Water Use Rate (L/Person/Day) |
|---|---|
| 3000–10,000 | 120 |
| 10,001–20,000 | 170 |
| 20,001–30,001 | 200 |
| 30,001–50,000 | 250 |
| >50,000 | 300 |
| District | Population 1 | Water Use Rate (L/Person/Day) |
|---|---|---|
| Mueang Phuket | ||
| Phuket Metropolitan Municipality | 79,252 | 300 |
| Karon Subdistrict Municipality | 8128 | 120 |
| Ratsada Subdistrict Municipality | 46,955 | 250 |
| Wichit Subdistrict Municipality | 49,187 | 250 |
| Rawai Subdistrict Municipality | 18,052 | 170 |
| Outside the municipality | 39,259 | 250 |
| Kathu | ||
| Patong Metropolitan Municipality | 20,721 | 200 |
| Kathu Metropolitan Municipality | 28,674 | 200 |
| Outside the municipality | 6949 | 120 |
| Thalang | ||
| Choeng Thale Subdistrict Municipality | 6938 | 120 |
| Thep Kasattri Subdistrict Municipality | 8316 | 120 |
| Outside the municipality | 85,293 | 300 |
| Total | 397,724 | Average = 200 |
| Sources of Water Supply for the Studied Hotels | Number of Hotels |
|---|---|
| Hotels that are already in operation | |
| 1. The Provincial Waterworks Authority | 95 |
| 2. Private companies/private water wells and reservoirs | 25 |
| 3. The hotels storing and producing their own water | 31 |
| 4. The Provincial Waterworks Authority and private companies | 2 |
| 5. The Provincial Waterworks Authority and the hotels storing and producing their own water | 6 |
| 6. Private companies and the hotels storing and producing their own water | 6 |
| 7. The Provincial Waterworks Authority, private companies, and the hotel storing and producing its own water | 1 |
| Total | 166 |
| Hotels with a potential to be opened in the future | |
| 1. The Provincial Waterworks Authority | 7 |
| 2. Private companies/private water wells and reservoirs | 1 |
| 3. The hotels storing and producing their own water | 3 |
| 4. The Provincial Waterworks Authority and private companies | 1 |
| Total | 12 |
| The Water Consumption Range (m3/Day) | The Number of Hotels in Each Water Consumption Range (Hotels) |
|---|---|
| 0–250 | 113 |
| 251–500 | 38 |
| 501–750 | 11 |
| 751–1000 | 2 |
| 1001–1250 | 0 |
| 1251–1500 | 2 |
| Comparison | Results from [15] | Result from This Study |
|---|---|---|
| The number of rooms (room) | 1244 | 1352 |
| The hotel size | 5 medium-sized hotels 1 and 3 large-sized hotels 2 | 5 medium-sized hotels and 3 large-sized hotels |
| Total water consumption at 8 locations (m3/day) | 1307 | 1361 |
| Total water consumption at 8 locations (m3/month) | 39,210 | 40,831 |
| Daily Water Consumption per Room (m3/Room/Day) | Number of Hotels | Total Rooms |
|---|---|---|
| <1.0 | 99 | 19,851 |
| 1.0–1.5 | 42 | 8784 |
| 1.5–2.0 | 14 | 3038 |
| 2.0–2.5 | 4 | 981 |
| 2.5–3.0 | 3 | 478 |
| 3.0–3.5 | 1 | 452 |
| 3.5–4.0 | 1 | 120 |
| >4.0 | 2 | 328 |
| Total | 166 | 34,032 |
| Hotel Size | Number of Hotels | Total Rooms | Total Water Consumption (m3/Day) | Water Use per Room (m3/Room/Day) | |||
|---|---|---|---|---|---|---|---|
| Average | SD | Max | Min | ||||
| Small 1 | 4 | 151 | 154.9 | 1.0 | 0.3 | 1.4 | 0.8 |
| Medium 2 | 53 | 5654 | 6888.2 | 1.2 | 0.7 | 4.1 | 0.4 |
| Large 3 | 109 | 28,227 | 32,112.8 | 1.1 | 0.6 | 5.5 | 0.3 |
| Total | 166 | 34,032 | 39,155.86 | ||||
| District | Number of Hotels | Total Rooms | Total Water Consumption (m3/Day) | Water Use per Room (m3/Room/Day) | |||
|---|---|---|---|---|---|---|---|
| Ave | SD | Max | Min | ||||
| Kathu | 59 | 14,250 | 14,469.5 | 1.0 | 0.3 | 1.8 | 0.6 |
| Mueang | 71 | 12,831 | 13,964.5 | 1.1 | 0.5 | 3.7 | 0.4 |
| Thalang | 36 | 6951 | 10,722.0 | 1.5 | 1.0 | 5.5 | 0.3 |
| Total | 166 | 34,032 | 39,155.86 | ||||
| Daily Water Consumption per Room (m3/Room/Day) | Number of Hotels | Total Rooms |
|---|---|---|
| 0–1.0 | 6 | 797 |
| 1.0–1.5 | 6 | 542 |
| Total | 12 | 1339 |
| Hotel Size | Number of Hotels | Total Rooms | Total Water Consumption (m3/Day) | Water Use per Room (m3/Room/Day) | |||
|---|---|---|---|---|---|---|---|
| Ave. | SD | Max | Min | ||||
| Small 1 | 2 | 78 | 80.9 | 1.0 | 0.2 | 1.2 | 0.9 |
| Medium 2 | 8 | 804 | 871.3 | 1.1 | 0.2 | 1.4 | 0.9 |
| Large 3 | 2 | 457 | 348.6 | 0.8 | 0.2 | 0.9 | 0.7 |
| Total | 12 | 1339 | 1300.9 | ||||
| District | Number of Hotels | Total Rooms | Total Water Consumption (m3/Day) | Water Use per Room (m3/Room/Day) | |||
|---|---|---|---|---|---|---|---|
| Ave | SD | Max | Min | ||||
| Mueang | 2 | 211 | 241.9 | 1.1 | 0.1 | 1.2 | 1.1 |
| Thalang | 10 | 1128 | 1058.9 | 1.0 | 0.2 | 1.4 | 0.7 |
| Total | 12 | 1339 | 1300.9 | ||||
| Hotels That Require an Environmental Impact Assessment (EIA) in Phuket Province | The Water Consumption (m3/Day) | |
|---|---|---|
| Low Season (60%) | High Season (100%) | |
| Currently operating | 23,494 | 39,156 |
| Possibility of opening in the future | 781 | 1301 |
| Total | 24,275 | 40,457 |
Disclaimer/Publisher’s Note: The statements, opinions and data contained in all publications are solely those of the individual author(s) and contributor(s) and not of MDPI and/or the editor(s). MDPI and/or the editor(s) disclaim responsibility for any injury to people or property resulting from any ideas, methods, instructions or products referred to in the content. |
© 2024 by the authors. Licensee MDPI, Basel, Switzerland. This article is an open access article distributed under the terms and conditions of the Creative Commons Attribution (CC BY) license (https://creativecommons.org/licenses/by/4.0/).
Share and Cite
Sattraburut, T.; Prueksakorn, K.; Kitcharoen, T.; Amattayakul, T.; Pinitsuwan, P.; Pratum, C. The Connection between Phuket’s Water Supply and the Hotel Sector’s Water Use for Assessment of Tourism Carrying Capacity. Sustainability 2024, 16, 621. https://doi.org/10.3390/su16020621
Sattraburut T, Prueksakorn K, Kitcharoen T, Amattayakul T, Pinitsuwan P, Pratum C. The Connection between Phuket’s Water Supply and the Hotel Sector’s Water Use for Assessment of Tourism Carrying Capacity. Sustainability. 2024; 16(2):621. https://doi.org/10.3390/su16020621
Chicago/Turabian StyleSattraburut, Thunyapat, Kritana Prueksakorn, Thanchanok Kitcharoen, Teeraporn Amattayakul, Papaporn Pinitsuwan, and Chitsanuphong Pratum. 2024. "The Connection between Phuket’s Water Supply and the Hotel Sector’s Water Use for Assessment of Tourism Carrying Capacity" Sustainability 16, no. 2: 621. https://doi.org/10.3390/su16020621
APA StyleSattraburut, T., Prueksakorn, K., Kitcharoen, T., Amattayakul, T., Pinitsuwan, P., & Pratum, C. (2024). The Connection between Phuket’s Water Supply and the Hotel Sector’s Water Use for Assessment of Tourism Carrying Capacity. Sustainability, 16(2), 621. https://doi.org/10.3390/su16020621