Article

Peatmass Change and Water Level Influencing Regenerated Melaleuca Forest after a Fire in U Minh Thuong National Park, Vietnam

1
Department of Natural Resources and Environment, Kien Giang University, Minh Luong 91000, Vietnam
2
U Minh Thuong National Park, U Minh Thuong 92000, Vietnam
3
Faculty of Natural Sciences, Leibniz University Hanover, 30167 Hannover, Germany
*
Author to whom correspondence should be addressed.
Sustainability 2024, 16(2), 620; https://doi.org/10.3390/su16020620
Submission received: 20 September 2023 / Revised: 14 November 2023 / Accepted: 21 November 2023 / Published: 10 January 2024
(This article belongs to the Special Issue Sustainable Forest Management and Natural Hazards Prevention)

Abstract

:
Following the largest forest fire in Vietnam in 2002, various activities were undertaken to sustain the mangrove forest on peat soil remnants in the Mekong Delta region. These activities included promoting natural regeneration, afforestation, and rapid forest restoration measures, in addition to other protective measures such as rainwater retention to maintain moisture levels for fire prevention. However, two critical challenges emerged: allowing the forest to naturally regenerate would lead to annual forest fires but maintaining a constant water level through year-round water retention would harm biodiversity. The study was conducted in U Minh Thuong National Park to address forest regeneration. After a major forest fire in Vietnam, various measures were taken to promote forest regeneration, including afforestation, silvicultural solutions, and hydrological techniques such as rainwater storage to maintain humidity and prevent future fires. A hand drill was used to collect samples, and a total of 15 plots were set up to survey the growth of the forest at three peat thickness levels. At each of the three collection sites, samples of one kg were collected and labeled according to the site as UTM1, UTM2, and UTM3. The samples were then sent to the laboratory of the Southern Institute of Forestry Science for analysis. There was a relationship between the chemical indicators of peat and the evolution of the Melaleuca forest. Peat thickness and flooding regime significantly influenced the growth of the Melaleuca forest, while another identified relationship was between peat chemical indicators and forest growth. The chemical composition of peat water changed significantly due to the rainy and dry seasons, with nutrient content and pH affecting forest growth. Peat thickness and flooding regime were essential in regulating forest growth. These studies highlight the importance of considering multiple factors, such as peat thickness and chemical properties, when developing effective forest restoration strategies. By understanding the relationship between peat thickness, chemical properties, and forest growth, forest managers can develop targeted strategies to promote regeneration while minimizing negative impacts on biodiversity.

1. Introduction

U Minh Thuong National Park is a nature reserve located in the southwest of Vietnam, covering an area of approximately 80,000 hectares [1]. It is an area of significant ecological value, featuring both mangrove and wetland forests, and is home to many rare and endangered species of plants and animals [2,3]. The park has a high level of biodiversity, with over 500 species of plants and 254 species of animals, including many rare species such as green snakes, crocodiles, large reptiles, yellow parrots, and many migratory birds [4,5,6]. Due to its ecological significance, U Minh Thuong National Park was recognized by UNESCO as a World Natural Heritage Site in 2002 [7]. However, the park faces several significant conservation and development challenges that threaten its ecological health and biodiversity. Illegal logging is a severe problem, and unsustainable fishing and aquaculture practices are also causing environmental degradation. Climate change is another issue that poses a significant threat to the park’s ecosystems, with rising temperatures and sea levels potentially disrupting habitats and increasing the risk of wildfires [8]. Addressing these challenges will require the cooperation of Vietnamese scientists and government agencies, as well as the participation of local communities and stakeholders. Conservation efforts must focus on promoting sustainable development practices, including responsible logging and fishing, and finding ways to mitigate the impact of climate change. It is also essential to raise awareness about the park’s ecological significance and educate people on preserving biodiversity [9]. By working together to address these challenges, we can ensure that U Minh Thuong National Park remains a vital ecological area for future generations.
Peat is a valuable geological resource found in natural forests [10] and can be used effectively for forest fire prevention [11]. The unique properties of peat, such as its good water absorption and low combustibility, make it an ideal material for reducing the spread of wildfires and aiding firefighting efforts [2,12,13]. Research has shown that peat volume and quality can change over time, particularly in response to forest fires [14,15]. A study of peat volume change and forest growth in U Minh Thuong National Park found that the development of Melaleuca forests can be affected by the thickness of the peat layer, with thicker layers of peat leading to slower forest growth. Furthermore, the study also aimed to understand the chemical nature of peat after a forest fire. The results showed that the Melaleuca forest had regenerated after one year, and almost complete forest cover had been established on the remaining peat area. A study in India [16] suggests that if forest fire incidences continue at the current level, forests could experience a decline in tree diversity. This study states that information on peat is critical for understanding the ecological and environmental factors that influence forest growth and peat quality, and it can help inform conservation and management efforts in natural forests. Overall, peat is a valuable resource that can contribute to forest fire prevention efforts. However, it is crucial to understand how forest fires can impact the quality and volume of peat and how this can affect forest growth. By conducting research in this area, we can better understand the complex ecological and environmental factors that shape natural forests and develop effective conservation and management strategies to protect them. This study is focused on examining alterations in peat reserves resulting from water retention initiatives aimed at forest fire prevention. It encompasses an analysis of peat surveys conducted during the time intervals of 2003 and 2021, with the overarching aim of discerning shifts in peat reserves, peat quality, and the development pathway of Melaleuca forests across varying peat thicknesses. Furthermore, changes in peat chemical properties over the period from the aftermath of the 2003 forest fire to the time of our study in 2022 will be examined. Comprehensive analyses of chemical properties and nutrient constituents will be conducted, providing insights into the ecological factors affecting Melaleuca forest growth. Following the 2003 forest fire, significant efforts were made to regenerate the forests that covered a substantial portion of the remaining peatland. The distribution of peat was found to vary with the thickness of the peat layer, which in turn affects its inherent characteristics. Additionally [17], we explore the growth patterns of Melaleuca forests that share the same age range (2003–2021). Given the importance of this study in gaining scientific knowledge about variations in peat quantity, chemical properties, and nutrient content, it also serves to improve our understanding of Melaleuca forest growth at different peat distribution levels. As a result, our research strives to shed light on the evolving dynamics of peat changes under the influence of water management interventions in U Minh Thuong National Park, thereby clarifying the underlying objectives of this study.

2. Material and Methods

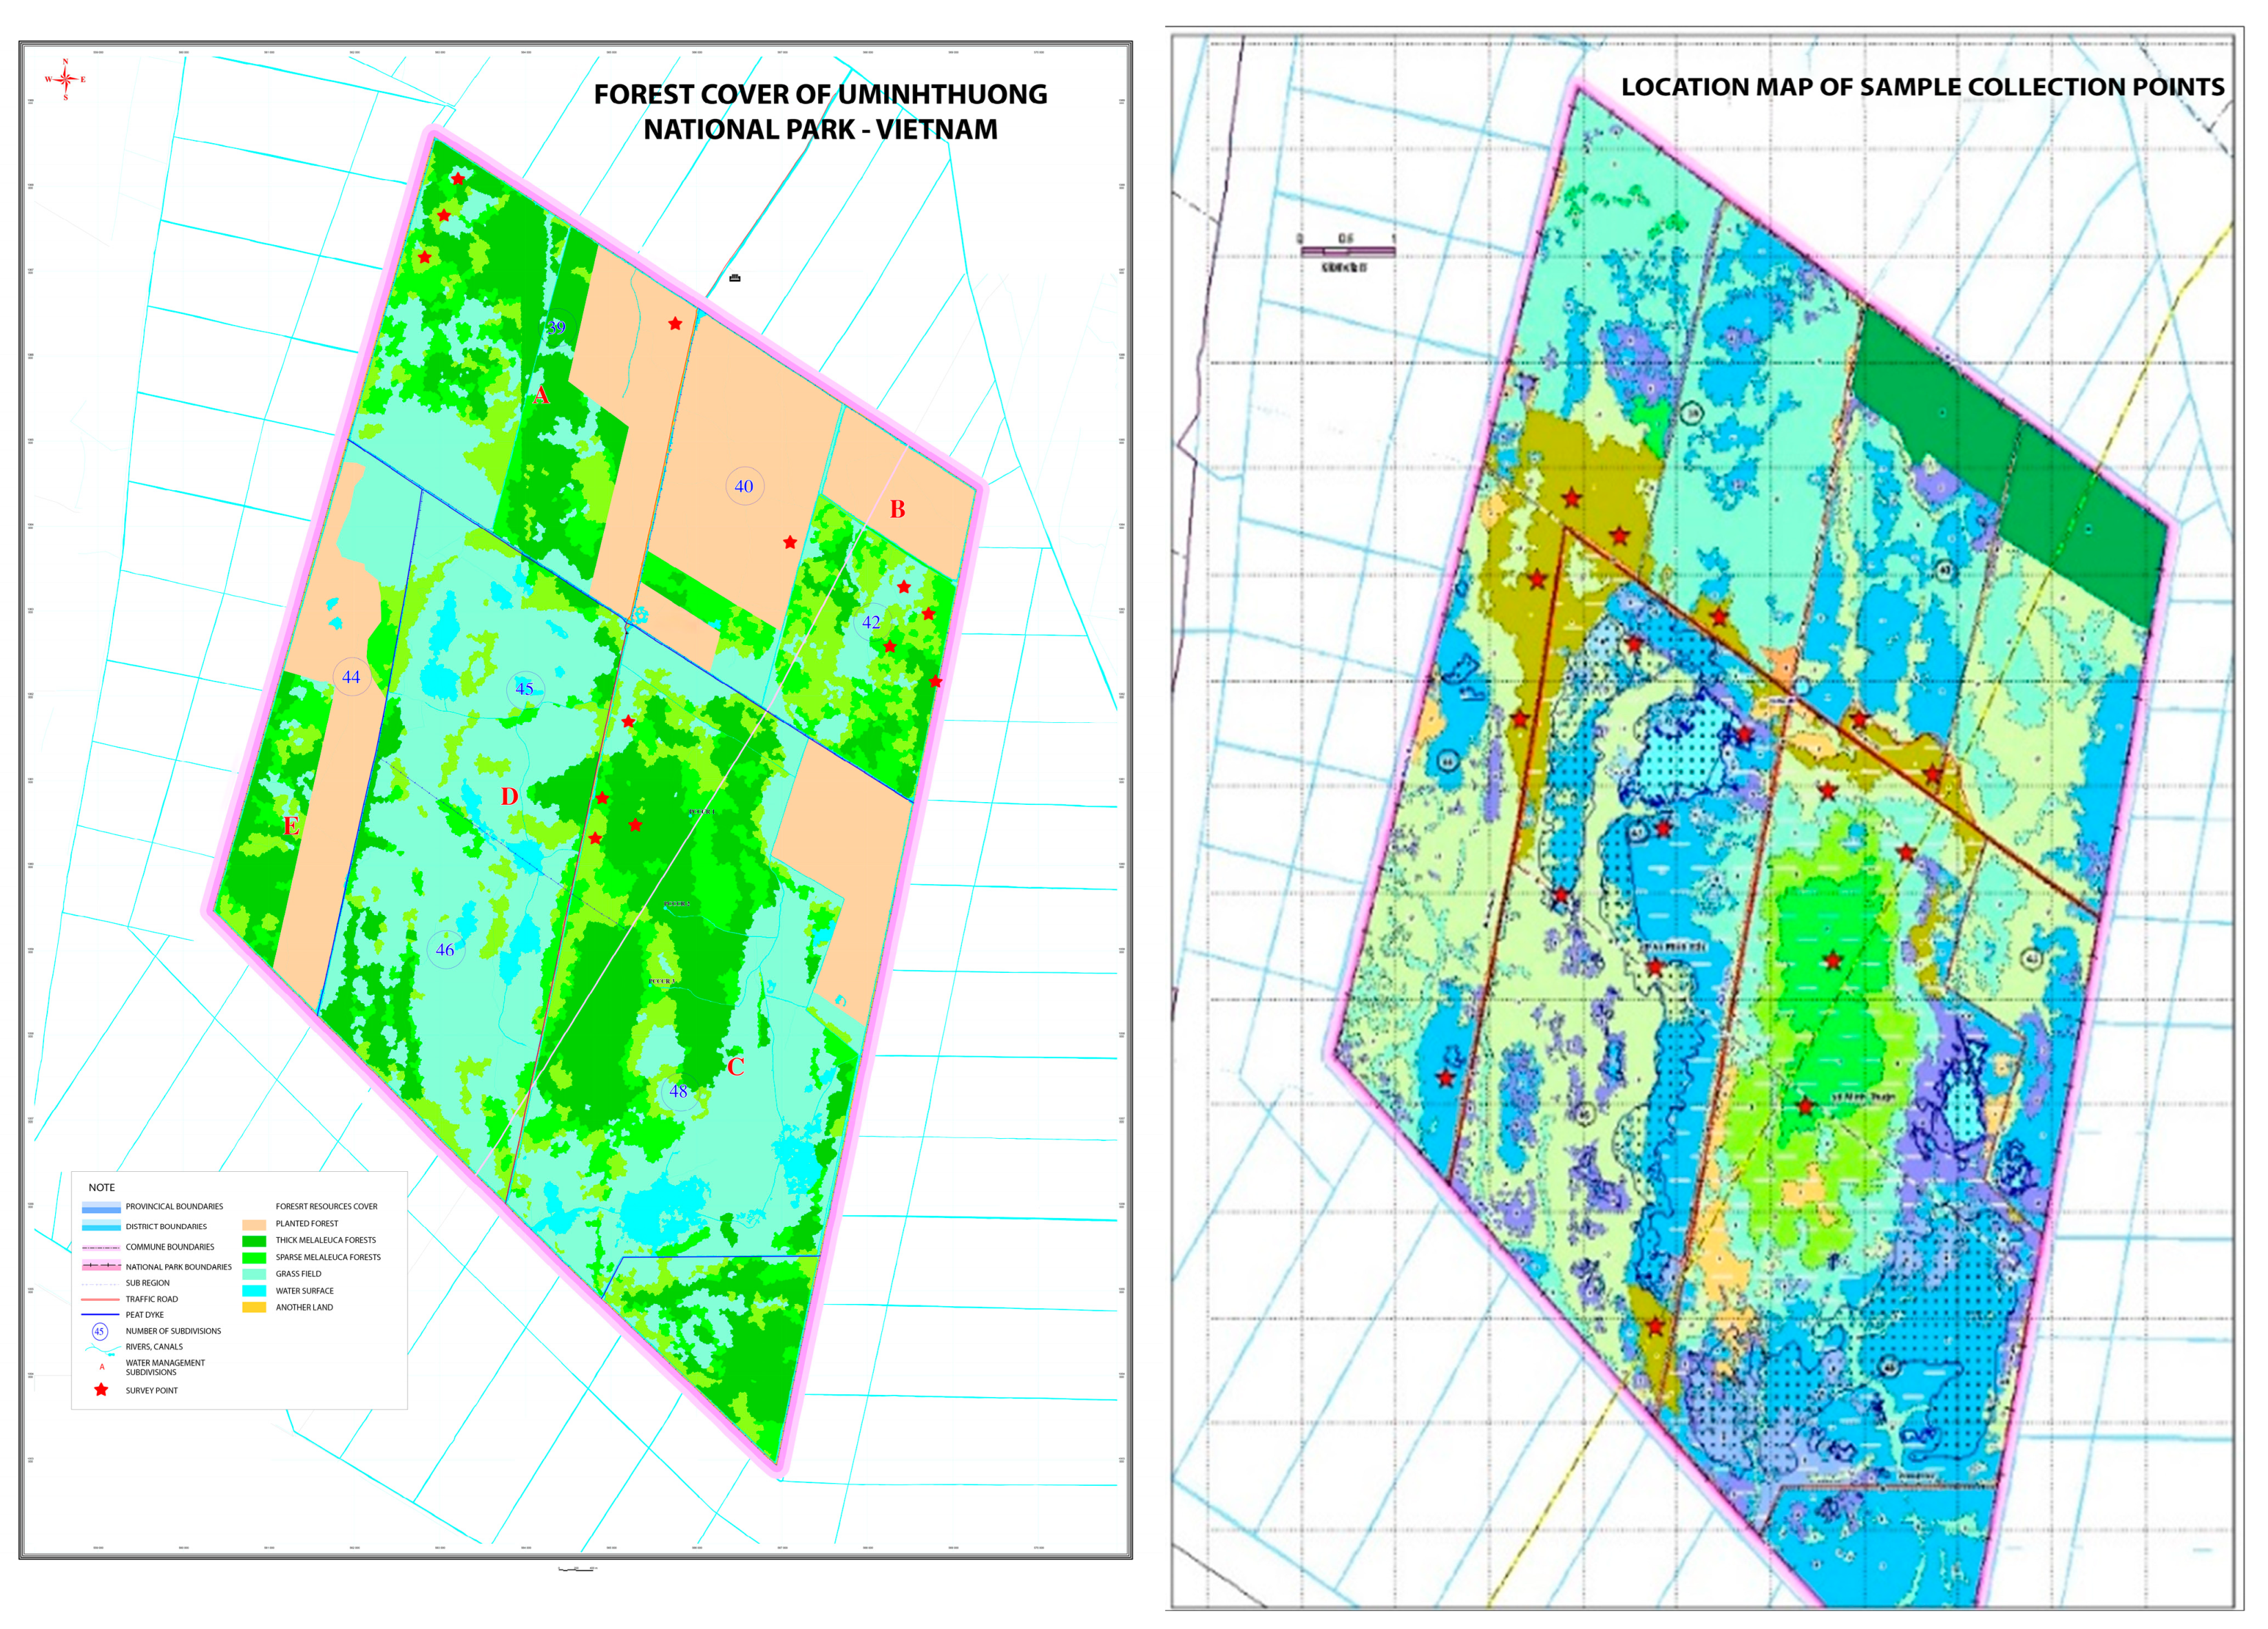
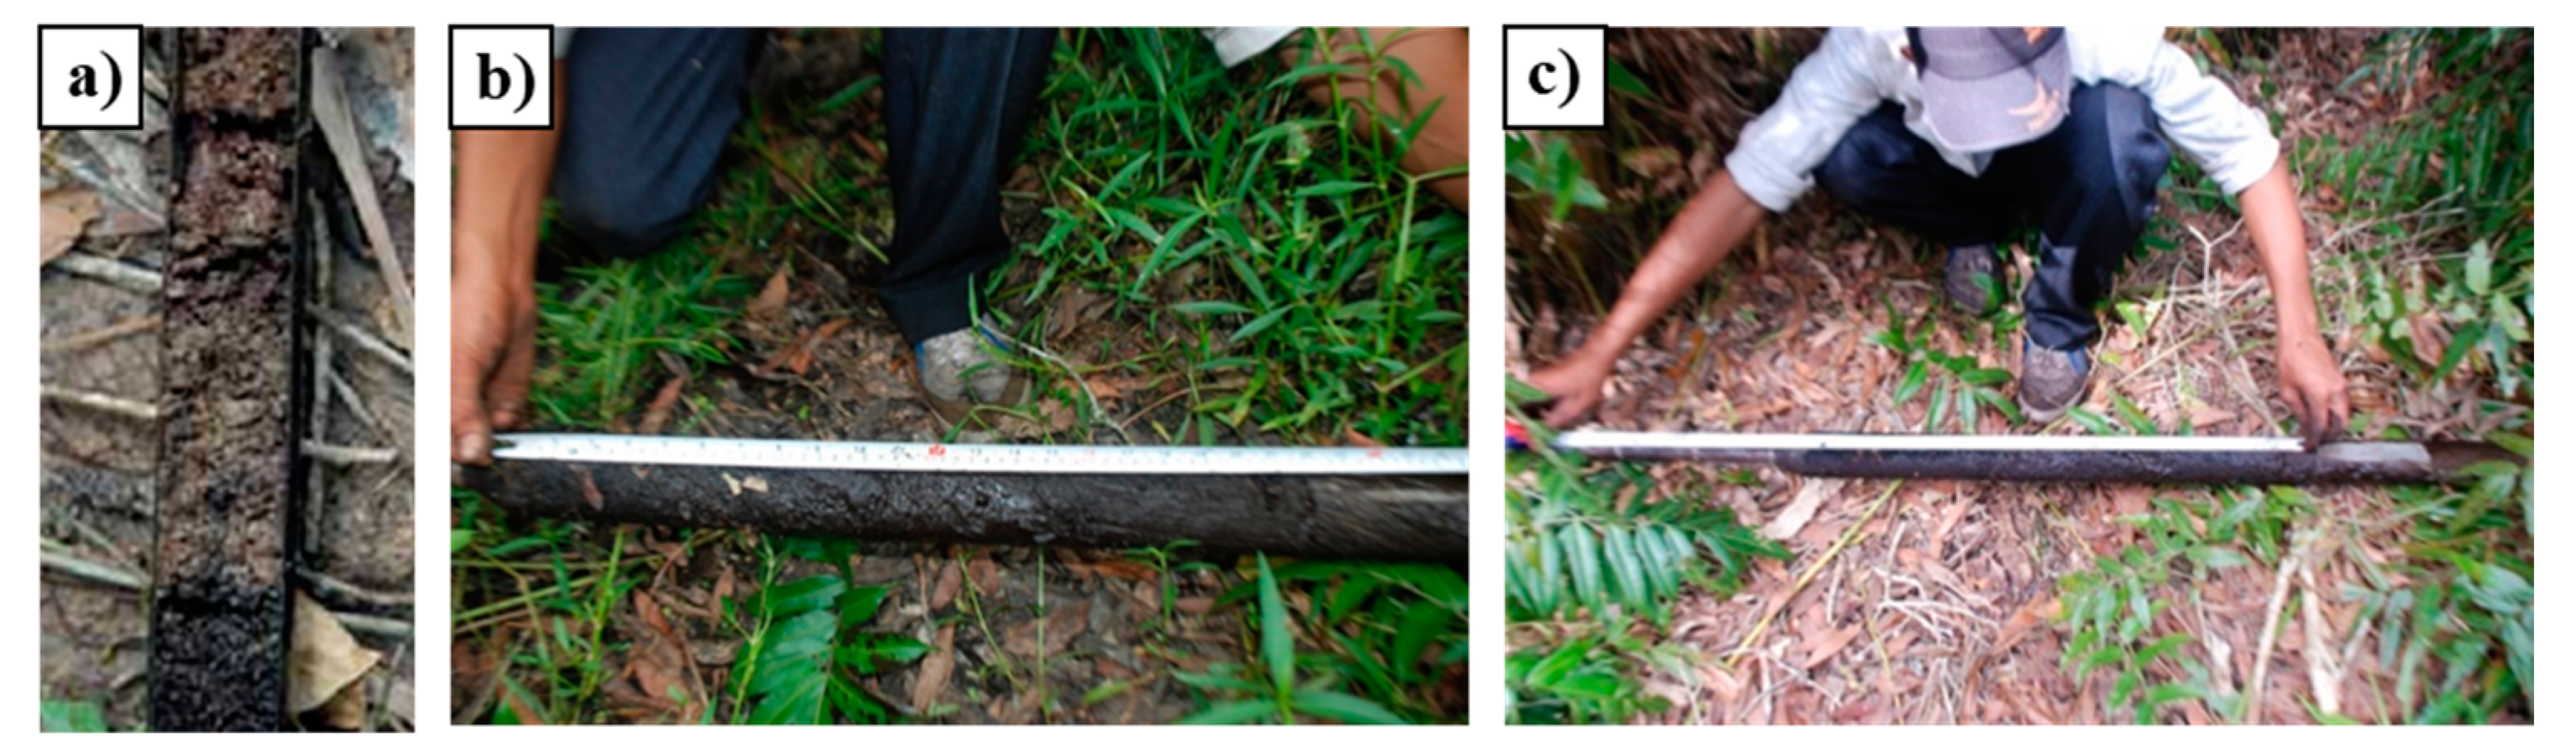
2.1. Sample Collection

Using a hand drill to collect samples, a total of 15 plots were set up to survey the growth of the forest at three different peat thickness levels. There were 5 plots for the thickness level from 5 cm to 12 cm; 5 plots for 20 to 56 cm; and 5 for 86 to 92 cm (15 plots in total). Each site to collect samples is three, and each sample is one kg and coded a member of the site as UTM1, UTM2, UTM3, following the same name of the survey plots, then gets to the laboratory of Southern Institute of Forestry Science for analysis.
Forest growth survey: Based on the peat status map and map of regeneration status after the forest fire (after 2002), the forest cover map 2021 of U Minh Thuong National Park (update from 2003 to 2021). Determine the location coordinates of peat levels (3 levels):
-
peat thinning from 5 cm to 12 cm (survey 5 plot).
-
peat medium from 20 cm to 56 cm (survey 5 plot).
-
pick peat from 86 cm to 9 2 cm (survey 5 plot).
-
Survey plot area 500 m2/plot (20 m × 25 m).
Hand drill on predetermined coordinates in the field, each sample takes form from top to bottom with the layer of peat being one kg per sample.
How to measure circumference: Use a tape measure to measure the circumference at 1.3 m (diameter divided by 3.1416).
How to measure height: Divide the ruler into centimeters using a pole from the base to the top of the trees in the plot.
How to measure the canopy diameter: Divide the ruler into centimeters in two directions (east-west and south-north), add the two measurements, and divide by two into average canopy tree Dc.
How to measure the diameter for a 1.3 m circumference: Divide the tape measure into millimeters to measure the tree’s circumference at 1.3 m, then calculate D = C/3.1416.
The formula for the diameter of the trunk (D1.3)
D 1 . 3 = C 1 . 3 π
The formula for calculating the area of the trunk cut at a position of 1.3 m (G1.3)
G 1 . 3 = D 1 . 3 4   × π
D1.3: The trunk diameter at position 1.3 m
G1.3: The area of the trunk cut at a position of 1.3 m
Dc: The canopy diameter (m)
Gc: The canopy area (m2)
H t : Height to top (m)
f : The volumetric tree coefficient (calculated 0.5)
N/p: Number of trees in the survey plot.

2.2. Analytical Methods in the Laboratory

Previous documents on forest vegetation, topographic maps, and hydrological regimes related to peat soil in U Minh Thuong National Park were analyzed.
Peat sample collection: Based on the topographic map of 2010 and annual water level monitoring results, collect 15 samples of soil at different inundation levels. The collection time (June/2022) is the dry season. Using a hand drill, drill deep into the peat layer to collect samples. For the locations of the sampling points, see Figure 1.
From 15 points of the U Minh Thuong National Park, collect 15 peat samples with extra deep peat layers ranging from 0.5 cm to 92 cm. The peat samples are sorted according to all the peatland areas in the National Park. Peat with a 5–56 cm thickness occupies most of the national park’s core zone.
The peat samples were analyzed at the ecological center of the Institute of Forest Science in Vietnam.
Analytical parameters include:
-
Weight of peat;
-
pH H2O, pH KCl;
-
Composition of organic;
-
Composition of inorganic:
Calculate peat and carbon reserves.
Peat reserves are calculated using the formula:
(Mp): Mp = h × Sc × Dd
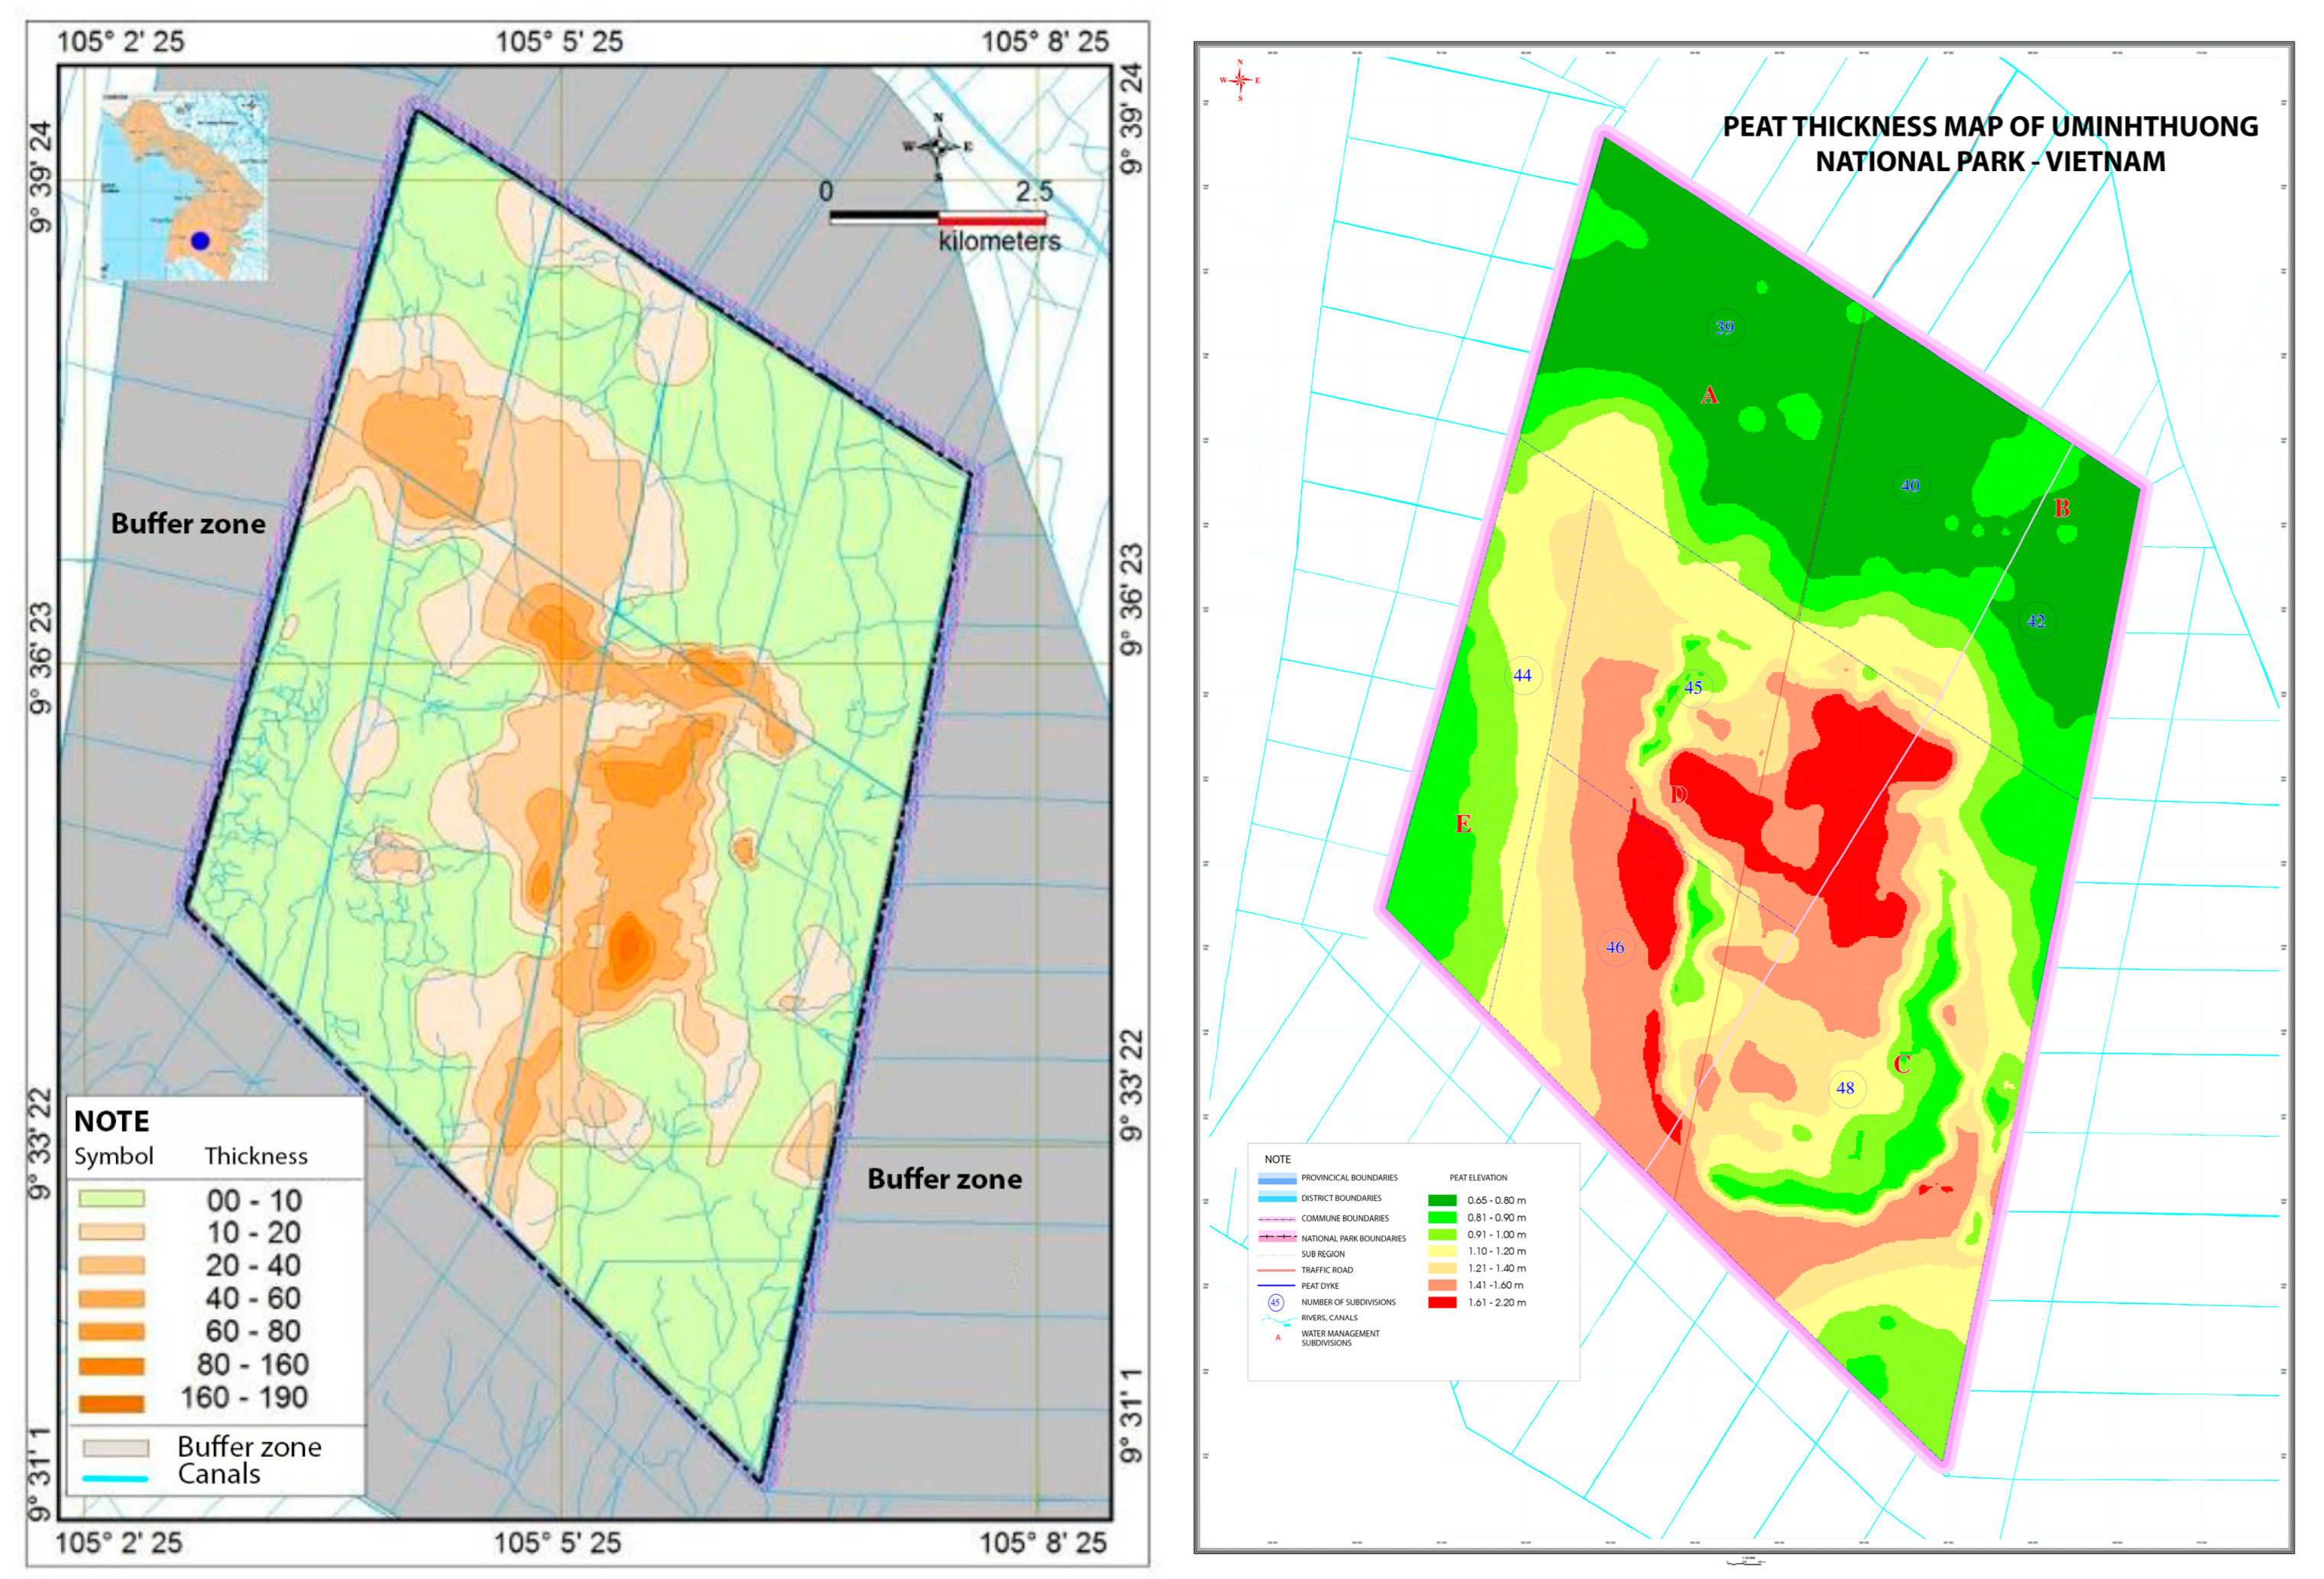
  • h: Peat layer thicknesses, Si: Peat land area, Dd: Peat weight in volume.
Carbon reserves (Mc):
Mc = Mp × %C
  • Mp: Peat reserves, %C: % of carbon in peat.
Calculation of emissions due to peat oxidation.
Oxidative emissions of peat, based on peat area and groundwater level characteristics, were calculated. Apply the formula used in Indonesia, 91 tons/ha/year on 1 m per deep (Hooijer et al., 2010) [18]. However, U Minh Thuong National Park is flooded in the dry season; in some areas, the water level drops in six months, so the calculated coefficient is 45 tons/ha/year per 1 m of depth. Thus, the total emission is calculated as follows:
CO2 emission = LUArea. × DArea. × DDepth. CO2 − 1 (ton/year)
  • LU Area: Peat land area, D Area: Peat land area when the water level has dropped to the ground, DDepth: Average depth of water level in the area when fallen to the ground, CO2—1: CO2 emission in average depth of underground water level = 45.5 ton CO2/ha/year).
Groundwater level data in inherited groundwater level monitoring data from 2002–2021.
The research method of content 2. Determine peat properties under the Melaleuca forest after a forest fire (2003–2021). A total of 15 peat samples were collected in 15 plots:
  • Thinning peat from 5–12 cm (5 peat sample).
  • Average peat form 20–56 cm (5 peat sample).
  • Thick peat from 86–92 cm (5 peat sample).
Include each sample represented for, once again, the peat plot set up in the center of the survey plot. The characteristics of the peat era were evaluated through the criteria: pH (H2O); pH KCl, Mùn (%), Nitơ total (%), P2O5 (%), K2O (%), Fe2+ (mg/100 g), SO4+ (mg/100 g), acid humic (%). The pH (H2O) and pH (KCl) were determined with a pH meter. Humus content and acid humic were evaluated by Walkley Black and total nitrogen by the Kjeldhahl method (De Vos et al., 2007). P2O5 was indicated by the colorimetric method. All indications were analyzed at the laboratory of the Southern Forest Sciences Institute and the laboratory of Kien Giang University.

2.3. Data Analysis

The analysis involves using t-tests and one-way analysis of variance (ANOVA) to compare the mean differences between peat and forest growth on the different thickness levels of peat [19]. Correlation analysis using the Pearson correlation coefficient described the interdependence between peat quality and the development of Melaleuca trees. A correlation is considered significant when the p-value is less than 0.05, and the correlation coefficient (r) is more significant than 0.5 in absolute value [20]. The analysis focused on the relationship between the peat environment indicators and the growth of Melaleuca forests on different peat thicknesses. Spearman’s correlation coefficient was used for analysis, and the significance level will be set at p < 0.05 [21]. If the correlation coefficient of the variable (peat) levels is significant, hypothesis Ho will be rejected, indicating a correlation between peat characteristics and forest growth. Data processing, including statistical calculations, description, test hypotheses, and graph drawing, was performed using Microsoft Excel 2016, Statgraplies Centurion 19.12, and IBM SPSS Statistic version 20.0 [22].

3. Results and Discussion

3.1. Research Results of Seasonal Peat Change (Development after Fire 2003–2022)

Changes in Peat Volume Due to the Inundation Regime

Table 1 (Figure 2) shows the changes in peat volume resulting from the inundation regime in the 8038 ha core zone of U Minh Thuong National Park. (Figure 3) The park includes a 3906.6 ha peat layer ranging from 30 cm to 130 cm in depth. Within this area, the peat layer from 120 cm to 130 cm in depth covers 148 ha, while the peat layer from 30 cm to 120 cm in depth covers 3758.6 ha. Specifically, the peat layer from 70 cm to 120 cm in depth covers 427.9 ha. The peat status before the forest fire in 2002 and the present status are presented in Table 1 for comparison.

3.2. Status of Peat Land before Forest Fire 2002

The peat layer (Figure 4) can be categorized into two types based on its form: black peat and brown peat. Black peat is tightly compressed and can be found in the lower part of the peat layer, while brown peat has a loose structure and may contain rotten wood in some areas, laying directly on top of the black peat layer.
After a forest fire, the peat left behind is primarily black, typically less than 1.3 m thick, and has a higher percentage of tight soil. The packed dirt allows for better capillary water permeability, making the black peat layer usually wetter than the brown peat layer. The black peat layer is also more porous and harder to burn, except in arid weather or when located far from water channels with low humidity, and forest fires are more likely to occur.

3.3. Peat Status after Forest Fire 2003

According to SubFIPI’s 2005 report, the total remaining peat area in U MT National Park is 3907 hectares. This area is further divided into four categories based on the depth of the peat layer: the area with a peat layer depth between 120 and 130 cm is 148 hectares, the area with a depth between 100 cm and 120 cm is 449 hectares, the area with a depth between 70 and 100 cm is 979 hectares, and the area with a depth between 30 cm and 70 cm is 2331 hectares, as shown in (Figure 5). To explain this statement, it provides information about the remaining peat area in U MT National Park and how it is distributed based on the depth of the peat layer. Peat is a type of soil formed from the accumulation of partially decayed organic matter, typically found in wetlands. The depth of the peat layer can be an essential factor in determining the quality and productivity of the soil. The statement informs us that there are four categories of peat layer depth in the remaining peat area of U MT National Park: 120–130 cm, 100–120 cm, 70–100 cm, and 30–70 cm. The largest area of remaining peat is in the category with a depth of 30–70 cm, which covers 2331 hectares. The next largest area is in the 70–100 cm depth category, which covers 979 hectares. The smallest area is in the category with a 120–130 cm depth, which covers only 148 hectares. Overall, the statement provides essential information about the distribution of the remaining peat in U MT National Park, which could be helpful for researchers, policymakers, and conservationists interested in understanding this unique ecosystem’s ecology and potential uses.
According to Table 2 [23,24] the amount of peat reserves remaining after a forest fire is 26,765,500 cubic meters. This represents the total volume of peat not consumed by the fire. Additionally, the remaining peat weighs 6,373,913 metric tons, the mass of the remaining peat. The statement also indicates that the remaining peat contains 2,682,212 metric tons of carbon. Peat is a type of soil that contains large amounts of organic matter, including carbon. The carbon stored in peat is a crucial consideration for climate change, as peatlands are among the most oversized carbon sinks on the planet. When peatlands are degraded or disturbed, the stored carbon can be released into the atmosphere, contributing to global warming. Overall, the statement provides essential information about the impact of a forest fire on peat reserves and the associated carbon content. This information could be helpful for researchers and policymakers interested in understanding the carbon dynamics of peatlands and the potential implications for climate change.

3.4. Peat Change after Change in Water Level Goes Down (2012–2022)

Peatlands are unique ecosystems that play a critical role in global climate regulation by sequestering significant amounts of carbon. U Minh Thuong National Park in Vietnam is known for its extensive peatlands, an essential habitat for various species, including the endangered white-winged ducks. To better understand the peatlands in UMT National Park, Tran Van Thang was surveyed in September 2022 to determine the thickness and volume of peat in different park areas [3]. The survey was designed to be comprehensive and covered a wide range of peat thicknesses.
To begin the survey, Tran Van Thang examined the park map and selected four different height levels based on the thickness of the peat layer [3]. These height levels were less than 20 cm, 20 cm to 50 cm, 50 cm to 100 cm, and greater than 100 cm. Five survey plots were selected for peat volume measurement and peat sampling within each height level. At each survey plot, peat volume was calculated using the formula M = hx SixDd, where M is the peat volume, h is the peat layer thickness, Si is the area of the survey plot, and Dd is the density of the peat. The density used for the calculation was 0.24, and the percentage of carbon (C%) was 42.12%, as [3] reported. The collected peat samples were also analyzed for carbon content and other characteristics.
The survey results are presented in Table 3 (Figure 6), which shows the thickness of the peat layer at each height level. The calculated peat volume based on these measurements was 1,085,493 metric tons. This information is valuable for researchers and policymakers interested in understanding the ecology and potential uses of the peatlands in UMT National Park, as well as for conservation efforts to protect the park’s unique ecosystem. Overall, the peat survey by Tran Van Thang provides essential information about the thickness and volume of peat in UMT National Park. By increasing our understanding of the peatlands in the park, we can better protect and conserve this valuable ecosystem for future generations [3].

3.5. Discuss the Results of Peat Volume

Observe the results. Table 1, Table 2 and Table 3 show that the peat is rapidly decreasing in volume and weight. Between 2012 and 2022, there is a huge loss of peat due to water storage to fight forest fires. This indicates that the volume, weight, and carbon content decreased very quickly.

3.6. Change in Peat Chemical Composition Caused by Inundation Regime in Different Peat Thicknesses

Chemical Compositions of Peat

Chemical compositions of peat in the wet season in different peat thicknesses. According to the study [25] results, the average pH of the peat in the wet season was 5.21. The pH was higher (less acidic) at sites with thinner peat layers, with an average pH of 5.66. However, as the peat layer thickness increased from 20–56 cm, the pH decreased, indicating increased acidity. The lowest pH value of 4.58 was observed at a peat thickness of 86–92 cm. The results showed that higher peat thickness was associated with higher acidity in the wet season (with a statistical significance of p < 0.01). The study also examined the peat’s average content of three essential nutrients: P2O5, Nts, and K2O. The moderate P2O5 content was 0.1 mg/L, which increased as the peat thickness increased. Specifically, the content was 0.09 mg/L for peat thicknesses of 5–12 cm, 0.1 mg/L for thicknesses of 20–56 cm, and 0.11 mg/L for thicknesses of 86–92 cm. The difference in P2O5 content between different peat thicknesses was statistically significant (with a significance level of p < 0.05). The average Nts content was 0.89 mg/L, and, similar to P2O5, the content tended to increase as the peat thickness increased. The Nts content was 0.66 mg/L for peat thicknesses of 5–12 cm, 0.98 mg/L for thicknesses of 20–56 cm, and 1.03 mg/L for thicknesses of 86–92 cm. The difference in Nts content between different peat thicknesses was statistically significant (with a significance level of p < 0.05). Finally, the average K2O content was 0.49 mg/L, and, similar to P2O5 and Nts, the content tended to increase as the peat thickness increased. The K2O content was 0.41 mg/L for peat thicknesses of 5–12 cm, 0.51 mg/L for thicknesses of 20–56 cm, and 0.55 mg/L for thicknesses of 86–92 cm. The difference in K2O content between different peat thicknesses was also statistically significant (with a significance level of p < 0.05). These results suggest that the nutrient content of the peat is influenced by its thickness, with thicker peat layers generally containing higher levels of nutrients.
The acid humic, SO42−, NH4+, and Fe2+ did not vary significantly across the different peat thicknesses measured in the study. The p-values indicate that no statistical evidence suggests that the differences observed were not due to chance (Table 4).
Chemical composition of peat in the dry season in different peat thicknesses. During the dry season, significant differences were observed in the chemical composition of peat at different depths (p < 0.01 for all cases, as shown in (Table 5). Various parameters were analyzed, including pH, acid humic, SO42−, P2O5, NH4+, Nts, K2O, and Fe2+. The results indicated that as the peat thickness increased, the pH levels, acid humic, SO42−, P2O5, and NH4+ tended to decrease (Table 5). These parameters are important indicators of the acidity and nutrient content of the peat. The decrease in these indicators with increasing peat thickness suggests that deeper layers of peat may be less suitable for plant growth and other ecosystem processes. In contrast, the concentration of Nts, K2O, and Fe2+ increased gradually with peat thickness (Table 5). These parameters are essential indicators of nutrient availability and soil fertility. The increase in these indicators with increasing peat thickness suggests that deeper layers of peat may be more nutrient-rich and fertile, supporting essential ecosystem processes. Overall, these findings demonstrate the importance of considering peat depth when assessing the chemical composition of peatlands. Researchers and policymakers can use the data in (Table 5) to better understand the ecology and potential uses of peatlands in different areas and for conservation efforts to protect these unique ecosystems.

3.7. Chemical Compositions of Peat Water

Chemical compositions of peat in the wet season (11/2021). In 2021, during the wet season, significant differences were observed in the chemical composition of peat between different depths (p < 0.001 for all cases). The data presented in Table 6 demonstrate that various indicators, including pH, acid humic, Nts, Fe2+, and P2O5, were analyzed. The results indicated that pH and acid humic tended to decrease as the peat depth increased, ranging from 6.31 to 5.08 for pH and 8.49 to 4.73 for acid humic, as shown in Table 6. These two parameters indicate the peat’s acidity and organic matter content. Their decrease with increasing depth suggests that deeper layers of peat may be more acidic and contain less organic matter. In contrast, the concentration of Nts, Fe2+, and P2O5 increased as the peat depth increased. These parameters are essential indicators of nutrient availability and soil fertility. The increase in these indicators with increasing peat depth suggests that deeper layers of peat may be more nutrient-rich and fertile, potentially supporting essential ecosystem processes. Overall, these findings demonstrate that the chemical composition of peat can vary significantly depending on the depth, with some parameters decreasing and others increasing with increasing depth. The data provided in Table 6 can be helpful for researchers and policymakers to understand better the ecology and potential uses of peatlands in different areas and for conservation efforts to protect these unique ecosystems.
Chemical composition of peat water in the dry season (6/2022). In the dry season of 2022, the chemical composition of different grades of peat also varied significantly, as indicated by p < 0.001 for all cases in Table 7. However, the trends in some chemical compositions differed from those observed in the wet season. In particular, the concentration of humic acid tended to increase sharply in deeper layers of peat (86–92 cm, 119.38) compared to the surface layer (5–12 cm, 26.43). This was opposite to the trend observed in the wet season. Additionally, the concentration of Fe2+ tended to decrease as the peat depth increased, contrary to the trend observed in the wet season. These findings suggest that the chemical composition of peat can vary significantly between different seasons and that further research is needed to understand the underlying mechanisms behind these variations.

3.8. Research Results on Growth of Melaleuca Forest on Peatland

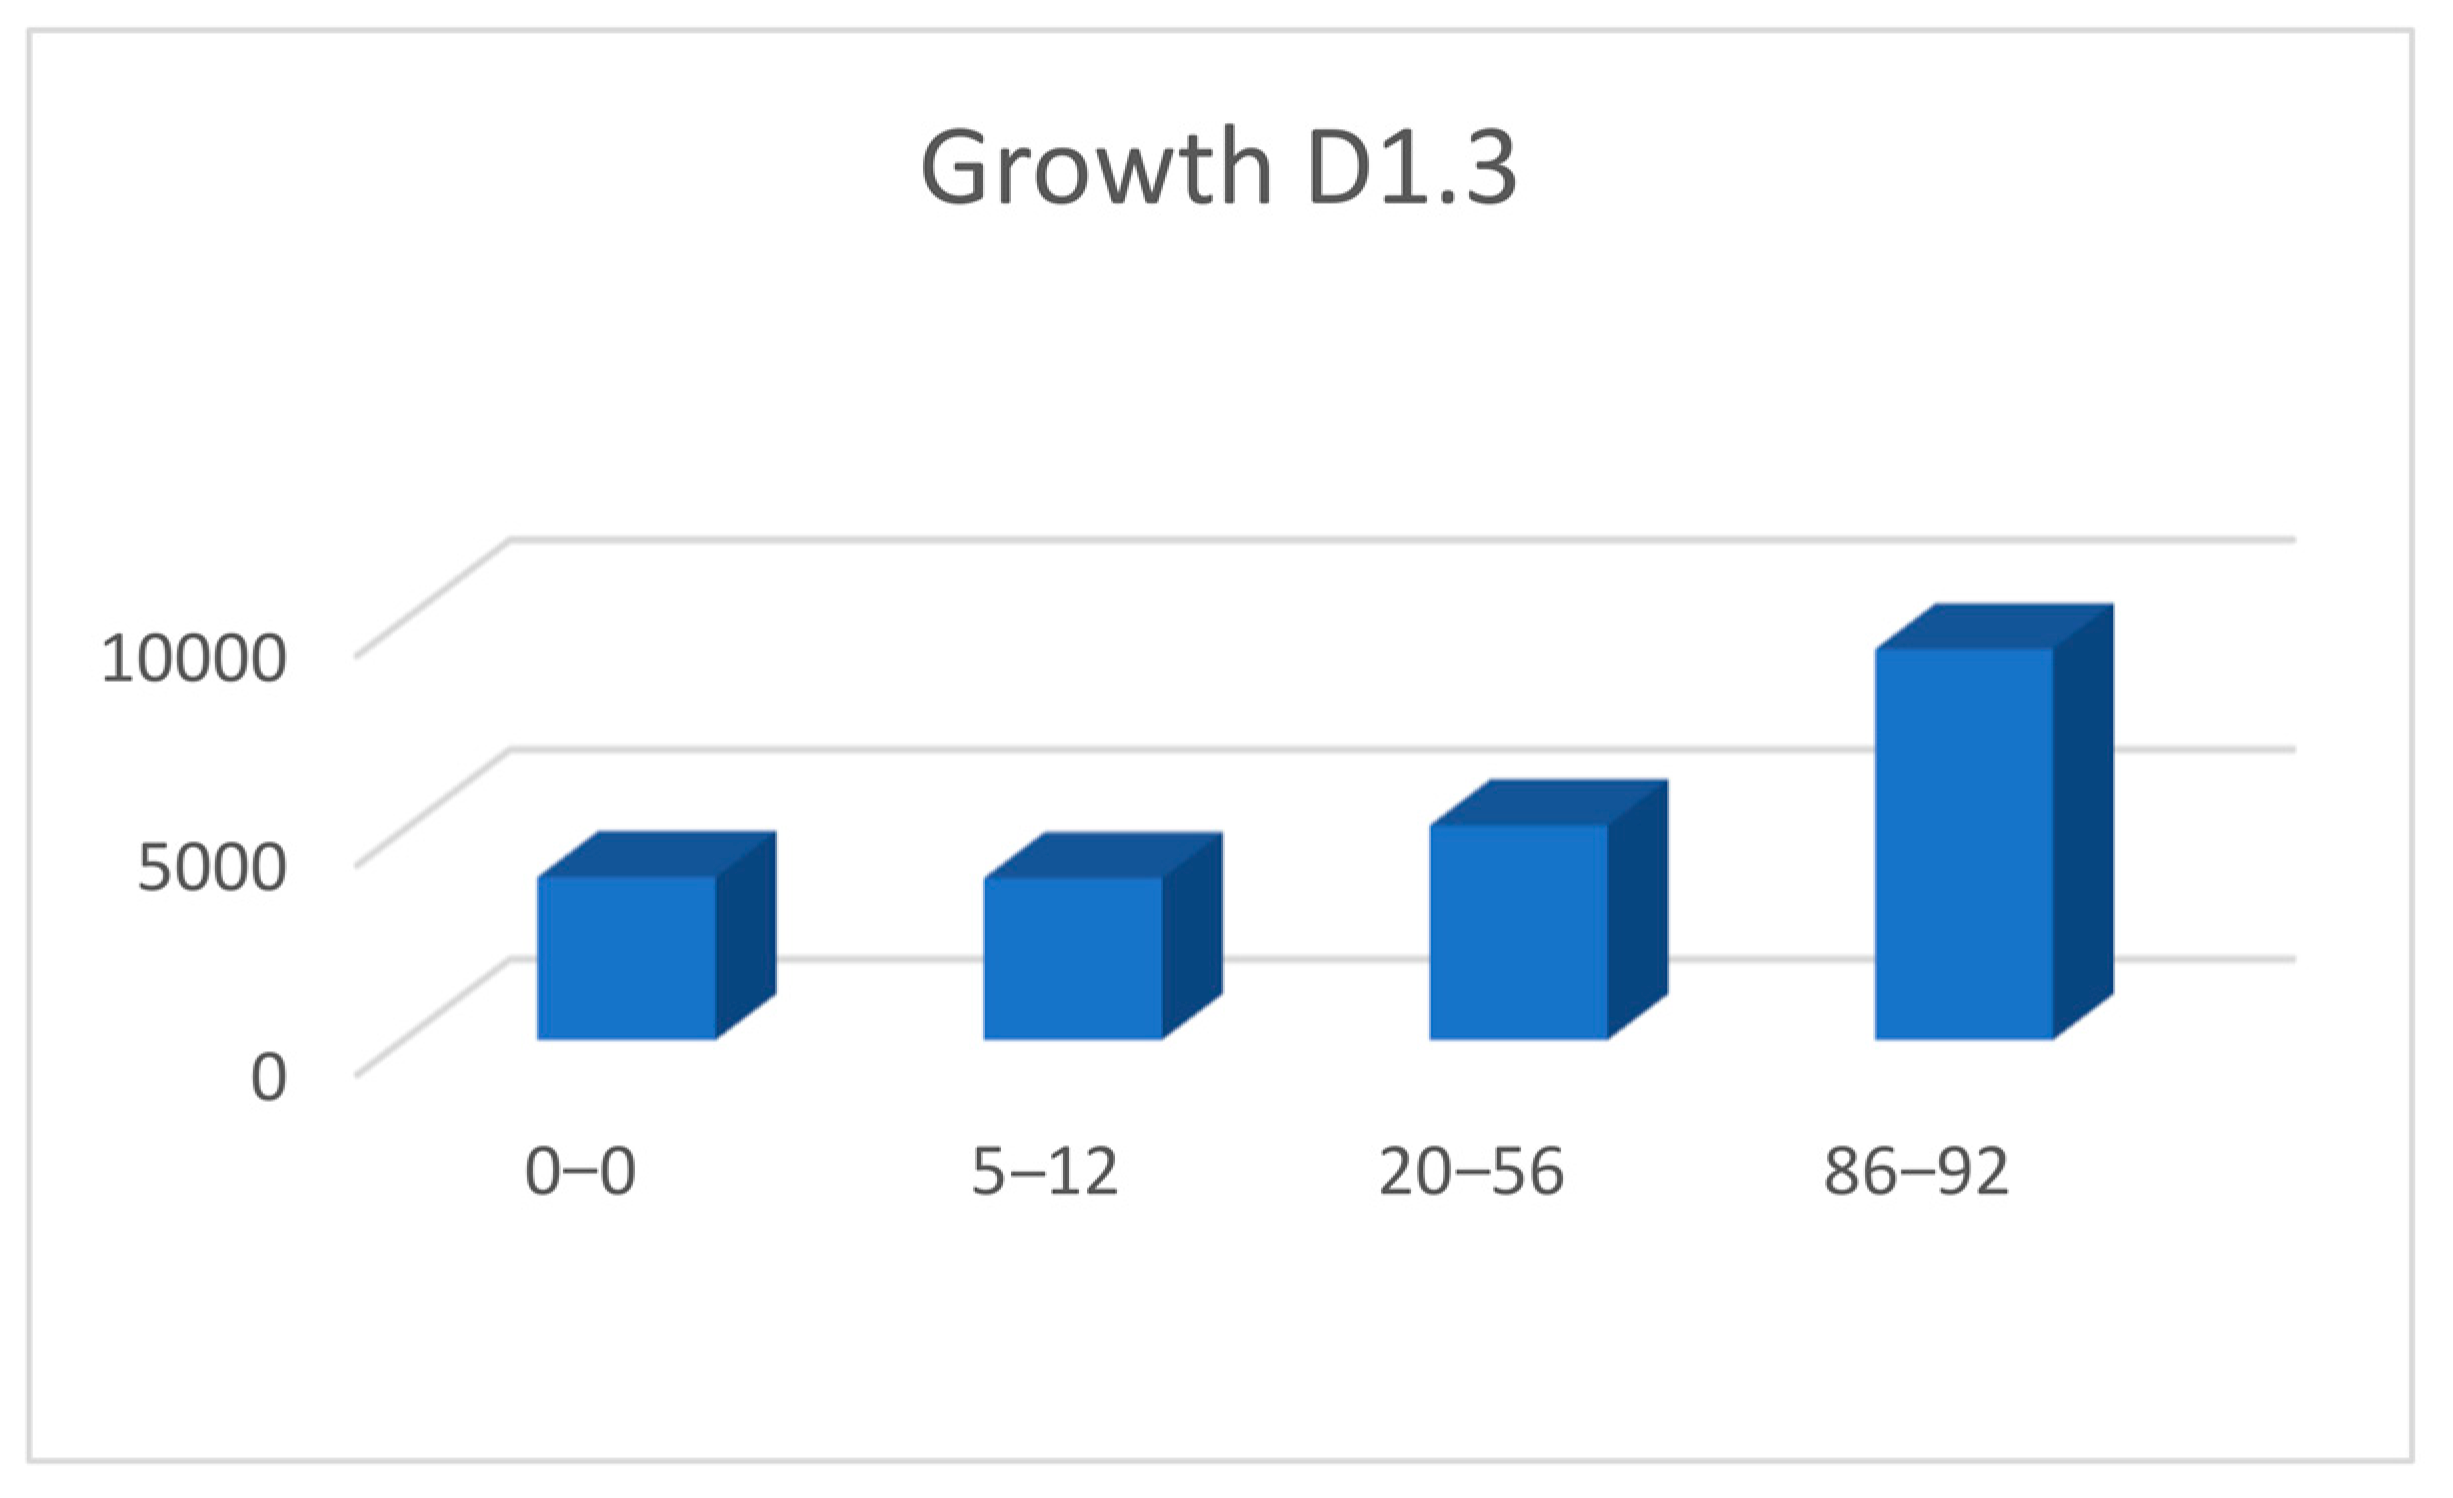
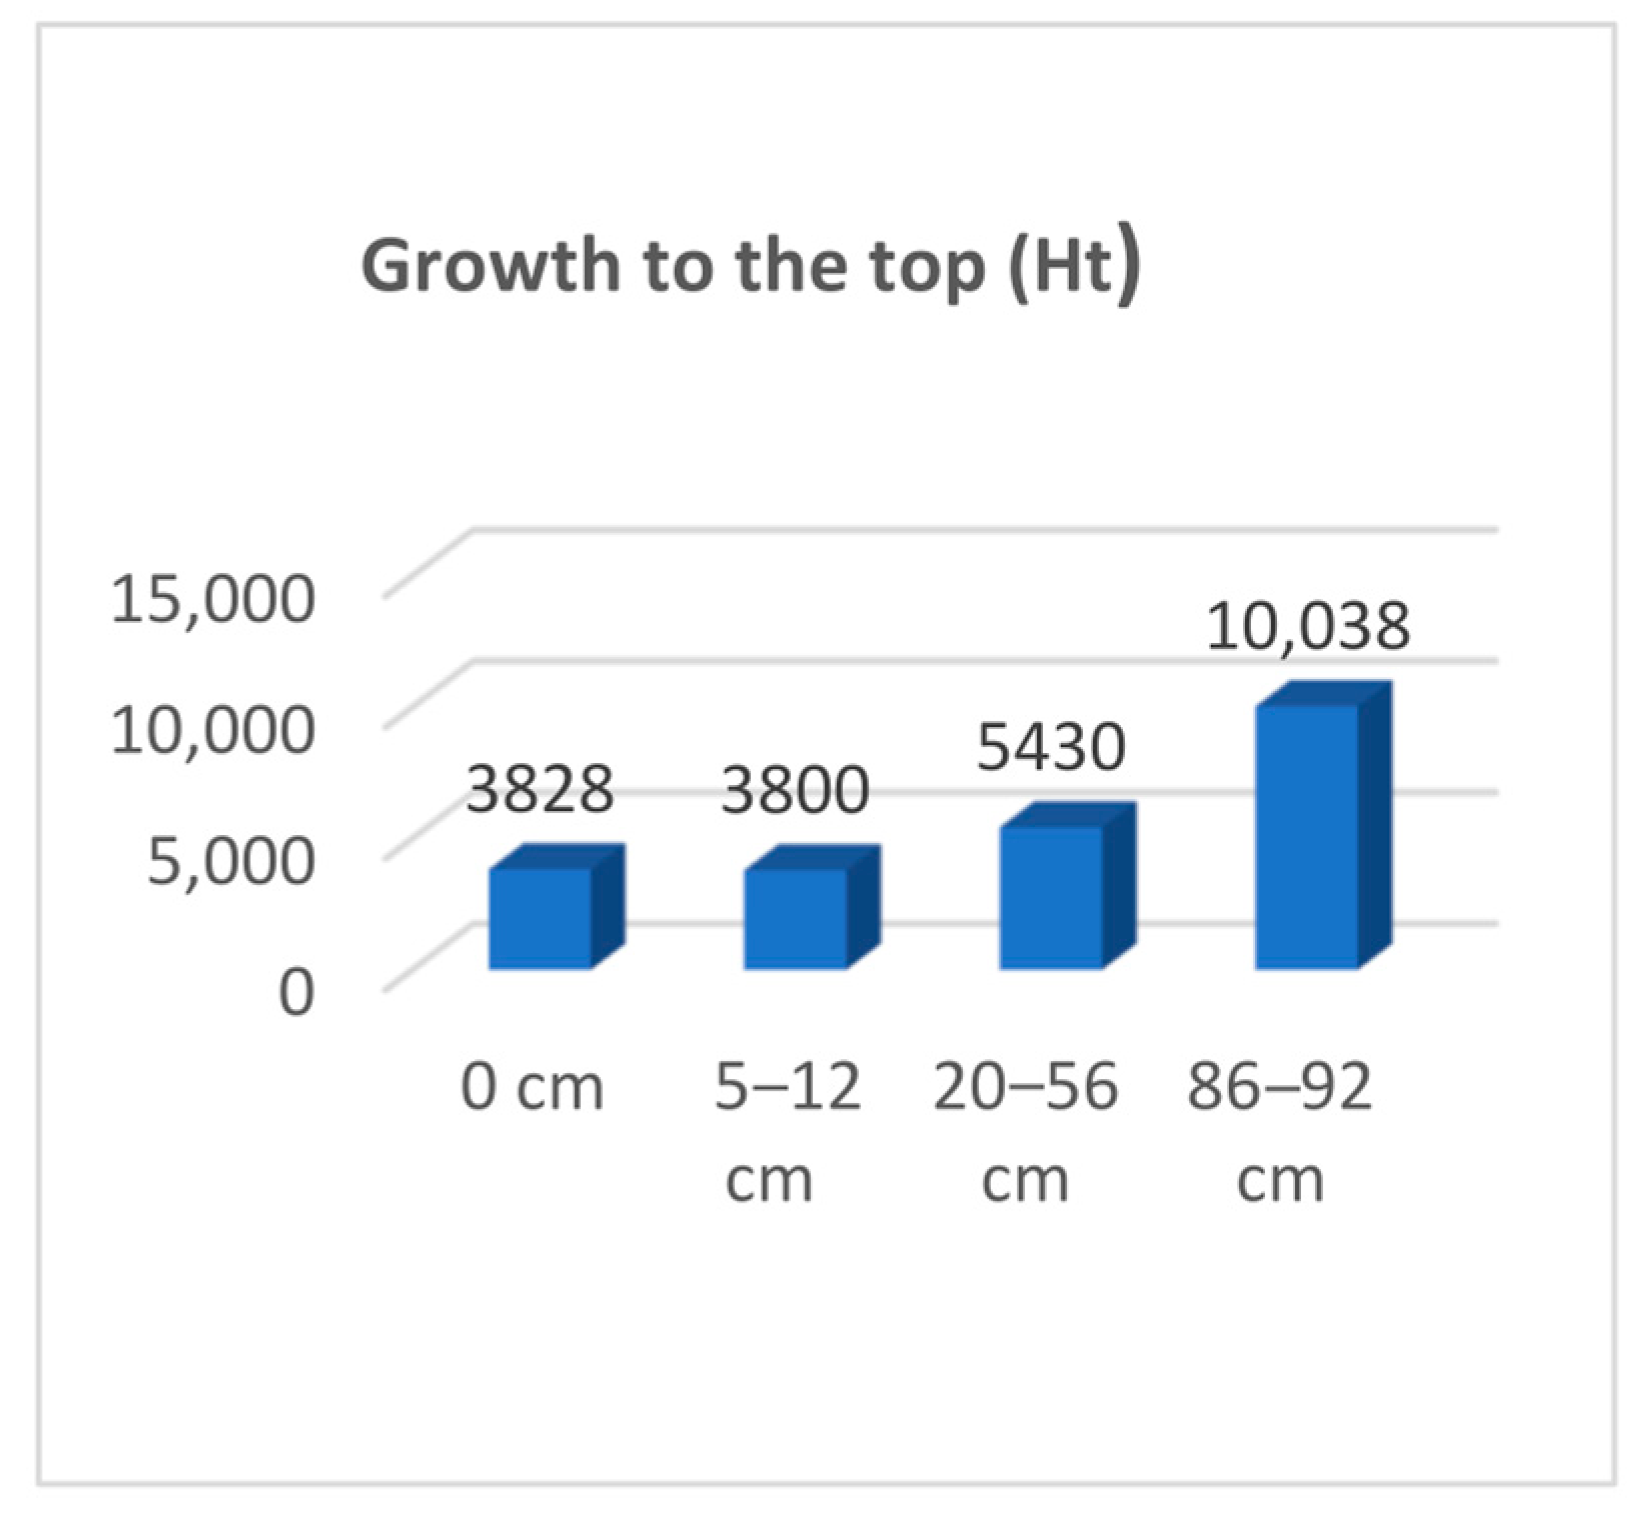
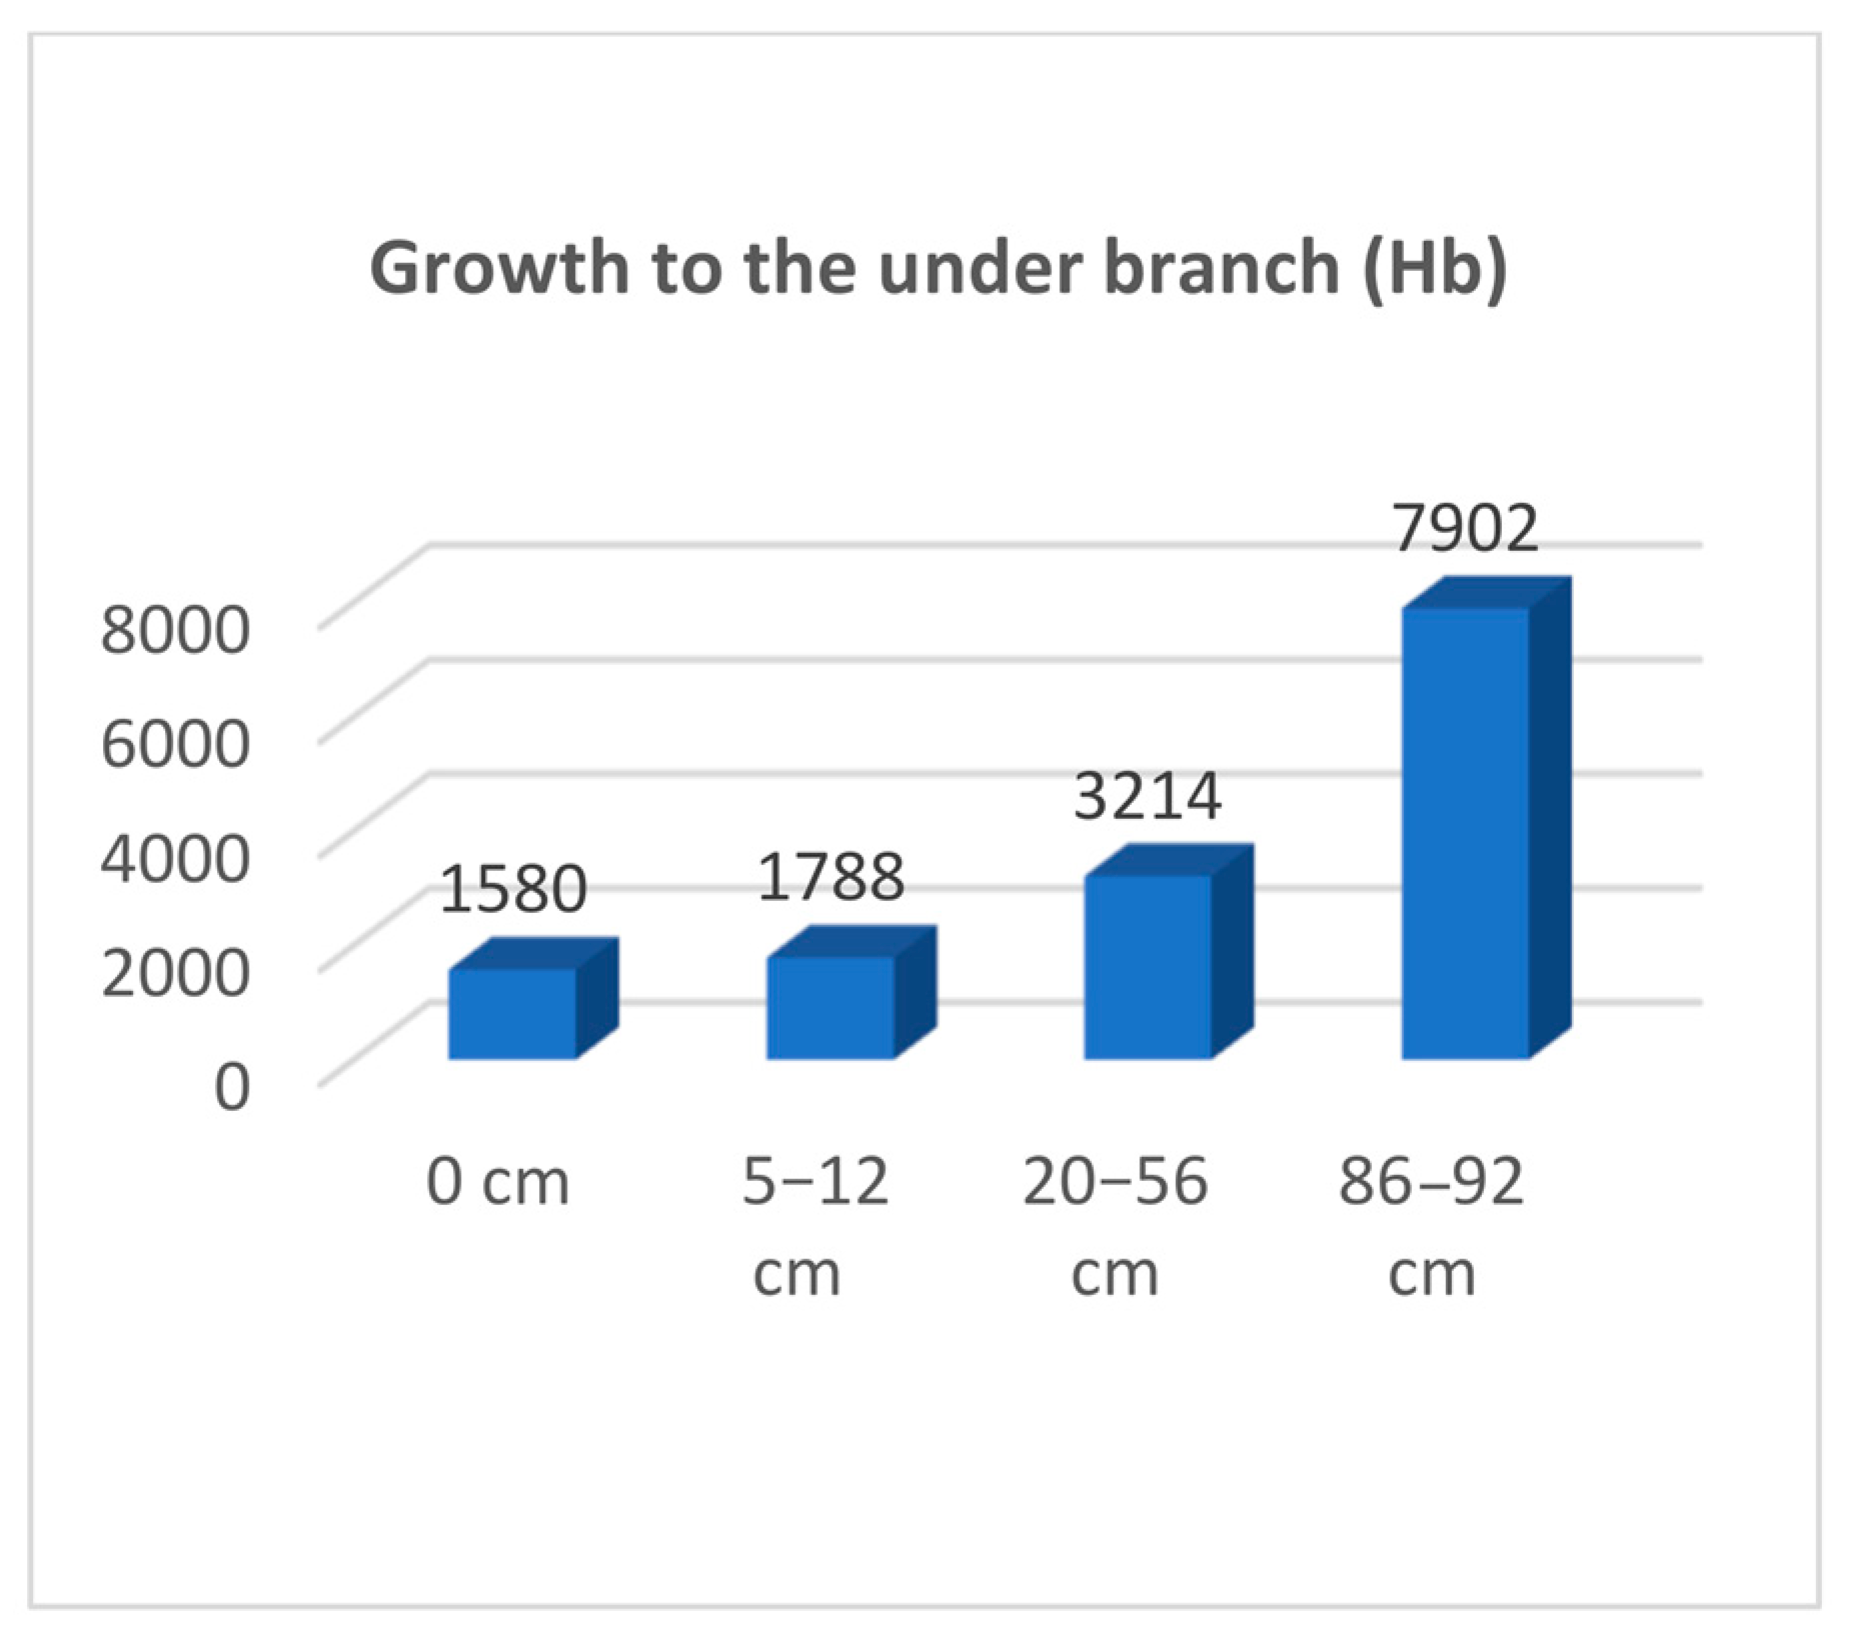
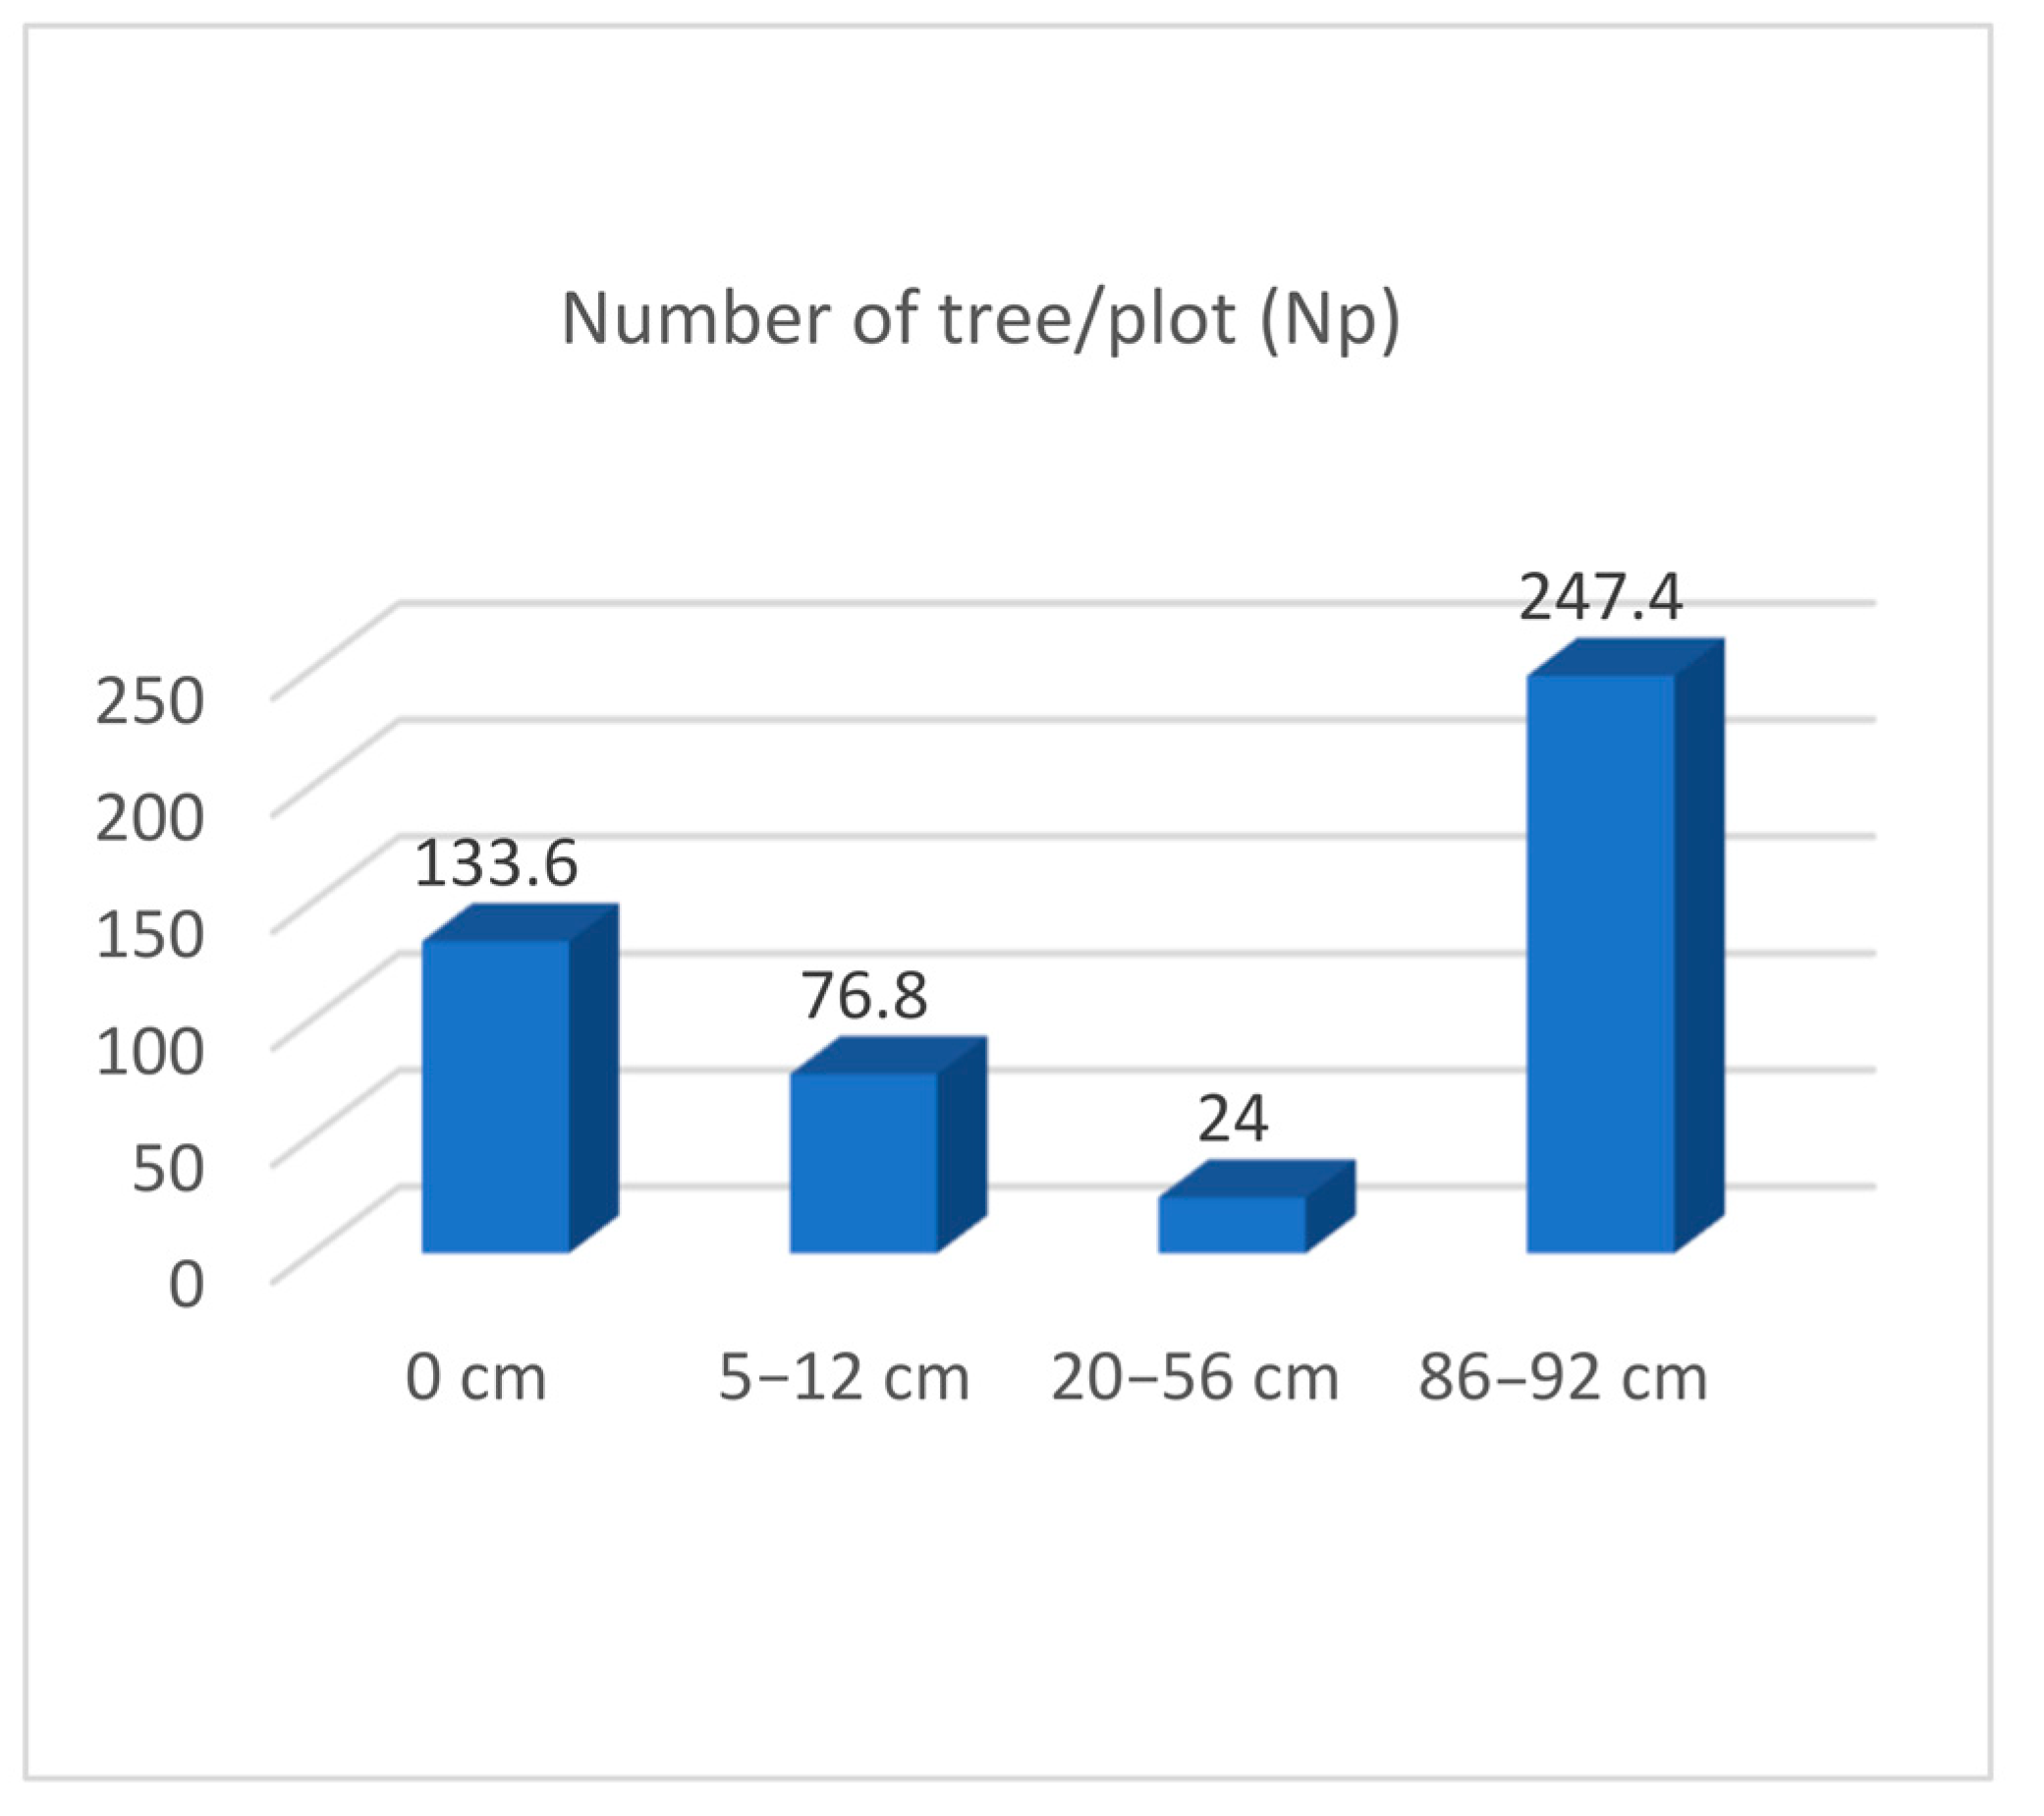
Growth Indicators of Melaleuca Forest by Peat Thickness

Growth of trunk diameter at 1.3 m by peat thickness (2003–2021). The development of the plants was measured concerning the thickness of the peat layer (UMTNP, 2022) [24]. The results are presented in Table 8 and Figure 7, where it can be seen that the growth was 3.87 cm when there was no peat layer (control). When comparing the control to peat thicknesses ranging from 20–56 cm, the change was 1.3 times higher, with measurements of 3.88 cm and 5.12 cm, respectively. Similarly, comparing the control to peat thicknesses of 86–92 cm, the growth was 2.4 times higher with measurements of 3.88 cm and 9.32 cm, respectively. The difference in terms of peat thickness was found to be significant (p < 0.001), as shown in Figure 7.

3.9. Discussion of Peat Chemical Composition

The chemical composition of peat depends on season and peat thickness. The chemical composition of peat depends on the season; in the wet season, indicators are lower than in the dry season. For the thickness indicators, as the thickness increases, the values also get higher.
Height growth of Melaleuca forest (Ht) by peat thickness (2003–2021). The relationship between the height growth of the Melaleuca forest (Ht) and peat thickness (as shown in Table 8) revealed exciting findings. The control peat thickness of 0 cm and peat thickness ranging from 5–12 cm resulted in a growth of 3.83 m and 3.8 m, respectively. However, when the control peat thickness was 0 cm, and peat thickness ranged from 20–56 cm, the growth increased to 5.43 m, 1.4 times higher than the controlled growth. This difference was statistically significant with a p-value of less than 0.001 (as indicated in Figure 8). Additionally, when the peat thickness was further increased to 10.04 m, the height growth increased to 10.04 m, 2.6 times higher than the controlled growth. This increase was also statistically significant, with a p-value of less than 0.001. These findings suggest that peat thickness plays an essential role in the height growth of the Melaleuca forest, with thicker peat layers resulting in more significant height growth.
Height growth under branches (Hb) by peat thickness (2003–2021). The height growth under the branches of the Melaleuca trees also varied significantly based on peat thickness, as shown in Table 9 and Figure 9. In areas with no peat, the growth was 1.58 m, and with a peat thickness of 5–12 cm, the growth was slightly higher at 1.79 m, but the difference was insignificant. However, when the peat thickness increased to 20–56 cm, the height growth more than doubled to 3.21 m, and the difference was significant compared to areas with no peat. Similarly, in regions with a peat thickness of 86–92 cm, the height growth increased significantly to 7.90 m, five times higher than in areas without peat. These results suggest that peat thickness significantly impacts the height growth of Melaleuca trees, with thicker peat layers leading to substantially greater height growths.
Canopy diameter growth (Dc) on peat thickness (2003–2021). (Figure 10) The canopy diameter (Dc) growth under different conditions was presented herein. The author compares the development of Dc in three scenarios: (1) control with no peat (0 cm), (2) peat thickness ranging from 5 to 12 cm, and (3) peat thickness ranging from 20 to 56 cm and 86 to 92 cm. The author found that compared to the control group, the growth of Dc in the peat thickness ranging from 5 to 12 cm was 1.5 times higher, which was statistically significant (p < 0.001). However, compared to the control group, the growth of Dc in the peat thickness ranging from 20 to 56 cm was not significantly different (p > 0.05). Finally, the change of Dc in the peat thickness ranging from 86 to 92 cm was two times higher than the control group, which was statistically significant (p < 0.05). Overall, the growth of canopy diameter under different peat thickness conditions shows that the increase is significantly higher in the peat thickness range of 5–12 cm and 86–92 cm but not entirely different in the 20–56 cm range.
Number of trees in survey plot (N/p) based on peat thickness (2003–2021). In (Figure 11) The control peat thickness of 0 cm consisted of 134 tree/500 m2, peat thickness ranging from 5 cm to 12 cm consisted of 77 tree/500 m2, peat thickness ranging from 20 cm to 56 cm consisted of 24 tree/500 m2, and peat thickness ranging from 86 cm to 92 cm consisted of 247 tree/500 m2. Comparing the 0 cm control thickness and thickness ranging from 86 cm to 92 cm with 134 tree/500 m2 and 247 tree/500 m2, respectively, the latter is 1.8 times higher, which is a significant difference with a significance level p < 0.001.
Regarding the number of trees in different peat thickness conditions: When there was no peat layer (control), there were 134 trees per 500 square meters. When the peat thickness was between 5 and 12 cm, there were 77 trees per 500 square meters. When the peat thickness was between 20 and 56 cm, there were 24 trees per 500 square meters. When the peat thickness was between 86 and 92 cm, there were 247 trees per 500 square meters. Comparing the control to the thickness of 86–92 cm, the number of trees increased significantly from 134 to 247 trees per 500 square meters, which is 1.8 times higher. This difference was statistically significant, with a significance level of p < 0.001. For the relationship between the number of trees and peat thickness, the results indicate that the number of trees increases as the peat thickness rises, with the highest number found in the 86–92 cm peat thickness condition. This information could be helpful for forestry or environmental studies where the impact of soil composition on plant growth is of interest.

3.10. Correlation Equations of Melaleuca Forest on Peatland

Correlation equation between Hb and Ht. The tree height (Ht) to height under branches (Hdc) was calculated via the equation Hb = 22,122.0015 + 0.9854 Ht, with N = 2426, R = 0.9033, and Fr = 10,753.11, and it can be used to estimate Hvn indirectly via Hdc and vice versa. The author notes that this equation is useful for quick surveys and investigations of forests on peatlands in UMT NP. Measuring Hdc is easy and can be carried out with a ruler, making the calculation quick and convenient. The correlation between diameter at chest height (D1.3) and tree height (Ht) was determined via Ln (Ht) = 221,220.1831 + 1.5682 .Ln(D1.3), and after returning it to its original form, the equation becomes Ht = 0.832685.D1.315682. This equation can be used to estimate Ht from D1.3 without measuring tree height directly. This mathematical model was developed from investigated data of Melaleuca forests on peatland in UMT NP, which had 2423 trees across four different forest types with varying peat thicknesses. This model helps estimate the height of treetops when measuring the trunk diameter at chest height (1.3 m), as measuring tree height directly can be difficult and inaccurate with a standing tree that has not been cut down. These equations and models provide useful tools for estimating tree height and surveying and investigating forests on peatlands.

3.11. Discussion of Melaleuca Growth on Peat with Thickness

Overall, forest growth during the period of water retention to prevent fires was very slow. The tree height, diameter at the top height, and canopy diameter tend to increase as thicknesses increase, resulting in higher growth, greater top diameter, and greater canopy diameter.

3.12. Relationship between Peat Chemical and Growth of Melaleuca Forest after Forest Fire

Relationship between acid humic and growth indicators. The relationship between acid humic and change indicators with peat thickness is presented herein. The growth indicators measured were D1.3, Ht, Hb, and Dc. The results indicate no correlation between the growth indicators and acid humic, with the indicators showing shallow R values and all values of α greater than 0.05. In statistical analysis, the correlation coefficient (R) measures the strength and direction of the relationship between two variables. A low R-value suggests that there is no strong relationship between the variables. The α value, also known as the p-value, is used to determine the significance of the relationship. A value greater than 0.05 suggests no significant relationship between the variables. Overall, there is no meaningful relationship between acid humic and the growth indicators (D1.3, Ht, Hb, and Dc) with peat thickness. This information could be helpful for researchers studying the effects of soil composition on plant growth, as it suggests that acid humic may not be a significant factor in determining the growth indicators in this study.’
Relationship between SO42− and growth indicators. (Table 10) There is no correlation between acid humic and growth indicators with peat thickness, D1.3, Ht, Hb, and Dc. The indicators R are shallow, indicating weak correlations, and the values of α are all greater than 0.05, meaning that the correlations are not statistically significant, suggesting that factors other than peat thickness, tree diameter, tree height, height under branches, and canopy diameter are likely to be more important in influencing growth and acid humic content in the forest studied.
Relationship between P2O5 and indicators. (Table 11) There is a close relationship between P2O5 and growth indicators, such as peat thickness, D1.3, Ht, and Hb, with strong correlations. Specifically, peat thickness has a correlation coefficient (R) greater than 0.9, D1.3 has a correlation coefficient greater than 0.6, Ht has R more significant than 0.8, and Hb has R greater than 0.7. Furthermore, the alpha values for these correlations are all smaller than 0.01, indicating that the correlations are statistically significant. However, the indicator Dc has a weak correlation with P2O5, with an R-value of 0.26 and an alpha value greater than 0.05, suggesting that other factors may be more important in influencing canopy diameter growth in the forest studied.
Relationship between pH and growth indicators. (Table 12) There is a close relationship between pH and growth indicators, such as peat thickness, D1.3, Ht, and Hb, with strong correlations. Specifically, peat thickness has a correlation coefficient (R) greater than 0.9, D1.3 has a correlation coefficient greater than 0.7, Ht has an R more significant than 0.8, and Hb has an R more significant than 0.7. Furthermore, the alpha values for these correlations are all smaller than 0.01, indicating that the correlations are statistically significant. However, the indicator Dc is weakly correlated with pH, with an R-value of 0.34 and an alpha value greater than 0.05, suggesting that other factors may be more important in influencing canopy diameter growth in the forest studied.
Relationship between Nts and growth indicators. (Table 13) There is a relationship between pH and growth indicators (peat thickness, D1.3, Ht, Hb, and Dc) in a specific context. The strength of the correlation varies for different indicators. The statement shows a strong correlation between pH and peat thickness (R > 0.6). The correlation between pH and D1.3 is also strong (R > 0.7). The correlation between pH, Ht, and Hb is solid (R > 0.8), indicating a close relationship. However, the correlation between pH and Dc is weak (R = 0.28), suggesting that there somewhat of a relationship between these two variables. Moreover, the significance level (α values) for all the correlations is smaller than 0.01, indicating that the relationships are statistically significant, except for the correlation between pH and Dc, where the significance level is higher (α > 0.05). Overall, the statement suggests that pH is closely related to various growth indicators, except for Dc, where the correlation is weak.
Relationship between K2O and growth indicators. (Table 14) The relationship between pH and growth indicators (peat thickness, trunk diameter at breast height (D1.3), tree height (Ht), height under branches (Hb), and crown diameter (Dc)) in a particular context was discussed herein. There is a strong correlation (R > 0.9) between pH and the growth indicators peat thickness and Ht, as well as a moderately strong correlation (R > 0.7) between pH and D1.3 and Hb. Additionally, all alpha values (a measure of statistical significance) for these correlations are less than 0.01, indicating that they are statistically significant. However, the correlation between pH and Dc is weak (R = 0.3) and not statistically significant (α > 0.05).
Relationship between Fe2+ and growth indicators. (Table 15) There is a strong relationship between the pH and growth indicators, with most of the factors studied having correlation coefficients (R) greater than 0.7 or even higher, indicating a positive correlation. For example, the correlation coefficient is greater than 0.9 for peat thickness and Ht, and greater than 0.8 for Hb and D1.3. The α values, which indicate the statistical significance of the correlation, are all less than 0.01, indicating a very strong level of significance. However, the passage notes that the only exception to this is the indicator of Dc, which has a weak correlation with the pH and growth indicators, with a correlation coefficient of only 0.33. Additionally, the α value for this correlation is greater than 0.05, which suggests that it is not statistically significant. There is overal a strong correlation between pH and growth indicators with most of the factors studied on peat, but the correlation with Dc is weak.

3.13. General Discussion

After the forest fire in 2003, the vegetation layer on the surface was burned, the peat could not protect itself. Therefore, the peat decomposition process took place quickly due to the impact of the climatic environment. The resulting decomposition led to leaching of peat from high to low, causing the peat thickness to rapidly collapse.
After forest fire, forest regeneration occurs rapidly in nearly 90% of the burned area. Along with that, there is a threat of forest fires in the dry season every year, so a strategy of water storage is needed to fight forest fires.
A high amount of rainwater is stored at the end of the rainy season, as a result, water is maintained all year round in the forest that was regenerated 3 years ago. As aconsequence, there is environmental pollution from biological decomposition, which causes damage to the root system of all regenerating forest trees without a respiratory stage, and, eventually, they fall and die gradually at an annual rate.
Growth survey results show that during high levels of water retention and year-round submersion for a long time, Melaleuca trees grow very slowly. The rapid destruction of peat, accompanied by physical and chemical leaching, causes chemical changes in the reserves and the peat quality to fall to abnormal levels, creating widespread pollution that affects the area.

4. Conclusions

After the loss of vegetation due to forest fires and changes in the flooding regime, physical and biological changes lead to changes in peat volume and reserves due to dilution, decomposition, leaching and sedimentation, and huge fluctuations in the peat decomposition process.
Chemical fluctuations due to the flooding regime occur during the year, with 50% of indicators changing proportionally to peat thickness increasing in the dry season and 100% of chemical indicators increasing in the rainy season. The study shows that the dissolution of chemical indicators in the water environment is very large. Among the five analyzed indicators, two indicators decrease during the rainy season: pH, Humic Acid and three indicators increase with peat thickness; During the dry season, one indicator that increases during the dry season is pH.
The growth of Melaleuca trees under the flooding regime after 18 years has five growth indicators investigated, three indicators increase as peat thickness increases and two indicators could not be shown to increase or decrease as peat thickness increases. Chemical indicators affect peat thickness and water level submersion and affect growth indicators such as peat thickness, D1.3, Hvn, and Hdc.
Studies revealed that:
The thickness of the peat and flooding regime significantly influenced the growth of the Melaleuca forest, while peat chemical indicators and composition also played critical roles.
The chemical composition of peat water varied substantially with the seasons, with nutrient content and pH affecting forest growth.
Successful regeneration of forests requires a balance between the benefits of natural regeneration and the risks of annual forest fires while ensuring that hydrological measures to prevent fires do not harm biodiversity.
The findings highlight the importance of considering various factors when developing effective forest restoration strategies.

Author Contributions

L.T.T. conceptulization, methoddology, validation, formal analysis, investigation, data curation, writing—origional draft preparation, writing—review and editing, visaalization, supervision, project administration, funding acquisition. T.V.T. investigation, K.V.L. investigation, M.F.S., investigation, software, formal analysis. All authors have read and agreed to the published version of the manuscript.

Funding

This research received no external funding.

Institutional Review Board Statement

This study does not involve humans or animals.

Informed Consent Statement

All studies only study plant and soil. It is not related to human only help community and government to develop economic.

Data Availability Statement

These database are by ourself. Thus we using to study and for our article, published in MDPI can share by authors group, MDPI journal.

Conflicts of Interest

The authors declare no conflict of interest.

References

  1. Tran, Q.B.; Quach, T.X.; Le, T.N.H. Biomass of Melaleuca forest at the U Minh Thuong National Part, Kien Giang Province. Can Tho Univ. J. Sci. 2015, 37, 63–68. [Google Scholar]
  2. Tran, Q.B.; Pham, V.D. Growth and Increment Characteristics of Post-Fire Regeneration Melaleuca Forest in U Minh Thuong National Forest. J. Agric. Rural Dev. 2011, 24, 1–12. [Google Scholar]
  3. Thang, V.T. U Minh Peat Swamp Forest Mekong River Basin (Vietnam). In The Wetland Book; Spinger Science Business Media: Dordrecht, The Netherlands, 2016; Volume 2016. [Google Scholar]
  4. Hoang, T.T.; Pham, T.A.; Hoang, V.C. Carnivores in U Minh Thuong National Park. Sci. J. Vietnam Natl. Univ. Hanoi 2009, 25, 40–44. [Google Scholar]
  5. Le, T.P.; Chau, H.H. Investigation of plant biodiversity in the farming systems and Melaleuca forest at An Minh district, Kien Giang province. Can Tho Univ. J. Sci. 2014, 31, 51–63. [Google Scholar]
  6. Nguyen, T.N.T.; Huynh, B.A.Q.; Nguyen, T.L.; Tran, D.D.; Duong, T.Y. The species composition of fish distributed in surrounding areas of U Minh Thuong and U Minh Ha National Parks. Can Tho Univ. J. Sci. 2020, 56, 185–191. [Google Scholar]
  7. Vietnam Nature Conservation Center. U Minh Thuong National Park. In Information Book on Existing and Proposed Protected Areas in Vietnam; Vietnam Nature Conservation Center: Hanoi, Vietnam, 2004. [Google Scholar]
  8. Enríquez-de-Salamanca, A. Dynamics of Mediterranean pine forests replanted after wildfires. J. For. Res. 2023, 34, 345–354. [Google Scholar] [CrossRef]
  9. Page, S.; Rieley, J.; Shotyk, Ø.; Weiss, D. Interdependence of peat and vegetation in a tropical peat swamp forest. Philos. Trans. R. Soc. London. Ser. B Biol. Sci. 1999, 354, 1885–1897. [Google Scholar] [CrossRef] [PubMed]
  10. De Vos, B.; Lettens, S.; Muys, B.; Deckers, J.A. Walkley–Black analysis of forest soil organic carbon: Recovery, limitations and uncertainty. Soil Use Manag. 2007, 23, 221–229. [Google Scholar] [CrossRef]
  11. Huat, B.K. Organic and Peat Soils Engineering; Penerbit Universiti Putra Malaysia: Serdang, Malaysia, 2004. [Google Scholar]
  12. Tran, Q.B.; Hoang, T.V.; Dargusch, P. An assessment of the carbon stocks and sodicity tolerance of disturbed Melaleuca forests in Southern Vietnam. Carbon Balance Manag. 2015, 10, 15. [Google Scholar] [CrossRef] [PubMed]
  13. Tran, Q.B. Effects of water table on fire risk of melaleuca forest in U Minh. J. Agric. Rural Dev. 2011, 4, 1–14. [Google Scholar]
  14. Jauhiainen, J.; Takahashi, H.; Heikkinen, J.E.; Martikainen, P.J.; Vasander, H. Carbon fluxes from a tropical peat swamp forest floor. Glob. Change Biol. 2005, 11, 1788–1797. [Google Scholar] [CrossRef]
  15. Posa, M.R.C.; Wijedasa, L.S.; Corlett, R.T. Biodiversity and conservation of tropical peat swamp forests. BioScience 2011, 61, 49–57. [Google Scholar] [CrossRef]
  16. Bargali, H.; Bratt, D.; Sundriyal, R.C.; Uniyal, V.P.; Pandey, A.; Ranjan, R. Effect of forest fire on trê diversity and regeneration in the forests of Uttarakhand, Western Himalaya, India. Front. For. Glob. Change 2023, 6, 1198143. [Google Scholar] [CrossRef]
  17. Hung, V.L. Some results of plant biodiversity research on peatland in U Minh Thuong National Park. Vietnam. Sci. Technol. J. 2016, 3, 48–55. [Google Scholar]
  18. Hooijer, A.; Page, S.; Canadell, J.; Silvius, M.; Kwadijk, J.; Wösten, H.; Jauhiainen, J. Current and future CO2 emissions from drained peatlands in Southeast Asia. Biogeosciences 2010, 7, 1505–1514. [Google Scholar] [CrossRef]
  19. Bao, H. Application of Statistical Analysis in Experimental Research in Agriculture, Frestry and Biology. In Use Software Stagraphics; Tay Nguyen University: Buôn Ma Thuột, Vietnam, 2014. [Google Scholar]
  20. Gazzaz, N.M.; Yusoff, M.K.; Aris, A.Z.; Juahir, H.; Ramli, M.F. Artificial neural network modeling of the water quality index for Kinta River (Malaysia) using water quality variables as predictors. Mar. Pollut. Bull. 2012, 64, 2409–2420. [Google Scholar] [CrossRef] [PubMed]
  21. Fehér, O.; Wonnacott, E.; Smith, K. Structural priming in artificial languages and the regularisation of unpredictable variation. J. Mem. Lang. 2016, 91, 158–180. [Google Scholar] [CrossRef]
  22. Bao, H. Statistics in Forestry. Apply Software Stagraphics Centurion and MS.; Tay Nguyen University: Buôn Ma Thuột, Vietnam, 2009. [Google Scholar]
  23. UMTNP. Investigation Report on Forest Status of U Minh Thuong National Park 2022; UMTNP: Kuantan, Malaysia, 2022. [Google Scholar]
  24. UMTNP. Investigation Report on Peatland of U Minh Thương National Park 2022; UMTNP: Kuantan, Malaysia, 2022. [Google Scholar]
  25. Hai, N.T.; Dang, D.; Va, N.; My, H. Survey of chemical characteristics of residential land environment peripheral area of the National Park U Minh Ha—Ca Mau. Sci. Can Tho J. Can Tho Univ. 2011, 18b, 83–91. [Google Scholar]
Figure 1. The location of map 2003 and survey plots and collect sample in 2021 based on the map 2003 after big fire.
Sustainability 16 00620 g001
Figure 2. Peat area of U Minh Thuong National Park from 1998–2002 (ha) from (Table 1).
Sustainability 16 00620 g002
Figure 3. Peat distribution map of U Minh Thuong National Park in 2023 (first) and in 2003 (after) after big fire (Table 1).
Sustainability 16 00620 g003
Figure 4. Present status of a layer of humus decomposing from vegetation on the peat layer (a), peat layer with a thickness of 50 cm (b), and 1.2 m (c).
Sustainability 16 00620 g004
Figure 5. Peat area after forest fire 2003 U Minh Thuong National Park.
Sustainability 16 00620 g005
Figure 6. Peat area after change in water level for forest growth from 2012–2022.
Sustainability 16 00620 g006
Figure 7. Diameter growth of trunk (D1.3) by peat thickness.
Sustainability 16 00620 g007
Figure 8. Height Growth to the top (Ht) by peat thickness.
Sustainability 16 00620 g008
Figure 9. Height growth under branch (Hb) by peat thickness.
Sustainability 16 00620 g009
Figure 10. Growth Dc by peat thickness.
Sustainability 16 00620 g010
Figure 11. Number of tree Nc by peat thickness.
Sustainability 16 00620 g011
Table 1. Changes in the area due to inundation regime (ha).
No.Status (cm) 2002 (ha)2003 (ha)2022 (ha)
1Thick peat 120–1301245148
2Thick peat 100–120560449
3Thick peat 90–1002879.7979
4Thick peat 60–90 2331579
5Thick peat 20–60 979
6Thick peat 5–12 2331
Total4124.739073907
Table 2. Carbon reserves of peat in UMT National Park after forest fire 2003.
No.Thickness of Peat Layer (cm)Thickness of Average Peat Layer (m)Area m2Volume (m3)Average Density (Mg/m2)Peat Content (ton)%C
Average
Content C (ton)
1120–1301.251481,850,0000.24444,00042.12181,862.4
2100–1201.104494,939,0000.241,136,72942.12461,625.6
370–1000.859798,321,5000.241,996,3444.12874,398.7
430–700.50233111,655,0000.242,796,84042.121,164,324.5
Total 390726,765,500 6,373,913 2,682,211.2
Table 3. Peat and carbon volume in peat at UMT National Park 2022.
No.Thickness of Peat Layer (cm)Thickness of Average Peat Layer (m)Area m2Volume (m3)Average Density (Mg/m2)Peat Content (ton)%C
TB
Content C (ton)
186–920.895975,153,1000.241,236,74442.12520,917
220–560.389793,720,2000.24892,84842.12376,067
35–120.0823311,864,8000.24447,55242.12188,509
Total 390710,738,100 2,577,144 1,085,493
Table 4. Analysis of the chemical composition of peat in the wet season (11/2021).
No.Peat (cm)pH
(H2O)
Acid Humic (%)SO42− (mg/L)P2O5 (mg/L)NH4+ (mg/L)Nts (mg/L)K2O (mg/L)Fe2+ (mg/L)
15–125.6617.780.0300.0917.860.660.412.30
220–565.3815.980.0270.1016.650.980.512.66
386–924.5817.670.0290.1119.561.030.552.45
Average5.2117.140.0290.118.020.890.492.74
p-value<0.010.480.76<0.050.30<0.05<0.050.36
Table 5. Analysis of chemical composition in the dry season (6/2022).
No.Peat Thickness (cm)pH (H2O)Acid Humic (%)SO42− (mg/L)P2O5
(mg/L)
NH4+ (mg/L)Nts (mg/L)K2O (mg/L)Fe2+ (mg/L)
15–124.4711.600.080.1117.060.260.181.18
220–564.308.600.050.0715.400.590.372.74
386–924.106.800.040.0613.370.730.564.09
Average4.2990.060.0815.280.530.183.41
p-value<0.01<0.01<0.01<0.01<0.01<0.01<0.01<0.01
Table 6. Chemical composition of peat water in the wet season.
No.Peat ThicknesspH (H2O)Acid Humic (%)Nts (mg/L)Fe2+ (mg/L)P2O5 (mg/L)
15–12 cm6.318.490.160.260.026
220–56 cm5.376.370.271.080.035
386–92 cm5.084.730.522.270.057
Average5.696.530.321.20.04
p-value<0.001<0.001<0.001<0.001<0.001
Table 7. Chemical compositions of peat in the dry season.
No.Peat ThicknesspH (H2O)Acid Humic (%)Nts (mg/L)Fe2+ (mg/L)P2O5 (mg/L)
105–12 cm5.4026.4316.817.495.39
220–56 cm4.5973.6221.576.166.08
386–92 cm4.32119.3826.114.456.56
Average4.7773.2921.56.036.01
p-value<0.001<0.001<0.001<0.001<0.001
Table 8. Growth indicators of Melaleuca forest by peat thickness.
No.Peat ThicknessD1.3 (cm)Ht (m)Hb (m)Dc (m)N/p (Tree Number/Plot)
10 cm3.8823.8281.5800.708133.6
25–12 cm3.8563.8001.7881.06276.8
320–56 cm5.1185.4303.2140.78424
486–92 cm9.32010.0387.9021.442247.4
p-value<0.001<0.001<0.001<0.001<0.001
Table 9. Relationship between acid humic and growth indicators.
No.Chemical IndicatorsGrowth IndicatorsStatitiscal Parameters
1Acid humicPeat thicknessR = 0.0807, Fr = 0.07873, α = 0.7838, N = 15
a = 17.3999, b = −0.00475
2 D1.3 (cm)R = 0.0391, Fr = 0.8944, α = 0.8944, N = 15
a = 17.3585, b = 0.0285
3 Ht (m)R = 0.1070, Fr = 0.1275, α = 0.7277, N = 15
a = 16.6368, b = 0.0914
4 Hb (m)R = 0.0857, Fr = 0.0889, α = 0.7706, N = 15
a = 16.8956, b = 0.0620
5 DcR = 0.1776, Fr = 0.3909, α = 0.5435, N = 15
a = 16.5535, b = 0.5812
Table 10. Relationship between SO42− and growth indicators.
No.Chemical IndicatorsGrowth IndicatorsStatistical Parameters
1SO42−Peat thicknessR = 0.9430, Fr = 96.3715, α < 0.000, N = 15
a = 0.0772, b = −0.00046
2 D1.3 (cm)R = 0.7258, Fr = 13.3631, α = 0.0032, N = 15
a = 0.0838, b = −0.0044
3 Ht (m)R = 0.9138, Fr = 60.7679, α < 0.000, N = 15
a = 0.0915, b = −0.0055
4 Hb (m)R = 0.8993, Fr = 50.7531, α < 0.000, N = 15
a = 0.0796, b = −0.0054
5 DcR = 0.3387, Fr = 1.5549, α = 0.2361, N = 15
a = 0.0651, b = −0.0092
Table 11. Relationship between P2O5 and growth indicators.
No.Chemical IndicatorsGrowth IndicatorsStatistical Parameters
1P2O5Peat thicknessR = 0.9104, Fr = 58.1385, α < 0.000, N = 15
a = 0.1034, b = −0.0005
2 D1.3 (cm)R = 0.6554, Fr = 9.0388, α = 0.0109, N = 15
a = 0.1089, b = −0.0048
3 Ht (m)R = 0.8388, Fr = 28.4912, α = 0.000, N = 15
a = 0.1181, b = −0.0061
4 Hb (m)R = 0.7967, Fr = 19.1228, α = 0.001, N = 15
a = 0.1052, b = −0.0061
5 DcR = 0.2676, Fr = 0.9262, α = 0.3548, N = 15
a = 0.0872, b = −0.0088
Table 12. Relationship between pH and growth indicators.
No.Chemical IndicatorsGrowth IndicatorsStatistical Parameters
1pHPeat thicknessR = 0.9674, Fr = 175.2339, α < 0.000, N = 15
a = 4510, b = −4.5578
2 D1.3 (cm)R = 0.7199, Fr = 12.9124, α = 0.0036, N = 15
a = 4564, −41.9847
3 Ht (m)R = 0.8738, Fr = 38.7826, α = 0.000, N = 15
a = 4626.461, b = −50.329
4 Hb (m)R = 0.7805, Fr = 18.7072, α = 0.000, N = 15
a = 4515.463, b = −48.3617
5 DcR = 0.3497, Fr = 1.6723, α = 0.2202, N = 15
a = 4391.425, b = −91.6352
Table 13. Relationship between Nts and growth indicators.
No.Chemical IndicatorsGrowth IndicatorsStatistical Parameters
1NtsPeat thicknessR = 0.6784, Fr = 9.3798, α = 0.0108, N = 15
a = 0.2560, b = 0.00575
2 D1.3 (cm)R = 0.7199, Fr = 12.9124, α = 0.0036, N = 15
a = 0.0843, b = 0.0721
3 Ht (m)R = 0.8073, Fr = 22.4576, α = 0.000, N = 15
a = 0.1244, b = 0.0612
4 Hb (m)R = 0.8169, Fr = 20.0660, α = 0.001, N = 15
a = 0.2619, b = 0.0595
5 DcR = 0.2865, Fr = 1.0733, α = 0.3206, N = 15
a = 0.4236, b = 0.0988
Table 14. Relationship between K2O and growth indicators.
No.Chemical IndicatorsGrowth IndicatorsStatistical Parameters
1K2OPeat thicknessR = 0.9691, Fr = 18.3745, α < 0.000, N = 15
a = 0.1563, b = 0.0044
2 D1.3 (cm)R = 0.7241, Fr = 13.2254, α = 0.0034, N = 15
a = 0.1014, b = 0.0414
3 Ht (m)R = 0.9038, Fr = 53.5738, α = 0.000, N = 15
a = 0.0314, b = 0.0510
4 Hb (m)R = 0.8903, Fr = 45.8977, α = 0.000, N = 15
a = 0.1419, b = 0.0506
5 DcR = 0.3318, Fr = 1.4847, α = 0.2465, N = 15
a = 0.2780, b = 0.0852
Table 15. Relationship between Fe2+ and growth indicators.
NoChemical IndicatorsGrowth IndicatorsStatistical Parameters
1Fe2+Peat thicknessR = 0.9543, Fr = 122.3928, α < 0.000, N = 15
a = 1024.636, b = 34.7760
2 D1.3 (cm)R = 0.7106, Fr = 12.2437, α = 0.0043, N = 15
a = 604.3599, b = 320.552
3 Ht (m)R = 0.8921, Fr = 46.7989, α = 0.000, N = 15
a = 47.9331, b = 394.4075
4 Hb (m)R = 0.8795, Fr = 41.0121, α = 0.000, N = 15
a = 906.7227, b = 394.4107
5 DcR = 0.3309, Fr = 1.4759, α = 0.2477, N = 15
a = 1960.306, b = 670.6833
Disclaimer/Publisher’s Note: The statements, opinions and data contained in all publications are solely those of the individual author(s) and contributor(s) and not of MDPI and/or the editor(s). MDPI and/or the editor(s) disclaim responsibility for any injury to people or property resulting from any ideas, methods, instructions or products referred to in the content.

