Article

Derived Environmental Impacts of Organic Fairtrade Cocoa (Peru) Compared to Its Conventional Equivalent (Ivory Coast) through Life-Cycle Assessment in the Basque Country

by
Blanca López del Amo
1,2 and
Ortzi Akizu-Gardoki
1,*
1
Life Cycle Thinking Group (LCTG), Department of Graphic Design and Engineering Projects, University of the Basque Country (UPV/EHU), Plaza Ingeniero Torres Quevedo 1, 48013 Bilbao, Spain
2
Basque Culinary Center Innovation (BCC Innovation), Technology Center in Gastronomy, Mondragon Unibertsitatea, Paseo Juan Avelino Barriola 101, 20099 Donostia, Spain
*
Author to whom correspondence should be addressed.
Sustainability 2024, 16(2), 493; https://doi.org/10.3390/su16020493
Submission received: 16 November 2023 / Revised: 23 December 2023 / Accepted: 27 December 2023 / Published: 5 January 2024

Abstract

:
There is a global need to create an environmentally low-impact and socially fair international food and agriculture system. Specifically, in the case of chocolate, since it is difficult to produce locally in consumer countries, the socio-economic impact and benefits of its production have long been unfairly distributed. This research analyses the differences between the global environmental impacts of Fairtrade-certified and organically produced cocoa (from Peru), sold in the form of a chocolate bar purchased in the Basque Country (Europe), and the respective average conventional product made with non-organic cocoa beans (from Ivory Coast). Life-cycle assessment (LCA) methodology was used to calculate five impact categories, while ReCiPe 2016 Midpoint Hierarchist was used to analyse the global warming potential (GWP), terrestrial ecotoxicity (TE), and environmental footprint (ENVF, for land use); AWARE was used to measure the water footprint (WF); and cumulative energy demand (CED) assessed energy footprint (EF). The selected functional unit (FU) is 1 kg of final chocolate bar (72% cocoa), extrapolating the characteristics of a 150 g bar. The system boundaries take into account a cradle-to-gate LCA covering the following phases: the production of ingredients, the processing of cocoa paste, transportation and packaging, the manufacture of the chocolate, and its final retail distribution. The results show that certified Organic Agriculture and Fairtrade (OA&FT) chocolate had an average global warming potential (GWP) of 3.37 kg CO2-eq per kilogram, 57.3% lower than Conventional Agriculture (CA)-based chocolate, with the greatest reduction associated with the production of ingredients, at −71.8%. The OA&FT chocolate studied had an 87.4% lower impact in the category of terrestrial ecotoxicity (TE) than that of the CA-based chocolate, yielding 13.7 and 108.6 kg 1,4-DCB per kilogram, respectively. The greatest reduction in the TE impact category also occurred for the OA&FT chocolate in the ingredient production phase, at 93%. Reductions in energy footprint (EF) and water footprint (WF) were also observed in the OA&FT product (21% and 5%). In contrast, although OA&FT processing drastically reduced the associated environmental loads, an increase in packaging and transport phase impacts was observed in the GWP and TE categories (95% and 107%, respectively). Similarly, an increase of 18.7% was observed in the land use footprint for the OA&FT chocolate. The greater need for cropland is compensated by the reduction of 449.02 kg 1,4-DCB·person−1 year−1 in the TE category. This research shows that replacing the current consumption of CA cocoa with OA&FT cocoa has the potential to reduce the GWP by 21.95 kg CO2-eq·person−1·year−1, reducing the current Basque average emission range of 8.4 tCO2-eq·year−1 by 0.26%. As a future subject to study, it was also found that the impact of long-distance maritime transportation and packaging could still have the potential to be reduced, it currently being the cause of up to 11% of the GWP from OA&FT cocoa.

Graphical Abstract

1. Introduction

In the current globalized international market, economic abuse occurs in international trade among countries. The ethical limits of mutual care and, therefore, of justice, are limited to the practices that take place within national borders. Differences in the production costs of similar products or services lead to global international goods flowing from impoverished to enriched countries [1]. Against this backdrop, Fairtrade (FT) certification tries to ensure global social welfare and address the environmental responsibilities of consumers. Fairtrade (FT)-certified products emerged in the international market at the end of the 1960s, as an alternative to products exchanged through traditional trade [2]. FT is a certificate designed to enhance global economic, social and environmental justice through the regulated production and distribution of goods. The concept of FT has given rise to a business model that protects human rights and the environment. Although FT does not set specific minimum wages for workers, it does push for a living wage, which means that workers must earn enough money to afford a decent standard of living for their household. In addition, FT commits to paying 40–50% of the price upfront for producers to purchase the feedstock or raw materials needed to complete an order without incurring debt [3,4].
The international cocoa market has been defined as a sector with high differences in income among the actors participating in cocoa production and supply chains, with farmers being especially affected [5]. Furthermore, there is a clear lack of responsibility regarding the reduction in the environmental impacts of the cocoa production systems of upstream-phase cocoa producers [6]. The existence of colonial control strategies has been detected, even between smallholders or cash-crop production areas [7,8]. Moreover, cocoa production has been implicated as one of the areas with the worst forms of international child labour in which international big brands, such as Hershey’s and Mars, have been involved [9]. Thus, there is an evident need to shift towards a socially and environmentally fair international cocoa production certified system. In recent studies, researchers have already established the benefits of FT certifications for education expenditure among farmers and cooperative workers [10]. Nevertheless, an increase in pesticide use has also been detected in FT-certified fields, although in a more safe and controlled way [11].
Chocolate consumption in the Spanish market is 3.63 kg·cap−1·year−1. Specifically, the Basque Country is an autonomous community with the highest consumption per capita in Spain, with a consumption of 4.73 kg·cap−1·year−1, an amount 30.3% higher than the national average in 2021 [12]. In parallel, in the Basque consumption market, a consumer study conducted by Medicusmundi shows growing concern from the consumer side regarding the impacts of conventional non-organic and non-Fairtrade products in producer regions. There has been an increase in FT products, 91.9% of which corresponds to food products, with chocolate being one of the most demanded items [13].
As with FT products, the use of Organic Agriculture (OA) has increased in current food markets. By 2017, around 20% of agriculture land had already been made organic [14]. OA consists of a system of agricultural practices based on standards through which it is possible to ensure the production of food without the use of certain chemical products that are harmful to the soil, air, and water while simultaneously respecting the health of farmers and biodiversity [15]. It is a production method whose objective is to obtain food using additives that are regulated by the corresponding regional organic certification laws, which have previously analysed the noxious impacts of such additives and their organic origin. OA has a controlled low environmental impact and promotes the responsible use of natural resources [16].
In the same vein, the emerging circular economy (CE) concept is based on eliminating waste and contamination from the initial design stage, keeping products and materials in use for new purposes, and regenerating natural systems, thus using closed material circuits (or closed loops). Seeking a transition to renewable energy and material sources and a model that creates economic, environmental, and social capital [17], FT, OA, and CE are philosophically linked in their aim to produce responsible and conscious products for the sake of the environment and humanity. However, CE does not have standardized certification and difficulties have been shown when it comes to having the same impact as FT and OA, which are well defined and certified [18]. FT is regulated by the standard ISO 17 065 “Conformity assessment—Requirements for bodies certifying products, processes and services” [19], and OA is certified with the family standards of the ISO 14 020 “Environmental labels and declarations—General principles” [20].
Table 1 shows the requirements for the OA and FT certifications, where many similarities can be seen, although OA certification is not strictly necessary to obtain FT [21]. What Makita [22] does observe is that double certification is better value in various ways and that FT certification together with OA certification could support farmers, who could not only expect short-term financial benefits, but also progress in terms of developing a holistic view of agricultural production and socio-environmental concerns.
Hamilton provides the 10 Fairtrade standards as follows [23], where the tenth standard is the environmental aspect: Creating Opportunities for Economically Disadvantaged Producers; Transparency and Accountability; Fair Trading Practices; Fair Payment; Ensuring No Child Labour and Forced Labour; Commitment to Non-Discrimination, Gender Equity and Women’s Economic Empowerment and Freedom of Association; Ensuring Good Working Conditions; Providing Capacity-Building; Promoting FT; and Respect for the Environment. FT standards play a crucial role for the planet by boosting sustainable and fair practices. These standards ensure decent working conditions (1), fair wages (2), environmental protection (3) and encourage the development of local communities (4). By supporting FT, social and economic equity is promoted, poverty is combated, and environmentally sustainable production is boosted. It also encourages responsible consumption, the preservation of natural resources and the reduction in negative impacts on the environment [4]. This shows a link between the FT and OA, whereby OA is included in FT and not vice versa.
Table 1. Environmental convergence between Organic Agriculture (OA) and Fairtrade (FT) certification for agriculture according legislation [24], forbidden substances [25] and conceptual patterns [26]. The table shows in red, prohibited substances and in orange monitored substances.
Organic Agriculture (OA)Convergence for Forbidden Hazardous SubstancesFairtrade (FT)
European Commission [24]Fairtrade [25]Fairtrade [26]
(Part I:1.9.8) Prohibition of use of mineral nitrogen fertilizers.Prohibited Substances:
Nitrobenzene
Nitrogen
Minimized and safe use of agrochemicals.
(Points: 23, 32, 40) (Article 6. d,e,f) (Part I:1.8.4) To reduce the impact of weeds and pests, organic farmers choose resistant varieties (not genetically modified) and breeds and techniques encouraging natural pest control.
(Points: 24, 70) (Part I:1.1) Limiting the use of artificial fertilizers, herbicides, and pesticides.Prohibited Substances:
Disulfoton
Endosulfan
Sulfotep
Famphur
Thallium sulphate
Azinphos-ethy
Azinphos-ethy
Chlormephos
Coumaphos
Dicrotophos
Edifenphos (EDDP)
Ethoprophos (Ethoprop)
Fenamiphos
Heptenophos
Methamidophos
Mevinphos
Monocrotophos
Phosphamidon (Fosfamidon)
Phostebupirim (tebupirimfos)
Propetamphos
Tebupirimifos (phostebupirim)
Triazophos
Tris (2,3-dibromopropyl) Phosphate
Zinc phosphide
DNOC (dinitro-ortho-cresol) and
its salts (ammonium, potassium,
sodium)
Monitored Substances:
Carbosulfan
Leptophos
OMPA (octamethylpyrophosphoramide)
Phosalone
Pyrazophos
2,4,5-TCP (potassium 2,4,5-
Trichlorophenate)
Proper and safe management of waste.
(Point: 34) (Article 6. d) Crop rotation. Maintenance of soil fertility and water resources.
(Part I: 1.9.2 & 1.9.4) Cultivation of nitrogen-fixing plants and other green manure crops to restore the fertility of the soil.
(Point: 23) (Article 5: f.iii) Prohibition of the use of GMOs. No use of genetically modified organisms (GMOs).
(Point: 23) Forbidding the use of ionizing radiation.
Table 1 lists the requirements stated by the European Commission [24] for OA and by the Fairtrade Association [25,26] for FT environmental certification, which converge with each other. Additionally, shown are those fertilizers and pesticides from the list of hazardous materials in FT [25] containing substances restricted or monitored by the OA. This makes it possible to verify OA&FT cocoa production.
According to Wielechowski and Roman [27], the FT movement is valuable and its popularization is necessary. However, critics have said that it is not severe enough to ensure a fully fair goods exchange, or that it could harm uncertified companies. For now, the products most involved with TF are coffee, cocoa, bananas and cane sugar. In 2021, 30% of the world’s coffee was FT, as well as 20% of bananas and 10% of cocoa [28,29,30,31].
Conventional cocoa cultivation can have significant environmental impacts. According to Renier et al. [32] and FAO [33], some of these impacts include deforestation, soil erosion, and a loss of biodiversity, occurring due to the excessive use of pesticides and fertilizers and the effects of monoculture agriculture.
The most widely used tool to carry out a quantifiable analysis of the impacts resulting from the production and distribution of highly manufactured products, such as cocoa for chocolate, is life-cycle assessment (LCA) [34]. In this respect, some of the differences in the environmental performance and impacts of FT, OA and conventional products have already been evaluated. In the case of cocoa, in Ucayali (Peru), a study was carried out on the global warming potential (GWP) of a kilogram of fermented and toasted dry cocoa beans according to the type of production, which was found to be 0.17 kg CO2-eq in CA local traditional production systems (700 kg/ha and with no technology use); 0.93 kg CO2-eq in OA cocoa with organic production systems (800 kg/ha and medium- to high-technology use); and 2.26 kg CO2-eq in high-tech production systems (1500 kg/ha and high-technology use). Thus, controversial results were found, affirming that modern Organic Agriculture has a GWP 447% higher than that of local hand-processed traditional methods, while high-tech production has 1230% greater GWP impacts than the local, traditional approaches. The increase in GWP impacts in organic and high-tech production systems has been attributed to yield per hectare and input use intensity, the production per 1 hectare in traditional cocoa bean production being 700 kg, while it is 800 kg in the organic method 1500 kg in the high-tech intensive system [34]. These are controversial results, since Organic Agriculture has been combined with higher production technologies than traditional ones; thus, impacts derived from either parameter (technology or organic procedures) are not clear. The same controversial problems are present when modelling the traditional cocoa growing systems, specifically regarding how the integration of technology use ought to be performed. In this research, both organic and traditional farming have been modelled to reflect average industrialized growing methods.
Nevertheless, while some authors show how OA could show an increased impact when compared with traditional planting systems, Table 2 shows how current analyses generally attribute lower GWP and terrestrial ecotoxicity (TE) to the organic production of dry cocoa beans and dark chocolate, with a respective average GWP of 36% and 59% less than non-organic traditional systems. Organic dry beans have 1.12 kg CO2-eq emissions (standard deviation of 34.1%) on average, whereas conventional cocoa beans 1.74 kg CO2-eq (a standard deviation of 103.4%).
Table 3 shows that Pérez-Neira et al. [47] reported a land use footprint of 22.10 m2a crop-eq for OA chocolate and 63 m2a crop-eq for CA, the latter being 65% greater than the former, contrary to the 10–30% increase claimed for OA by other authors. Miah et al. [49] reported sustainable dark chocolate production with 4.09 m2a crop-eq, 85% lower than average. Parra-Paitan & Verburg (2022) measured for 1 kg of dry cocoa beans calculated with the 3.51 kg cocoa needed to make 1 kg of chocolate, and reported 49.14 m2a crop-eq for traditional methods with a fertilizer and pesticide, and a 59.67 m2a crop-eq land use footprint for an organic production method, reporting in this case OA needs 21.4% greater than CA.
Table 4 shows great variability in water footprints: Miah et al. [49] reported that sustainable dark chocolate production has a water footprint (WF) of 1.02 m3; Ortiz-Rodríguez et al. [51] extrapolated 0.6 m3 for 1 kg of CA chocolate; Mekonnen & Hoekstra [52] reported 17.19 m3 for CA chocolate; Van Oel et al. [53] studied CA cocoa beans, estimating 10.45 m3 for 1 kg of chocolate; and Bulsink et al. (2010) estimated 28.24 m3. Regarding FT, Miglietta et al. [54] studied the WF of several products imported to Italy carrying the FT label, including cocoa in general, approximating 78.18 m3 for FT chocolate. Meanwhile, Armengot et al. [48] reported 76.90 m3 for CA cocoa, 93.14 m3 for OA cocoa (using a multiplication factor of 3.51), 271.46 m3 for CA chocolate, and 328.78 m3 for OA chocolate. In addition, Félix Olegário et al. [55] carried out a study comparing cocoa-producing areas in Bahia (Brazil) by WF, these ranging from 0.28 m3 to 646.5 m3 for 1 kg of cocoa, with the average estimated for 1 kg of CA chocolate being 1135.09 m3. The method they used to classify their WF was the same as that used in this research, namely, AWARE. Therefore, it can be assumed that there is great variability in results depending on regional factors, which is also demonstrated by the fact that the typical deviations are higher than the average in both agriculture types (126 to 184%).
Table 5 shows the following findings: Recanati et al. [38] reported 33.71 MJ-eq for 1 kg of dark chocolate, while Pérez-Neira et al. [47] found 14.40 MJ-eq for 1 kg of OA dark chocolate and 11.20 MJ-eq for CA dark chocolate. Meanwhile, Boakye-Yiadom et al. [46] reported 144 MJ-eq for CA; the results of Armengot et al. [48] say that OA cocoa is 15.90 MJ-eq and that CA cocoa is 48.30 MJ-eq, so 1 kg of chocolate can be estimated at 55.80 MJ for OA and 169.53 for CA; and, finally, Dianawati et al. [57] reported 323.67 MJ-eq for CA dark chocolate.
Table 1, Table 2, Table 3, Table 4 and Table 5 show that current studies find reductions when shifting from CA to OA production systems of 59% (GWP), 44% (TE), 49% (ENVF), 44% (WF), and 61% (EF); on average, they show a reduction of 51% across the 5 impact categories analysed. Meanwhile, high discrepancies have been detected when defining the environmental impacts of CA or OA&FT chocolate, with typical deviations ranging from 18% (ENVF) to 184% (WF) in CA, and from 14% (GWP) to 126% (WF) in OA. Increases in OA impacts with respect to CA ones have been also detected: 17% in WF [48], 22% in EF [47] and 78% and 82% in GWP [34,36].
To avoid this uncertainty, scientist need to be able to offer clear insights to policymakers (and ultimately also to citizens) about the benefits (or lack thereof) of shifting to OA&FT-certified chocolate. Thus, the goal of this study is, firstly, to assess the environmental impacts of the production and distribution of organic and Fairtrade, versus the impacts of Conventional Agriculture chocolate sold on the Basque Country’s chocolate market. The authors have the hypothesis that the use of OA&FT cocoa could be environmentally beneficial, despite it having maritime transportation-related environmental loads. Two real products have been compared, a 150 g bar of OA&FT chocolate (72% cocoa from the cooperative brand Norandino, Peru), manufactured at the Ethiquable factory, France and sold in the Medicusmundi store; and a 150 g bar of chocolate made with Conventional Agriculture (CA) cocoa from Ivory Coast, manufactured in Catalonia and sold in a large shopping centre. This research aims to quantify the capability of consumers in the Basque Country region to reduce the environmental impacts associated with chocolate production by shifting to an OA&FT-certified product.
This research analysed the environmental impacts of cocoa produced in Peru, using a case study on the Norandino cooperative. The cocoa paste is later processed in France under the Ethiquable brand [58,59]. The chocolate with FT and OA labels is finally sold on the Basque Country market by Medicusmundi Araba NGO in the Vitoria-Gasteiz store, and the chocolate bar “NOIR DESSERT CORSÉ 72% DE CACAO” is used as a case study for this research [58]. In the production of the OA&FT chocolate analysed, the most used cocoa variety is Gran Blanco, a local ancient variety [58,59], and this is collected in the Piura region. Meanwhile, in the case of the CA chocolate from Ivory Coast, the specific regional origin has not been defined, this being secondary data absorbed and modified from the Ecoinvent database. For CA, it has also been assumed that Forastero and Criollo species could have greater shares of production [60]. The OA standard that the analysed chocolate carries is the “AB label” that fulfils the EU regulations for organic food and is offered by the L’Agence Bio of France. In the case of FT certification, the analysed chocolate has been certified by “International Fairtrade” and “SPP Global Fair Trade”.
The method used for this research is described in the next section, followed by the results, including GWP and TE impacts. The Section 4 compares the findings of this research with those reviewed, and, finally, the Section 5 shows how OA&FT agriculture displays, on average, 57.32% lower GWP impacts and 87.38% lower TE impacts than CA agriculture for 1 kg of chocolate (72% cocoa), with reductions in these impacts in the Basque Country’s chocolate consumer market. In the Basque Country, 8.4 tCO2-eq GWP emissions per capita per year have been estimated for 2019, from which 4.6 are non-ETS (Emissions Trading System) emissions [61].

2. Methods

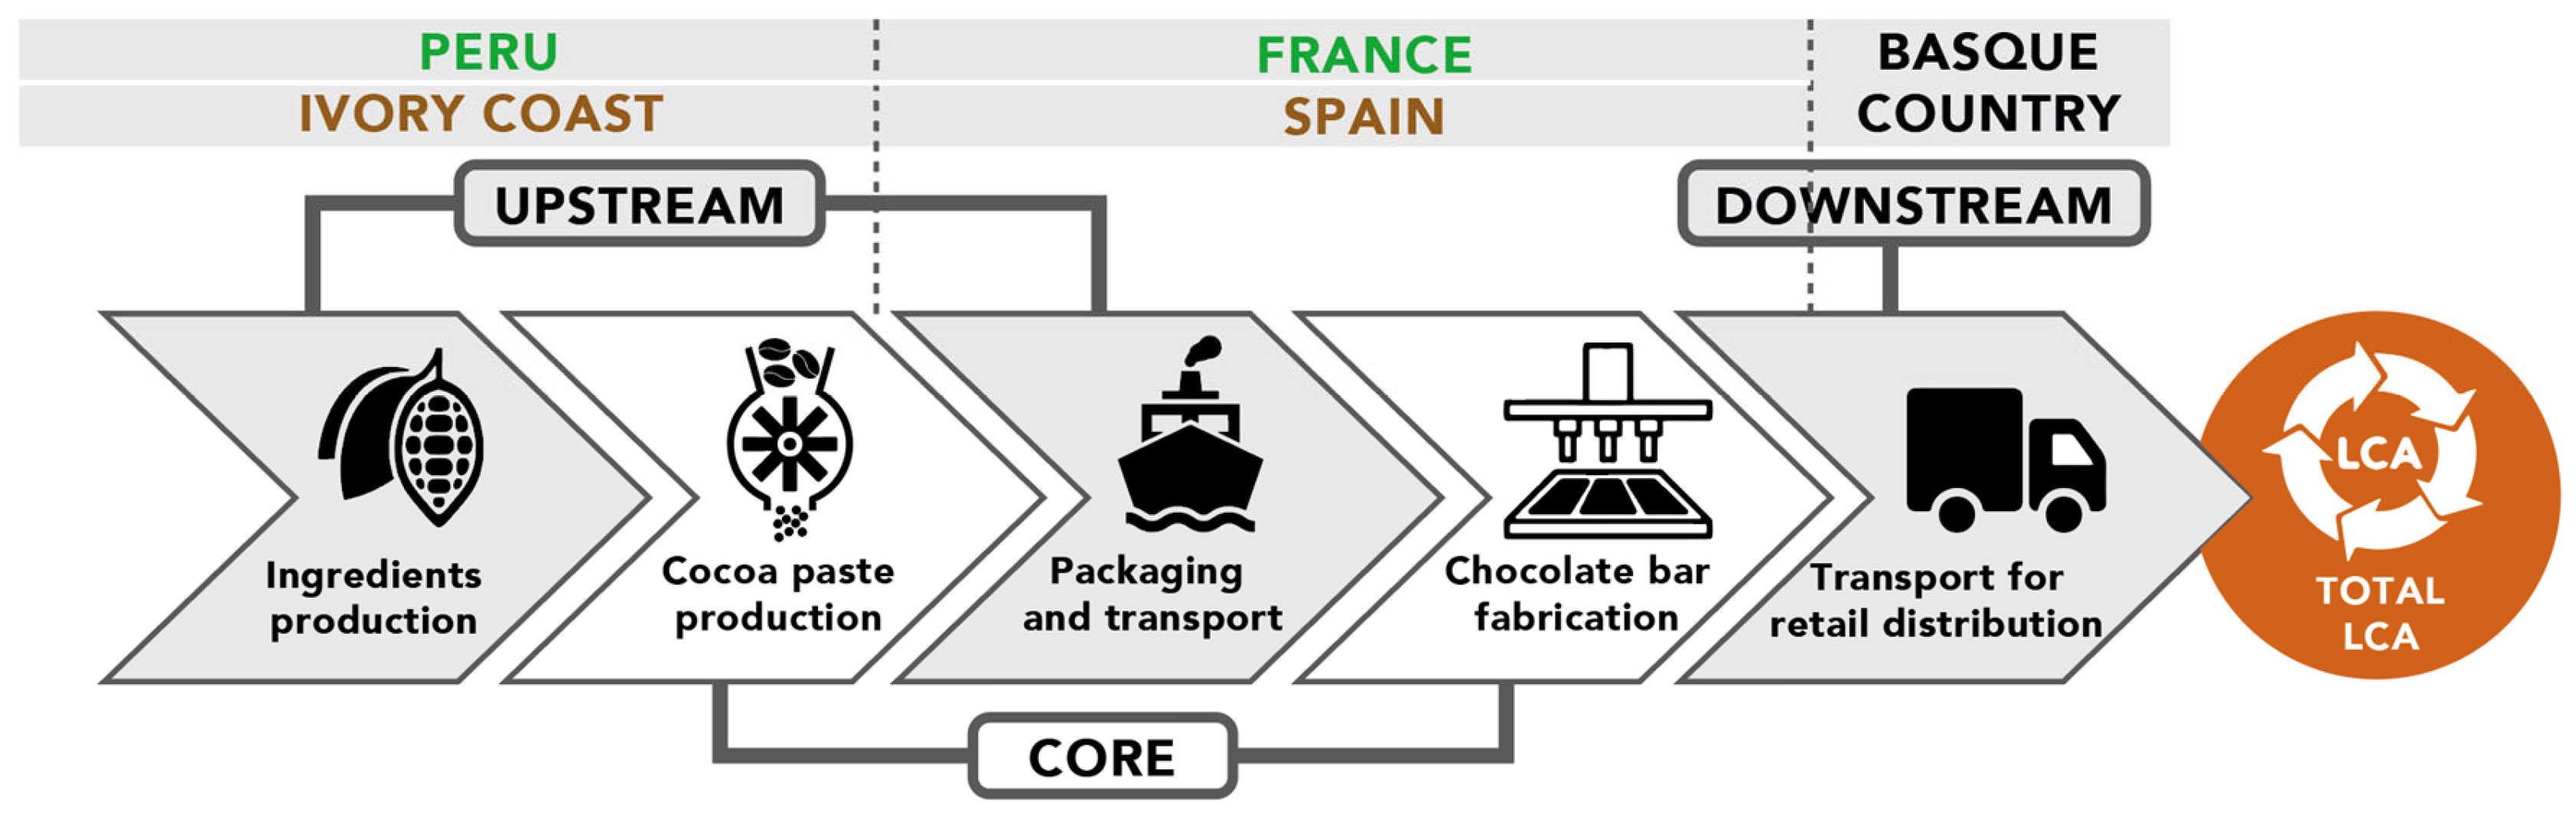
2.1. Methodology, Scope and Boundaries

The life-cycle assessment (LCA) methodology has been used in order to compare the environmental behaviour of Conventional Agriculture (CA) chocolate (72% cocoa) with its equivalent obtained from Organic Agriculture and Fairtrade (OA&FT)-certified production. These have been named Scenario 1 and Scenario 2 respectively. LCA is a tool used to assess the environmental impacts and resources used throughout a product’s life cycle, from raw material acquisition, through production and transport phases, to final delivery to the seller [62]. LCA allows us to model both OA&FT and CA chocolate, from the various agricultural needs of land, water or fertilizers to the need for transportation to carry the product to the end consumer shop.
Previous uses of life-cycle assessment (LCA) have aided in the creation of eco-design products, with researchers designing new scenarios and measuring them to understand how sustainable they could be, taking into account the whole life cycle. In the case of enzymatic cleaners, a GWP reduction of 26.1% was achieved [63], as well as a further reduction of 40% in a wooden bunk that had already been designed in the wooden furniture sector [64]. In the construction sector, reductions of up to 61.7% [65] and 80.9% were seen in Spanish single-family homes, examining an average Spanish apartment made with local and low-processed materials [66]. Meanwhile, in the transportation sector, there were reductions of up to 64.28% in urban passenger transport [67]. The use of other methodologies for footprint assessment, such as global multiregional input–output, could be too imprecise since only the footprints associated with production and consumption could be evaluated [68].
Using LCA methodology, the present study aims to offer a precise account of the potential for organically produced Fairtrade products to reduce environmental impacts. The study has been approached considering a “cradle-to-gate” perspective, meaning that the impacts generated have been analysed from the extraction of the raw material to the production process of the products, including their transport and distribution to the point of sale (Figure 1). The waste from the different processes and the final waste of packaging have also been taken into account, the latter shown in the Packaging and Transportation section.
To identify the scope of the LCA, PCRs (Product Category Rules) are normally used as guidelines for the organization of the processes. In this case, as no specific PCRs exist for chocolate, it was decided by taking the EPDs 2012:06 Bakery products PCR 2012:06 (3.0) as a reference, which was designed following the ISO 14 025 [69]. As shown in Figure 1, the scope of the LCA of cocoa products, whether of conventional or, is determined by Upstream (ingredient production, packaging, auxiliary material and transport), Core (main fabrication) and Downstream (transport for retail distribution) methods (Figure 1). LCAs are divided into four methodological stages: objective and scope, life-cycle inventory (LCI), life-cycle impact assessment (LCIA) and interpretation following ISO 14040:2006 and ISO 14044:2006 [70,71]. The main difficulty has been to identify the inputs and outputs of each process in order to model scenarios using the selected OpenLCA 11.1 software and Ecoinvent 3.9 database (Supporting Information Tables S1 and S2).
In LCA, the functional unit must be precise and clearly defined in order to be able to compare different OA&FT and CA products [72]. In this case, the functional unit that has been selected is 1 kg of chocolate bar consumed by the final consumer, extrapolating the 150 g product available on the market. This includes the respective packaging and retail distribution transport impacts. The boundaries of the system are defined through the different stages of the life cycle of the products, and the limits specify the unitary processes that are taken into account in the analysis.
The software that has been selected to carry out the digital modelling of impacts is OpenLCA [73]. The database chosen for the materials and processes is Ecoinvent v3.9.1 [44,45]. Regarding the method established for the calculation, this is the step where the results of the inventory are transformed into information on the damage caused to the environment. The choice of impact categories must be made in accordance with the boundaries and scope of the study. In this regard, the detected PCRs show the impact categories that must be considered in order to compare the results with those of other organizations that have published verified EPDs (Environmental Product Declarations). In this analysis, the OpenLCA impact methods that have been selected are as follows: on the one hand, ReCiPe 2016 Midpoint Hierarchist (H) is used for three general indicators (global warming potential, terrestrial ecotoxicity and land use), where Midpoint methods measure an effect before damage occurs to one of the areas of protection. That is to say, Midpoint indicators allow the chemical components released to be measured without converting them to their final damaged state. The Hierarchist perspective is based on the most common policy principles with regard to timeframe and other issues and is often considered to be the default model. On the other hand, AWARE is the method used to measure water footprint (WF) and cumulative energy demand (CED) for energy footprint (EF). ISO standards are a set of provisions that are used in organizations to ensure that the products and/or services offered by said organizations meet the customer’s quality requirements and the intended objectives [19].

2.2. Designed Scenarios

The basis of the two scenarios, CA (Scenario 1) and OA&FT (Scenario 2), was modelled according to the Ecoinvent v3.9.1 database. The main reference for modelling the CA was the “growing of beverage crops”, with an average yield of 613 kg/ha per year, from 2009–2012. These were produced under irrigated conditions in 985 m3/ha of Ivory Coast used for the export market (Ecoinvent v3.9.1.). To calculate the whole LCA, the following were taken into account: bibliographic data, primary data from the companies Ethiquable and Norandino for OA&FT cocoa, and a combination of secondary data for CA from the database (Ecoinvent v3.9.1). The combination of all the datasets made it possible to model the two cocoa realities that consumers could choose from on the Basque Country market.
The modelled two scenarios were compared in terms of the results of five impact categories, taking into account the most relevant indicators used in similar product category EPDs where up to 13 indicators are shown [74] and comparing them with those previously analysed in the latest cocoa studies. We factored in (i) global warming potential (GWP), which is defined as the cumulative radiative force, exerting both direct and indirect effects and acting over a specified time horizon due to the emission of a unit mass of gas related to a given reference gas [75]. It is a widely used and studied indicator due to its versatility and public understanding, being measured in kg of CO2-equivalent emissions. We measured (ii) TE in kg of 1,4 DCB –equivalent, which is a category for indicators that denotes the influence of toxic substances on terrestrial ecosystems [76]. We analysed (iii) ENVF, measured with “Land Use” data, in m2a crop-equivalent, which is a unit process that reflects indicators related to crop occupation. This cannot be ignored in environmental analysis as it is a pathway to biodiversity loss [77]. We assessed (iv) WF in m3, which is an indicator of freshwater use that refers to both the direct and indirect use needed to produce goods or services [78]. Finally, we analysed (v) EF in MJ –equivalent, which is the assessment of energy consumption related to a product [79], measuring cradle-to-gate system boundaries of the scenarios using the cumulative energy demand (CED) method. The used scenarios involved two type of chocolates (72% cocoa) with different origins and agricultural production methods:
  • Scenario 1—CA Chocolate (72%): this chocolate has been modelled to represent a standard supermarket chocolate bar (original bar of 150 g, adjusting to the FU of 1 kg), originating from Conventional Agriculture (CA) in Ivory Coast, this being the origin of most of the cocoa on the market as [80] shows. The other ingredients (sugar and additives) are also of CA origin. The transport has been hypothesized as progressing from the cocoa crop area of the Ivory Coast to a chocolate factory in Barcelona (Catalonia) and its subsequent distribution to the Basque Country (See Supporting Information).
  • Scenario 2—OA&FT Chocolate (72%): specifically, “Noir dessert corsé 72% de cacao équitable and bio” chocolate bar (original bar of 150 g, adjusting to the FU of 1 kg) from the brand Ethiquable. This chocolate has been modelled following the Organic Agriculture and Fairtrade (OA&FT) certificates for the cultivation of the ingredients (cocoa and raw cane sugar) from Peru, and its transformation processes and transport (from the cultivation and processing of cocoa paste in Peru, to the chocolate factory in France and the subsequent distribution to the Basque Country market) (See Supporting Information).

2.3. Life Cycle Assumptions and Inventory

The LCA studies were performed using OpenLCA v11.1.0 software. First, to generate the data for the cultivation and production of the cocoa ingredients in Scenario 1 (CA), Ecoinvent v3.9.1 was used for ingredient modelling; in this case, pesticides and fertilizers were maintained in the original proportions. The resources and auxiliary materials used have been obtained and modelled from Ramos-Ramos et al. [81], from whom the energy (kWh), water (m3) and gas (kg) consumption data necessary for the manufacture of 1 kg of cocoa paste have also been computed (Table 6). The same data for the main chocolate manufacturing process is computed (Table 6) according to Lacasa [82]. The origin of the electricity has been considered the same as that of the national mix. The packaging of the conventional chocolate for a 150 g bar is 20 g of polypropylene. Transport has been estimated by taking into account the transport between the crops, the collection centres and the cocoa paste manufacturing plant in Ivory Coast via truck (299 km), and then the maritime transport (5645.62 km) of the cocoa paste to the chocolate factory in Barcelona, Spain; and finally, the transport of the chocolate from the factory to a point of sale in the Basque Country market via truck (432.58 km).
For Scenario 1, it was estimated, as an average recipe of the chocolate on the market, that 13.05 kg of raw cocoa is needed to make 0.73 kg of cocoa paste, where 0.02 kg is needed to extract 0.01 kg of cocoa butter and where 0.71 kg is kept for the manufacture of 1 kg of chocolate (72% chocolate mass, of which 71% is cocoa paste and 1% cocoa butter; 27.8% CA cane sugar and 0.2% vegetable lecithin, Table 7).
For Scenario 2 (OA&FT), Ecoinvent v3.9.1 was used, combined with regulations from OA&FT (Table 1) for the selection of additives to the crop, such as the amount of compost for organic cultivation that is extracted per produced kilogram of cocoa [83], which is 2.7 kg and taken from the work from Rofner et al., or the 1 g of Entomopathogenic Virus used as an organic pesticide per produced cocoa kilogram [84]. The resource consumption to produce 1 kg of chocolate remains the same as in Scenario 1, although with renewable electricity. The modelled origin of the energy in Ethiquable’s chocolate factory is from renewable resources, 25% of which is self-generated by photovoltaic panels, and 75% of which is obtained from a mix of renewable resources from the Enercoop electric cooperative. Cardboard and aluminium foil packaging is estimated for OA&FT from the research of Boakye-Yiadom et al. [46]. Transport has been estimated considering the transport of the crops to the collection centres and to the cocoa paste manufacturing plant in Peru via truck (759 km), then the maritime transport (10,002.35 km) of the cocoa paste to the chocolate factory in Gers, France, and finally the transport of the chocolate from the factory to the Medicusmundi point of sale in the Basque Country via truck (369 km).
Table 6. Primary needs of Cocoa and Chocolate manufacturing processes.
1 kg Cocoa Paste Manufacturing Energy Consumption
IndicatorUnitAmount
ElectricitykWh 0.269
Waterm30.008
Gas (LPG)kg 0.063
Waste (solids)kg 13.766
1 kg Chocolate Manufacturing Energy Consumption
IndicatorUnitAmount
ElectricitykWh 0.6497
Waterm30.01397
Gas (LPG)kg 0.528
In order to model the efficiency of inputs and outputs with their units and corresponding amounts of ingredients for 1 kg of chocolate with a high cocoa content (72%), data from [81,85], as seen in Table 7, and the informants from the companies in collaboration have been used, also using the percentages for a dark chocolate recipe by Stuart [86] for Scenario 2. It has been estimated that 13.05 kg of raw cocoa is needed to make 0.73 kg of cocoa paste, where 0.02 kg of cocoa paste is needed to extract 0.01 kg of cocoa butter and keep 0.71 kg as cocoa paste, for the manufacture of 1 kg of chocolate (72% chocolate mass, of which 71% is cocoa paste and 1% cocoa butter; and 28% OA&FT raw cane sugar, Table 7).
It must be stated as a limitation that having only 2 scenarios to simplify the CA or OA&FT cocoas could be considered a further scientific research aim to be developed on. This research could be a general reference for the design of more detailed future scenarios. In the same way, future studies could have the possibility of generating more primary data than currently used in this study, reducing the amount of secondary data taken from the Ecoinvent database.
Table 7. Processes in the manufacture of chocolate (Supporting Information Tables S3–S5).
EfficiencyProduction PhaseDescription
13.05 kgCocoa cultivationCocoa trees require special care to produce high-quality beans. Farmers must select the right varieties, keep the soil in good condition, and protect the trees from diseases and pests.
3.51 kgFermentation and dryingAfter harvest, the cocoa beans are fermented and dried to develop their characteristic flavour. During this process, farmers must carefully control the temperature and humidity to prevent the growth of mould or bacteria.
0.73 kgRoasting and grindingThe cocoa beans are roasted to develop their flavour and aroma, and then ground to produce cocoa paste.
0.01 kgPressingThe cocoa paste is pressed to extract cocoa butter.
1 kg chocolate
(72% cocoa) = 0.71 kg cocoa paste + 0.01 kg cocoa butter + 0.28 kg raw cane sugar (optional lecithin 0.2%)
Conched and temperedAfterwards, the cocoa paste, cocoa butter and raw brown sugar are conched and blended to produce a silky-smooth chocolate. Then, it is tempered so that it has a suitable texture and shine.
1 kgPackaging and distributionThe chocolate is packaged in bars (150 g) and distributed to stores, supermarkets and so on.

3. Results

3.1. Life-Cycle Impact Assessment (LCIA)

The LCIA results are displayed (Table 8 and Table 9) and analysed. This is performed first from a general percentage point of view of the joint Upstream, Core and Downstream processes. A general trend of a 30% reduction in the five impact categories analysed has been obtained from CA to OA&FT. It has been detected that the Upstream phase has a least 48% of weight in OA&FT in all impact categories and 58% at least in CA, reaching 99.9% in both scenarios in certain impact categories (especially TE, ENVF and WF). The Core phase reaches 47% in OA&FT and 39% in CA, while the Downstream phase impacts reach 15% in OA&FT and only 3% in CA.
It has been seen that the use of Organic Agriculture and Fairtrade has the potential to reduce 4 of the 5 analysed impact categories: GWP, TE, WF and EF (Figure 2). Increases of 19% in Environmental Footprint Land Use in OA&FT cocoa have been detected, but these increases need to be considered with the fact that the used land has lower contamination levels (Figure 3).

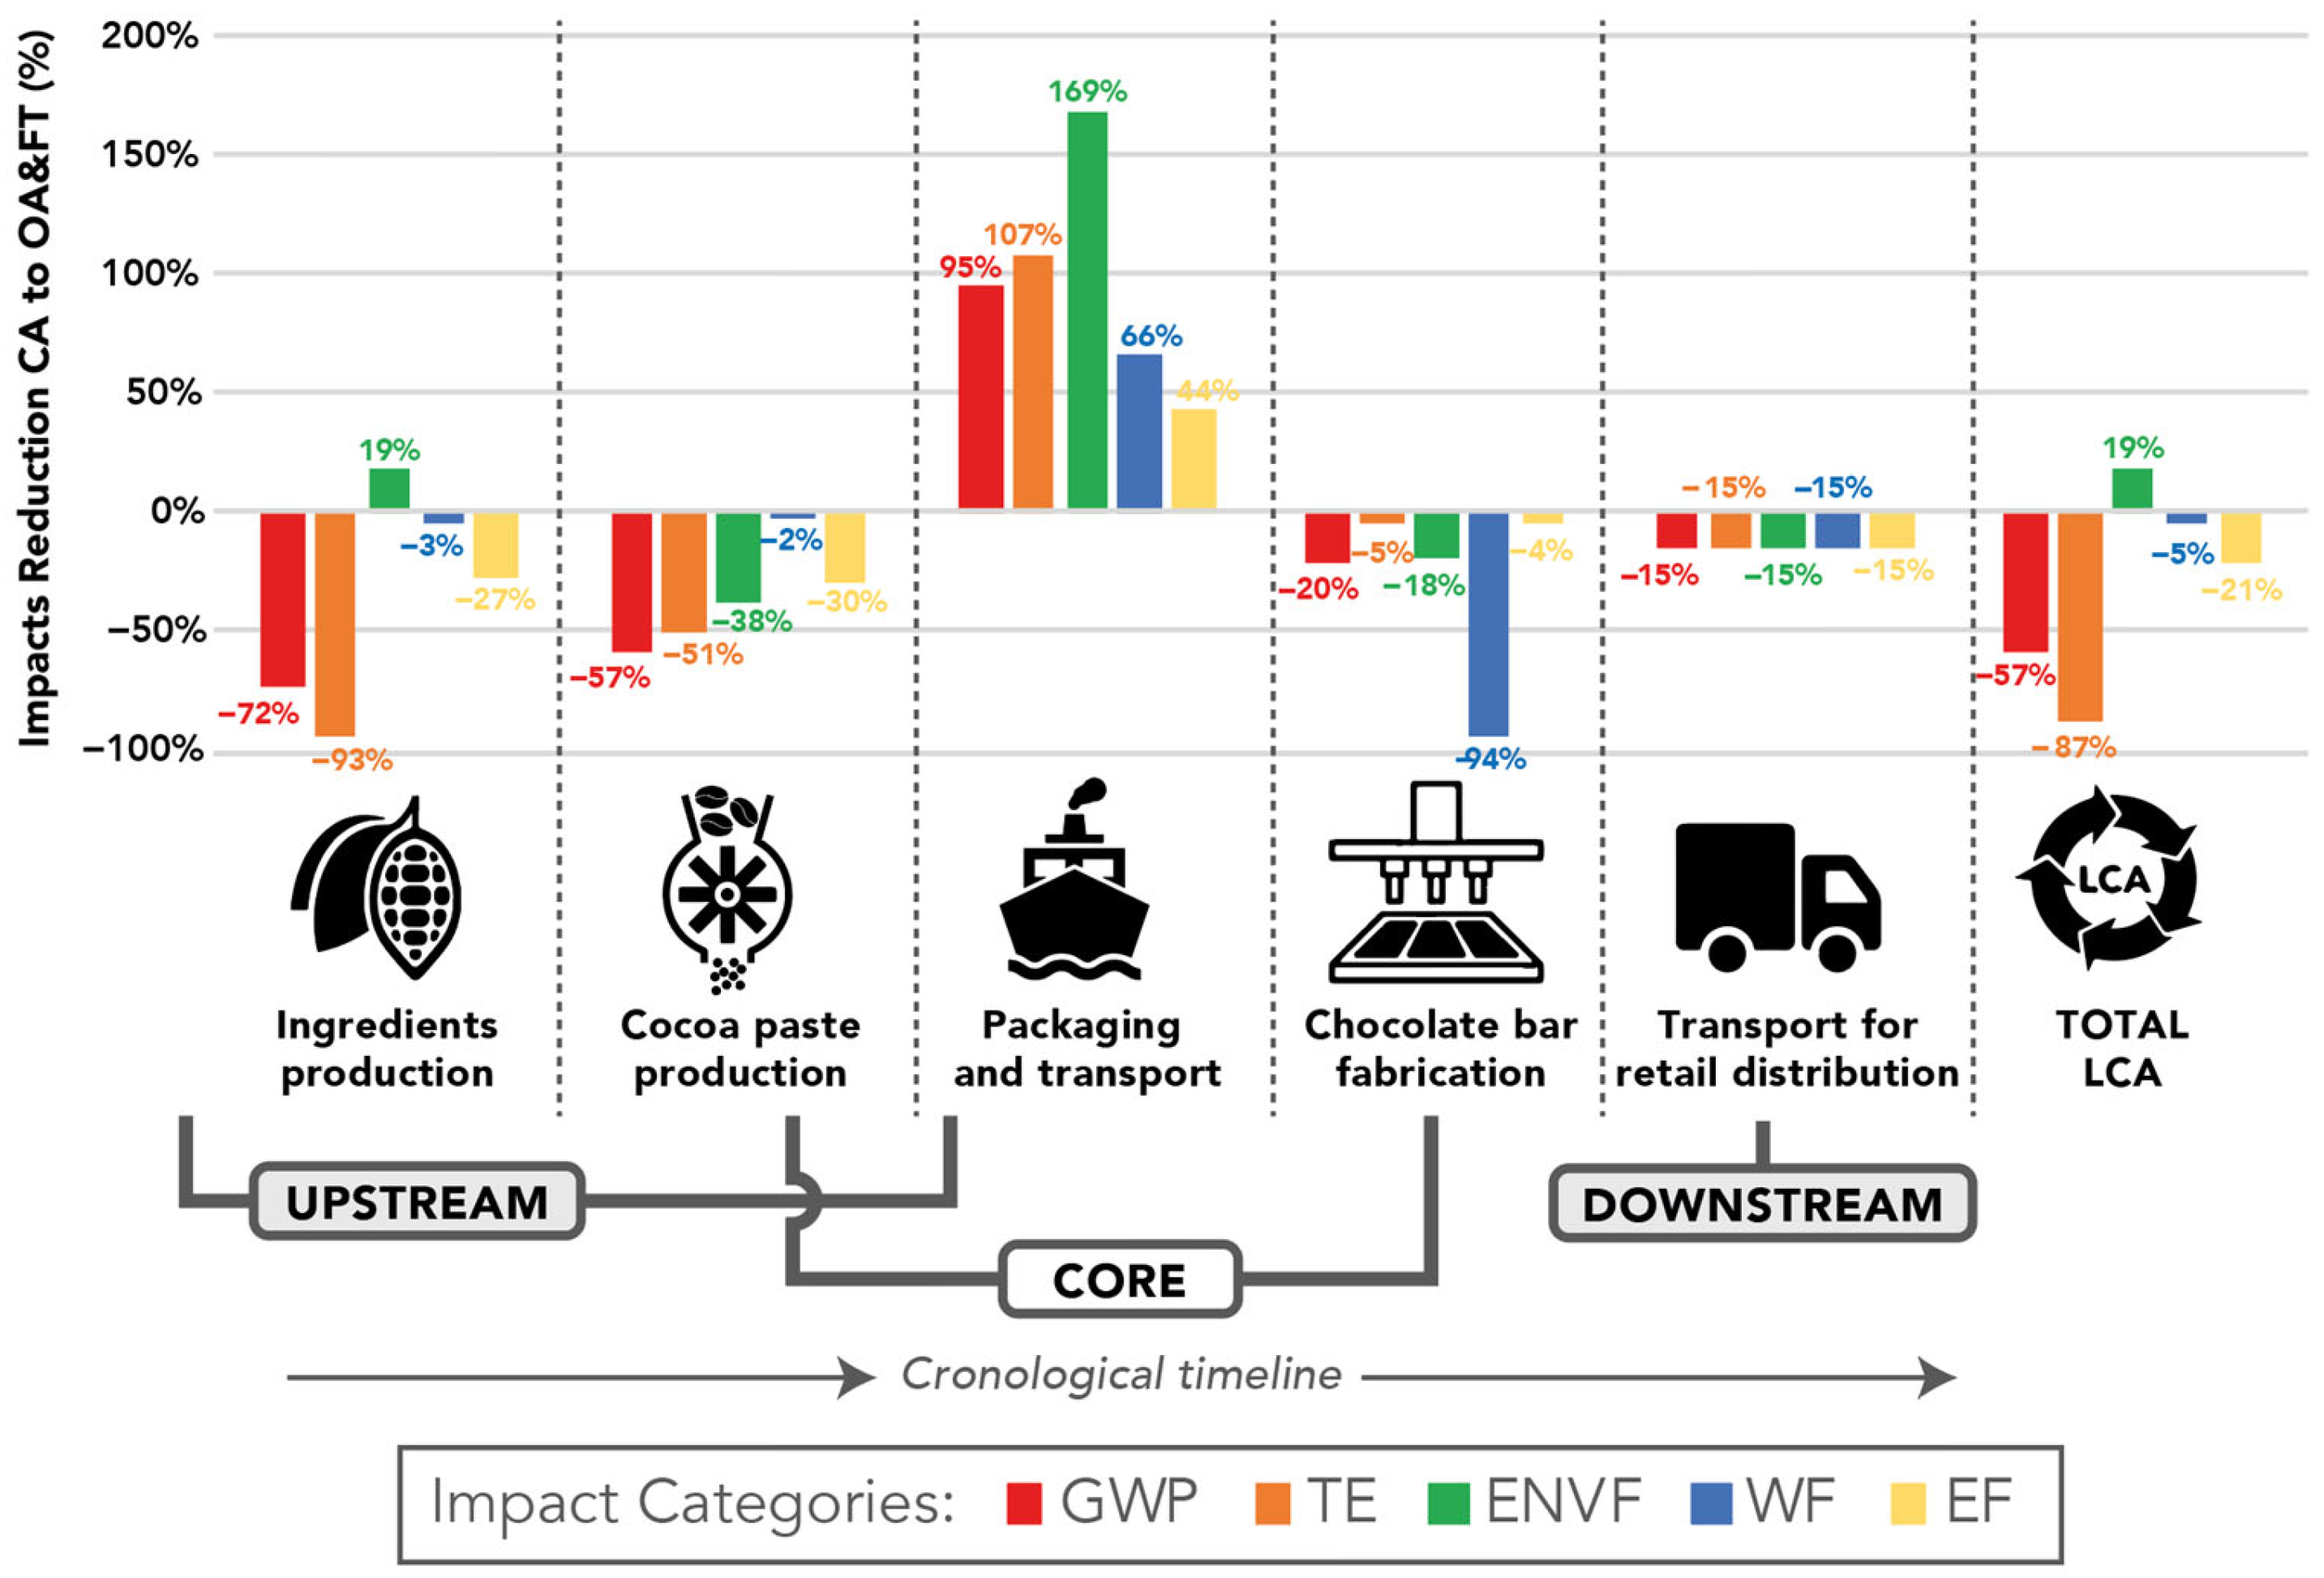
3.2. Overall Process

Table 8 and Table 9 show (and Figure 2) the impacts caused by the overall process. They are disaggregated into Upstream, Core and Downstream phases for the five impact categories selected for this research, as they bring out comparative aspects between the two scenarios. As a general result, in the case of current Conventional Agriculture, the impact of ingredient production is relevant at 4.41 kg CO2-eq per chocolate kilogram (55.8% of total impacts). On the other hand, in OA&FT agriculture, even though the Upstream phase still contributes 47.8% to the whole LCA, the emissions from ingredient production are reduced by 3.17 kg CO2-eq per FU. Reductions from CA to OA&FT are obtained by reducing irrigation quantities, as well as avoiding chemical inorganic fertilizers and chemical pesticides, obtaining reductions of up to 72% in GWP, 93% in TE, 27% in EF and 3% in WF.
Table 8. Global Warming Potential, Terrestrial Ecotoxicity, Environmental Footprint (Land Use), Water Footprint and Energy Footprint of Conventional Agriculture (CA, Scenario 1) Chocolate (72%) in Upstream, Core and Downstream phases.
UPSTREAMCOREDOWNSTREAM
Conventional Agriculture
(CA) Chocolate (72%)
Ingredient Production (IVORY COAST)Packaging and TransportCocoa Paste Production (IVORY COAST)Chocolate bar Fabrication (SPAIN)Transport for Retail DistributionTOTALANALYSED
AVERAGE
Global Warming Potential (GWP) kg CO2-eq4.410.192.380.710.227.903.88
55.82%2.37%30.08%8.94%2.79%100.0%−50.91%
4.603.080.227.90
58.19%39.02%2.79%100.0%
Terrestrial Ecotoxicity (TE)
kg 1,4-DCB
102.831.501.090.832.39108.640.009
94.66%1.38%1.00%0.76%2.20%100.0%−99.99%
104.331.922.39108.64
96.03%1.77%2.20%100.0%
Environmental Footprint (ENVF)
Land Use (m2a crop-eq)
47.050.010.030.010.0047.1056.12
99.88%0.01%0.07%0.03%0.01%100.0%19.15%
47.050.040.0047.10
99.89%0.10%0.01%100.0%
Water Footprint (WF)
m3
116.220.030.672.360.01119.30243.83
97.42%0.03%0.56%1.98%0.01%100.0%104.39%
116.253.030.01119.30
97.44%2.54%0.01%100.0%
Energy Footprint (EF)
MJ-eq
155.243.699.7437.822.97209.4689.61
74.11%1.76%4.65%18.06%1.42%100.0%−57.22%
158.9347.562.97209.46
75.88%22.70%1.42%100.0%
Table 9. Global Warming Potential, Terrestrial Ecotoxicity, Environmental footprint (Land Use), Water footprint and Energy footprint of Organic Agriculture and Fairtrade (OA&FT, Scenario 2) Chocolate (72%) in Upstream, Core and Downstream phase.
UPSTREAMCOREDOWNSTREAM
Fairtrade Organic Agriculture
(OA&TF) Chocolate (72%)
Ingredient
Production (PERU)
Packaging and
Transport
Cocoa Paste Production (PERU)Chocolate Bar Fabrication (FRANCE)Transport for
Retail
Distribution
TOTALANALYSED
AVERAGE
Reduction from CA
(Scenario 1)
Global Warming Potential (GWP) kg CO2-eq1.240.371.010.560.193.372.273−57.32%
36.85%10.85%30.00%16.73%5.58%100.0%−32.61%
1.611.580.193.37
47.69%46.73%5.58%100.0%
Terrestrial Ecotoxicity (TE)
kg 1,4-DCB
7.243.100.540.792.0413.710.005−87.38%
52.80%22.64%3.93%5.76%14.87%100.0%−99.96%
10.341.332.0413.71
75.44%9.69%14.87%100.0%
Environmental Footprint (ENVF)
Land Use (m2a crop-eq)
55.870.010.020.010.0055.9228.6218.72%
99.91%0.02%0.04%0.02%0.01%100.0%−48.82%
55.880.030.0055.92
99.94%0.05%0.01%100.0%
Water Footprint (WF)
m3
112.230.050.660.140.01113.09135.99−5.20%
99.24%0.05%0.58%0.12%0.01%100.0%20.25%
112.280.800.01113.09
99.28%0.71%0.01%100.0%
Energy Footprint (EF)
MJ-eq
114.095.326.8636.192.53164.9935.1−21.23%
69.15%3.22%4.16%21.94%1.54%100.0%−78.73%
119.4143.052.53164.99
72.37%26.09%1.54%100.0%
In contrast, the packaging and transportation (even though it chronologically occurs after the cocoa paste production) located in the Upstream phase (Table 8 and Table 9), has an average increase of 96% in all five impact categories (Figure 2). This phase, which involves the impacts of marine transportation phase from Peru (OA&FT) or Ivory Coast (CA), has an impact of between 2.37% and 10.85%, respectively (between 0.19 and 0.37 kg CO2-eq). This shows that transportation in general has a low GWP impact contribution to the whole life cycle. This is 95% greater in OA&FT, and the benefits generated by OA&FT in the whole life cycle are striking. Within this phase, the impacts of marine transport represent 31% in CA (0.06 kg CO2-eq) and 28% in OA&FT (0.10 kg CO2-eq) (Supporting Information Table S6).
In the Core phase, the GWP reductions are also noteworthy for OA&FT processes, these being on average 57% in cocoa paste production and 20% in chocolate bar fabrication. Finally, in retail transport distribution, reductions of 15% have been observed due to the reduction in the distance to final consumer.
Taking the whole life-cycle into account, a reduction of 57.3% has been observed in the GWP impact category for OA&FT chocolate in comparison with its equivalent CA product (Table 8). In this respect, Figure 3 provides a sensitivity analysis between all the life-cycle phases of reduction capability. It has been observed that the greater increase occurs in transportation, due to the increase in the maritime transport of OA&FT, reaching 169% for the Environmental Footprint of Land Use. In the ingredient production phase, the greatest GWP reductions take place in the TE impact, at 93%, and in Cocoa paste production, at up to 57%.
In terms of data consistency, it must also be noted that, on average, the total GWP impact of the other studies analysed is 33% lower for OA&FT (2.27 kg CO2-eq) and 51% lower for CA (2.27 kg CO2-eq) than the values obtained in our study (Table 7 and Table 8). In the case of CA, the value is lower than standard deviations of 59.5% from the analysed studies. Conversely, in the case of OA&FT, our study impact surpasses the standard deviation of 13.5%. This increase has been seen to occur, especially in the ingredient production phase, due to the use of organic compost, since other studies have avoided even the use of natural and organic fertilizers or pesticides [38].
In the case of the TE impact category, CA shows 108.64 kg 1,4-DCB, while OA&FT cocoa shows 11.77 kg 1,4-DCB, meaning −87% lower impacts. Most of the reduction from CA occurs in the ingredient production phase (−93%); the use of copper oxide as a fungicide in CA makes a significant contribution. The use of copper is still contradictory, however, with some research supporting its use in certain applications [87]. It must be stated that the results of the rest of the studies analysed are 99% lower in both CA and OA&FT.
In the Land Use impact category, OA&FT on average shows 18.7% greater impacts than CA due to lower production ratios. Both show 99.9% of the impacts in the ingredient production phase under the Upstream category. As regards WF, OA&FT shows 5.20% lower impacts than CA, 99% and 97% of which occur in the ingredient production stage.
Finally, with regard to the energy footprint impact category, OA&FT on average shows 21.2% lower consumption with 164.99 MJ per kilogram of chocolate bar produced. Similar to other impact categories, larger impact amounts are occurring in the ingredient production phase (69.15% in OA&FT and 74.11% in CA), but with more distributed values than in other stages.
Thus, in this research, the most remarkable results show that the greatest impact in CA chocolate production occurs in the cultivation of raw materials: up to 56% in GWP and 95% in TE. This is due to the widespread use of hazardous chemicals found in pesticides and inorganic fertilizers in CA, which OA&FT certificates forbid or highly regulate, as shown in Table 1. The research shows that OA&FT has the capability to reduce the impacts occurring by up to −72% in GWP and 93% in TE.

3.3. Introduction of Organic and Fairtrade Chocolate in the Basque Country

As a hypothetical future scenario with 100% OA&FT chocolate integration, it has been suggested that for the coming years, in view of the evolution observed by Fernández Ferrín et al. [13] where, according to the testimonies gathered, consumers in the Basque Country are willing to pay up to 10% more for FT products and choose them over others because of this differential value, Table 10 shows how impacts could be reduced for GWP by 21.95 kg CO2-eq per capita per year, and for TE by 449.02 kg 1,4-DCB per capita per year. Thus, replacing OA&FT chocolate could reduce the yearly total emissions (8.4 t CO2-eq) of an average person in the Basque country by −0.26%.

4. Discussion

The present research provided clear insights when comparing CA chocolate and its respective OA&FT-certificated equivalent. For the market of the Basque Country, it has been shown that shifting to OA&FT certification chocolate would be environmentally beneficial, with reductions in 4 of the 5 impact categories analysed.

4.1. Global Warming Potential

This research has shown that a GWP reduction of 57.32% is possible to obtain with OA&FT, while, the average taken from the analysed research has shown a reduction of 59%. The total life-cycle impact for a 1 kg FU of OA&FT Chocolate (72% cocoa) in the Basque Country has been calculated at 3.37 kg CO2-eq, which is 48.4% greater than the average 2.27 kg CO2-eq (a standard deviation of 13.5%).
Similar whole-life GWP values are obtained by Miah et al. [49], whose reported data for dark chocolate confectionery from a big company using CA was 6.76 kg CO2-eq. Miah et al. [49] also reported 2.16 kg CO2-eq. emissions for “cleaner” cocoa production using more sustainable raw materials, and alternative energy resources, but wihout holding an OA certificate. Additionally, Recanati et al. [38] reported 2.62 kg CO2-eq for OA dark chocolate, in line with the present study. In contrast, some authors have also shown low GWP impacts for CA dark chocolate Pérez-Neira [42], namely 2.49 kg CO2-eq, which differs from our study. Nevertheless, a more recent study by Pérez-Neira et al. [47] found 4.66 kg CO2-eq for CA chocolate (100% cocoa) and 2.04 kg CO2-eq for OA, displaying a greater similarity to this study.
Regarding life-cycle phases, other authors, such as Recanati et al. [38], also give segregated data that coincide in the study of two indicators, GWP and EF, for 1 kg of OA dark chocolate. In the Upstream stage, they obtained 1.55 kg CO2-eq and 16.7 MJ –eq, while, in our research, the result for OA&FT was 2.25 kg CO2-eq and 120.95 MJ -eq, which was 45.16% greater for GWP and 724.25% greater for EF. The lower data obtained by Recanati et al. [38] can be attributed to the type of cultivation, in which natural fertilizers or pesticides are not used since the soil is nourished by the leaves and pods of the cocoa trees themselves, nor is any type of electrical machinery used, not even for the drying of the beans. This can be safely controlled with small or private plantations. As the study shows, in FT, cocoa is generally obtained from small and diverse plantations, in which organic processes can vary. Thus, in our study, the standard of medium-sized organic cultivation with natural additives and minimal machinery has been taken, giving a higher energy consumption in comparison. The same author generated the Core phase in accordance with the same processes and for the same indicators, obtaining 1.30 kg CO2-eq and 16.6 MJ -eq, showing greater similarity in GWP with the 0.93 kg CO2-eq from our research, which is 28.46% lower. However, this is not the case for EF: 41.51 MJ-eq, which is 45.85% greater. The comparison shows that even though Ethiquable uses a greater amount or energy, due to its renewable mix (25% from photovoltaics, and 75% from wind energy, hydraulic and solar energy), the GWP emissions are lower. The Downstream has 0.046 kg CO2-eq and 0.46 MJ-eq in the Recanati et al. [38] study versus 0.16 kg CO2-eq and 2.53 MJ -eq in ours, showing differences in the final distribution distances, and respective effects.

4.2. Terrestrial Ecotoxicity

The TE for this research is 13.71 kg 1.4 DCB -eq for OA&FT chocolate and 108.64 kg 1.4 DCB -eq for CA chocolate. Most of the impacts are attributed to the cultivation of the ingredients and then (with far lower values) to transportation. The process first moves the shipping of the raw material to the factory, and then from retail distribution to the store. There is a decrease of 87.38% between CA chocolate and OA&FT. This is undoubtedly due to the fact that CA uses inorganic fertilizers and pesticides, in particular copper oxide (fungistatic and bacteriostatic), which stands out among all the others. Regarding transportation, the increase from 1.5 to 3.10 kg 1.4 DCB -eq between CA and OA&TF chocolate is due to the increase in boat transportation distance. Boakye-Yiadom et al. [46], Neale [43] and Pérez-Neira et al. [47] reported results about TE. The average for OA dark chocolate was 0.005, which was 99.96% lower than that of the OA&FT dark chocolate in our study; and the average for CA dark chocolate was 0.009, which was 99.99% lower than the CA of the present study.

4.3. Environmental Footprint (Land Use)

The results obtained for OA&FT and CA are 55.92 m2a crop-eq and 47.10 m2a crop-eq, the majority being attributable almost entirely to the cultivation of the ingredients needed for the chocolate. There is an increase of 18.72% when using OA&FT, which is in line with what Seufert et al. [88] and Muller et al. [89] say, which is that OA needs more land than CA but reduces fertilizer and pesticide use, while switching to 100% OA leads to a 16–33% increase in land use. However, OA systems produce lower yields and, for this reason, require larger areas to produce the same yield as CA production systems. Table 3 shows the averages, where the average Land Use for the most sustainable procedures for 1 kg of chocolate is 48.82% lower than for OA&FT chocolate.

4.4. Water Footprint

The WF data obtained for OA&FT and CA chocolate are 113.09 m3 and 119.30 m3, with a reduction of 5.20% when using OA&TF. This is attributed to the cultivation of ingredients, highlighting the greater need for irrigation in CA. Since there is not much information available for OA, the two are compared. Table 4 shows the averages, with the average WF for CA chocolate being 243.83, which is 104.39% higher than that of CA chocolate; and the average for OA or FT chocolate is 135.99, which is 20.25% higher than for OA&FT chocolate.

4.5. Energy Footprint

The EF calculated in this research is 164.99 for OA&FT chocolate and 209.46 for CA chocolate, making OA&TF 21.23% lower. The processes that have the most impact in this category are the cultivation of ingredients and, moreover, the manufacture of chocolate. The assessment highlights the gas consumption associated with the machinery. Compared to the literature review averages shown in Table 5, where EF for 1 kg CA chocolate is 89.61 MJ-eq, the CA in present study is 57.22% more efficient; and the average for OA chocolate is 35.10 MJ-eq, which is 78.73% lower than for OA&FT chocolate. With regard to the phase analysis, it has already been pointed out in Section 4.1 that greater EF values have been obtained than those observed by other authors [38]. However, in contrast, lower GWP has been observed due to the use of a renewable energy mix in the electricity production.

4.6. Strategic Implications

The consumption of certified OA&FT chocolate on the Basque Country market will imply an increase of 8.82 m2a crop-eq, per consumed kilogram of packaged and distributed chocolate bar during its whole life cycle. At the same time, this increase in land will have lower terrestrial ecotoxicity impacts of 449.02 kg 1,4-DCB, lower water footprint of 6210 litres, lower energy footprint of 44.5 MJ-eq and 4.53 kgCO2-eq lower GWP. Thus, even though in maritime transportation and packaging there is an impact of 0.37 kg CO2-eq emissions, this is justified by the total GWP reductions in the whole life cycle. Nevertheless, for future optimizations, closer production of cocoa could provide some reductions in the fraction of 10.85% corresponding to transportation of cocoa paste and packaging.

5. Conclusions

This research concludes that the certified Organic Agriculture and Fairtrade (OA&FT) chocolate (with 72% of cocoa) has an average GWP of 3.37 kg CO2-eq per kilogram, 57.3% lower than the Conventional Agriculture (CA) chocolate. The greatest reduction has been associated with the production of ingredients, at 71.8%. The studied OA&FT chocolate also has an 87.4% lower impact in the terrestrial ecotoxicity (TE) category than that of CA chocolate: 13.7 and 108.6 kg 1.4-DCB per FU, respectively. The greatest reduction in the TE impact category also occurs for OA&FT in the ingredient production phase, at 93%. Reductions in energy footprint (EF) and water footprint (WF) have been also observed in OA&FT (21% and 5%).
It must also be mentioned that a negative effect of the use of OA&FT, with an increase of 18.72% in Environmental Footprint land use, has been detected as an aftereffect. In the current context of a growing global population and lack of crop land, this could act against support for the use of uncontaminated land, with consumers eventually choosing CA over OA&FT, even though this has been defined as a short-term solution.
It has also been detected that—while OA&FT has the capability to reduce the associate environmental loads of GWP, TE, WF and EF—OA&FT increases the packaging and transport phase impacts in all the analysed impact categories (in the case of GWP and TE categories, 95% and 107%, respectively). Leaving aside the potential improvement of producing the chocolate closer to the market to be reached, it is clear that long transport distances without controlled means always generate pollution; however, in the case of this research they do not represent a significant contributor. In this case, the GWP reduction of 57.3% in the whole life cycle of chocolate production obtained under OA&FT certification justifies the increase of emissions of 0.18 kg CO2-eq occurring in the packaging and transportation phase due to the long-distance maritime transportation of 10,000 km. It must be also mentioned that, in the Core phase (cocoa paste production and chocolate fabrication), the use of a renewable energy mix in OA&FT certification has shown a reduction of 48.7% (from 3.08 kg CO2-eq to 1.58 kg CO2-eq). Finally, the proximity of retail points to chocolate factories reduced the emissions of the respective phase impacts by 15%.
In summary, this research shows that replacing the current consumption of CA chocolate with OA&FT production has the potential to reduce GWP by 21.95 kg CO2-eq·person−1·year−1, reducing the current Basque average emission range of 8.4 t CO2-eq·year−1 by 0.26%. Furthermore, even though a greater amount of crop land is needed, a reduction of 449.02 kg 1,4-DCB·person−1·year−1 has been observed in the TE category.
The results undoubtedly show important changes with respect to the use or non-use of existing hazardous substances from fertilizers and pesticides, and the use of renewable energy overcomes the issue of the maritime distance involved in shipping raw OA products. These improvements are not only achieved thanks to OA certification, but the combination with FT is directly responsible also, beginning with it an extensive list of restrictions in ingredient use and responsibility in sustainable actions throughout the whole life cycle. Furthermore, not only are the environmental benefits of OA obtained, but also the social and economic aspects that must coexist with the FT guarantee in order to achieve truly sustainable production and consumption for the planet and the people who inhabit it. In this aspect, further LCA of social impacts need to be performed in future research, having found limited bibliographical references about social LCA for FT- and OA-certified products. In addition, following the evolution of the European analogue markets, it will be becoming increasingly necessary to measure FT imported products in terms of both certificates, which ensure aspects not only of environmental well-being, but also working conditions, cultural, health and personal, as reflected in the 2030 Agenda with its 17 Sustainable Development Goals [90].
In future research, outputs that can be measured with LCA tools could be newly considered under the principles of circular economy. Furthermore, new scenarios could be designed in order to amplify the strategic variables of impact reduction. The cocoa industry generates 73% of waste in the phase up to the production of cocoa paste, and 92% in producing a chocolate bar. This residue, such as cocoa shells, seed pods, pruning leaves, mucilage (gelatinous layer that surrounds the seeds in the fresh fruit), is currently thrown onto the plantation soil itself as “compost”, which is not in all cases beneficial, often causing putrefaction and the generation of harmful fungi. This is sometimes burned to obtain biomass or to generate animal feed, although ways of upcycling are gradually being introduced in order to generate a value equal to or greater than that of cocoa, examples including mucilage drinks, cocoa teas, flavorings, antioxidants, soaps, jams, a source of pectin, and even alcoholic beverages such as liquors and wine [91,92]. The creation of more complex LCA scenarios could provide more realistic results to guide the transition towards more sustainable policies in the cocoa industry.

Supplementary Materials

The following supporting information can be downloaded at: https://www.mdpi.com/article/10.3390/su16020493/s1, Table S1. Inventory data for Ethiquable’s Organic Agriculture and Fairtrade (OA&FT) Chocolate (72% cocoa). Table S2. Inventory data Conventional Agriculture (CA) Chocolate (72% cocoa). Table S3. Inputs and outputs for 0.71 kg of cocoa paste input needs. Table S4. Ingredients for 1 kg of Organic and Fairtrade (OA&FT) Chocolate (72%). Table S5. Ingredients for 1 kg of Conventional Agriculture (CA) Chocolate (72%) Table S6. Breakdown of Transport and Packaging results by GWP impact category. Figure S1. Chocolate bar (150 g) from Ethiquable, “Noir dessert corsé 72% de cacao équitable & bio”.

Author Contributions

Investigation, calculations and writing B.L.d.A.; supervision O.A.-G. All authors have read and agreed to the published version of the manuscript.

Funding

This research was funded by Medicusmundi Araba and the Basque Agency of Cooperation for International Development of the Basque Government, with the grant FOCAD-PRO-2021K3-0016. The project has also been funded by Life-Cycle Thinking Research Group (LCTG) through the grant provided by the University of the Basque Country (UPV/EHU) (ref. GIU21/010).

Institutional Review Board Statement

Not applicable.

Informed Consent Statement

Not applicable.

Data Availability Statement

Data are contained within the article and Supplementary Materials.

Acknowledgments

The authors are grateful for the support provided by Medicusmundi Araba and Life-Cycle Thinking Group (LCTG) of the University of the Basque Country.

Conflicts of Interest

The authors declare no conflicts of interest.

Abbreviation

FTFairtrade
CECircular Economy
LCALife-Cycle Assessment
LCIALife-Cycle Impact Assessment
OAOrganic Agriculture
CAConventional Agriculture
GWPGlobal Warming Potential
TETerrestrial Ecotoxicity
GGGreenhouse Gases
ISOInternational Organization for Standardization
PCRProduct Category Rules
EPDEnvironmental Product Declarations
CMDCumulative Energy Demand
EFEnergy Footprint
WFWater Footprint
ENVFEnvironmental Footprint
CEDCumulative Energy Demand
FUFunctional Unit

References

  1. San Salvador del Valle, M.; Akizu-Gardoki, O.; Bueno, G.; Bermejo, R. Quantifying international energy justice: The cost of electricity within footprint accounts. J. Clean. Prod. 2022, 341, 130797. [Google Scholar] [CrossRef]
  2. Saavedra, E. Comercio justo. Obs. Económico 2012, 62, 6–7. [Google Scholar] [CrossRef]
  3. CECJ. El Comercio Justo Como Herramienta de Cooperación al Desarrollo; Comercio Justo: Madrid, Spain, 2008. [Google Scholar]
  4. WTFO. Qué es el Comercio Justo. Coordinadora Estatal de Comercio Justo. 2021, pp. 1–10. Available online: https://comerciojusto.org/que-es-el-comercio-justo-2/ (accessed on 15 November 2023).
  5. Adams, M.A.; Carodenuto, S. Stakeholder perspectives on cocoa’s living income differential and sustainability trade-offs in Ghana. World Dev. 2023, 165, 106201. [Google Scholar] [CrossRef]
  6. Carodenuto, S.; Buluran, M. The effect of supply chain position on zero-deforestation commitments: Evidence from the cocoa in-dustry. J. Environ. Policy Plan. 2021, 23, 716–731. [Google Scholar] [CrossRef]
  7. Maguire-Rajpaul, V.A.; Sandbrook, C.; McDermott, C.; Hirons, M.A. Climate-smart cocoa governance risks entrenching old hegemonies in Côte d’Ivoire and Ghana: A multiple environmentality analysis. Geoforum 2022, 130, 78–91. [Google Scholar] [CrossRef]
  8. Roessler, P.; Pengl, Y.I.; Marty, R.; Titlow, K.S.; van de Walle, N. The cash crop revolution, colonialism and economic reorganization in Africa. World Dev. 2022, 158, 105934. [Google Scholar] [CrossRef]
  9. Mustapha, K. Taste of Child Labor Not So Sweet: A Critique of Regulatory Approaches to Combating Child Labor Abuses by the U.S. Chocolate Industry. Wash. Univ. Law Rev. 2009, 87, 1163. [Google Scholar]
  10. Sellare, J. New insights on the use of the Fairtrade social premium and its implications for child education. J. Rural Stud. 2022, 94, 418–428. [Google Scholar] [CrossRef]
  11. Sellare, J.; Meemken, E.-M.; Qaim, M. Fairtrade, Agrochemical Input Use, and Effects on Human Health and the Environment. Ecol. Econ. 2020, 176, 106718. [Google Scholar] [CrossRef]
  12. MAPA, Ministerio de Agricultura Pesca y Alimentación. Informe del Consumo de Alimentación en España; Ministerio de Agricultura Pesca y Alimentación: Madrid, Spain, 2021. [Google Scholar]
  13. Fernández Ferrín, P.; Galán Ladero, M.M.; Calvo Turrientes, A.; Castro González, S. El Comercio Justo en Euskadi; Comercio Justo: Madrid, Spain, 2021. [Google Scholar]
  14. Tran-Nam, Q.; Tiet, T. The role of peer influence and norms in organic farming adoption: Accounting for farmers’ heterogeneity. J. Environ. Manag. 2022, 320, 115909. [Google Scholar] [CrossRef]
  15. CROP. Agricultura Sostenible: La Aplicación Del Nuevo Concepto. In Earth Observing System; EOS Data Analytics: Mountain View, CA, USA, 2020; Available online: https://eos.com/es/blog/agricultura-sostenible/ (accessed on 15 November 2023).
  16. European Commission. La agricultura ecológica en pocas palabras. In Web Oficial de la Unión Europea; Agriculture and rural development: Washington, DC, USA, 2021; Available online: https://ec.europa.eu/info/food-farming-fisheries/farming/organic-farming/organics-glance_es#legislation (accessed on 15 November 2023).
  17. Macarthur, E. What is the Circular Economy? Ellen Macarthur Foundation: Cowes, UK, 2017; Available online: https://www.ellenmacarthurfoundation.org/circular-economy/what-is-the-circular-economy (accessed on 15 November 2023).
  18. Regueiro, C.; Gómez-Goiri, A.; Pedrosa, N.; Semertzidis, C.; Iturbe, E.; Mansell, J. Blockchain-based refurbishment certification system for enhancing the circular economy. Blockchain Res. Appl. 2023, 100172. [Google Scholar] [CrossRef]
  19. ISO_IEC 17065_2012(en); Conformity Assessment—Requirements for Bodies Certifying Products, Processes and Services. International Organization for Standardization: Geneva, Switzerland, 2012.
  20. SO 14020:2000; Environmental Labels and Declarations—General Principles. International Organization for Standardization: Geneva, Switzerland, 2000; p. 10.
  21. International guide Fair Trade labels. Guía Internacional de Selloa de Comercio Justo. 2020. Available online: https://comerciojusto.org/wp-content/uploads/2018/03/GUIA_INTERNACIONAL_DE_SELLOS_web.pdf (accessed on 15 November 2023).
  22. Makita, R. A Role of Fair Trade Certification for Environmental Sustainability. J. Agric. Environ. Ethics 2016, 29, 185–201. [Google Scholar] [CrossRef]
  23. Hamilton, E.R. 10 Principles of Fair Trade; World Fair Trade Organization: Culemborg, The Netherlands, 2017; pp. 1–21. Available online: https://www.hamiltonbook.com/catalog/c.pdf (accessed on 15 November 2023).
  24. European Commission. Regulation (EU) 2018/848 on organic production and labelling of organic product. Off. J. Eur. Union 2018, 2018, 1–92. Available online: https://eur-lex.europa.eu/legal-content/EN/TXT/PDF/?uri=CELEX:32018R0848&from=EN (accessed on 15 November 2023).
  25. FairTrade. Hazardous Materials List; Fairtrade International: Bonn, Germany, 2022; pp. 1–19. [Google Scholar]
  26. FairTrade. Fairtrade Standard for Coffee; Fairtrade International: Bonn, Germany, 2021; pp. 1–25. Available online: www.fairtrade.net/standards.html (accessed on 15 November 2023).
  27. Wielechowski, M.; Roman, M. The essence of fair trade and its importance in the world economy. Oeconomia 2012, 11, 47–57. [Google Scholar]
  28. ICO. International Coffee Organization—Trade Statistics Tables. 2021. Available online: http://www.ico.org/trade_statistics.asp?section=Statistics (accessed on 15 November 2023).
  29. ICCO. Statistics—International Cocoa Organization. 2021. Available online: https://www.icco.org/statistics/ (accessed on 15 November 2023).
  30. Rainforest Alliance. Rainforest Alliance. 2023. Available online: https://www.rainforest-alliance.org/ (accessed on 15 November 2023).
  31. Fairtrade International. Fairtrade products: Bananas. 2023. Available online: https://info.fairtrade.net/product/bananas (accessed on 15 November 2023).
  32. Renier, C.; Vandromme, M.; Meyfroidt, P.; Ribeiro, V.; Kalischek, N.; Ermgassen, E.K.H.J.Z. Transparency, traceability and deforestation in the Ivorian cocoa supply chain. Environ. Res. Lett. 2023, 18, 024030. [Google Scholar] [CrossRef]
  33. FAO—Food and Agriculture Organization of the United Nations. Zero-deforestation cocoa sweetens World Food Day. 2023. Available online: https://www.fao.org/gcf/news-and-events/news-detail/http-www.fao.org-climate-change-news-detail-en-c-1314699/en (accessed on 15 November 2023).
  34. Ivanova, Y.; Tristán, M.C.; Romero, M.; Charry, A.; Lema, S.; Sánchez, J.; Vélez, A.; Castro, A.; Quintero, M. Moving towards a Deforestation-free Cacao and Chocolate Value Chain with Low Greenhouse Gas Emissions; International Center for Tropical Agriculture (CIAT): Cali, Colombia, 2020; 136p, Available online: https://cgspace.cgiar.org/bitstream/handle/10568/110541/CacaoValueChain_2020.pdf?sequence=1 (accessed on 15 November 2023).
  35. Nguyen-Duy, N.; Talsma, T.; Nguyen, T.K.; Nguyen, Q.T.; Laderach, P. Carbon Assessment for Cocoa (Theobroma cacao L.) Cropping Systems in Lampung, Indonesia; International Center for Tropical Agriculture (CIAT): Hanoi, Vietnam, 2018; p. 32. [Google Scholar]
  36. Romero, M.; Pareja, P.; Tristán, M.; Sanchez, J.; Quintero, M. Análisis ex ante de Estrategias de Mitigación de GEI en el Cultivo de palma Aceitera en la Región de Ucayali, Perú; International Center for Tropical Agriculture (CIAT): Cali, Colombia, 2022; 43p. [Google Scholar]
  37. Boeckx, P.; Bauters, M.; Dewettinck, K. Poverty and climate change challenges for sustainable intensification of cocoa systems. Curr. Opin. Environ. Sustain. 2020, 47, 106–111. [Google Scholar] [CrossRef]
  38. Recanati, F.; Marveggio, D.; Dotelli, G. From beans to bar: A life cycle assessment towards sustainable chocolate supply chain. Sci. Total Environ. 2018, 613–614, 1013–1023. [Google Scholar] [CrossRef]
  39. Konstantas, A.; Jeswani, H.K.; Stamford, L.; Azapagic, A. Environmental impacts of chocolate production and consumption in the UK. Food Res. Int. 2018, 106, 1012–1025. [Google Scholar] [CrossRef]
  40. Schroth, G.; Jeusset, A.; da Silva Gomes, A.; Florence, C.T.; Coelho, N.A.P.; Faria, D.; Läderach, P. Climate friendliness of cocoa agroforests is compatible with productivity increase. Mitig. Adapt. Strateg. Glob. Change 2016, 21, 67–80. [Google Scholar] [CrossRef]
  41. Ortiz-Rodríguez, O.O.; Villamizar-Gallardo, R.A.; Naranjo-Merino, C.A.; García-Caceres, R.G.; Castañeda-Galvís, M.T. Carbon footprint of the colombian cocoa production. Eng. Agric. 2016, 36, 260–270. [Google Scholar] [CrossRef]
  42. Pérez Neira, D. Energy efficiency of cacao agroforestry under traditional and organic management. Agron. Sustain. Dev. 2016, 36, 1–10. [Google Scholar] [CrossRef]
  43. Neale, B. Evaluating the True Cost of Cocoa Production & the Viability of Mondelēz International’s Farm of the Future Model. 2016. Available online: https://dukespace.lib.duke.edu/items/2801e3f9-120c-494b-9d36-01348f1769bf (accessed on 15 November 2023).
  44. Wernet, G.; Bauer, C.; Steubing, B.; Reinhard, J.; Moreno-Ruiz, E.; Weidema, B. The ecoinvent database version 3 (part I): Overview and methodology. Int. J. Life Cycle Assess. 2016, 21, 1218–1230. Available online: http://link.springer.com/10.1007/s11367-016-1087-8 (accessed on 15 November 2023). [CrossRef]
  45. FitzGerald, D.; Sonderegger, T. Document of Changes Implement Ted in the Ecoinvent Database v3.9.1. 2022. Available online: https://ecoinvent.org/wp-content/uploads/2022/12/Change-Report-v3.9.1.pdf (accessed on 15 November 2023).
  46. Boakye-Yiadom, K.A.; Duca, D.; Pedretti, E.F.; Ilari, A. Environmental performance of chocolate produced in ghana using life cycle assessment. Sustainability 2021, 13, 6155. [Google Scholar] [CrossRef]
  47. Pérez-Neira, D.; Copena, D.; Armengot, L.; Simón, X. Transportation can cancel out the ecological advantages of producing organic cacao: The carbon footprint of the globalized agrifood system of cuadorian chocolate. J. Environ. Manag. 2020, 276, 111306. [Google Scholar] [CrossRef] [PubMed]
  48. Armengot, L.; Beltrán, M.J.; Schneider, M.; Simón, X.; Pérez-Neira, D. Food-energy-water nexus of different cacao production systems from a LCA approach. J. Clean. Prod. 2021, 304, 126941. [Google Scholar] [CrossRef]
  49. Miah, J.H.; Griffiths, A.; McNeill, R.; Halvorson, S.; Schenker, U.; Espinoza-Orias, N.D.; Morse, S.; Yang, A.; Sadhukhan, J. Environmental management of confectionery products: Life cycle impacts and improvement strategies. J. Clean. Prod. 2018, 177, 732–751. [Google Scholar] [CrossRef]
  50. Parra-Paitan, C.; Verburg, P.H. Accounting for land use changes beyond the farm-level in sustainability assessments: The impact of cocoa production. Sci. Total Environ. 2022, 825, 154032. [Google Scholar] [CrossRef]
  51. Ortiz-Rodriguez, O.O.; Naranjo, C.A.; García-Caceres, R.G.; Villamizar-Gallardo, R.A. Water footprint assessment of the Colombian cocoa production. Rev. Bras. De Eng. Agric. E Ambient. 2015, 19, 823–828. [Google Scholar] [CrossRef]
  52. Mekonnen, M.M.; Hoekstra, A.Y. The green, blue and grey water footprint of crops and derived crop products. Hydrol. Earth Syst. Sci. 2011, 15, 1577–1600. [Google Scholar] [CrossRef]
  53. van Oel, P.R.; Mekonnen, M.M.; Hoekstra, A.Y. The external water footprint of the Netherlands: Geographically-explicit quantification and impact assessment. Ecol. Econ. 2009, 69, 82–92. [Google Scholar] [CrossRef]
  54. Miglietta, P.P.; Fischer, C.; De Leo, F. Virtual water flows and economic water productivity of Italian fair-trade: The case of bananas, cocoa and coffee. Br. Food J. 2022, 124, 4009–4023. [Google Scholar] [CrossRef]
  55. Félix Olegário, K.; Pereira Andrade, E.; Coelho Sampaio, A.P.; Mato, S.J.; de Figueirêdo, M.C.B.; de Almeida Neto, J.A. Water scarcity footprint of cocoa irrigation in Bahia. Rev. Ambiente E Agua 2014, 9, 445–458. [Google Scholar] [CrossRef]
  56. Bulsink, F.; Hoekstra, A.Y.; Booij, M.J. Hydrology and Earth System Sciences The water footprint of Indonesian provinces related to the consumption of crop products. Hydrol. Earth Syst. Sci 2010, 14, 119–128. Available online: www.hydrol-earth-syst-sci.net/14/119/2010/ (accessed on 15 November 2023). [CrossRef]
  57. Dianawati, D.; Indrasti, N.S.; Ismayana, A.; Yuliasih, I.; Djatna, T. Carbon Footprint Analysis of Cocoa Product Indonesia Using Life Cycle Assessment Methods. J. Ecol. Eng. 2023, 24, 187–197. [Google Scholar] [CrossRef] [PubMed]
  58. Ethiquable. Entreprise Coopérative, Citoyenne et Solidaire. 2023. Available online: https://www.ethiquable.coop/ (accessed on 15 November 2023).
  59. Norandino. Cooperativa Agraria Norandino Ltda. 2023. Available online: https://coopnorandino.com.pe/nosotros/ (accessed on 15 November 2023).
  60. Orgenstra. Cocoa, the Black Gold of Côte d’Ivoire. 2023. Available online: https://www.orgenstra.com/en/23-actualites-cocoa-the-black-gold-of-cote-d-ivoire.html (accessed on 12 December 2023).
  61. Public Agency Ihobe. Ihobe—News—Greenhouse Gas Emissions in the Basque Country Were 2% Lower in the Year before the Pandemic. 2021. Available online: https://www.ihobe.eus/news/greenhouse-gas-emissions-in-the-basque-country-were-2-lower-in-the-year-before-the-pandemic (accessed on 15 November 2023).
  62. Finnveden, G.; Hauschild, M.Z.; Ekvall, T.; Guinée, J.; Heijungs, R.; Hellweg, S.; Koehler, A.; Pennington, D.; Suh, S. Recent developments in Life Cycle Assessment. J. Environ. Manag. 2009, 91, 1–21. [Google Scholar] [CrossRef] [PubMed]
  63. de Lapuente Díaz de Otazu, R.L.; Akizu-Gardoki, O.; de Ulibarri, B.; Iturrondobeitia, M.; Minguez, R.; Lizundia, E. Ecodesign coupled with Life Cycle Assessment to reduce the environmental impacts of an industrial enzymatic cleaner. Sustain. Prod. Consum. 2022, 29, 718–729. [Google Scholar] [CrossRef]
  64. Coloma-Jiménez, M.; Akizu-Gardoki, O.; Lizundia, E. Beyond ecodesign, internationalized markets enhance the global warming potential in the wood furniture sector. J. Clean. Prod. 2022, 379, 134795. [Google Scholar] [CrossRef]
  65. Izaola, B.; Akizu-Gardoki, O.; Oregi, X. Setting baselines of the embodied, operational and whole life carbon emissions of the average Spanish residential building. Sustain. Prod. Consum. 2023, 40, 252–264. [Google Scholar] [CrossRef]
  66. Izaola, B.; Akizu-Gardoki, O. Biodiversity burdens in Spanish conventional and low-impact single-family homes. Sci. Total Environ. 2024, 909, 168371. [Google Scholar] [CrossRef]
  67. Montoya-Torres, J.; Akizu-Gardoki, O.; Alejandre, C.; Iturrondobeitia, M. Towards sustainable passenger transport: Carbon emission reduction scenarios for a medium-sized city. J. Clean. Prod. 2023, 418, 138149. [Google Scholar] [CrossRef]
  68. Villamor, E.; Akizu-Gardoki, O.; Heinonen, J.T.; Bueno, G. Global Multi-Regional Input-Output methodology reveals lower energy foot-print in an alternative community project. Sustain. Prod. Consum. 2022, 34, 65–77. [Google Scholar] [CrossRef]
  69. Environdec. Bakery Products. 2022. Available online: https://api.environdec.com/api/v1/EPDLibrary/Files/d4f8143a-4daa-4a55-5070-08dbd569605a/Data (accessed on 15 November 2023).
  70. ISO 14040:2006; Environmental Management—Life Cycle Assessment—Principles and Framework. ISO: Geneva, Switzerland, 2006. Available online: https://www.iso.org/cms/render/live/en/sites/isoorg/contents/data/standard/03/74/37456.html (accessed on 15 November 2023).
  71. ISO 14044:2006; Environmental Management. Life Cycle Assessment. Requirements and Guidelines. ISO: Geneva, Switzerland, 2014.
  72. Aguirre, N. Análisis Comparativo de Impactos Ambientales de Productos de Comercio Justo con Respecto a Productos Convencionales; El caso de la panela La Cesta Sostenible y el café Nicaragua; Todos Tus Libros: Madrid, Spain, 2022; pp. 12–26. ISBN 9788409547418. [Google Scholar]
  73. OpenLCA. OpenLCA.org|OpenLCA Is a Free, Professional Life Cycle Assessment (LCA) and Footprint Software with a Broad Range of Features and Many Available Databases, Created by GreenDelta since 2006. 2023. Available online: https://www.openlca.org/ (accessed on 15 November 2023).
  74. Epd Buondì. Environmental Product Declaration of Buondì Cioccolato. In Accordance with ISO 14025. 2023. Available online: https://api.environdec.com/api/v1/EPDLibrary/Files/32a88b1f-abf7-4572-4f0f-08dbdfa90a02/Data (accessed on 12 September 2023).
  75. Muralikrishna, I.V.; Manickam, V. Air Pollution Control Technologies. In Environmental Management; Springer: Cham, Switzerland, 2017; pp. 337–397. [Google Scholar] [CrossRef]
  76. Dincer, I.; Bicer, Y. 2.1 Ammonia. Compr. Energy Syst. 2018, 2, 1–39. [Google Scholar] [CrossRef]
  77. De Baan, L.; Mutel, C.L.; Curran, M.; Hellweg, S.; Koellner, T. Land use in life cycle assessment: Global characterization factors based on regional and global potential species extinction. Environ. Sci. Technol. 2013, 47, 9281–9290. [Google Scholar] [CrossRef] [PubMed]
  78. Chapagain, A.K.; Hoekstra, A.Y. Water Footprints of Nations Volume 2: Appendices Value of Water; UNESCO-IHE Institute for Water Education: Delft, The Netherlands, 2004. [Google Scholar]
  79. ICTFootprint. What Is an Energy Footprint? 2018. Available online: https://ictfootprint.eu/en/faq-page/what-energy-footprint (accessed on 15 November 2023).
  80. López Cuadra, Y.M.; Cunias Rodríguez, M.Y.; Carrasco Vega, Y.L.; López Cuadra, Y.M.; Cunias Rodríguez, M.Y.; Carrasco Vega, Y.L. El cacao peruano y su impacto en la economía nacional. Rev. Univ. Y Soc. 2020, 12, 344–352. Available online: http://scielo.sld.cu/scielo.php?script=sci_arttext&pid=S2218-36202020000300344&lng=es&nrm=iso&tlng=es (accessed on 15 November 2023).
  81. Ramos-Ramos, T.P.; Guevara-Llerena, D.J.; Sarduy-Pereira, L.B.; Diéguez-Santana, K. Producción Más Limpia Y Ecoeficiencia En El Procesado Del Cacao: Un Caso De Estudio En Ecuador. Investig. Desarro. 2020, 20, 135–146. [Google Scholar] [CrossRef]
  82. Lacasa. 0. Información General 0.1; Lacasa Inc.: Goshen, IN, USA, 2021; pp. 1–38. [Google Scholar]
  83. Rofner, N.F.; Salinas, S.J.; de Lara, T.F.G.M. Comportamiento Del Cadmio Y Otros Indicadores En Suelo Y Almendra De Cacao (Theobroma cacao L.), Bajo Aplicación De Compost Y Npk. Folia Amaz. 2018, 27, 193–202. [Google Scholar] [CrossRef]
  84. Yadav, A.N. (Ed.) Soil Microbiomes for Sustainable Agriculture: Functional Annotation, Sustainable Development and Biodiversity; Springer International Publishing: Cham, Switzerland, 2021. [Google Scholar] [CrossRef]
  85. Molina-Cedeño, C.S.; Pillco-Herrera, B.M.; Salazar-Muñoz, E.F.; Coronel-Espinoza, B.D.; Sarduy-Pereira, L.B.; Diéguez-Santana, K. Producción más limpia como estrategia ambiental preventiva en el proceso de elaboración de pasta de cacao. Un caso en la Amazonia Ecuatoriana. Ind. Data 2020, 23, 59–72. [Google Scholar] [CrossRef]
  86. Stuart, D.A. How is chocolate “Put Together”? The Confectionery Foundation: Washington, DC, USA, 2014. [Google Scholar]
  87. Wang, B.; Jin, C.; Shao, S.; Yue, Y.; Zhang, Y.; Wang, S.; Chang, R.; Zhang, H.; Zhao, J.; Li, X. Electron-deficient Cu site catalyzed acetylene hydrochlorination. Green Energy Environ. 2023, 8, 1128–1140. [Google Scholar] [CrossRef]
  88. Seufert, V.; Ramankutty, N.; Foley, J.A. Comparing the yields of organic and conventional agriculture. Nature 2012, 485, 229–232. [Google Scholar] [CrossRef]
  89. Muller, A.; Schader, C.; El-Hage Scialabba, N.; Brüggemann, J.; Isensee, A.; Erb, K.H.; Smith, P.; Klocke, P.; Leiber, F.; Stolze, M.; et al. Strategies for feeding the world more sustainably with organic agriculture. Nat. Commun. 2017, 8, 1290. [Google Scholar] [CrossRef]
  90. Póo, J.M.R. Indicadores de la Agenda 2030 para el Desarrollo Sostenible; Instituto Nacional de Estadística: Madrid, Spain, 2021. [Google Scholar]
  91. Tapia, C. Aprovechamiento de Residuos Agroindustriales, Cascarilla de Cacao (Theobroma cacao L.) Variedad Arriba y ccn51 Para la Elaboración de una Infusión; Universidad Técnica de Ambato: Ambato, Ecuador, 2015; pp. 3–143. [Google Scholar]
  92. Sarbu, I.; Csutak, O. The microbiology of cocoa fermentation. Sci. Beverages 2019, 8, 423–446. [Google Scholar] [CrossRef]
Figure 1. The system boundaries of the LCA of 1 kg of chocolate bar considered in this research and respective Upstream, Core and Downstream division and regional distribution.
Sustainability 16 00493 g001
Figure 2. Environmental impact categories in each phase have been shown in chronological phases of chocolate production: GWP, TE, ENVF, WF and EF.
Sustainability 16 00493 g002
Figure 3. Summary of reduction in impact values during the whole life cycle when shifting from CA (Scenario1) to OA&FT (Scenario 2) in the five impact categories analysed, for all the production and distribution phases.
Sustainability 16 00493 g003
Table 2. Literature review on the Global Warming Potential (GWP) and Terrestrial Ecotoxicity (TE) of Organic Agriculture and Conventional cocoa and chocolate production.
GWP Impacts for 1 kg of Cocoa in Different Stages
SourceRegionOrganic/
Conventional
FormatGWP
kg CO2-eq
Dif.
GWP
(%)
TE
kg 1,4 DCB-eq
Ivanova et al. [34]PeruConventionalDry beans0.17+82%
Organic0.93
Nguyen-Duy et al. [35]IndonesiaConventionalDry beans4.79
Romero et al. [36]PeruConventionalDry beans0.19+78%
Organic0.87
Boeckx et al. [37]WorldConventionalDry beans1.7–3.9
Chocolate (40%)0.7–1.6
Recanati et al. [38]WorldOrganicItalian dark chocolate2.62
Konstantas et al. [39]UKConventionalChocolates in bag4.15 0.03
Moulded chocolate3.39 0.03
Chocolate countlines2.91 0.02
Schroth et al. [40]BrazilConventionalDry beans0.25
Ortiz-Rodríguez et al. [41]ColombiaConventionalDry beans0.8
Pérez Neira, [42]EcuadorConventionalPure chocolate (100%)2.49
Neale [43]WorldConventionalChocolate
LCA
0.36 0.00638
Ecoinvent v39.1 [44,45]WorldConventionalDry beans1.184 0.01524
Boakye-Yiadom et al. [46]GhanaConventionalExtra-dark chocolate1.61 0.00035
Flavoured milk chocolate4.21 0.00027
Pérez-Neira et al. [47]EcuadorConventionalDark chocolate (100%)4.66−56%0.0215
Organic2.040.0045
Armengot et al. [48]WorldConventionalDry beans3.740−58%0.0314
Organic1.5600.0075
Miah et al. [49]WorldConventionalDark chocolate6.76−68%
Organic2.16
AVERAGE
(Dry beans)
Conventional 1.741−36%0.023
Organic1.120.008
AVERAGE
(Dark chocolate)
Conventional 3.88−59%0.009
Organic2.2730.005 (−44%)
TYPICAL DEVIATION
(Dry beans)
Conventional 1.801
(103.4%)
0.011
Organic0.382
(34.1%)
-
TYPICAL DEVIATION
(Dark chocolate)
Conventional 2.308
(59.5%)
-
Organic0.306
(13.5%)
-
Table 3. Literature review in Environmental Footprint of Land Use (ENVF Land Use) for the Organic and Conventional chocolate production.
Cocoa in Different Stages (1 kg)
SourceRegionOrganic/
Conventional
FormatENVF
Land Use
m2a Crop-eq
Dif.
(%)
Parra-Paitan & Verburg [50]GhanaConventionalDry beans needed for 1 kg of chocolate49.14+21%
Organic59.67
Miah et al. [49]WorldOrganicDark chocolate4.09
Pérez-Neira et al. [47]EcuadorConventionalDark chocolate63.10−65%
Organic22.10
AVERAGE
(1 kg chocolate)
Conventional 56.12−49%
Organic28.62
TYPICAL DEVIATION
(1 kg chocolate)
Conventional 9.87
(17.59%)
Organic28.36
(99.09%)
Table 4. Literature review in environmental Water Footprint (WF) for the Organic Agriculture and Conventional chocolate production.
Cocoa in Different Stages (1 kg)
SourceRegionOrganic/
Conventional
FormatWF
m3
Dif.
(%)
Félix Olegário et al. [55]BrazilConventionalDry beans needed for 1 kg of chocolate1135.09
Armengot et al. [48]WorldConventionalDry beans needed for 1 kg of chocolate271.46+17%
Organic328.78
Miglietta et al. [54]ItalyOrganicDry beans needed for 1 kg of chocolate78.18
Bulsink et al. [56]IndonesiaConventionalDry beans needed for 1 kg of chocolate28.24
Van Oel et al. [53]NetherlandsConventionalDry beans needed for 1 kg of chocolate10.45
Mekonnen & Hoekstra, 2011 [52]WorldConventionalChocolate17.19
Ortiz-Rodríguez et al. [51]WorldConventionalChocolate0.6
Miah et al. [49]WorldOrganicDark chocolate1.02
AVERAGE
(1 kg chocolate)
Conventional 243.83−44%
Organic135.99
TYPICAL DEVIATION
(1 kg chocolate)
Conventional 448.68
(184%)
Organic171.38
(126%)
Table 5. Literature review on environmental Energy Footprint (EF) for Organic Agriculture and Conventional chocolate production.
Cocoa in Different Stages (1 kg)
SourceRegionOrganic/
Conventional
FormatEF
MJ-eq
Dif.
(%)
Recanati et al. [38]WorldConventionalDark chocolate33.71
Pérez-Neira et al. [47]EcuadorConventionalDark chocolate11.20+22%
Organic14.40
Boakye-Yiadom et al., [46]GhanaConventionalExtra-dark chocolate144
Armengot et al. [48]WorldConventionalDry beans needed for 1 kg of chocolate169.53−67%
Organic55.80
Dianawati et al. [57]IndonesiaConventionalDark chocolate323.67
AVERAGE
(1 kg chocolate)
Conventional 89.61−61%
Organic35.1
TYPICAL DEVIATION
(1 kg chocolate)
Conventional 78.78
(87.9%)
Organic29.27
(83.4%)
Table 10. Global Warming Potential (GWP) and Terrestrial Ecotoxicity (TE) for the 4.73 kg of CA or OA&FT chocolate consumed by an inhabitant of the Basque Country annually.
Chocolate Consumption in the Basque Country
4.73 kg·Person−1·Year−1
GWP
kg CO2-eq
TE
kg 1,4-DCB
CA Chocolate (72% cocoa)37.90513.87
OA&FT Chocolate 72% (72% cocoa)15.9564.85
Avoided emissions21.95449.02
Reductions−57.32%−87.38%
Total impacts in the Basque Country8.4 × 103
Relative decrease from national emissions per capita and year−0.26%
Disclaimer/Publisher’s Note: The statements, opinions and data contained in all publications are solely those of the individual author(s) and contributor(s) and not of MDPI and/or the editor(s). MDPI and/or the editor(s) disclaim responsibility for any injury to people or property resulting from any ideas, methods, instructions or products referred to in the content.

