Abstract
This study examines the dynamic relationships between digitalization, environmental tax revenues, and energy resource capacity within the framework of the Environmental Kuznets Curve (EKC), focusing on their combined impact on environmental quality. It employs a cross-sectional augmented autoregressive distributed lag (CS-ARDL) approach, an advanced technique for complex panel data that is specifically designed to address issues of cross-sectional dependence and slope heterogeneity inherent in panel data analysis. The research covers 88 countries, including both low- and middle-income countries (LMICs) and high-income countries (HICs), to understand how digitalization, as a driving force of the Fourth Industrial Revolution, interacts with environmental taxation and energy resource management to affect greenhouse gas emissions. The results reveal distinct effects of environmental taxes and energy capacity on environmental quality, with marked differences between LMICs and HICs. In HICs, technological progress, especially in information and communication technology (ICT), is found to contribute significantly to environmental quality. For LMICs, the effects are less evident, and the findings suggest the need for tailored strategies in environmental policy and energy management. By providing empirical evidence on the differential impacts of digitalization and energy policies in different economic contexts, this research enriches the environmental economics discourse. It highlights the need for policy frameworks tailored to specific contexts that effectively balance economic growth with sustainable development goals, thereby providing insightful implications for achieving the Sustainable Development Goals (SDGs).
1. Introduction
The current environmental landscape is increasingly characterized by escalating global greenhouse gas (GHG) emissions, posing serious challenges to both ecological and human systems. This escalation includes pressing issues such as threats to food security, loss of biodiversity, and an increase in the frequency and intensity of extreme weather events. In response to these challenges, initiatives by the international community, most notably the 2015 Paris Agreement and the United Nations Sustainable Development Goals (SDGs), underscore the urgency of addressing these environmental threats. The Paris Agreement [1], with its goal of significantly reducing global greenhouse gas emissions, aims to limit global temperature rise to 2 °C, with a more ambitious goal of 1.5 °C, in line with the targets of SDG 13 (Climate Action). This is complemented by other SDGs, particularly SDG 7 (Affordable and Clean Energy) and SDG 12 (Responsible Consumption and Production), which advocate an integrated approach to environmental protection [2].
In the broader field of economic and environmental interactions, the Environmental Kuznets Curve (EKC) hypothesis, originally proposed by Grossman and Krueger [3], stands out as a fundamental theoretical construct. It posits an inverted U-shaped relationship between economic growth and environmental degradation, with a particular emphasis on greenhouse gas emissions. However, the EKC hypothesis has been criticized for potentially oversimplifying the complex interplay between economic progress and environmental impacts. This has led to calls for an expanded model that incorporates a wider range of socio-economic and technological factors [4].
Digitalization, a defining feature of the fourth industrial revolution [5], brings with it a range of environmental impacts. These include not only direct effects related to energy consumption in the production of information and communication technology (ICT) but also indirect effects resulting from the widespread use of ICT. Specifically, increased energy efficiency may inadvertently lead to higher overall energy consumption due to rebound effects [6,7,8,9]. As digital technologies increasingly permeate different sectors, their impact on environmental sustainability, particularly in the context of SDG 9 (Industry, Innovation and Infrastructure), becomes more pronounced.
Furthermore, rethinking the EKC framework requires incorporating aspects such as energy resource capacity and environmental fiscal policies, especially environmental taxation. These factors are essential for the achievement of the SDGs, which focus on clean energy and responsible consumption and play an important role in driving environmental sustainability outcomes [10]. However, the dynamics between these variables, especially in relation to technological advances and fiscal mechanisms, remain under-explored in the existing literature.
This research seeks to extend the EKC hypothesis by incorporating the influences of digitalization, energy resource capacity, and environmental taxation. Using advanced econometric techniques tailored for complex panel data, the study aims to construct a robust empirical model that evaluates the collective impact of these factors on environmental quality in different economic contexts. Our investigation includes a holistic analysis of the impact of these factors on environmental quality, their distributional implications across countries with different income levels, and the formulation of policy frameworks aimed at reconciling economic growth with environmental sustainability in line with the SDGs.
By providing fresh theoretical insights and empirical evidence, this research is positioned to make significant contributions to academic discourse and policymaking. The following sections of the paper elaborate on the theoretical framework, explain the research methods used, present the empirical findings, and discuss their implications for policy, with a particular focus on achieving the SDGs. Ultimately, this study responds to the critical need to reassess existing environmental policy paradigms, especially in light of the evolving global economic and environmental landscape.
2. Theoretical Background and Literature Review
2.1. Economic Development and Environmental Quality
The principle of sustainable development, institutionalized by the Brundtland Commission in 1987 [11], serves as a basic framework for balancing immediate societal needs with long-term environmental sustainability. This framework is further complemented by the EKC, first developed by Grossman and Krueger [3], which describes an inverted U-shaped relationship between economic growth and environmental degradation. Stern [12] enriches this model by integrating behavioral aspects, positing that rising income levels generate increased societal demand for environmental quality, thereby mitigating the negative environmental consequences of economic growth.
Recent empirical contributions offer nuanced refinements of these basic theories. Shokoohi et al. [13] validate the EKC framework by adding energy intensity as an influential variable, particularly in populous Middle Eastern countries. Their results confirm the critical role of energy intensity in determining environmental quality. Similarly, Kostakis and Arauzo-Carod [14] extend the range of environmental metrics by focusing on specific components of the ecological footprint in economically advanced countries. Agbanyo et al. [15] used a behavioral economics approach based on the concept of Yin-Yang cognitive harmony to elucidate the complex interplay between economic growth, energy consumption, and greenhouse gas emissions. Furthermore, Hashmi et al. [16] examined the EKC hypothesis in the context of climate policy uncertainty, highlighting the role of sector-specific variables such as ICT and taxation.
The SDGs, announced by the United Nations in 2015 [2], expand the existing framework by integrating additional dimensions such as social equity, institutional governance, and technological innovation. Within this expanded paradigm, Mpofu [17] explores the dual utility of green taxes for both fiscal and environmental management. Dam et al. [18] emphasize the governance dimension by examining the role of institutional quality in environmental sustainability. Olabi et al. [10] introduce technological innovation as a critical factor by analyzing the potential of green hydrogen to meet multiple SDGs. Regional studies, such as the work of Adjei et al. [19], examine the environmental impact of human capital and trade openness in West Africa, advocating for region-specific “green growth” strategies. Ullah et al. [20] highlight the central role of environmentally oriented ICT innovations, especially in the economies of the G-7 countries.
Emerging paradigms such as green growth and circular economy are receiving increasing scholarly attention for their potential to decouple economic growth from environmental degradation. An empirical study by Hailemariam and Erdiaw-Kwasie [21] demonstrates the effectiveness of circular economy strategies in reducing CO2 emissions in European countries. Yang et al. [22] extend this discourse by exploring the broader applicability of circular economy principles to environmental challenges. The Environmental Performance Index (EPI) used by Stoian et al. [23] remains a valuable empirical tool for quantifying national environmental performance, showing a positive correlation with GDP per capita, albeit with significant outliers.
2.2. Environmental Taxation, Fiscal Mechanisms, and Environmental Quality
The discourse on environmental taxation and fiscal mechanisms as instruments for environmental quality is rich in both theoretical frameworks and empirical studies. Starting with principles such as Pigou’s “polluter pays principle” [24] and the Coase theorem [25], the debate extends to the multipurpose functionality of environmental taxes, particularly through the lens of the double dividend hypothesis. As first outlined by Pearce [26] and further refined by Lans Bovenberg and Smulders [27], Lans Bovenberg and de Mooij [28], Fullerton and Metcalf [29], and Schöb [30], this hypothesis advocates the use of tax revenues to neutralize other distortionary taxes, thereby improving both environmental and economic outcomes. Empirical validation has been provided by studies including Alola and Nwulu [31], Wolde-Rufael and Mulat-weldemeskel [32], and Li et al. [33], which confirm the effectiveness of these fiscal mechanisms but make clear that success depends on specific regional or sectoral conditions.
The intersection of environmental taxation and technological innovation is another area that has received considerable academic attention. Empirical evidence on the positive impact of higher environmental taxes on the adoption of green technologies is provided by Karmaker et al. [34] and Guo et al. [35]. These studies pay particular attention to how resource-rich cities transition to cleaner technologies under the influence of targeted taxation. However, the effectiveness of environmental regulations in promoting innovation is debated, with contributions based on the Porter hypothesis [36] suggesting that such regulations may induce enough innovation to outweigh compliance costs. Zhong et al. [37] add nuance to this discourse by showing that the impact is sector-specific and depends on the level of pollution. Rubashkina et al. [38] further extend the debate by cautioning that while taxes may facilitate incremental changes in green technology, they do not necessarily guarantee transformative changes in productivity or sustainability.
An assessment of the regional effectiveness of environmental taxes shows mixed results. For example, the study by Alola and Nwulu [31] on the Nordic countries presents energy taxation as an effective tool for reducing emissions and saving energy but also notes that this success is not uniform across the region, being most effective in Finland and Sweden. Furthermore, Wolde-Rufael and Mulat-weldemeskel [32] confirm the effectiveness of environmental taxes in reducing CO2 emissions in a European context. On the other hand, market-based approaches such as energy-consumption right trading (ECRT) have shown promising results in China, especially among high-carbon emitting and non-state-owned enterprises [39]. The picture becomes even more complex when considering the experience of African economies. Degirmenci and Aydin [40] warn that the application of the double dividend hypothesis may be less straightforward in such contexts, pointing to cases where environmental taxes have exacerbated problems of unemployment and environmental degradation.
Another dimension of the discourse concerns the challenges of implementing environmental taxes, particularly in developing countries. Timilsina et al. [41] offer a computational general equilibrium analysis of the potential benefits of carbon taxation in developing countries such as Côte d’Ivoire. Mpofu [17] discusses the uphill battle faced by developing countries hampered by immature regulatory frameworks and economic vulnerabilities. In contrast, Rafique et al. [42] find that developed countries have a better apparatus for implementing and enforcing environmental taxes due to their advanced regulatory and economic structures. In addition, some empirical research argues for adaptively structured environmental taxes that can be tailored to the specific characteristics of a region or sector. In this regard, Ahmad and Satrovic [43], Liu et al. [44], and Shayanmehr et al. [45] present models in which tax structures are not uniform but differentiated based on a variety of local factors, potentially increasing their effectiveness.
Despite the promise of environmental taxes, their use has been criticized. Some studies highlight the inconsistent and sometimes counterproductive results of such taxes. Doğan et al. [46], King et al. [47], and Özmen et al. [48] provide empirical counterevidence that challenges the assumption that environmental taxes automatically lead to positive outcomes. Similarly, Tan et al. [49] provide an overview of the implementation of environmental taxes and suggest that the effectiveness of such measures depends on a variety of factors, including legislation, institutional design, and public awareness. These contributions call for a more complex approach to tax design that considers regional and sectoral conditions, as well as the possibility of unintended consequences, such as the increase in emissions or energy intensity identified by Hájek et al. [50] and Silajdzic and Mehic [51].
In light of this rich and complex literature, a nuanced, multidimensional strategy becomes essential for the effective implementation of environmental tax systems. These systems should be carefully designed to account for a wide range of factors, from levels of economic development and institutional integrity to sector-specific nuances and technological capabilities. This strategy must also consider the significant role of multinational corporations (MNCs) in both the economic and environmental spheres. The analysis of Vecellio Segate [52] highlights the contribution of MNCs to environmental degradation through their global operations and tax avoidance strategies. This finding calls for a new approach to measuring environmental externalities, one that transcends national boundaries and focuses on the transnational impacts of corporate activities. In addition, Weisbach’s [53] review examines the international system for taxing corporate profits, particularly in the context of corporate tax planning strategies such as the OECD’s Base Erosion and Profit Shifting (BEPS) 2.0. This review underscores the urgency of comprehensive reforms aimed at curbing base erosion and profit-shifting practices by MNCs. These reforms, which have become increasingly prominent in international tax policy debates, represent a critical step towards a fairer and more effective global tax framework that is consistent with broader goals of environmental and economic justice.
Empirical evidence suggests that fiscal measures targeting environmental quality are not isolated but are influenced by a complex interplay of economic, institutional, and industrial factors. It is, therefore, imperative that environmental tax policies evolve in response to the diverse and interconnected nature of the global economic activities of MNCs. A comprehensive and integrated policy approach is paramount to ensure that environmental taxes are appropriately targeted to make a meaningful contribution to sustainability and the pursuit of global economic justice.
2.3. Energy Resource Capacity and Environmental Quality
The relationship between energy resource capacity and environmental quality has become a highly nuanced and complex issue involving perspectives from both developed and developing countries. While the consumption of fossil fuels remains a significant contributor to environmental degradation, the adoption of renewable energy forms a counterpoint to this trend. Focusing on low-income countries, Ehigiamusoe and Dogan [54] show that the effectiveness of renewable energy in mitigating emissions depends on the level of real income. In the context of developed East Asian economies, Li et al. [55] find that the adoption of green energy significantly reduces carbon dioxide emissions, particularly in China and Japan. Sun et al. [56] provide evidence from the BRICS countries, a group that includes both developed and developing countries. Their results suggest that renewable energy and economic complexity interact to mitigate emissions, especially at high levels of emissions. Thus, the role of energy resource capacity in environmental quality manifests itself differently in developed and developing countries, influenced by factors related to income levels and economic complexity.
Beyond the focus on renewable energy sources in different regions, it is equally important to examine the role of energy efficiency in determining energy resource capacity and environmental quality. The complexity of this relationship requires a multidimensional analytical approach. For example, Lei et al. [57], focusing on Asian economies, and Berner et al. [7], emphasizing the European context, have pointed to the positive impact of energy efficiency in reducing GHG emissions. Conversely, Saunders [58], whose research focuses on the United States, introduced the concept of the “rebound effect”, suggesting that improvements in energy efficiency may paradoxically lead to an increase in overall energy consumption. Amjadi et al. [6], who study countries in the Middle East, provide further support for this effect, adding a layer of complexity to the energy efficiency debate. In addition, Khan et al. [59], using data from Morocco, highlight the role of governance mechanisms in influencing the relationship between energy efficiency and carbon emissions. Omondi et al. [9], focusing on the African country of Kenya, present economy-wide analyses showing partial rebound effects in energy and carbon savings despite efficiency initiatives. Adding another dimension to this complex discourse, Jahanger et al. [8] provide insights into the top ten manufacturing countries and find that energy efficiency and renewable energy are effective in mitigating GHG emissions, especially when integrated with technological advances in the manufacturing sector. Thus, while energy efficiency remains a promising avenue for increasing energy resource capacity and mitigating environmental degradation, its role is nuanced and varies depending on the regional context. Empirical evidence thus supports the need for a multipronged policy approach, tailored to specific regional needs and integrated with other strategic policies and governance structures, to achieve the twin goals of sustainable development and environmental quality.
Another lens through which to assess the relationship between energy resource capacity and environmental quality is depletion accounting. This principle, rooted in ecological economics, advocates for comprehensive accounting of natural resource use and environmental degradation in economic valuations [60]. Gyamfi et al. [61] extend this principle by integrating depletion accounting into macroeconomic models and demonstrate its utility for analyzing the complexities of sustainable economic development in the G7 economies. Developed countries represent a particular context in which the correlation between energy resource capacity and environmental quality appears to be positive. These economically affluent societies have the financial means to invest in cleaner technologies and modernized infrastructure. Rubashkina et al. [38] provide empirical support for this view, showing that developed countries with strict environmental regulations have experienced significant progress in green innovation, as posited by the Porter hypothesis [36]. In contrast, developing countries often experience negative impacts on their environmental quality, generally due to their energy resource capacity. In this context, the Pollution Haven Hypothesis serves as a theoretical framework, which posits that firms may relocate pollution-intensive activities to countries with lax environmental regulations [62]. Furthermore, Wu et al. [63] examined the BRICS countries and found that natural resource volatility has a significant impact on both economic performance and environmental quality.
Thus, the observed disparities in environmental quality between developed and developing countries are primarily due to differences in technological capabilities, the effectiveness of institutional frameworks, and policy orientation. While developed countries are increasingly aligning their energy strategies with sustainable development, developing countries face challenges that often lead to environmental degradation.
2.4. Digitalization and Environmental Quality
The nexus between digitalization, mainly mediated by ICT, and environmental quality is a complex, multidimensional matrix influenced by a wide range of variables. These variables extend beyond purely technological factors to include economic development, technological maturity, policy frameworks, and temporal considerations, all of which contribute to the multidimensionality of this relationship.
In the context of economically developed countries, there is a convergence of advanced ICT infrastructure, robust policy frameworks, and high levels of public awareness, all of which contribute synergistically to favorable environmental outcomes. Recent empirical evidence reinforces this synthesis and draws attention to the role of emerging technologies such as data analytics, smart grids, and energy management systems in improving the environment [64,65]. Subsequent advances in Internet of Energy (IoE) and blockchain technologies are proving to be critical for energy optimization, leading to significant reductions in GHG emissions [66,67]. These innovations, when integrated with artificial intelligence (AI) and the Internet of Things (IoT), significantly improve the operational efficiency of smart grids, highlighting the importance of technological synergies in environmental protection [68]. These findings are consistent with those of Huang et al. [69], who point out that developed economies, represented by the G-7 countries, generally experience improvements in environmental quality that can be attributed to ICT and other variables.
Developing economies demarcate a more diverse landscape, where the prospects for digitalization to influence environmental quality are hampered by infrastructural inadequacies that encompass both hardware and software elements [70]. Empirical studies focusing on sub-Saharan Africa suggest a positive but statistically insignificant relationship between ICT and environmental quality [71]. Comprehensive analyses, including data from 77 developing countries, present a multifaceted picture in which the positive effects of ICT on reducing CO2 emissions are offset by other mediating variables such as globalization and financial development [72]. This complex relationship is further supported by subsequent studies showing how financial development and economic complexity can either enhance or mitigate the environmental impacts of digitalization [69,73,74,75].
Temporal variables further complicate this complex equation. Initial phases of digital infrastructure development often require increased energy inputs, resulting in transient spikes in GHG emissions [64,76]. However, this trend typically reverses as digital systems mature. Specifically, Batool et al. [73] find that in selected developing countries, the long-term effects of ICT and financial development may be detrimental to environmental quality despite insignificant short-term impacts. Across a broader spectrum that includes both developed and developing economies, renewable energy embedded in ICT infrastructures consistently has a positive impact on environmental quality [69,75].
From the compendium of recent empirical studies, it is clear that the potential for digitization to facilitate environmental improvement is complex, non-linear, and highly dependent on a number of modulating variables such as economic development, technological sophistication, and governance paradigms.
3. Data and Methodology
3.1. Data
The aim of this study is to examine the impact of information and communication technology (ICT) adoption, energy resource capacity, and environmental tax revenues on environmental quality. The analysis covers a diverse sample of 88 countries, including 50 low- and middle-income countries (LMICs) and 38 high-income countries (HICs), over the period 2000 to 2021. The choice of time period is primarily dictated by the availability of comprehensive and consistent data for all variables of interest.
The dependent variable in this analysis is per capita greenhouse gas emissions (GHG_PC), expressed in metric tons of carbon dioxide equivalent. This critical measure of environmental quality is derived from the Emissions Database for Global Atmospheric Research (EDGAR) [77]. To test the EKC (Environmental Kuznets Curve) hypothesis, we include gross domestic product per capita (GDP_PC), adjusted to constant 2015 U.S. dollars, and its squared term. GDP data are obtained from the Organization for Economic Cooperation and Development (OECD) database [78].
In addition, we consider environmentally related tax revenue (ERTR) as a percentage of GDP. This indicator represents the fiscal dimension of environmental policies and is also obtained from the OECD database [78]. The study also integrates the ICT Capacity Index (ICT_CI) and the Energy Capacity Index (ECI) to measure the breadth and efficiency of ICT infrastructure and energy resources, respectively. These indices are derived from the Productive Capacities Index of the United Nations Conference on Trade and Development (UNCTAD) [79].
Table 1 provides an overview of the variable definitions, data sources and their statistical characteristics. A preliminary statistical analysis was conducted to validate the normal distribution of the variables and the absence of outliers, thus confirming the suitability of the dataset for our subsequent econometric analysis.

Table 1.
Variable definitions and descriptive statistics.
The comparative analysis of mean values across five key variables in LMICs and HICs, as illustrated in the set of graphs in Figure 1, sheds light on the stark contrasts in their environmental and economic contexts. These graphs collectively underscore significant disparities across various indicators, enriching our understanding of the challenges and capacities within these distinct groups. The GHG_PC graph shows significantly higher levels in HICs. This difference likely reflects their more intensive industrial activities and elevated energy consumption. In contrast, the graph for GDP_PC aligns with this trend, showing that HICs possess more developed economies and are capable of advanced environmental management but also potentially contribute to substantial environmental externalities. Furthermore, the ERTR graph as a percentage of GDP is markedly higher in HICs, suggesting their more extensive application of fiscal mechanisms in environmental policies. This pattern is mirrored in the ECI and ICT_CI graphs, which indicate that HICs enjoy more advanced energy infrastructures and greater ICT development. These elements are crucial in contemporary environmental management strategies. Each graph within Figure 1 underscores significant differences in GHG emissions, ERTR, and energy and ICT capacities between LMICs and HICs. These disparities point to the complexity of environmental issues and the role of various economic and technological factors. The higher GHG emissions and ERTR in HICs, coupled with their advanced energy and ICT capacities, signal the need for environmental strategies that are not only region-specific but also adaptable to the shifting global economic and technological landscape. These graphically represented data suggest the necessity of a more in-depth exploration to fully comprehend the underlying dynamics and factors influencing environmental outcomes in these diverse economic contexts. Such an analysis is vital for developing informed and effective policy interventions tailored to the unique needs and capabilities of LMICs and HICs.
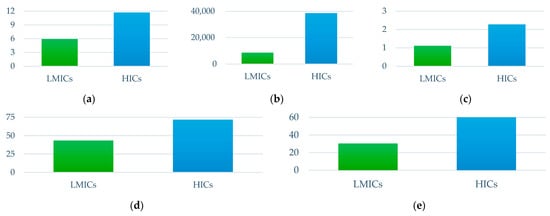
Figure 1.
Comparative analysis of mean values for key variables in LMICs and HICs. (a) Greenhouse gas emissions per capita (GHG_PC); (b) gross domestic product per capita (GDP_PC); (c) environmentally related tax revenue (ERTR) as a percentage of GDP; (d) Energy Capacity Index (ECI); (e) ICT Capacity Index (ICT_CI).
3.2. Analytical Methods
3.2.1. Cross-Sectional Dependence Tests
The dynamics of economic and financial variables often reveal complex interrelationships that are best understood through the lens of cross-sectional dependence (CSD). In the context of CSD, weak dependence typically results from localized economic activity or shocks that are confined to specific sectors of the economy. Conversely, strong dependence arises when economic shocks are more widespread and affect multiple sectors simultaneously. Such shocks can be triggered by a variety of factors, including, but not limited to, fluctuations in demand, changes in macroeconomic policies, or different regulatory frameworks across countries. Further complexity arises from the intrinsic economic interdependencies, the presence of externalities, and the macro-level interconnectedness of economies across geographic boundaries. Neglecting the implications of CSD can lead to significant biases, particularly when latent variables that are not observable in the model interact with explanatory variables, thereby contaminating the integrity of the econometric model.
Given the critical role of CSD in robust statistical inference, the first step in the econometric analysis focuses on identifying its presence or absence. Accurate detection of CSD is essential for the validation of subsequent statistical procedures, including unit root tests, cointegration analysis, and long-run equilibrium relationships. The gravity of overlooking CSD, as pointed out by Westerlund and Edgerton [80] and Sharif et al. [81], cannot be overemphasized, given its potential to produce spurious results and misleading interpretations.
To address this critical issue, the current study employs the CD test as described by Pesaran [82,83] as well as the CDw+ test developed by Fan et al. [84]. The mathematical formulation of the CD test is expressed as follows:
Here, T refers to the number of cross-sectional observations, denotes the correlation residuals derived from the regression model, and N represents the length of the time dimension of the panel data.
Regarding the CDw+ test of Fan et al. [84], it is formulated as follows:
where represents the cross-sectional correlation estimator, and the average weights of individual-specific covariances, and and the vectors of idiosyncratic error terms.
3.2.2. Slope Homogeneity Tests
After verifying the CSD in the panel data, the study proceeds to the second step, which aims to investigate the issue of slope homogeneity within the panel data. The presence of slope heterogeneity can distort the subsequent econometric results, making this step necessary. For this purpose, the study employs the Pesaran and Yamagata [85] test, an extension of the original test developed by Swamy [86]. This test considers a null hypothesis of slope homogeneity and an alternative hypothesis of slope heterogeneity. Two specific statistics, delta () and adjusted delta (), are computed to test these hypotheses. Mathematically, these statistics are expressed as:
In these equations, N is the number of cross-sectional units, T is the time dimension, k is the number of independent variables, and is the modified Swamy [86] test statistic. The Pesaran and Yamagata [85] test provides robust performance, especially when the time dimension T exceeds the number of cross-sectional units N. In addition, the test accounts for the residual CSD, which underscores its reliability, as confirmed by Bersvendsen and Ditzen [87].
3.2.3. Panel Unit Root Tests
The third analytical step of the study addresses the issue of non-stationarity in the panel data, especially when cross-sectional dependencies are prevalent. Given the inherent limitations of conventional first-generation unit root tests under CSD conditions, the current study opts for second-generation unit root tests for a more nuanced analysis. Specifically, two tests are employed: the Cross-sectionally Augmented Dickey-Fuller (CADF) test and the Cross-sectionally Augmented Im, Pesaran and Shin (CIPS) test introduced by Pesaran [88]. The CADF test is expressed by the following equation:
In this equation, symbolizes the difference operator, and denote the cross-sectional averages of lagged levels and first differences, respectively, and is the error term.
The CIPS statistics are then computed based on the individual CADF statistics for each panel unit. This is formalized as:
where T is the number of cross-sections and N is the sample size in terms of periods.
In addition, the study employs the sequential unit root tests at unknown breakpoints proposed by Ditzen et al. [89] to identify multiple structural breaks in the time series. This step reinforces the robustness of the non-stationarity assessment, especially when the series is subject to unobservable shocks or regime changes. It allows the analysis to better adapt to the complexities introduced by the CSD and thus improves the overall integrity of the time series analysis.
3.2.4. Panel Cointegration Tests
The fourth step of the analysis involves the use of panel cointegration tests to identify the long-run relationships among the variables under study. Cointegration refers to the statistical equilibrium that long-run variables tend to achieve even when they are individually non-stationary. This step becomes meaningful when panel stationarity is confirmed, a prerequisite for robust cointegration analysis. To this end, we implement Westerlund’s [90] test for panel cointegration, which controls for both slope heterogeneity and cross-sectional dependence within the panel. The empirical literature supports the effectiveness of this method in dealing with CSD issues and in producing reliable long-run estimates between panel series. The Westerlund [90] test uses the following equation to determine the relationship between variables:
In this equation, and denote the first differences of the dependent and independent variables, respectively, while represents the error term.
The test includes two categories of statistics. Group mean statistics (Gτ and Gα) assess cointegration when one or more components are involved. Panel statistics (Pτ and Pα), on the other hand, examine cointegration across all cross-sectional units. The computation of the test statistics is expressed as follows:
For large samples:
For small samples:
When the variables are found to be cointegrated, this study uses the Cross-Sectional-Augmented Autoregressive Distributed Lag (CS-ARDL) model, as developed by Chudik and Pesaran [91], to further explore the short-run and long-run relationships between the variables.
3.2.5. Estimation of Short-Run and Long-Run Elasticities
The fifth analytical step of our study is to estimate both short-run and long-run elasticities, which is necessary after establishing long-run cointegration among the variables. For this purpose, we employ the Cross-Sectional Augmented Autoregressive Distributed Lag (CS-ARDL) model. This model is particularly suitable for our panel data, which are characterized by cross-sectional dependence (CSD). CS-ARDL is adept at dealing with several complex issues commonly associated with panel data, including cross-sectional dependence, endogeneity, heteroskedasticity, multicollinearity, omitted variable bias, and dynamic panel bias. Such capabilities of the CS-ARDL model make it a reliable and robust choice for analyzing complex datasets, as supported by the existing empirical literature [81,92,93,94,95]. Furthermore, the CS-ARDL model is known for its ability to provide trustworthy impact parameters, thus effectively addressing the many challenges typical of panel data analysis, as highlighted by Chudik and Pesaran [91].
To further validate the robustness of our CS-ARDL estimates, we also include alternative methods: the Dynamic Common Correlated Effects Mean Group (DCCEMG) estimator and the Augmented Mean Group (AMG) estimator. The DCCEMG estimator, introduced by Chudik and Pesaran [96], and the AMG estimator, developed by Eberhardt and Teal [97], offer unique advantages. These include their ability to address identification problems that are often obscured by temporal variations in the data. Both DCCEMG and AMG are effective in dealing with heterogeneity across slopes and in mitigating spillover effects arising from cross-sectional dependencies. They do this by averaging the effects of determinants across all cross-sectional units, thereby neutralizing the negative effects of cross-sectional dependencies. In addition, these methods are flexible enough to account for structural breaks and year-specific effects, which is essential in addition to dealing with CSD and heterogeneity in our analysis.
3.3. Model Specification
Building on the theoretical foundations of the EKC and informed by studies such as those of Dahmani et al. [98,99], Hashmi et al. [16], Islam and Rahaman [70], Pata et al. [100], and Saqib et al. [101], the current study constructs an analytical framework specifically tailored to its research objectives. This framework is articulated through a governing equation designed to capture the relationship between GHG emissions and a selection of economic and policy variables and is presented as follows:
The econometric specification of the equation is formalized as:
In this configuration, the indices i and t denote countries and time intervals, respectively. The symbol denotes the stochastic error term. The coefficients , , , , , and are parameters quantifying the constant term and the influence of GDP per capita, the square of GDP per capita, environmentally related tax revenue, the energy capacity index, and the ICT capacity index. Validation of the EKC framework would require a statistically significant and positive and a statistically significant and negative , indicating an inverted U-shaped relationship between GHG emissions and economic development.
To extend the model’s ability to incorporate temporal dynamics and cross-sectional dependencies, a cross-sectional augmented autoregressive distributed lag approach is integrated. The transformed equation is presented as:
In this extended formulation, the dependent variable remains the focal metric of environmental quality. The vector encapsulates the core independent variables. Temporal lags are included through the coefficients and . An additional term, , is included to control for CSD.
The model architecture is designed to provide a nuanced understanding of the variables under consideration. It incorporates both static and dynamic coefficients to control for time-invariant and time-varying effects. Furthermore, the model accounts for cross-sectional dependencies, which is critical for data that exhibit interconnectedness across entities. This level of detail not only enhances the robustness of the model but also allows for a more comprehensive exploration of the economic and environmental paradigms it seeks to investigate.
4. Results and Discussion
4.1. Outcomes of CSD and Slope Homogeneity Tests
The first stage of the analytical procedure involved an examination of the CSD among the preselected variables. Using the CD and CDw+ tests developed by Pesaran [82,83] and Fan et al. [84], respectively, the study found conclusive evidence against the null hypothesis of weak CSD at the 1% significance level for all variables. An exception was found for ERTR in the context of LMICs, which indicated a rejection of the null hypothesis at a 5% significance level according to the CD test. These results were confirmed in both panels, including LMICs and HICs, as shown in Table 2. The empirical evidence thus suggests that shocks to one economy within a panel are likely to spill over to other economies in the same panel. This implies that any econometric analysis using panel data should control for the potential correlation between cross-sectional units to ensure the accuracy and reliability of the estimates.
Table 2.
Cross-sectional dependence analysis results.
In addition to the CSD tests, the study implemented the Pesaran and Yamagata [85] test to assess the homogeneity of the slopes across panel units. The data presented in Table 3 show that both the delta () and adjusted delta () tests led to the rejection of the null hypothesis of slope homogeneity at the 1% significance level. This result was observed regardless of the economic classification of the panel, whether LMICs or HICs. The results clearly confirm the existence of slope heterogeneity within the panels studied.
Table 3.
Slope heterogeneity analysis results.
These empirical results provide conclusive support for the existence of both CSD and slope heterogeneity. Given these complexities, it is evident that the use of second-generation unit root tests, cointegration tests, and estimation techniques is warranted for accurate stationarity assessment, cointegration analysis, and model estimation. Furthermore, the evidence supports the notion of economic interdependence among the nations represented in each panel, thereby validating the conceptual framework of the model designed to capture these complex interrelationships.
4.2. Outcomes of the Second Generation of Panel Unit Root Tests
After identifying CSD and slope heterogeneity in the panels of LMICs and HICs, the focus shifted to examining the unit root properties of the specified variables. To operationalize this, the study used second-generation panel unit root tests, specifically the CADF and CIPS techniques. The results are systematically documented in Table 4 for both the LMICs and HICs panels. The composite inference drawn from these unit root tests shows that, with the exception of the ICT capacity index variable, all other variables remain non-stationary at their levels, categorically denoted as I(0). Conversely, these series were found to be integrated of order one, I(1). Thus, the null hypothesis H0 is decisively rejected in favor of the alternative hypothesis H1, which posits stationarity in the presence of the aforementioned CSD and slope heterogeneity. This decisive result sets the stage for the subsequent implementation of panel cointegration tests, the purpose of which is to investigate the existence of long-run equilibrium relationships among the variables.
Table 4.
Unit root test analysis results.
As a further robustness check of the results, sequential tests for multiple breaks at unknown breakpoints by Ditzen et al. [89] were additionally conducted. This test is designed to identify multiple structural breaks at unknown breakpoints. The derived statistics, reported in Table 5, show that the values of the test statistics are consistently below the Bai and Perron 1% critical values for both panels. This statistically substantiates the absence of structural breaks, mean shifts, or regime shifts, thus excluding the need for breakpoint estimation in the series.
Table 5.
Sequential test for multiple breaks at unknown breakpoints.
4.3. Results of Panel Cointegration Analysis
The prerequisite for assessing both long-run and short-run elasticities between the variables of interest is the prior verification of cointegration relationships within the panel data. In line with this requirement, the current study applied the cointegration test developed by Westerlund [90], which accounts for the existence of CSD in the datasets. The test results are presented in Table 6.
Table 6.
Westerlund [90] Panel cointegration tests.
Within the Westerlund [90] framework, four salient statistics are generated: Gτ, Gα, Pτ, and Pα. Specifically, Gτ and Gα focus on assessing cointegration relationships at the individual cross-sectional level. Conversely, Pτ and Pα are designed to collectively evaluate the panel under the null hypothesis of no cointegration. Each of these statistical measures was found to be significant at the 1% level, convincingly rejecting the null hypothesis of non-cointegration among the series under study. This robust empirical result lends credence to the existence of long-run equilibrium relationships between environmental quality and GDP_PC, ERTR, ECI, and ICT_CI in both the LMICs and HICs panels.
The confirmation of cointegration paves the way for the application of econometric models capable of handling cointegrated panel series, especially in contexts with CSD and slope heterogeneity. To this end, advanced econometric estimators, including but not limited to the AMG, DCCEMG, and CS-ARDL models, will be employed in subsequent phases of the analysis to quantify the short-run and long-run elasticities between variables.
4.4. Results of the Estimation of Short-Run and Long-Run Elasticities
Using the CS-ARDL approach, this step investigates the short-run and long-run determinants that influence environmental quality, as shown in Table 7. An initial assessment of model quality is warranted prior to the analysis of variable-specific results. The error correction term (ECT (−1)) has significant negative coefficients for both income panels, specifically −0.394 for LMICs and −0.534 for HICs. These values confirm the reliability of the models by indicating a tendency to revert to the long-run equilibrium, with HICs showing a faster tendency to revert to the long-run equilibrium, as indicated by the steeper negative coefficient. The robustness of the model is further supported by the CD statistic, which is negative but statistically insignificant for both LMICs and HICs. This lack of statistical significance confirms the absence of cross-sectional dependence and, thus, the robustness of the CS-ARDL methodology employed.
Table 7.
CS-ARDL analysis results.
Turning to the main results, economic growth emerges as a determinant of environmental degradation for both LMICs and HICs. Specifically, the long-run coefficients for GDP_PC are 0.147 for LMICs and 0.356 for HICs, confirming that economic expansion tends to increase environmental degradation. These results are consistent with those of Ahmad et al. [102] and Shah et al. [103], which show an intensified ecological footprint in the G-11 countries and increasing carbon emissions in the top 15 natural gas suppliers, respectively. The direct nexus between economic growth and GHG emissions is based on the idea that the production of goods and services in the selected economies inherently requires increased energy consumption, which subsequently leads to higher emissions. This notion is supported by the studies of Pata et al. [100] and Shokoohi et al. [13], which examined the impact of energy intensity and technology adoption on this relationship in the Middle East and four technologically advanced countries, respectively. Moreover, the empirical evidence supports the EKC hypothesis, confirming the framework of Grossman and Krueger [3] and Stern [12]. This hypothesis proposes an initial worsening of environmental quality, followed by an improvement as economies mature. The empirical alignment with the EKC hypothesis is further supported by studies by Jahanger et al. [8], Saqib et al. [101], Dahmani [104], and Youssef et al. [105], all of which confirm similar trends in major manufacturing economies, the United States, and European Economic Area countries, respectively.
Looking at the coefficients for LMICs and HICs in both the short and long run, LMICs have relatively lower coefficients, indicating their nascent stage in the EKC. This observation is congruent with Islam and Rahaman [70], who found the Gulf Cooperation Council countries to be similarly positioned in their EKC trajectory. Conversely, the elevated coefficients for the HICs suggest that these nations are likely approaching the turning point in their EKC, where societal pressure for improved environmental quality gains traction. Thus, the temporal elasticity estimates confirm that economic growth and environmental quality are interrelated in a complex, non-linear manner that evolves over time.
The analysis of the ERTR shows a contrasting impact on environmental quality between LMICs and HICs. In LMICs, the ERTR coefficient is −0.073, indicating a marginally significant negative impact in the long run, but appears to be insignificant in the short run. This pattern suggests that the effectiveness of the ERTR may be limited in these regions, possibly due to underdeveloped regulatory frameworks and economic constraints, as discussed by Rafique et al. [42] and Timilsina et al. [41]. Conversely, in HICs, the ERTR coefficients (−0.242 in the long run; −0.152 in the short run) are more robust, indicating the effectiveness of environmental taxation in these environments. This difference is in line with the findings of Alola and Nwulu [31] and Wolde-Rufael and Mulat-weldemeskel [32], who highlight the stronger enforcement capacity of developed countries, which significantly reduces GHG emissions. Furthermore, the differential impact of ERTR between LMICs and HICs underscores the need for policies that are specifically tailored to regional and sectoral nuances. Ahmad and Satrovic [43], Liu et al. [44], and Shayanmehr et al. [45] argue for adaptively structured environmental taxes that consider unique regional and sectoral characteristics, which could significantly increase their effectiveness. Continuous empirical evaluation incorporating local conditions remains crucial to optimizing the environmental benefits of these fiscal strategies. Nevertheless, considering the findings of Vecellio Segate [52], it is clear that while the differential impact of ERTR across LMICs and HICs is pronounced, a shift towards a more globally coordinated and cooperative fiscal framework is essential. This reorientation, which resonates with Vecellio Segate’s [52] recommendations and is reflected in initiatives such as the OECD’s BEPS 2.0 [53], aims to better capture the complex transnational nature of environmental externalities and the entities responsible for them. Therefore, progress towards a fairer and more effective environmental tax system requires not only context-specific national policies but also a broader, international rethinking of tax frameworks. This holistic approach will ensure that environmental taxes effectively target the real drivers of environmental degradation and transcend national and regional boundaries.
The study also examines the role of ECI in influencing environmental quality and finds significant differences between LMICs and HICs. In LMICs, both the long-term and short-term coefficients are 0.194 and 0.241, respectively, and are statistically significant at the 1% level. In light of the existing literature, particularly Ehigiamusoe and Dogan [54], the positive coefficients may suggest that an increase in energy capacity is detrimental to environmental quality. Possible explanations for this trend could be inefficiencies in the energy system or the particular mix of energy sources used, which may be at a less mature stage of the transition to sustainability. Conversely, in the HICs, the ECI coefficients are negative and statistically significant, with values of −0.082 and −0.027 in the long and short term, respectively. This result may be consistent with the findings of studies such as Rubashkina et al. [38], which suggest that wealthier and more technologically advanced countries may be more advanced in the development and adoption of clean technologies. The negative coefficients may indicate a shift towards more energy-dense but cleaner forms of energy. This trend is corroborated by Li et al. [55], who found a reduction in carbon dioxide emissions with the adoption of green technologies in developed East Asian economies. Furthermore, the principle of depletion accounting, explored in Huo and Peng [58], may provide additional context, suggesting that HICs are gradually adopting sustainable resource management strategies due to their financial and policy frameworks.
Energy efficiency introduces further complexity to this dynamic, particularly due to the “rebound effect” described by Saunders [58] and Amjadi et al. [6]. This phenomenon suggests that efficiency gains could paradoxically lead to higher overall energy consumption. Although this study does not directly quantify these variables, they add nuance to the interpretation of the impact of the ECI on environmental quality. Thus, it could be cautiously argued that efficiency measures, while implemented, may not translate linearly into improved ECI or environmental quality. The divergent impacts of ECI in LMICs and HICs thus underscore the complexity of the relationship between energy capacity and environmental quality. These observations argue for tailored, multidimensional policy approaches that recognize the different influences of income strata, technological capacities, and governance frameworks on the relationship between ECI and environmental quality.
Finally, the ICT capacity index adds another dimension to the analysis. For HICs, the estimated coefficients are negative and statistically significant, providing evidence that advances in ICT contribute directly to GHG emission reductions. Specifically, a 1% increase in the ICT capacity index is associated with a 0.105% reduction in GHG emissions in the long run and a 0.038% reduction in GHG emissions in the short run. These results are consistent with existing studies that highlight the synergistic effects of mature ICT infrastructures, robust policy frameworks, and technological innovation in improving the environment [64,66,67]. On the other hand, in LMICs, the estimated coefficients of ICT_CI are statistically insignificant in both the short and long run. This finding suggests that the relationship between ICT and environmental quality in these countries has yet to be definitively established. Such inconclusive results can be contextualized by the literature highlighting the infrastructural deficiencies and the nuanced roles of governance and financial systems in LMICs [70,72]. Thus, while the ICT_CI variable is critical in reducing GHG emissions in HICs, its role in LMICs remains ambiguous and requires further empirical investigation. The findings of this study on the differential impact of ICT in HICs and LMICs further underscore the need for policy frameworks that are fine-tuned to each country’s economic, technological, and governance landscape.
The study thus provides a multifaceted understanding of the variables that affect environmental quality. This understanding calls for nuanced, context-sensitive policies that recognize the multiple influences of economic development patterns, technology adoption, and governance quality.
4.5. Robustness Analysis
The validity of the long-run estimates of the CS-ARDL model is confirmed by the application of alternative techniques, specifically the AMG and DCCEMG methods. As shown in Table 8, these methods produce results that are largely consistent with those of the CS-ARDL model for the variables under study. The positive coefficients for GDP_PC in both the AMG and DCCEMG estimations confirm the proportional relationship between economic growth and environmental degradation, thereby reinforcing the results of the original model. At the same time, the negative coefficients for GDP2_PC in both methodologies and income groups support the viability of the EKC hypothesis. The coefficients for the ECI reinforce the initial conclusion of the model, suggesting differential environmental impacts between LMICs and HICs. Moreover, the statistically significant negative coefficients for ERTR in both AMG and DCCEMG underscore the effectiveness of such taxes and highlight the need for geographically tailored fiscal interventions. The ICT capacity index remains a salient variable, reaching statistical significance only in the context of HICs, indicating its nuanced role in shaping environmental outcomes. Finally, the CD statistics associated with the DCCEMG model substantiate the robustness of the findings, as they support the null hypothesis of weak cross-sectional dependence. The congruence of the results generated by the AMG and DCCEMG methods with those of the CS-ARDL model reinforces the empirical robustness of the relationships among key economic, technological, and environmental variables.
Table 8.
AMG and DCCEMG panel data long-run estimation results.
5. Conclusions and Policy Implications
5.1. Conclusions
The purpose of this study was to examine the interrelationships between digitalization, energy resource capacity, and environmentally related tax revenue (ERTR) in their impact on environmental quality over the period 2000 to 2021 in 50 LMICs and 38 HICs. Our research has provided important insights into the differential impact of these factors in different economic contexts, validating the EKC hypothesis by providing clear evidence of the significant role of ERTR in mitigating environmental degradation. The study also highlights the contrasting influences of energy capacity and digitalization on environmental quality between LMICs and HICs, reflecting their different stages of economic development and environmental policies. The use of advanced second-generation panel methods, including the CS-ARDL, DCCEMG, and AMG models, was instrumental in addressing challenges such as cross-sectional dependence, slope heterogeneity, and endogeneity, thus ensuring the robustness and accuracy of our analysis. This research provides important insights into the complex interplay between economic growth, technological progress, and environmental sustainability and underscores the need for environmental policies that are tailored to the unique economic realities and stages of development of different countries on their path to sustainable environmental progress.
5.2. Policy Implications
In addressing the findings of this study, several key policy recommendations emerge, emphasizing a multifaceted approach to mitigating environmental degradation. The study highlights the need for a progressive environmental tax regime, particularly targeting transnational corporations and supply chains. This regime should embody the polluter-pays principle and compel industries with significant carbon footprints to contribute more to environmental tax revenues. The use of these revenues to finance renewable energy projects and circular economy initiatives is central to aligning with the United Nations SDGs, particularly SDG-7 on affordable and clean energy and SDG-13 on climate action. In addition, the study highlights the need for tailored energy policies that address the different needs of LMICs and HICs. For LMICs, this includes a focus on developing green finance and clean energy research facilitated by international financial support and development assistance. Conversely, for HICs, the focus should be on facilitating decarbonization credits and investments in renewable energy technologies to build sustainable energy infrastructures. The role of MNCs in environmental degradation requires significant attention. Effective strategies must be implemented to counter their capital flows and tax avoidance practices. These include strict enforcement of transparency requirements, strengthening international tax cooperation, applying targeted environmental taxes on MNCs, and linking tax incentives to their environmental performance. Furthermore, monitoring and regulating the capital flows of MNCs to prevent the exacerbation of environmental degradation and strengthening legal frameworks for corporate accountability are essential measures. Leveraging ICTs in environmental protection strategies is critical, especially in high-income countries where the impact of ICTs on environmental quality is more pronounced. This includes fostering public–private partnerships to develop technologies such as smart grid systems, data analytics for waste management, and artificial intelligence for real-time pollution monitoring. These initiatives, in line with SDG-13, are expected to serve as innovative solutions that synergize digitalization and environmental sustainability. Finally, the importance of regional cooperation and cross-border initiatives cannot be overstated in addressing the global nature of environmental challenges. These initiatives should focus on promoting the exchange of best practices, facilitating joint research efforts, and harmonizing environmental standards and policies. Particular attention should be paid to supporting LMICs in making early investments in green technologies, thereby avoiding the initial surge in emissions often associated with economic growth.
5.3. Future Research Directions
The limitations of this study provide a roadmap for future research. Extending the time frame of the dataset and including a wider range of countries are crucial steps to improving the robustness and applicability of the findings and to providing a comprehensive view of long-term trends and different economic scenarios. Examining the role of multinational corporations is essential, as this would reveal the complex interactions between corporate strategies, economic power dynamics, and environmental regulations. A deeper examination of the impact of global elites and transnational supply chains on environmental taxation and policy effectiveness is necessary to understand the intricate relationship between wealth, resource distribution, and environmental outcomes. There is also an urgent need to rethink approaches to environmental taxation, focusing on targeting the capital flows and tax practices of large global corporations to address their environmental impacts more effectively. In addition, assessing the balance between effective tax enforcement and the protection of privacy and human rights is critical, with a particular focus on the evolving legal frameworks governing these areas.
Author Contributions
Conceptualization, A.B.Y. and M.D.; methodology, A.B.Y. and M.D.; formal analysis, M.D.; writing—original draft preparation, A.B.Y. and M.D.; writing—review and editing, A.B.Y. and M.D. All authors have read and agreed to the published version of the manuscript.
Funding
This research received no external funding.
Institutional Review Board Statement
Not applicable.
Informed Consent Statement
Not applicable.
Data Availability Statement
This study is based on data from several authoritative sources. Detailed data on greenhouse gas emissions are provided by the Emissions Database for Global Atmospheric Research (EDGAR), available at (https://edgar.jrc.ec.europa.eu/ accessed on 15 November 2023). Comprehensive statistics on green growth indicators are provided by the Organization for Economic Cooperation and Development (OECD), available at (https://stats.oecd.org/Index.aspx?DataSetCode=GREEN_GROWTH accessed on 15 November 2023). In addition, the United Nations Conference on Trade and Development (UNCTAD) provides valuable data on the Productive Capacities Index, available at (https://unctadstat.unctad.org/datacentre/dataviewer/US.PCI accessed on 15 November 2023).
Conflicts of Interest
The authors declare no conflicts of interest.
References
- UNFCCC. Paris Agreement; UNFCCC: Paris, France, 2015. [Google Scholar]
- United Nations. Transforming Our World: The 2030 Agenda for Sustainable Development; United Nations, Department of Economic and Social Affairs: New York, NY, USA, 2015. [Google Scholar]
- Grossman, G.; Krueger, A. Environmental Impacts of a North American Free Trade Agreement; NBER Working Paper No. 3914; National Bureau of Economic Research: Cambridge, MA, USA, 1991. [Google Scholar]
- Dinda, S. Environmental Kuznets curve hypothesis: A survey. Ecol. Econ. 2004, 49, 431–455. [Google Scholar] [CrossRef]
- Schwab, K. The Fourth Industrial Revolution; Portfolio Penguin: London, UK, 2017. [Google Scholar]
- Amjadi, G.; Lundgren, T.; Zhou, W. A dynamic analysis of industrial energy efficiency and the rebound effect: Implications for carbon emissions and sustainability. Energy Effic. 2022, 15, 54. [Google Scholar] [CrossRef]
- Berner, A.; Bruns, S.; Moneta, A.; Stern, D.I. Do energy efficiency improvements reduce energy use? Empirical evidence on the economy-wide rebound effect in Europe and the United States. Energy Econ. 2022, 110, 105939. [Google Scholar] [CrossRef]
- Jahanger, A.; Ozturk, I.; Chukwuma Onwe, J.; Joseph, T.E.; Razib Hossain, M. Do technology and renewable energy contribute to energy efficiency and carbon neutrality? Evidence from top ten manufacturing countries. Sustain. Energy Technol. Assess. 2023, 56, 103084. [Google Scholar] [CrossRef]
- Omondi, C.; Njoka, F.; Musonye, F. An economy-wide rebound effect analysis of Kenya’s energy efficiency initiatives. J. Clean. Prod. 2023, 385, 135730. [Google Scholar] [CrossRef]
- Olabi, A.G.; Abdelkareem, M.A.; Mahmoud, M.S.; Elsaid, K.; Obaideen, K.; Rezk, H.; Wilberforce, T.; Eisa, T.; Chae, K.-J.; Sayed, E.T. Green hydrogen: Pathways, roadmap, and role in achieving sustainable development goals. Process Saf. Environ. Prot. 2023, 177, 664–687. [Google Scholar] [CrossRef]
- Brundtland, G.H. Report of the World Commission on Environment and Development: Our Common Future; United Nations General Assembly: New York, NY, USA, 1987. [Google Scholar]
- Stern, D.I. The rise and fall of the Environmental Kuznets Curve. World Dev. 2004, 32, 1419–1439. [Google Scholar] [CrossRef]
- Shokoohi, Z.; Dehbidi, N.K.; Tarazkar, M.H. Energy intensity, economic growth and environmental quality in populous Middle East countries. Energy 2022, 239, 122164. [Google Scholar] [CrossRef]
- Kostakis, I.; Arauzo-Carod, J.-M. The key roles of renewable energy and economic growth in disaggregated environmental degradation: Evidence from highly developed, heterogeneous and cross-correlated countries. Renew. Energy 2023, 206, 1315–1325. [Google Scholar] [CrossRef]
- Agbanyo, G.K.; Ofori, C.; Prah, G.J.; Chin, T. Exploring the energy–economy–environment paradox through Yin–Yang harmony cognition. Heliyon 2023, 9, e19864. [Google Scholar] [CrossRef]
- Hashmi, S.M.; Yu, X.; Syed, Q.R.; Rong, L. Testing the environmental Kuznets curve (EKC) hypothesis amidst climate policy uncertainty: Sectoral analysis using the novel Fourier ARDL approach. Environ. Dev. Sustain. 2023. [Google Scholar] [CrossRef] [PubMed]
- Mpofu, F.Y. Green Taxes in Africa: Opportunities and Challenges for Environmental Protection, Sustainability, and the Attainment of Sustainable Development Goals. Sustainability 2022, 14, 10239. [Google Scholar] [CrossRef]
- Dam, M.M.; Işık, C.; Ongan, S. The impacts of renewable energy and institutional quality in environmental sustainability in the context of the sustainable development goals: A novel approach with the inverted load capacity factor. Environ. Sci. Pollut. Res. 2023, 30, 95394–95409. [Google Scholar] [CrossRef] [PubMed]
- Adjei, M.; Song, H.; Nketiah, E.; Obuobi, B.; Adu-Gyamfi, G. Sustainable development of West African economies to achieve environmental quality. Environ. Sci. Pollut. Res. 2022, 30, 15253–15266. [Google Scholar] [CrossRef] [PubMed]
- Ullah, S.; Adebayo, T.S.; Irfan, M.; Abbas, S. Environmental quality and energy transition prospects for G-7 economies: The prominence of environment-related ICT innovations, financial and human development. J. Environ. Manag. 2023, 342, 118120. [Google Scholar] [CrossRef] [PubMed]
- Hailemariam, A.; Erdiaw-Kwasie, M.O. Towards a circular economy: Implications for emission reduction and environmental sustainability. Bus. Strategy Environ. 2022, 32, 1951–1965. [Google Scholar] [CrossRef]
- Yang, M.; Chen, L.; Wang, J.; Msigwa, G.; Osman, A.I.; Fawzy, S.; Rooney, D.W.; Yap, P.-S. Circular economy strategies for combating climate change and other environmental issues. Environ. Chem. Lett. 2023, 21, 55–80. [Google Scholar] [CrossRef]
- Stoian, M.; Brad, L.; Zaharia, A. Drivers of the European Union’s Environmental Performance. Front. Environ. Sci. 2022, 10, 954612. [Google Scholar] [CrossRef]
- Pigou, A.C. The Economics of Welfare; Macmillan: London, UK, 1920. [Google Scholar]
- Coase, R.H. The Problem of Social Cost. J. Law Econ. 1960, 3, 1–44. [Google Scholar] [CrossRef]
- Pearce, D.W. The role of carbon taxes in adjusting to global warming. Econ. J. 1991, 101, 938–948. [Google Scholar] [CrossRef]
- Lans Bovenberg, A.; Smulders, S. Environmental quality and pollution-augmenting technological change in a two-sector endogenous growth model. J. Public Econ. 1995, 57, 369–391. [Google Scholar] [CrossRef]
- Bovenberg, A.L.; de Mooij, R.A. Environmental tax reform and endogenous growth. J. Public Econ. 1997, 63, 207–237. [Google Scholar] [CrossRef]
- Fullerton, D.; Metcalf, G. Environmental Taxes and the Double-Dividend Hypothesis: Did You Really Expect Something for Nothing? NBER Working Paper No. 6199; NBER: Cambridge, MA, USA, 1997. [Google Scholar]
- Schöb, R. The Double Dividend Hypothesis of Environmental Taxes: A Survey. SSRN Electron. J. 2003. [Google Scholar] [CrossRef]
- Alola, A.A.; Nwulu, N. Do energy-pollution-resource-transport taxes yield double dividend for Nordic economies? Energy 2022, 254, 124275. [Google Scholar] [CrossRef]
- Wolde-Rufael, Y.; Mulat-Weldemeskel, E. Effectiveness of environmental taxes and environmental stringent policies on CO2 emissions: The European experience. Environ. Dev. Sustain. 2022, 25, 5211–5239. [Google Scholar] [CrossRef]
- Li, J.; Du, Q.; Lu, C.; Huang, Y.; Wang, X. Simulations for double dividend of carbon tax and improved energy efficiency in the transportation industry. Environ. Sci. Pollut. Res. 2023, 30, 19083–19096. [Google Scholar] [CrossRef]
- Karmaker, S.C.; Hosan, S.; Chapman, A.J.; Saha, B.B. The role of environmental taxes on technological innovation. Energy 2021, 232, 121052. [Google Scholar] [CrossRef]
- Guo, B.; Wang, Y.; Zhou, H.; Hu, F. Can environmental tax reform promote carbon abatement of resource-based cities? Evidence from a quasi-natural experiment in China. Environ. Sci. Pollut. Res. 2022, 30, 117037–117049. [Google Scholar] [CrossRef]
- Porter, M.E.; Linde, C. van der. Toward a New Conception of the Environment-Competitiveness Relationship. J. Econ. Perspect. 1995, 9, 97–118. [Google Scholar] [CrossRef]
- Zhong, C.; Hamzah, H.Z.; Yin, J.; Wu, D.; Cao, J.; Mao, X.; Li, H. Impact of environmental regulations on the industrial eco-efficiency in China—Based on the strong porter hypothesis and the weak porter hypothesis. Environ. Sci. Pollut. Res. 2023, 30, 44490–44504. [Google Scholar] [CrossRef]
- Rubashkina, Y.; Galeotti, M.; Verdolini, E. Environmental regulation and competitiveness: Empirical evidence on the Porter Hypothesis from European manufacturing sectors. Energy Policy 2015, 83, 288–300. [Google Scholar] [CrossRef]
- Zhang, Q.; Li, J.; Wang, J. Does energy-consuming right trading have double dividend effect on firm’s economic performance and carbon emission? Environ. Sci. Pollut. Res. 2023, 30, 105595–105613. [Google Scholar] [CrossRef] [PubMed]
- Degirmenci, T.; Aydin, M. The effects of environmental taxes on environmental pollution and unemployment: A panel co-integration analysis on the validity of double dividend hypothesis for selected African countries. Int. J. Financ. Econ. 2023, 28, 2231–2238. [Google Scholar] [CrossRef]
- Timilsina, G.R.; Dissou, Y.; Toman, M.; Heine, D. How can a carbon tax benefit developing economies with informality? A CGE analysis for Côte d’Ivoire. Clim. Policy 2023, 1–16. [Google Scholar] [CrossRef]
- Rafique, M.Z.; Fareed, Z.; Ferraz, D.; Ikram, M.; Huang, S. Exploring the heterogenous impacts of environmental taxes on environmental footprints: An empirical assessment from developed economies. Energy 2023, 238, 121753. [Google Scholar] [CrossRef]
- Ahmad, M.; Satrovic, E. How do transportation-based environmental taxation and globalization contribute to ecological sustainability? Ecol. Inform. 2023, 74, 102009. [Google Scholar] [CrossRef]
- Liu, N.; Yao, X.; Wan, F.; Han, Y. Are tax revenue recycling schemes based on industry-differentiated carbon tax conducive to realizing the “double dividend”? Energy Econ. 2023, 124, 106814. [Google Scholar] [CrossRef]
- Shayanmehr, S.; Radmehr, R.; Ali, E.B.; Ofori, E.K.; Adebayo, T.S.; Gyamfi, B.A. How do environmental tax and renewable energy contribute to ecological sustainability? New evidence from top renewable energy countries. Int. J. Sustain. Dev. World Ecol. 2023, 30, 650–670. [Google Scholar] [CrossRef]
- Doğan, B.; Chu, L.K.; Ghosh, S.; Truong, H.H.D.; Balsalobre-Lorente, D. How environmental taxes and carbon emissions are related in the G7 economies? Renew. Energy 2022, 187, 645–656. [Google Scholar] [CrossRef]
- King, M.; Tarbush, B.; Teytelboym, A. Targeted carbon tax reforms. Eur. Econ. Rev. 2019, 119, 526–547. [Google Scholar] [CrossRef]
- Özmen, İ.; Özcan, G.; Özcan, C.C.; Bekun, F.V. Does fiscal policy spur environmental issues? New evidence from selected developed countries. Int. J. Environ. Sci. Technol. 2022, 19, 10831–10844. [Google Scholar] [CrossRef]
- Tan, Z.; Wu, Y.; Gu, Y.; Liu, T.; Wang, W.; Liu, X. An overview on implementation of environmental tax and related economic instruments in typical countries. J. Clean. Prod. 2022, 330, 129688. [Google Scholar] [CrossRef]
- Hájek, M.; Zimmermannová, J.; Helman, K.; Rozenský, L. Analysis of carbon tax efficiency in energy industries of selected EU countries. Energy Policy 2019, 134, 110955. [Google Scholar] [CrossRef]
- Silajdzic, S.; Mehic, E. Do Environmental Taxes Pay Off? The Impact of Energy and Transport Taxes on CO2 Emissions in Transition Economies. South East Eur. J. Econ. Bus. 2018, 13, 126–143. [Google Scholar] [CrossRef]
- Vecellio Segate, R. The Distributive Surveillant Contract: Reforming “Surveillance Capitalism through Taxation” into a Legal Teleology of Global Economic Justice. Ph.D. Thesis, University of Macau, Macao, China, 2022. Available online: https://library2.um.edu.mo/etheses/991010238079006306_ft.pdf (accessed on 31 December 2023).
- Weisbach, D. Literature Review: Taxing Profit in a Global Economy; Devereux, M.P., Auerbach, A.J., Keen, M., Oosterhuis, P., Schön, W., Vella, J., Eds.; Oxford University Press: Oxford, UK, 2023; Volume 51, pp. 536–540. [Google Scholar]
- Ehigiamusoe, K.U.; Dogan, E. The role of interaction effect between renewable energy consumption and real income in carbon emissions: Evidence from low-income countries. Renew. Sustain. Energy Rev. 2022, 154, 111883. [Google Scholar] [CrossRef]
- Li, Z.; Wei, X.; Al Shraah, A.; Khudoykulov, K.; Albasher, G.; Ortiz, G.G.R. Role of green energy usage in reduction of environmental degradation: A comparative study of East Asian countries. Energy Econ. 2023, 126, 106927. [Google Scholar] [CrossRef]
- Sun, Y.; Bao, Q.; Siao-Yun, W.; Islam, M.; Razzaq, A. Renewable energy transition and environmental sustainability through economic complexity in BRICS countries: Fresh insights from novel Method of Moments Quantile regression. Renew. Energy 2022, 184, 1165–1176. [Google Scholar] [CrossRef]
- Lei, W.; Xie, Y.; Hafeez, M.; Ullah, S. Assessing the dynamic linkage between energy efficiency, renewable energy consumption, and CO2 emissions in China. Environ. Sci. Pollut. Res. 2022, 29, 19540–19552. [Google Scholar] [CrossRef]
- Saunders, H.D. Historical evidence for energy consumption rebound in 30 US sectors and a toolkit for rebound analysts. Technol. Forecast. Soc. Chang. 2013, 80, 1317–1330. [Google Scholar] [CrossRef]
- Khan, Y.; Oubaih, H.; Elgourrami, F.Z. The effect of renewable energy sources on carbon dioxide emissions: Evaluating the role of governance, and ICT in Morocco. Renew. Energy 2022, 190, 752–763. [Google Scholar] [CrossRef]
- Huo, J.; Peng, C. Depletion of natural resources and environmental quality: Prospects of energy use, energy imports, and economic growth hindrances. Resour. Policy 2023, 86, 104049. [Google Scholar] [CrossRef]
- Gyamfi, B.A.; Onifade, S.T.; Nwani, C.; Bekun, F.V. Accounting for the combined impacts of natural resources rent, income level, and energy consumption on environmental quality of G7 economies: A panel quantile regression approach. Environ. Sci. Pollut. Res. 2022, 29, 2806–2818. [Google Scholar] [CrossRef] [PubMed]
- Copeland, B.R.; Taylor, M.S. Trade, Growth, and the Environment. J. Econ. Lit. 2004, 42, 7–71. [Google Scholar] [CrossRef]
- Wu, D.; Yang, Y.; Shi, Y.; Xu, M.; Zou, W. Renewable energy resources, natural resources volatility and economic performance: Evidence from BRICS. Resour. Policy 2022, 76, 102621. [Google Scholar] [CrossRef]
- Chen, P. Relationship between the digital economy, resource allocation and corporate carbon emission intensity: New evidence from listed Chinese companies. Environ. Res. Commun. 2022, 4, 75005. [Google Scholar] [CrossRef]
- Liu, J.; Yu, Q.; Chen, Y.; Liu, J. The impact of digital technology development on carbon emissions: A spatial effect analysis for China. Resour. Conserv. Recycl. 2022, 185, 106445. [Google Scholar] [CrossRef]
- Ghiasi, M.; Wang, Z.; Mehrandezh, M.; Jalilian, S.; Ghadimi, N. Evolution of smart grids towards the Internet of energy: Concept and essential components for deep decarbonisation. IET Smart Grid 2022, 6, 86–102. [Google Scholar] [CrossRef]
- Ayub Khan, A.; Ali Laghari, A.; Rashid, M.; Li, H.; Rehman Javed, A.; Reddy Gadekallu, T. Artificial intelligence and blockchain technology for secure smart grid and power distribution Automation: A State-of-the-Art Review. Sustain. Energy Technol. Assess. 2023, 57, 103282. [Google Scholar] [CrossRef]
- Sasikumar, A.; Ravi, L.; Kotecha, K.; Saini, J.R.; Varadarajan, V.; Subramaniyaswamy, V. Sustainable Smart Industry: A Secure and Energy Efficient Consensus Mechanism for Artificial Intelligence Enabled Industrial Internet of Things. Comput. Intell. Neurosci. 2022, 2022, 1419360. [Google Scholar] [CrossRef]
- Huang, Y.; Haseeb, M.; Usman, M.; Ozturk, I. Dynamic association between ICT, renewable energy, economic complexity and ecological footprint: Is there any difference between E-7 (developing) and G-7 (developed) countries? Technol. Soc. 2022, 68, 101853. [Google Scholar] [CrossRef]
- Islam, M.S.; Rahaman, S.H. The asymmetric effect of ICT on CO2 emissions in the context of an EKC framework in GCC countries: The role of energy consumption, energy intensity, trade, and financial development. Environ. Sci. Pollut. Res. 2023, 30, 77729–77741. [Google Scholar] [CrossRef]
- Awad, A. Is there any impact from ICT on environmental quality in Africa? Evidence from second-generation panel techniques. Environ. Chall. 2022, 7, 100520. [Google Scholar] [CrossRef]
- Ke, J.; Jahanger, A.; Yang, B.; Usman, M.; Ren, F. Digitalization, Financial Development, Trade, and Carbon Emissions; Implication of Pollution Haven Hypothesis During Globalization Mode. Front. Environ. Sci. 2022, 10, 2011. [Google Scholar] [CrossRef]
- Batool, Z.; Raza, S.M.F.; Ali, S.; Abidin, S.Z.U. ICT, renewable energy, financial development, and CO2 emissions in developing countries of East and South Asia. Environ. Sci. Pollut. Res. 2022, 29, 35025–35035. [Google Scholar] [CrossRef] [PubMed]
- Ren, S.; Hao, Y.; Wu, H. Digitalization and environment governance: Does internet development reduce environmental pollution? J. Environ. Plan. Manag. 2022, 66, 1533–1562. [Google Scholar] [CrossRef]
- Weili, L.; Khan, H.; Khan, I.; Han, L. The impact of information and communication technology, financial development, and energy consumption on carbon dioxide emission: Evidence from the Belt and Road countries. Environ. Sci. Pollut. Res. 2022, 29, 27703–27718. [Google Scholar] [CrossRef] [PubMed]
- Zhang, M.; Zhang, D.; Xie, T. Technology innovations and carbon neutrality in technologically advanced economies: Imperative agenda for COP26. Econ. Res. 2023, 36, 2178017. [Google Scholar] [CrossRef]
- Emissions Database for Global Atmospheric Research [EDGAR]. Community GHG Database (A Collaboration between the European Commission, Joint Research Centre [JRC], the International Energy Agency [IEA], and Comprising IEA-EDGAR CO2, EDGAR CH4, EDGAR N2O, EDGAR F-GASES Version 8.0). European Commission. 2023. Available online: https://edgar.jrc.ec.europa.eu/ (accessed on 15 November 2023).
- Organization for Economic Co-operation and Development [OECD]. OECD.Stat: Green Growth Indicators. 2023. Available online: https://stats.oecd.org/Index.aspx?DataSetCode=GREEN_GROWTH (accessed on 15 November 2023).
- United Nations Conference on Trade and Development [UNCTAD]. UNCTADSTAT-Data Center: UNCTAD’s Productive Capacities Index (PCI). 2023. Available online: https://unctadstat.unctad.org/datacentre/dataviewer/US.PCI (accessed on 15 November 2023).
- Westerlund, J.; Edgerton, D.L. A Simple Test for Cointegration in Dependent Panels with Structural Breaks. Oxf. Bull. Econ. Stat. 2008, 70, 665–704. [Google Scholar] [CrossRef]
- Sharif, A.; Kartal, M.T.; Bekun, F.V.; Pata, U.K.; Foon, C.L.; Kılıç Depren, S. Role of green technology, environmental taxes, and green energy towards sustainable environment: Insights from sovereign Nordic countries by CS-ARDL approach. Gondwana Res. 2023, 117, 194–206. [Google Scholar] [CrossRef]
- Pesaran, M.H. Testing Weak Cross-Sectional Dependence in Large Panels. Econom. Rev. 2015, 34, 1089–1117. [Google Scholar] [CrossRef]
- Pesaran, M.H. General diagnostic tests for cross-sectional dependence in panels. Empir. Econ. 2021, 60, 13–50. [Google Scholar] [CrossRef]
- Fan, J.; Liao, Y.; Yao, J. Power Enhancement in High-Dimensional Cross-Sectional Tests. Econometrica 2015, 83, 1497–1541. [Google Scholar] [CrossRef] [PubMed]
- Pesaran, M.H.; Yamagata, T. Testing slope homogeneity in large panels. J. Econom. 2008, 142, 50–93. [Google Scholar] [CrossRef]
- Swamy, P.A.V.B. Efficient Inference in a Random Coefficient Regression Model. Econometrica 1970, 38, 311. [Google Scholar] [CrossRef]
- Bersvendsen, T.; Ditzen, J. Testing for slope heterogeneity in Stata. Stata J. Promot. Commun. Stat. Stata 2021, 21, 51–80. [Google Scholar] [CrossRef]
- Pesaran, M.H. A Simple Panel Unit Root Test in the Presence of Cross-Section Dependence. J. Appl. Econom. 2007, 22, 265–312. [Google Scholar] [CrossRef]
- Ditzen, J.; Karavias, Y.; Westerlund, J. Testing and estimating structural breaks in time series and panel data in Stata. arXiv 2021, arXiv:2110.14550. [Google Scholar]
- Westerlund, J. Testing for error correction in panel data. Oxf. Bull. Econ. Stat. 2007, 69, 709–748. [Google Scholar] [CrossRef]
- Chudik, A.; Mohaddes, K.; Pesaran, M.H.; Raissi, M. Long-Run Effects in Large Heterogeneous Panel Data Models with Cross-Sectionally Correlated Errors. Adv. Econom. 2016, 36, 85–135. [Google Scholar]
- Dogan, A.; Pata, U.K. The role of ICT, R&D spending and renewable energy consumption on environmental quality: Testing the LCC hypothesis for G7 countries. J. Clean. Prod. 2022, 380, 135038. [Google Scholar]
- Dahmani, M.; Mabrouki, M.; Ben Youssef, A. The ICT, financial development, energy consumption and economic growth nexus in MENA countries: Dynamic panel CS-ARDL evidence. Appl. Econ. 2023, 55, 1114–1128. [Google Scholar] [CrossRef]
- Mehmood, U.; Tariq, S.; Aslam, M.U.; Agyekum, E.B.; Uhunamure, S.E.; Shale, K.; Kamal, M.; Khan, M.F. Evaluating the impact of digitalization, renewable energy use, and technological innovation on load capacity factor in G8 nations. Sci. Rep. 2023, 13, 9131. [Google Scholar] [CrossRef] [PubMed]
- Sadiq, M.; Hassan, S.T.; Khan, I.; Rahman, M.M. Policy uncertainty, renewable energy, corruption and CO2 emissions nexus in BRICS-1 countries: A panel CS-ARDL approach. Environ. Dev. Sustain. 2023. [Google Scholar] [CrossRef]
- Chudik, A.; Pesaran, M.H. Common correlated effects estimation of heterogeneous dynamic panel data models with weakly exogenous regressors. J. Econom. 2015, 188, 393–420. [Google Scholar] [CrossRef]
- Eberhardt, M.; Teal, F. Productivity Analysis in Global Manufacturing Production; Economics Series Working Papers (515); Department of Economics, University of Oxford: Oxford, UK, 2010. [Google Scholar]
- Dahmani, M.; Mabrouki, M.; Youssef, A. The ICT, Financial Development, Energy Consumption and Economic Growth Nexus in MENA Countries: Panel CS-ARDL Evidence (No. 2021-46); Groupe de REcherche en Droit, Economie, Gestion (GREDEG CNRS), Université Côte d’Azur: Nice, France, 2021. [Google Scholar]
- Dahmani, M.; Mabrouki, M.; Ragni, L. Decoupling Analysis of Greenhouse Gas Emissions from Economic Growth: A Case Study of Tunisia. Energies 2021, 14, 7550. [Google Scholar] [CrossRef]
- Pata, U.K.; Kartal, M.T.; Erdogan, S. Analyzing the EKC hypothesis for technologically advanced countries: The role of ICT and renewable energy technologies. J. Clean. Prod. 2023, 426, 139088. [Google Scholar] [CrossRef]
- Saqib, N.; Duran, I.A.; Ozturk, I. Unraveling the Interrelationship of Digitalization, Renewable Energy, and Ecological Footprints within the EKC Framework: Empirical Insights from the United States. Sustainability 2023, 15, 10663. [Google Scholar] [CrossRef]
- Ahmad, M.; Dai, J.; Mehmood, U.; Abou Houran, M. Renewable energy transition, resource richness, economic growth, and environmental quality: Assessing the role of financial globalization. Renew. Energy 2023, 216, 119000. [Google Scholar] [CrossRef]
- Shah, S.A.R.; Zhang, Q.; Abbas, J.; Balsalobre-Lorente, D.; Pilař, L. Technology, Urbanization and Natural Gas Supply Matter for Carbon Neutrality: A New Evidence of Environmental Sustainability under the Prism of COP26. Resour. Policy 2023, 82, 103465. [Google Scholar] [CrossRef]
- Dahmani, M. Environmental quality and sustainability: Exploring the role of environmental taxes, environment-related technologies, and R&D expenditure. Environ. Econ. Policy Stud. 2023. [Google Scholar] [CrossRef]
- Youssef, A.B.; Dahmani, M.; Mabrouki, M. The impact of environmentally related taxes and productive capacities on climate change: Insights from European Economic Area countries. Environ. Sci. Pollut. Res. 2023, 30, 99900–99912. [Google Scholar] [CrossRef] [PubMed]
Disclaimer/Publisher’s Note: The statements, opinions and data contained in all publications are solely those of the individual author(s) and contributor(s) and not of MDPI and/or the editor(s). MDPI and/or the editor(s) disclaim responsibility for any injury to people or property resulting from any ideas, methods, instructions or products referred to in the content. |
© 2024 by the authors. Licensee MDPI, Basel, Switzerland. This article is an open access article distributed under the terms and conditions of the Creative Commons Attribution (CC BY) license (https://creativecommons.org/licenses/by/4.0/).