Abstract
The rapid development of urbanization has led to population growth, increased resource consumption, and intensified environmental pollution. Consequently, urban ecological security has increasingly become a key factor constraining the sustainable development of socio-economic systems. This study constructed an urban ecological security evaluation system based on the Pressure-State-Response (PSR) model and used Xuzhou, a typical coal resource city, as a case study to apply and validate the model. Specifically, the analytic hierarchy process and entropy weight method were used to determine the index weights, and the ecological security index was used to evaluate the ecological security status of each system in Xuzhou from 2006 to 2022. Finally, the grey prediction GM (1,1) model was used to predict the ecological security status of Xuzhou in the next five years. The results show that the “disposal capacity of waste gas treatment facilities”, “per capita disposable income”, and “agricultural fertilizer application intensity” occupy a large weight in the whole evaluation system. The pressure index generally showed a fluctuating upward trend, and the state index fluctuated around 0.12. There is a simultaneous upward trend in the response index and the composite index. The ecological security level of the composite index has increased from “unsafe” in 2006 to “relatively safe” in 2022 and will continue to improve to “ideal security” in the future. This study provides a scientific basis for the formulation of sustainable development policies in Xuzhou and also provides a reference for the ecological safety management and assessment of other similar cities.
1. Introduction
With the acceleration of global urbanization, cities are facing increasingly serious challenges of resource depletion and ecological degradation [1]. Especially in coal-based cities, long-term resource exploitation has led to more prominent environmental problems, such as land degradation, air pollution, and water shortages [2]. These problems not only threaten the balance of the urban ecosystem but also seriously affect the quality of life of residents and the sustainable development of the economy. Therefore, how to scientifically assess and effectively manage the ecological security of resource-based cities has become a common concern for both academia and government departments.
Ecological security refers to the stable structure and function of the ecosystem, which can provide support for sustainable economic and social development and ensure that the community of human and natural life is not threatened [3]. It is about human survival, climate regulation, and economic stability. With the acceleration of urbanization, ecological problems in urban areas have become increasingly prominent [4]. Therefore, urban ecological security has become an important issue in protecting human health and sustainable environmental development. Common methods for assessing urban ecological security include the Drivers-Pressures-State-Impacts-Responses (DPSIR) model [5,6], Technique for Order of Preference by Similarity to Ideal Solution (TOPSIS) model [7,8], ecological footprint analysis [9], and environmental sustainability index. These methods can help to comprehensively understand the ecological status of the city, guide planning and management decisions, and improve the overall ecological security of the city [10]. However, each has its own advantages and disadvantages in the application process. For example, the DPSIR model introduces driving forces and influences and provides a more detailed causal chain, but the description of dynamic changes is limited. The TOPSIS model is relatively simple and has high computational efficiency, but the results may be sensitive to outliers or extreme data, which affects the stability of decision-making [11]. The Pressure-State-Response (PSR) model is based on a simple model structure, which makes it easy to understand and implement and can better reflect the causal relationship between nature, society, and economy [12,13]. Dai et al. [14] used a case study of Yunnan to apply the PSR model for constructing an ecological environment quality evaluation index system and tested its practical effectiveness. The results indicated that the overall ecological environment quality of the city improved, with decreasing pressure and state of the ecological environment, a significant and steady increase in the ecological response, and the system demonstrating good objectivity and distinction. Xiang et al. [15] showed that the ecological environment pressure in Ningbo was higher than the average of Zhejiang Province, and its ecological status and ecological response were roughly the same as the average of Zhejiang Province. Lai et al. [16] used the PSR model to analyze the ecological health status of Fuzhou in 2000, 2010, and 2020 and identified the main factors affecting ecological health, which provided a basis for proposing effective measures.
At present, the research objects of the PSR model mainly include ecologically fragile areas such as forests, lakes, wetlands, and land resources [17,18,19], and there is a lack of research on coal resource cities. Therefore, this paper takes the Pressure-State-Response (PSR) model as the main framework, constructing an ecological security evaluation index system according to the characteristics of Xuzhou’s resources and ecological environment. The GM (1,1) model is used to scientifically predict the ecological security index of Xuzhou from 2023 to 2028, analyzing the current status and development trends of the city’s natural resources and ecological environment. This research provides a methodological framework for historical evaluation and future prediction of ecological security in coal resource cities both in China and globally, offering theoretical insights for sustainable urban ecological development and ecosystem health management.
2. Study Area and Data Sources
2.1. Study Area
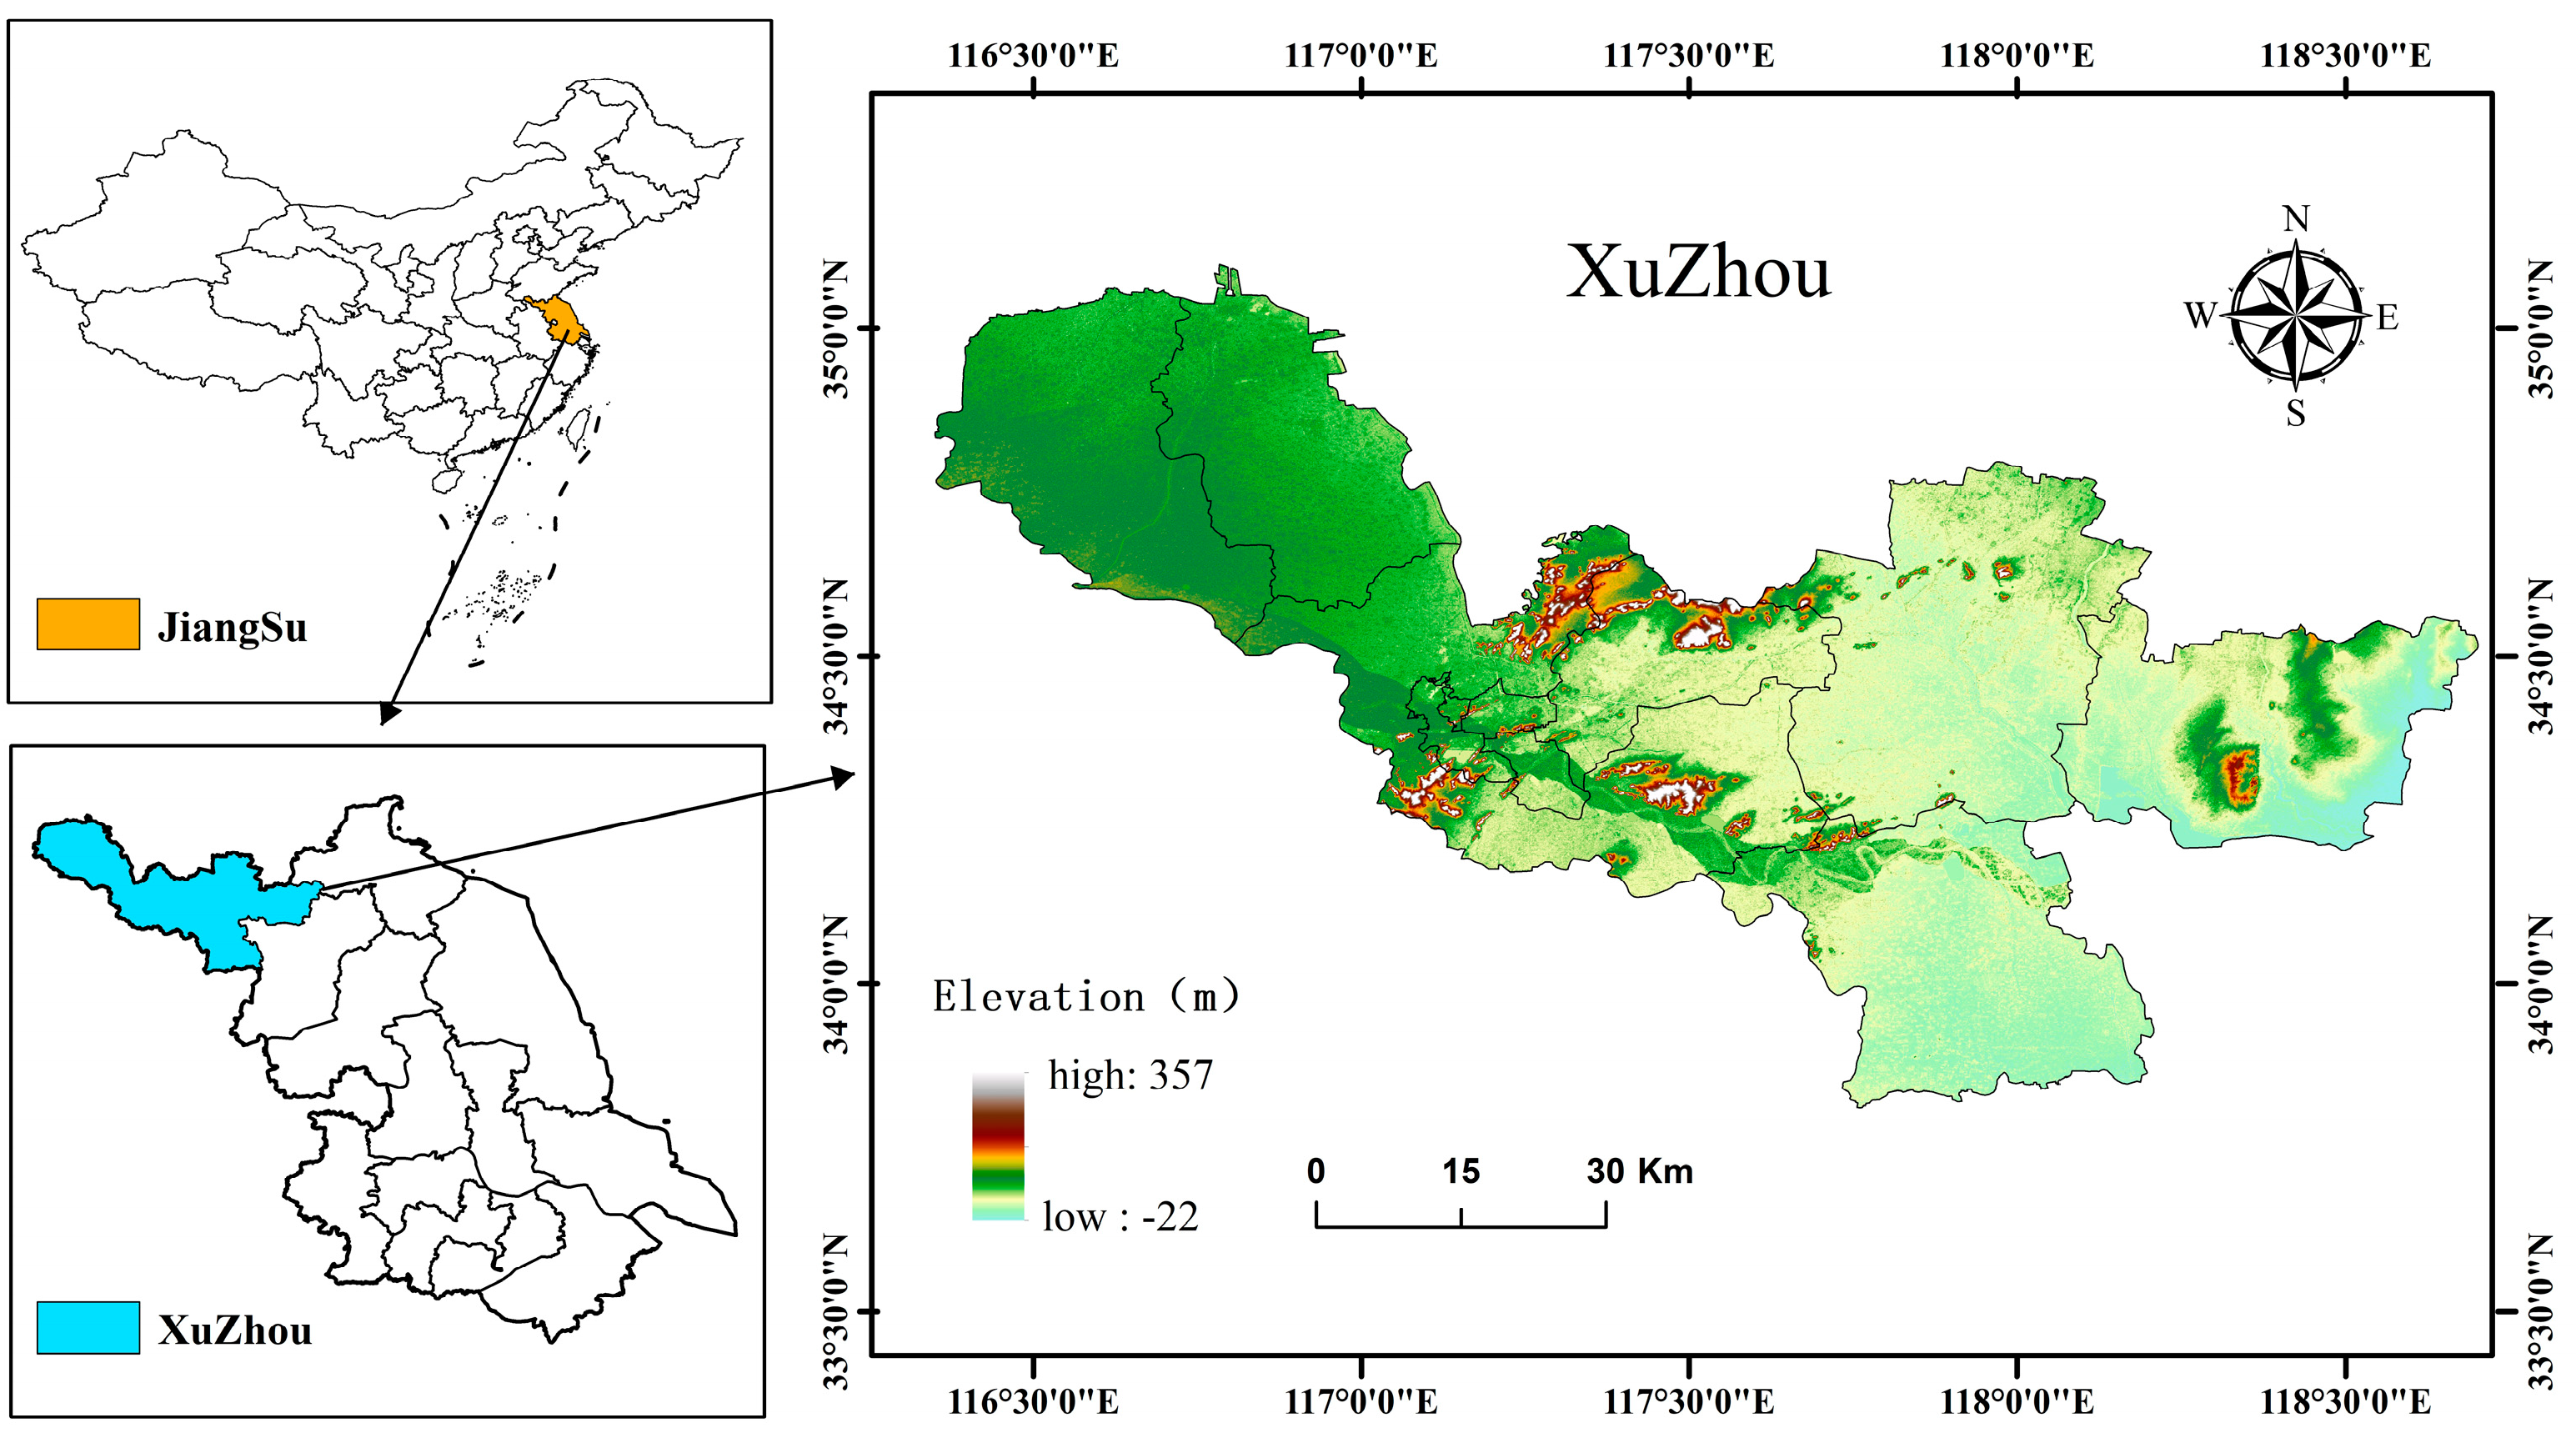
Xuzhou City is located in the northwest of Jiangsu Province, China, in the southeast of the North China Plain, with a longitude of 116°22′ to 118°40′ East and a latitude of 33°43′ to 34°58′ north. The topography is dominated by plains, accounting for 90% of the city’s area, with only a few hills and mountains in the central and eastern parts. The terrain is low and flat, the altitude is between 30 and 50 m, decreasing from northwest to southeast, and the geological structure is simple, as illustrated in Figure 1. Xuzhou City covers a total area of 11,258 km2, with a permanent population of 9,018,500 and an urbanization rate of 66.8%. From 2000 to 2022, the gross domestic product (GDP) increased from 61.63 billion yuan to 845.78 billion yuan, while per capita GDP rose from 34,192 yuan to 93,731 yuan [20]. Xuzhou is a typical coal resource-based city. While extensive coal mining has driven rapid urban development and economic prosperity, it has also led to significant drawbacks, including resource depletion and a sharp increase in subsidence areas. These issues pose severe threats to urban ecological security, resulting in a rigid industrial structure, insufficient endogenous development momentum, and increasing ecological and social conflicts. In recent years, the concept of ecological garden cities has been introduced. Xuzhou has transitioned from a mining-based economy to an ecological function city by incorporating large areas of abandoned mining sites into the urban ecological space. This transition aims to promote the restoration of fragmented habitats and repair urban ecological scars [21]. By 2022, the green coverage rate in the built-up areas of Xuzhou reached 43.8%, and the forest coverage rate reached 31.5%, demonstrating significant achievements in urban ecological civilization construction.

Figure 1.
Geographical location of Xuzhou.
2.2. Data Source
This study involves 30 evaluation indicators of Xuzhou, which mainly come from the China Urban Statistical Yearbook, Jiangsu Statistical Yearbook, Xuzhou Statistical Yearbook, Xuzhou Municipal Bureau of Statistics, Xuzhou Forestry Bureau, government reports, and related research papers [22]. For the missing data, the mean interpolation method is applied to fill gaps. This ensures the data accurately reflects the ecological security status of Xuzhou City in 2006–2022.
3. Research Methodology
3.1. Construction of Ecological Security Evaluation Index System
This study refers to the index system established by domestic and foreign urban system risk assessment research [23,24,25] and combines with the actual situation of Xuzhou to construct an ecological security evaluation system covering four aspects: economy, resources, ecological environment, and society, as shown in Table 1. As a city with a heavy industry background and rapid urbanization process, industrial activities are one of the main sources of pollution. Therefore, the “industrial wastewater discharge intensity” and “Industrial SO2 emission intensity” are selected as pressure indicators. The status index is used to describe the operating status and development quality of the urban ecosystem. According to the geographical and industrial characteristics of Xuzhou City, the “basic reserves of coal resources”, “excellent rate of urban air quality”, and “soil erosion intensity” were selected as the status indicators to better understand the changing trend of environmental quality. The response indicators characterize the measures taken by governments, enterprises, and other relevant entities to improve the quality of the ecological environment and ensure the stable development of urban ecosystems [26]. In this paper, the “proportion of investment in environmental protection to fiscal spending”, “comprehensive utilization rate of industrial solid waste”, and “disposal capacity of waste gas treatment facilities” were selected as response indicators. By continuously monitoring these indicators, the progress and challenges of ecological environmental protection in Xuzhou are evaluated, in order to provide a scientific basis for further policy formulation and environmental management.

Table 1.
Interpretation of indicators and data sources.
3.2. Weighting Method
This study uses a combined weighting method that integrates the Analytic Hierarchy Process (AHP) with the Entropy Weight Method to determine indicator weights. This method not only considers the artificial subjective judgment ranking based on actual experience but also considers the objective weight based on real data, which reduces the error caused by subjective and objective factors and makes the evaluation results more realistic [27,28].
Since each evaluation index generally has different dimensions and attributes, it is not possible to directly compare and calculate, and the data must be standardized [29,30]. The impact of indicators is divided into positive and negative. The higher the positive value, the safer the city. The formula for calculating standardized metrics is as follows:
The lower the negative value, the safer the city. The formula for calculating standardized metrics is as follows:
where Zij is the result of Xij’s normalized data, min (Xij) is the minimum value of the jth indicator, and max (Xij) is the maximum value of the jth indicator.
3.2.1. Analytic Hierarchy Process (AHP)
The Analytic Hierarchy Process (AHP) is a systematic method for solving complex decision-making problems, first introduced in the 1970s [31]. It decomposes complex problems into different hierarchical levels of goals, criteria, and alternatives [32]. By constructing a pairwise comparison matrix and conducting pairwise comparisons, the relative importance of each factor is determined, leading to the calculation of the priority of each alternative. The details are as follows: according to expert opinions, 1–9 indicators are used to quantify the relative importance of n indicators. The relative importance of the ith indicator (i = 1, 2, ..., n) relative to the jth indicator (j = 1, 2, ..., n) is expressed as aij = ωi /ωj, with ωi and ωj being weighted for the relative importance of indicators i and j, respectively. Construct the judgment matrix A according to Equation (3). Then, the sum product method is used to solve the eigenvector of the judgment matrix A, and is obtained, which is the weight value of each influencing factor of objective A. Finally, the maximum eigenvalue is obtained according to Equation (4).
The consistency test of the judgment matrix was carried out [33,34], and the consistency index CI was introduced as follows:
CI = 0, the judgment matrix has complete consistency; the higher the CI, the worse the consistency of the matrix.
In order to quantify the size of the CI of the consistency index, the mean random consistency index RI was introduced.
when the CR ≤ 0.1, the consistency of the judgment matrix is considered acceptable, and when the CR > 0.1, the judgment matrix is considered to be inconsistent, and it should be revised again until the consistency test is passed (Table 2).
Table 2.
Mean stochastic consistency indicator RI.
3.2.2. Entropy Weight Method
The entropy weight method mainly determines the weight of the index according to the degree of difference in the index data, which can not only eliminate the interference of human factors in the subjective weight but also avoid the problem of overlapping information between multiple indicators [35].
- (1)
- The entropy value of each evaluation index:
- (2)
- The weights of each evaluation index:
3.2.3. Combined Weight Method
The multiplier normalization method was used to calculate the composite weights.
3.3. Ecological Security Index
The value range of the ecological security index (ESI) is 0–1, which is an indicator to measure the stability and security of the ecosystem [36]. According to the evaluation results and the situation of the study area, the ecological security level of Xuzhou was obtained with full reference to the previous research results [37,38,39]. The classification is shown in Table 3.
Table 3.
Ecological security level measurement standards.
- (1)
- The ecological security index of each subsystem
- (2)
- Ecological security composite index
3.4. GM (1,1) Model Prediction
In this paper, the grey prediction GM (1,1) model is used to predict and analyze the future ecological security of the city. The basic idea of the grey prediction GM (1,1) model is to use the accumulation method to realize the non-linearization of time series data from non-linearity to linearity, so as to weaken the randomness of the series and enhance its regularity [40]. Compared with other prediction models, it requires less data while maintaining high prediction accuracy. The closer to the prediction period, the higher the prediction accuracy, which is suitable for ecological security prediction.
Firstly, the original sequence is accumulated to obtain a new sequence , and the first-order linear differential equation is established.
where a is the development coefficient of the series, which is used to control the development trend of the system; b is the endogenous control ash number, which is used to reflect the changing relationship of the data, both of which are the parameters estimated by the least squares method and t is the year.
The differential equation is solved to obtain the predicted value of the grey prediction GM (1,1) model.
The posterior difference method was used to verify the prediction accuracy of the grey prediction GM (1,1) model. The small error frequency P and the posterior difference ratio C are two important indicators for verifying the accuracy of the model by using the posterior difference method. A smaller C and a larger P indicate higher model accuracy [41]. The accuracy test of the posterior error is shown in Table 4.
Table 4.
Accuracy levels of the posterior difference method.
4. Results
4.1. Indicator Weight Analysis
After calculation, the weights of ecological security evaluation indicators in Xuzhou City are shown in Table 5. Among them, the weight of the response system occupies a large weight in the whole evaluation system. Among the 30 ecological security evaluation indicators, the weight of the three indicators of “disposal capacity of waste gas treatment facilities”, “per capita disposable income” and “agricultural fertilizer application intensity” is greater than 0.05. This indicates that these three indicators are the main influences on the stability of Xuzhou’s ecological security. Following these are indicators such as the “proportion of public service expenditure in fiscal spending” and the “gross output value of agriculture, forestry, animal husbandry, and fishery”. The lowest weight is for “urban population density”, at 0.0079. The wide range of weights in Xuzhou’s ecological security evaluation indicators indicates that the 30 selected indicators play different roles in the comprehensive assessment of ecological security in Xuzhou City. The significant differences in these weights reveal the relative importance of each indicator in maintaining the ecological security of Xuzhou. Some indicators have a more critical impact and contribution to the ecosystem, while others have a role but their impact is relatively small [42]. This not only helps to identify areas and factors that are critical to Xuzhou’s ecological security but also guides the prioritization of resources and efforts to ensure that the most critical and vulnerable issues can be focused on and addressed in the process of improving ecological security [43].
Table 5.
The weight of the ecological security evaluation index in Xuzhou City.
Therefore, based on this weight distribution, it is crucial to formulate targeted management measures and intervention strategies. Proper allocation of resources and enhanced ecological environment management will ensure ecological balance and promote sustainable development of Xuzhou City.
4.2. Evolutionary Characteristics of Urban Ecological Security
The article provides an ecological security evaluation model to assess the progress characteristics of Xuzhou’s urban ecological security from 2006 to 2022, aiming to comprehensively understand the state of the urban ecological environment and provide a scientific basis for its ecological security and sustainable development.
4.2.1. Ecological Security Composite Index
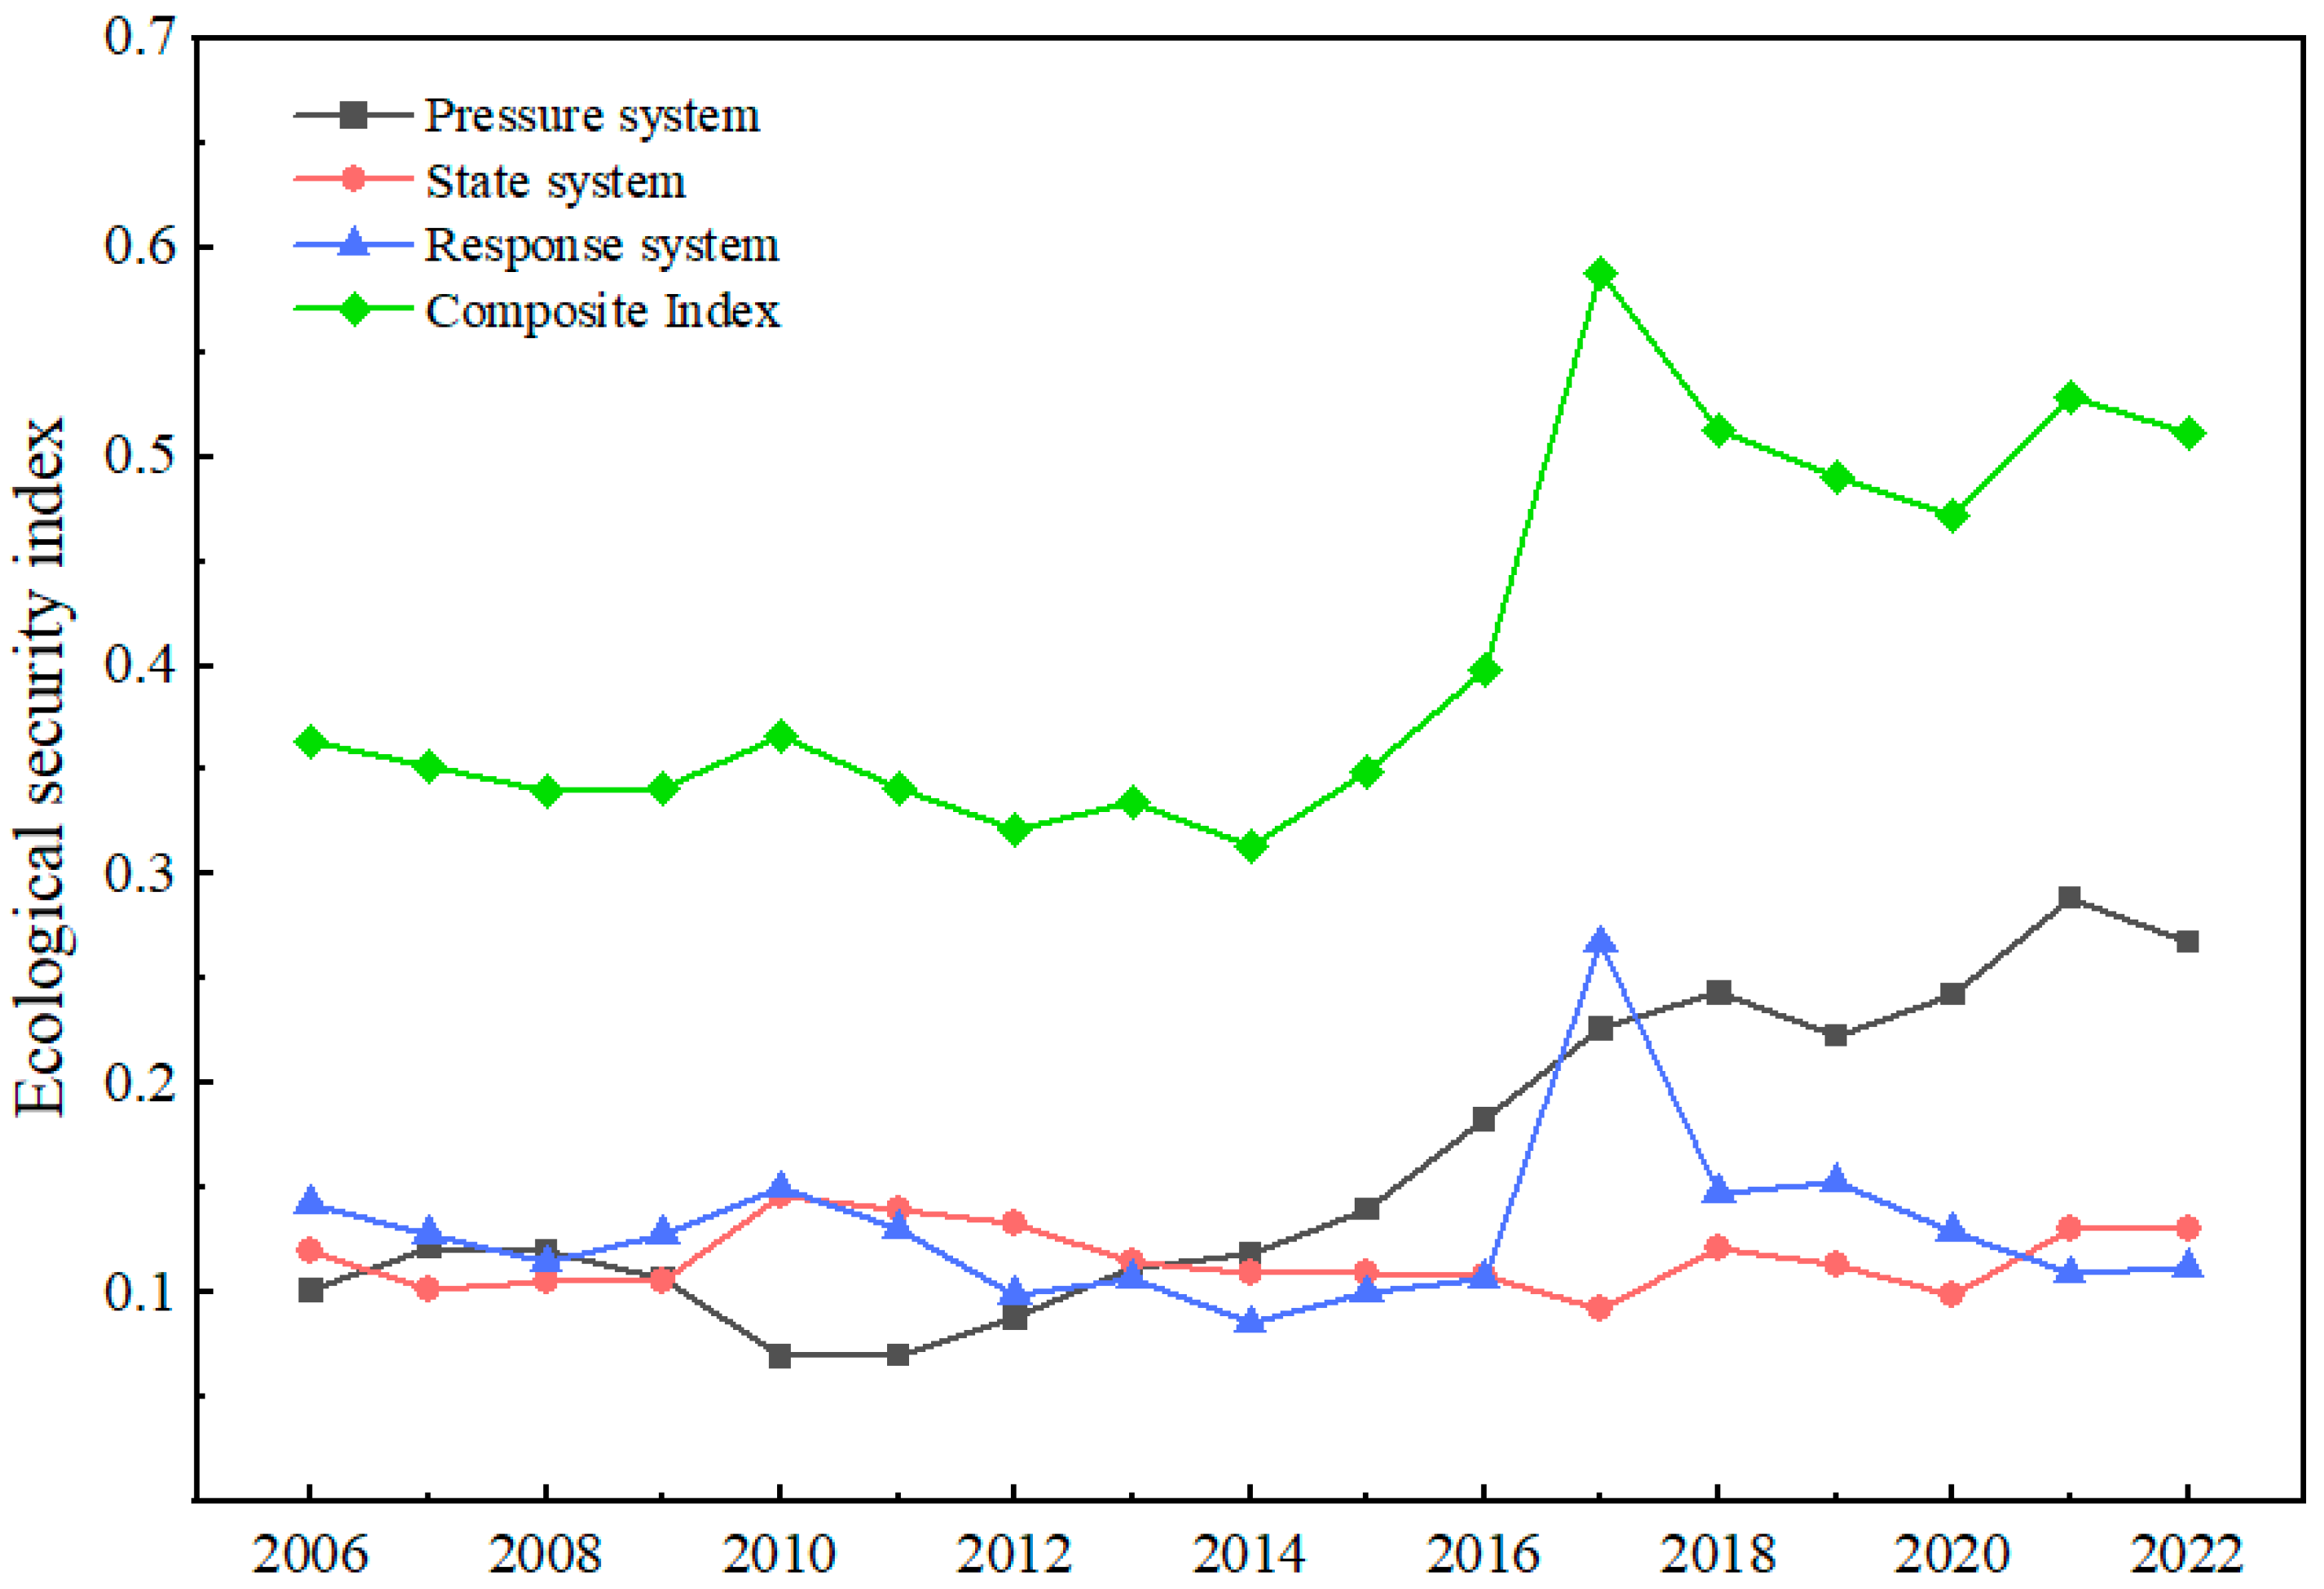
According to Figure 2, the overall trend of Xuzhou’s ecological security composite index from 2006 to 2022 is characterized by an initial increase followed by a decline and stabilization. Specifically, the index fluctuated between 2006 and 2016, spiked to a peak of 0.5874 in 2017 with an annual growth rate of 48%, and then slightly decreased. However, the subsequent overall fluctuations remained around 0.5. By analyzing the evaluation results of each element layer, it can be seen that the ecological security index of the response system increased significantly in 2017, and the response system occupies a large weight in the whole index system. In addition, according to the classification of ecological security levels in Table 4, from 2006 to 2011, the composite index of ecological security in Xuzhou was less than 0.4, which was in an “unsafe” state. In 2019 and 2020, the composite index of ecological security was 0.49 and 0.47, respectively, both of which were in the state of “critical security”. In 2017, 2018, 2021, and 2022, the composite index of ecological security was 0.59, 0.51, 0.53, and 0.51, respectively, all of which were in a “relatively safe” state. Overall, from 2006 to 2022, the ecological security situation in Xuzhou has developed from “unsafe” to “relatively safe”. This indicates that the ecological environmental protection and restoration measures implemented in recent years, such as river remediation, wetland restoration, and mine area rehabilitation, have restored the damaged ecosystem and improved its stability and function. Vigorously carry out special actions for pipeline management, focusing on reducing pollution, treating water, air, and soil, and improving environmental quality. Additionally, modern technology is being utilized to build a smart environmental protection system, enhancing the intelligence of environmental monitoring and management and allowing for timely identification and resolution of environmental issues. These measures have effectively promoted the gradual improvement of Xuzhou’s ecological security, achieving a balance between economic development and environmental protection, and continuously strengthening the urban ecological security system.
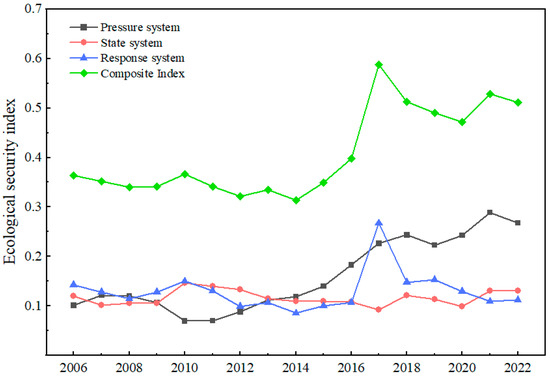
Figure 2.
Evolution characteristics of Xuzhou urban ecological security from 2006 to 2022.
4.2.2. Pressure Index
As shown in Figure 2, the ecological safety index of the pressure system (pressure index) generally showed a fluctuating upward trend, from 0.1012 in 2006 to 0.2678 in 2022, with an average annual growth rate of 8.4%. This indicates that with the rapid development of urbanization, Xuzhou is facing increasing ecological and environmental challenges. This is due to the continuous exploitation of coal resources and the increase in the degree of industrialization, which have led to excessive consumption of resources and aggravation of environmental pollution, thereby increasing the burden of urban ecological environment carrying capacity. However, the repeated fluctuations in the pressure index also reflect that the Xuzhou municipal government has implemented corresponding policies in resource regulation and environmental management. These measures, such as reducing industrial pollution emissions, have been introduced to address the increasing ecological pressure.
4.2.3. State Index
According to Figure 2, the state system ecological security index (state index) changes relatively steadily, and the overall average fluctuates around 0.12, which indicates that the contradiction between environment and economy still exists in the process of industrial transformation in Xuzhou, and the urban ecological environment needs to be further optimized and improved. Policymakers and relevant authorities must continue to monitor and improve the key indicators such as “Gross output value of agriculture, forestry, animal husbandry, and fishery” and “Basic reserves of coal resources” to promote Xuzhou’s development in a more prosperous, environmentally friendly, and sustainable direction.
4.2.4. Response Index
From Figure 2, we can see that there is a trend of synchronous changes between the response system ecological security index (response index) and the composite index. Between 2006 and 2016, coal mining in Xuzhou continued, while environmental governance policies lagged behind. This led to fluctuations in the ecological security index, with a significant decline in 2014. In response, the Xuzhou municipal government increased environmental remediation efforts in mining areas. For example, Jiawang District implemented a large-scale ecological restoration project, turning subsidence areas into wetlands and converting abandoned mines into ecological parks [44,45]. These efforts gradually restored the local ecosystem. As a result, the ecological security index peaked in 2017, reflecting the success of government policies and restoration projects. However, after 2018, the index began to decline, dropping from 0.1484 in 2018 to 0.1127 in 2022. This decline may be due to the revival of traditional industries during economic recovery, particularly in resource-intensive sectors, which increased environmental pressure. Additionally, urban expansion and large-scale infrastructure development posed new challenges, with issues such as soil erosion and air pollution reemerging. Although environmental protection continues to be emphasized at the policy level, several challenges may still arise during implementation, such as limited resources and the slow pace of industrial transformation, making it difficult to maintain the ecological security index at a high level.
4.3. Urban Ecological Security Prediction
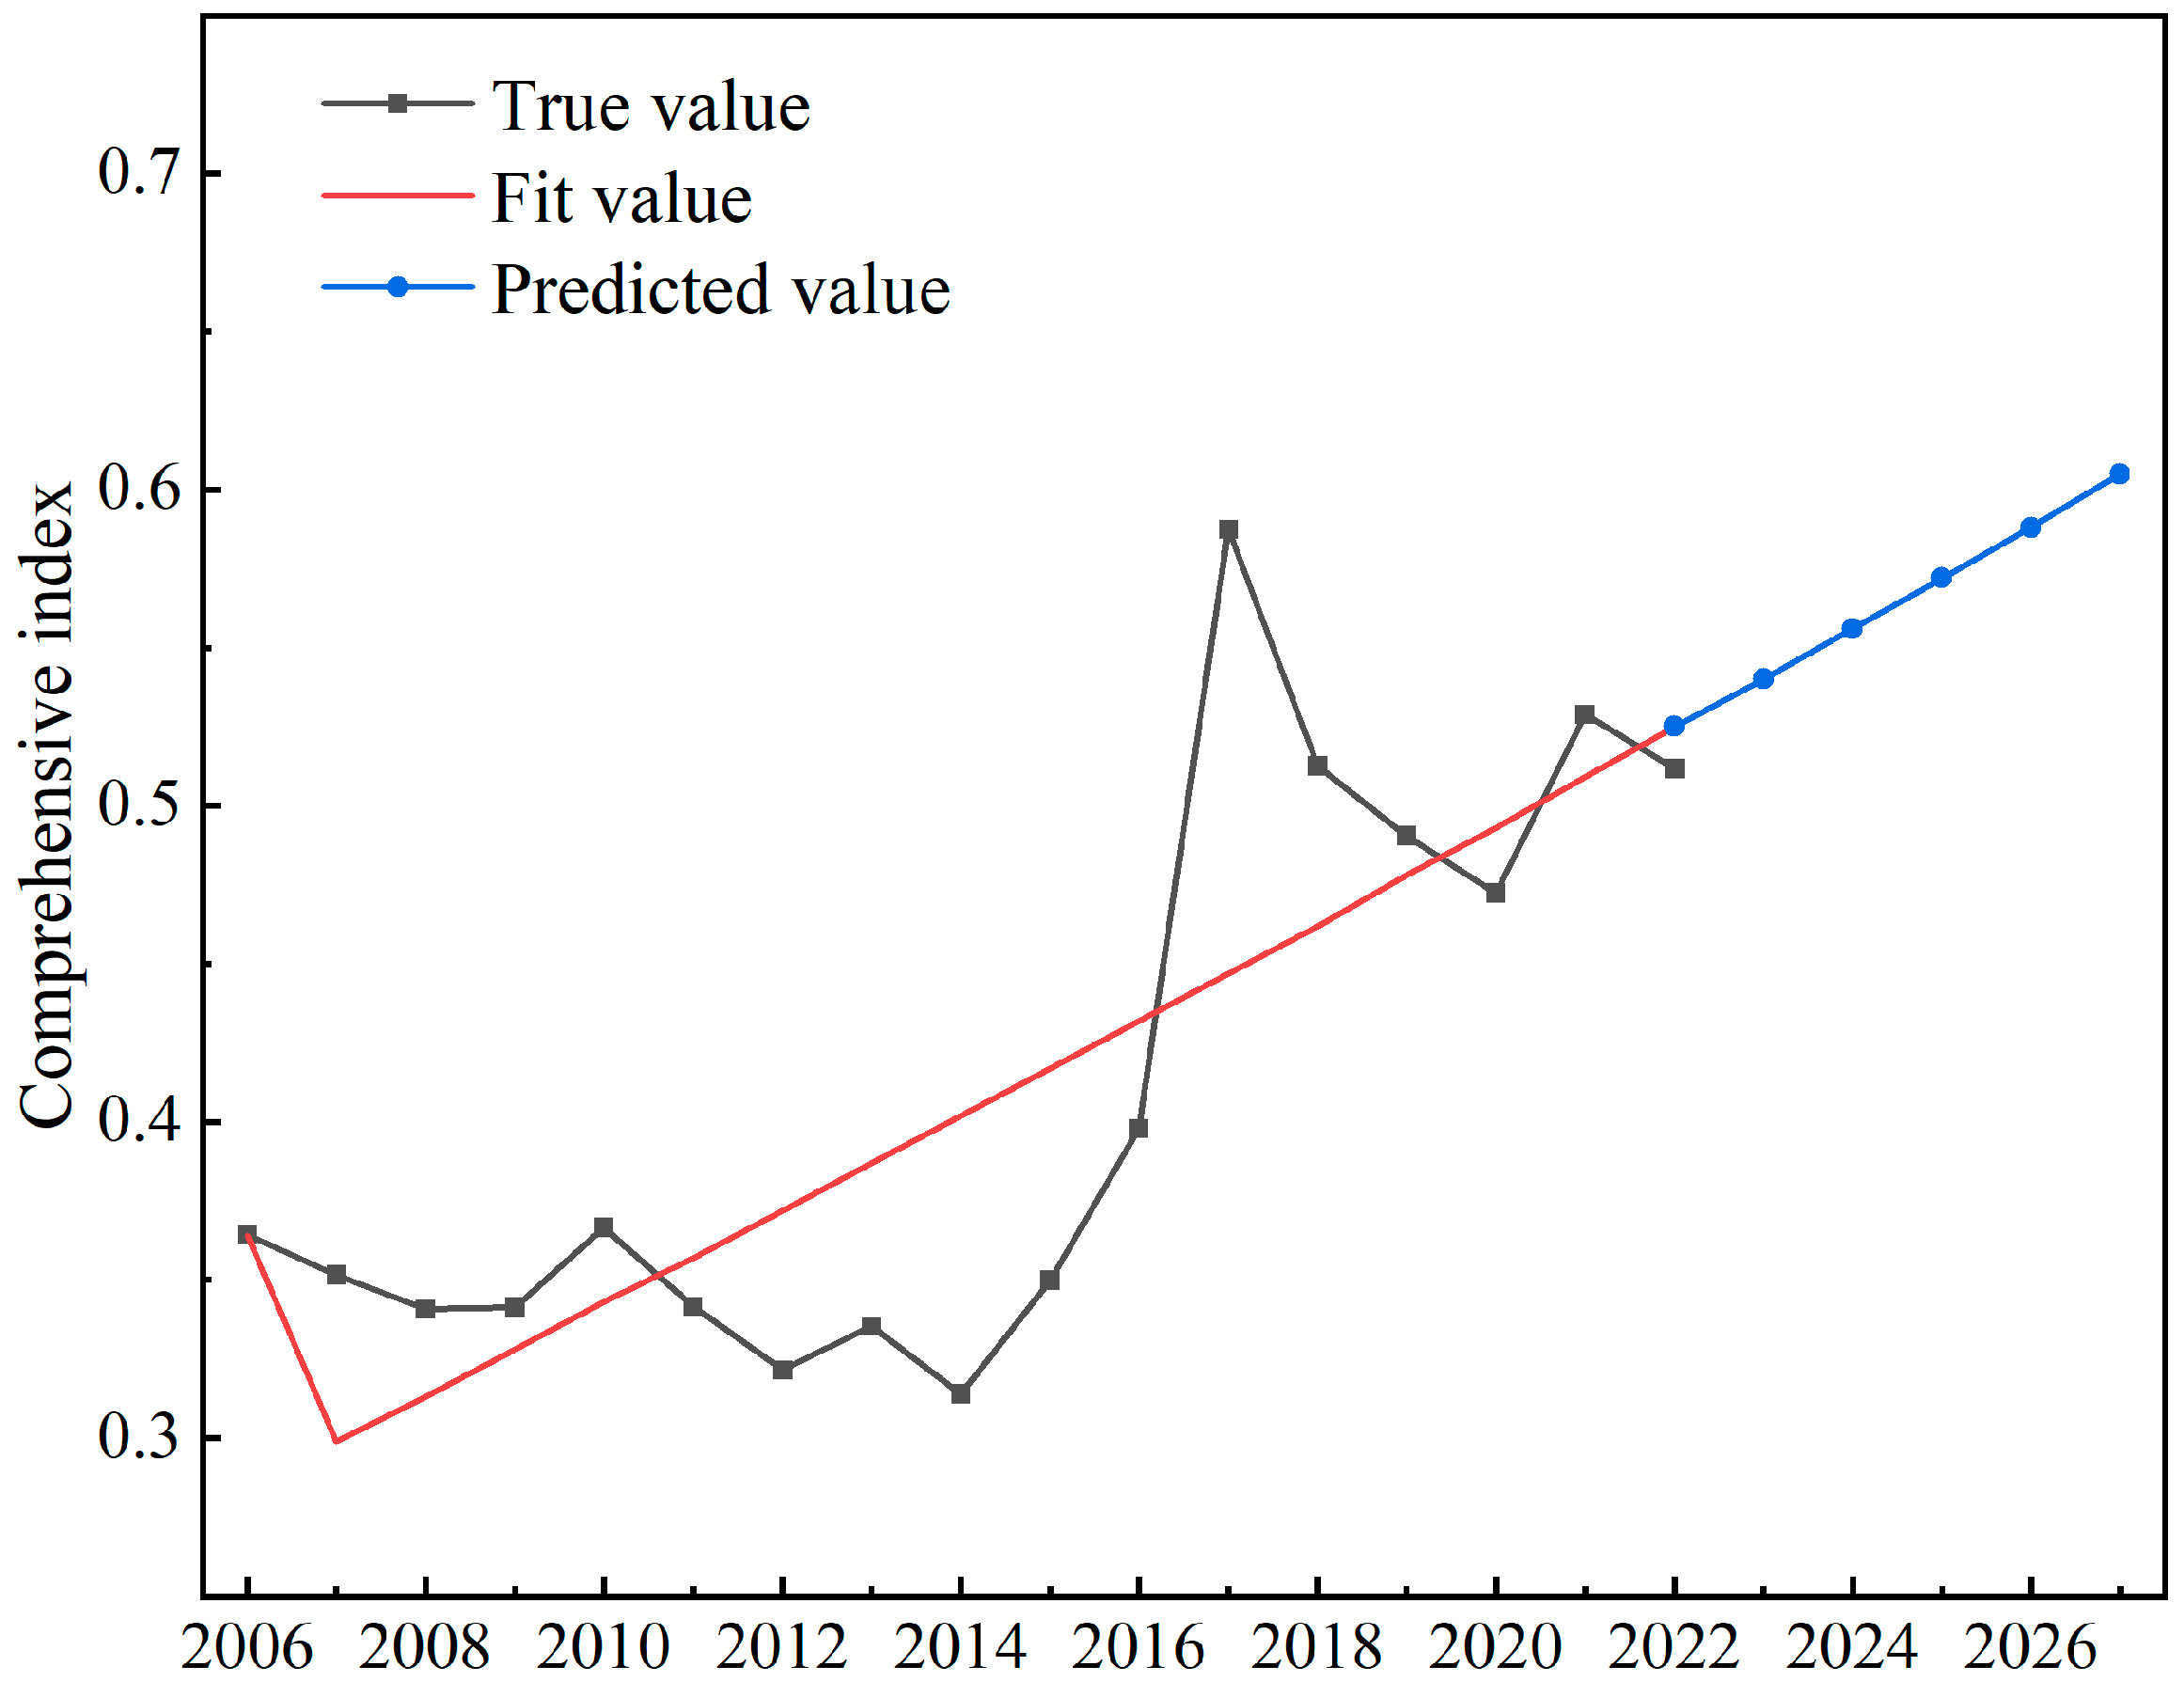
Taking the ecological security composite index of Xuzhou from 2006–2022 as the sample data, the gray prediction GM (1,1) model was solved by SPSSPRO, and the prediction accuracy of the model was tested by the posterior difference method. The results showed that the posterior difference ratio C was 0.372, the small error probability P was 1, and the accuracy level of the model was qualified. This suggests that the GM (1,1) grey prediction model is suitable for the evaluation and prediction of the ecological security comprehensive index of Xuzhou City.
As shown in Table 6 and Figure 3, the composite index of ecological security in Xuzhou will gradually increase from 0.54 in 2023 to 0.605 in 2027, and the ecological security level will increase from “relatively safe” to “ideal safe”. This shows that the environmental protection regulations and policies implemented by Xuzhou in the past period of time have been effective. For instance, the establishment of wetland protection zones has improved the ecological environment in surrounding areas, enhanced biodiversity, and reduced water pollution. The extensive construction of green belts around the city not only beautifies the urban environment but also effectively reduces air pollution and the heat island effect. The implementation of these policies and measures has enabled Xuzhou to achieve remarkable results in environmental protection and ecological restoration and has effectively promoted the significant improvement of Xuzhou’s ecological security.
Table 6.
Prediction results of Xuzhou ecological security composite index.
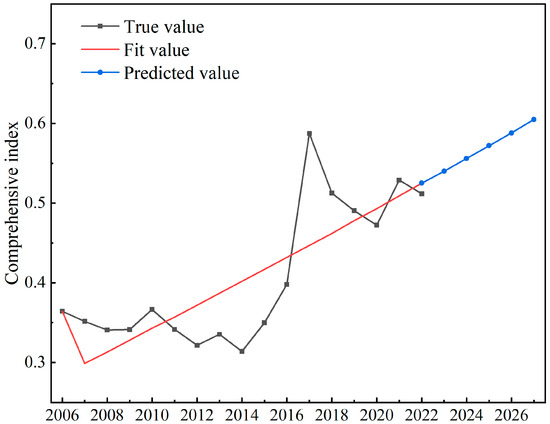
Figure 3.
Prediction of Xuzhou ecological security composite index.
5. Discussion
Based on the analysis of urban ecological security risk indicators, the top three main indicators were selected: disposal capacity of waste gas treatment facilities, per capita disposable income, and agricultural fertilizer application intensity. These are critical factors for improving the ecological security status of Xuzhou. Among them, waste gas treatment facilities and per capita disposable income are considered positive effect indicators. This indicates that the improvement of waste gas treatment facilities has a significant positive impact on urban ecological security. At the same time, the increase in per capita disposable income reflects an improvement in living standards, providing residents with more resources and capacity to participate in environmental protection activities, which indirectly promotes the protection of the urban ecological environment. On the other hand, agricultural fertilizer application intensity is a negative effect indicator, suggesting that the excessive use of fertilizers can lead to soil and water pollution, thus threatening ecological security. As a major agricultural city, some areas of Xuzhou have long relied on fertilizers to increase crop yields. In recent years, Xuzhou has been promoting green agricultural development by implementing several green agriculture policies, such as the “Zero Growth in Fertilizer Use” initiative [46]. This initiative promotes the use of organic fertilizers and precision fertilization techniques to reduce fertilizer usage. Xuzhou has also implemented soil testing and formulated fertilization technologies to help farmers apply fertilizers scientifically and reasonably, ensuring soil and ecosystem health.
Overall, the pressure and response indicators represent the shortcomings factors affecting Xuzhou’s urban ecological security, and improving the above three indicators is the key pathway to enhance Xuzhou’s ecological security, as follows. Firstly, upgrading pollution control measures in key industries, particularly in high-emission sectors such as steel and chemical manufacturing, is essential to ensure the efficient operation of exhaust gas treatment facilities. Secondly, optimizing the economic structure by developing a green economy and modern service industries can reduce environmental pressure and promote a positive interaction between the economy and the environment. Additionally, the government should strengthen environmental protection awareness campaigns, encouraging citizens to engage in environmental protection activities to enhance public environmental awareness. Lastly, efforts should be made to promote ecological restoration and green agricultural development, ensuring that ecological security and agricultural sustainability are pursued in tandem.
This paper employs a comprehensive weighting method that combines the Analytic Hierarchy Process (AHP) and the entropy weight method to determine index weights, addressing the instability of subjective weighting methods and improving evaluation quality to a certain extent. However, there is some overlap in the selection of indicators within the PSR model. For example, in the evaluation of urban ecological security, the “total population” in the pressure layer and the “forest area” in the state layer both reflect ecosystem pressure, leading to potential duplication and biased assessment results. Additionally, this study focuses on overall ecological quality but does not address the resilience to specific climate events, such as heavy rainfall or mudslides. Future studies can address these two points to further contribute to the development and improvement of ecological security.
6. Conclusions
Based on the PSR model, this paper constructs a comprehensive evaluation index system of ecological security in Xuzhou and analyzes the evolution characteristics of ecological security status and the prediction of urban ecological security. The main factors restricting its development were identified, and targeted countermeasures and suggestions were put forward. Taking Xuzhou as a case study, it is typical to analyze the ecological security regulation path of coal resource-based cities. At the same time, the methodology of urban ecological security evaluation and prediction can provide a good reference for the sustainable development of other urban ecological environments in the future. The following conclusions can be drawn.
- (1)
- Among the 30 evaluation indicators, the treatment capacity of waste gas treatment facilities, per capita disposable income, and agricultural fertilizer application intensity are the main factors affecting the ecological security and stability of Xuzhou City. Therefore, Xuzhou needs to pay close attention to these three indicators and actively carry out policy guidance, especially strengthening the real-time monitoring of exhaust emissions, reducing exhaust emissions, and improving the treatment efficiency of exhaust gas treatment facilities.
- (2)
- In 2006–2022, the comprehensive index generally showed a changing trend of first rising and then declining to stable, of which the highest was 0.5874 in 2017, with an average annual growth rate of 48%, and then decreased slightly. From the perspective of health level, the ecological security status of Xuzhou City has developed from “unsafe” to “relatively safe”. The pressure index generally showed a fluctuating upward trend, and the state index fluctuated around 0.12. There is a trend of synchronous change between the response index and the composite index.
- (3)
- The grey prediction model GM (1,1) was used to predict the ecological security composite index of Xuzhou City in 2023–2027, and the results showed that the composite index will maintain an upward trend in the future, from 0.54 in 2023 to 0.605 in 2027, and the ecological security level will increase from “relatively safe” to “ideal safety”. Therefore, it is recommended that local policymakers continue to implement sustainable development policies to support this positive trend.
Author Contributions
Conceptualization, D.Y.; methodology, Z.S.; data curation, N.Z.; writing—original draft preparation, Z.S. and N.Z.; writing—review and editing, Z.S.; supervision, D.H. All authors have read and agreed to the published version of the manuscript.
Funding
The work was supported by “special fund for promoting scientific and technological innovation in Xuzhou in 2023 (policy guidance program for soft science research, KC23089)”, “special fund for promoting scientific and technological innovation in Xuzhou in 2022 (key research and development plan (modern agriculture)—general project, KC22075)” and “the Key Project of Joint Funds of the National Natural Science Foundation of China” (No. U2003103).
Data Availability Statement
Data are available from the corresponding author upon request.
Conflicts of Interest
The authors declare no conflicts of interest.
References
- Li, X.Z.; Xu, Z.G.; Fu, Y.Y.; Jin, Q.; Zhao, Y.L.; Xiong, N.N. Ecological security evaluation algorithm for resource-exhausted cities based on the PSR model. CMC Comput. Mater. Contin. 2021, 69, 985–1001. [Google Scholar] [CrossRef]
- Nie, X.R.; Hu, Z.Q.; Ruan, M.Y.; Zhu, Q.; Sun, H. Remote-Sensing Evaluation and Temporal and Spatial Change Detection of Ecological Environment Quality in Coal-Mining Areas. Remote Sens. 2022, 14, 345. [Google Scholar] [CrossRef]
- Du, P.J.; Xia, J.S.; Du, Q.; Luo, Y.; Tan, K. Evaluation of the spatio-temporal pattern of urban ecological security using remote sensing and GIS. Int. J. Remote Sens. 2013, 34, 848–863. [Google Scholar] [CrossRef]
- Subrata, G.; Nilanjana, D.C.; Santanu, D. Urban ecological security assessment and forecasting using integrated DEMATEL-ANP and CA-Markov models: A case study on Kolkata Metropolitan Area, India. Sustain. Cities Soc. 2021, 68, 102773. [Google Scholar]
- Zhao, M.D.; Wei, J.H.; Han, Y.P.; Shi, J.H.; Wang, S.B. Water resource security evaluation and barrier analysis in Henan Province utilizing the DPSIR framework. Front. Environ. Sci. 2024, 12, 1354175. [Google Scholar] [CrossRef]
- Alexakis, D.E. Linking DPSIR model and water quality indices to achieve sustainable development goals in groundwater resources. Hydrology 2021, 8, 90. [Google Scholar] [CrossRef]
- Lu, J.H.; Wang, X.S.; Xiao, H.; Ma, Y.L.; Man, Z. Evaluation of comprehensive benefits of water resources in Zhengzhou based on TOPSIS. J. North China Univ. Water Resour. Electr. Power 2021, 42, 49–54. [Google Scholar]
- Mandal, T.; Saha, S.; Das, J.; Sarkar, A. Groundwater depletion susceptibility zonation using TOPSIS model in Bhagirathi River basin, India. Model. Earth Syst. Environ. 2021, 8, 1711–1731. [Google Scholar] [CrossRef]
- Lu, Y.H.; Yan, L.J.; Li, G.; Ma, W.W.; Liang, Y.L. Ecological security evaluation based on emergy-ecological footprint model at the northern farming-pastoral ecotone in Dingxi city. Agric. Res. Arid. Areas 2023, 41, 257–265. [Google Scholar]
- Azimifard, A.; Moosavirad, S.H.; Ariafar, S. Selecting sustainable supplier countries for Iran’s steel industry at three levels by using AHP and TOPSIS methods. Resour. Policy 2018, 57, 30–44. [Google Scholar] [CrossRef]
- Li, Z.; Yuan, M.; Hu, M.; Wang, Y.; Xia, B. Evaluation of ecological security and influencing factors analysis based on robustness analysis and the BP-DEMALTE model: A case study of the Pearl River Delta urban agglomeration. Ecol. Indic. 2019, 101, 595–602. [Google Scholar] [CrossRef]
- Hukkinen, J. Sustainability indicators for anticipating the fickleness of human-environmental interaction. In Technological Choices for Sustainability; Springer: Berlin/Heidelberg, Germany, 2004; pp. 317–333. [Google Scholar]
- Li, Z.C.; Liu, L.D.; Sun, Y.F.; Cui, J.R. Assessment method of regional ecological security based on pressure-state-response model. Acta Ecol. Sin. 2010, 30, 6495–6503. [Google Scholar]
- Dai, C.L.; Guo, A.J.; Fu, Y.X.; Huang, W. Construction of ecological environment quality evaluation index from the perspective of natural resource audit. Friends Account. 2021, 13, 125–132. (In Chinese) [Google Scholar]
- Xiang, Z.Y.; Zou, X.L.; Chen, J.P. Study on the construction of ecological environment evaluation index system of Ningbo city based on geographical condition monitoring. Bull. Surv. Mapp. 2018, 6, 98–103. [Google Scholar]
- Lai, S.; Sha, J.; Eladawy, A.; Li, X.; Wang, J.; Kurbanov, E.; Lin, Z.; Wu, L.; Han, R.; Su, Y.C. Evaluation of ecological security and ecological maintenance based on pressure-state-response (PSR) model, case study: Fuzhou city, China. Hum. Ecol. Risk Assess. Int. J. 2022, 28, 734–761. [Google Scholar] [CrossRef]
- Liu, Y.J.; Yang, P.; Zhang, S.Q.; Wang, W.Y. Dynamic identification and health assessment of wetlands in the middle reaches of the Yangtze River basin under changing environment. J. Clean. Prod. 2022, 345, 131105. [Google Scholar] [CrossRef]
- Gayen, J.; Datta, D. Application of pressure–state–response approach for developing criteria and indicators of ecological health assessment of wetlands: A multi-temporal study in Ichhamati floodplains, India. Ecol. Process. 2023, 12, 34. [Google Scholar] [CrossRef]
- Raj, A.; Sharma, L.K. Spatial E-PSR modelling for ecological sensitivity assessment for arid rangeland resilience and management. Ecol. Model. 2023, 478, 110283. [Google Scholar] [CrossRef]
- Li, C.L. Analysis on Variation Characteristics of Ozone and Correlation with Meteorological Elements in Urban Atmosphere of Xuzhou. Environ. Sci. Manag. 2018, 43, 77–81. [Google Scholar]
- Hansen, M.H.; Li, H.T.; Svarverud, R. Ecological civilization: Interpreting the Chinese past, projecting the global future. Glob. Environ. Change 2018, 53, 195–203. [Google Scholar] [CrossRef]
- Chen, B.Z.; Qu, J.F.; Ge, M.Y.; Shen, Y.W.; Wan, A.N.; Wang, G.B. Spatio-temporal analysis on soil erosion over Xuzhou city. J. Geo Inf. Sci. 2018, 20, 1622–1630. [Google Scholar]
- Sobhani, P.; Esmaeilzadeh, H.; Wolf, I.D.; Deljouei, A.; Marcu, M.V.; Sadeghi, S.M.M. Evaluating the ecological security of ecotourism in protected area based on the DPSIR model. Ecol. Indic. 2023, 155, 110957. [Google Scholar] [CrossRef]
- Wang, D.; Li, Y.; Yang, X.; Zhang, Z.; Gao, S.; Zhou, Q.; Zhuo, Y.; Guo, Z. Evaluating urban ecological civilization and its obstacle factors based on integrated model of PSR-EVW-TOPSIS: A case study of 13 cities in Jiangsu Province, China. Ecol. Indic. 2021, 133, 108431. [Google Scholar] [CrossRef]
- Tian, S.; Zhang, Y.; Xu, Y.; Wang, Q.; Yuan, X.; Ma, Q.; Chen, L.; Ma, H.; Xu, Y.; Yang, S.; et al. Urban ecological security assessment and path regulation for ecological protection—A case study of Shenzhen, China. Ecol. Indic. 2022, 145, 109717. [Google Scholar] [CrossRef]
- Xie, H.L.; Li, B. A study on indices system and assessment criterion of ecological security for city. J. Beijing Norm. Univ. Nat. Sci. Ed. 2004, 40, 705–710. [Google Scholar]
- Zou, Y.; Dong, J.G.; Liu, J.J.; Ji, H.Y.; Wang, X.T. Study on classification and identification technology of shallow groundwater quality in Fucheng relic site. Environ. Sci. Technol. 2019, 42, 217–225. [Google Scholar]
- Qazi, W.A.; Abushammala, M.F.; Azam, M.H. Multi-criteria decision analysis of waste-to-energy technologies. Waste Manag. Res. 2018, 36, 594–605. [Google Scholar] [CrossRef]
- Liu, Y.T.; Tang, Y.; Ma, Z.W. Performance evaluation of permit system of pollutant discharge in the Taihu lake basin of Jiangsu province: A case study of printing and dyeing industry. Environ. Sci. Technol. 2021, 44, 220–227. [Google Scholar]
- Bernhard, W.; Harald, V. Evaluating sustainable forest management strategies with the Analytic Network Process in a Pressure-State-Response framework. J. Environ. Manag. 2008, 88, 1–10. [Google Scholar]
- Saaty, T. A scaling method for priorities in hierarchical structures. J. Math. Psychol. 1997, 15, 234–281. [Google Scholar] [CrossRef]
- Das, M.; Das, A.; Pandey, R. Importance-performance analysis of ecosystem services in tribal communities of the Barind region, Eastern India. Ecosyst. Serv. 2022, 55, 101431. [Google Scholar] [CrossRef]
- Yang, M.H.; Yuan, P.Y.; Luo, T.L.; Wen, L.J.; Liu, G. Assessment of the environmental risk of the industrial parks of Yibin section of the upper reaches of the Yangtze River based on analytic hierarchy process. J. Environ. Eng. Technol. 2022, 12, 624–632. [Google Scholar]
- Kim, S.; Lee, S.W.; Park, S.R.; Shin, Y.; An, K. Socioeconomic risks and their impacts on ecological river health in South Korea: An application of the analytic hierarchy process. Sustainability 2021, 13, 6287. [Google Scholar] [CrossRef]
- Wu, K.Y.; Hu, S.H.; Sun, S.Q. Application of fuzzy optimization model in ecological security pre-warning. Chin. Geogr. Sci. 2005, 15, 29–33. [Google Scholar] [CrossRef]
- Xie, X.; Fang, B.; Li, X.; He, S.S. Urban ecosystem health assessment and obstacle factor diagnosis using a comprehensive assessment model for Nanjing, China. Growth Change 2021, 52, 1938–1954. [Google Scholar] [CrossRef]
- Bai, X.R.; Tang, J.C. Ecological security assessment of Tianjin by PSR model. Procedia Environ. Sci. 2010, 2, 881–887. [Google Scholar] [CrossRef]
- Zhang, R.; Li, P.; Xu, L. Evaluation and analysis of ecological security based on the improved three-dimensional ecological footprint in Shaanxi Province, China. Ecol. Indic. 2022, 144, 109483. [Google Scholar] [CrossRef]
- Qiu, W.; Zhao, Q.L.; Li, S.; Zhang, J.Q. Ecological security evaluation of Heilongjiang province with pressure-state-response model. Environ. Sci. 2008, 29, 1148–1152. [Google Scholar]
- Han, L.; Pan, Y.J.; Gao, Q.Y.; Ma, J.S. Evaluation and prediction of the cultivated land ecological security in Yunnan province based on PSR and unbiased GM (1,1) Model. Ecol. Econ. 2019, 35, 148–154. [Google Scholar]
- Lu, G.Z.; Pang, X.Y.; Hou, J.W.; Hao, J. Evaluation and prediction of ecological security in Shizuishan City based on PSR model. J. Saf. Environ. 2023, 23, 3784–3792. [Google Scholar]
- Zhu, L.; Cao, M.Y.; Liu, R.J. Evaluation of energy transition and barrier factors in coal resource cities under carbon neutral and peak carbon goals. Environ. Sci. 2024, accepted. [Google Scholar]
- Dong, W.J.; Tao, Y.R.; Pang, Y.; Xu, Q.J.; Yu, X.M. Ecological health assessment and main influencing factors of Lake Taihu Basin based on PSR model. J. Environ. Eng. Technol. 2024, 14, 846–855. [Google Scholar]
- Xu, J.; Yin, P.; Hu, W.; Fu, L.; Zhao, H. Assessing the ecological regime and spatial spillover effects of a reclaimed mining subsided lake: A case study of the Pan’an Lake wetland in Xuzhou. PLoS ONE 2020, 15, e0238243. [Google Scholar] [CrossRef] [PubMed]
- Ni, Q.L.; Hou, H.P.; Ding, Z.Y.; Li, Y.B.; Li, J.R. Ecological remediation zoning of territory based on the ecological security pattern recognition: Taking Jiawang district of Xuzhou city as an example. J. Nat. Resour. 2020, 35, 204–216. [Google Scholar]
- Li, L. Research on Comprehensive Evaluation and Promotion Path of Xuzhou Ecological Environment Quality. Master’s Thesis, China University of Mining and Technology, Xuzhou, China, 2020. [Google Scholar]
Disclaimer/Publisher’s Note: The statements, opinions and data contained in all publications are solely those of the individual author(s) and contributor(s) and not of MDPI and/or the editor(s). MDPI and/or the editor(s) disclaim responsibility for any injury to people or property resulting from any ideas, methods, instructions or products referred to in the content. |
© 2024 by the authors. Licensee MDPI, Basel, Switzerland. This article is an open access article distributed under the terms and conditions of the Creative Commons Attribution (CC BY) license (https://creativecommons.org/licenses/by/4.0/).