Article

Morpho-Hydrological Analysis and Preliminary Flash Flood Hazard Mapping of Neom City, Northwestern Saudi Arabia, Using Geospatial Techniques

Department of Civil Engineering, College of Engineering, King Saud University, P.O. Box 800, Riyadh 11421, Saudi Arabia
*
Author to whom correspondence should be addressed.
Sustainability 2024, 16(1), 23; https://doi.org/10.3390/su16010023
Submission received: 9 October 2023 / Revised: 8 December 2023 / Accepted: 15 December 2023 / Published: 19 December 2023

Abstract

:
Neom city is a unique cross-border city connecting Saudi Arabia, Jordan, and Egypt. Although Neom city is of great and critical importance for Saudi Arabia, few hydrological, natural hazard, and geomorphological studies have been undertaken on this region. This work aims to investigate the hydro-geomorphological characteristics and assess the flash flood hazards in Neom city by investigating several valuable morphometric parameters. The Shutter Radar Topography Mission (SRTM) digital elevation model and hydrological and geological data were analyzed in this study using ArcGIS software. Based on the morphometric parameter results, total stream lengths and stream orders were relatively high (17,956.03 km and 5, respectively), whereas the average bifurcation ratio was recorded to be low at 3.54. Basins 10, 12, 17, 30, 31, 32, and 34 were described as large basins, coarse-textured, elongated, with a medium drainage density, low infiltration values, long overland flows, and high values of constant maintenance. Additionally, the El-Shamy approach for flood hazard assessment was applied side by side with the morphometric analysis, which indicated that the possibility of an intense flood hazard is very low. In general, this study suggests that most of the studied basins cover similar and resistant rocks and soils. They have minimal conditions for flooding events and suitable conditions for underground and surface water resources. Therefore, they display high signals of susceptibility to erosion. The morphometric analysis and flash flood assessment techniques applied in this study were time- and cost-effective for the morphometric characterization of landforms. This text deals with the analysis of several environmental characteristics including hydro-morphological characteristics, drainage topography and lithology, soil erosion, groundwater recharge impact, and flash flood signals. Excellent sustainability plans should be reliant on extensive and varied information about the environment. Thus, integrated analyses incorporating environmental characteristics and flood hazard assessment play an important role in adjusting and adapting the suitable socioeconomic and scientific sustainability of the development of the study city. They build up the basic and essential information required to help decision-makers and sustainability managers design and adjust the most suitable sustainability plans for the study city over the long term.

1. Introduction

Neom city in Saudi Arabia is being prepared as an effective laboratory for environmental conservation, an economic center for the region, and a convenient place for ideal living conditions [1]. Morphometric characteristics affect different basin processes [2,3], mainly showing hydrology and geomorphology features and presenting comprehensive models on the prospects for water resource management and assessment [4,5]. In a river basin, hydrological processes generally control the spatiotemporal distribution of water resources (groundwater and surface runoff) and, accordingly, potential water resources that are related to basin developments [6]. For large-scale water projects, long-term success is mainly dependent on the general hydrological characteristics of the main rivers in the project area. An easily understandable and comprehensible plan of hydrological behaviors and processes is highly recommended for the appropriate management and planning of water resource projects [6,7]. Flash floods usually happen suddenly in arid areas as a result of huge quantities of rainfall, which cause significant loss of life and property [8]. Comprehensive flash flood maps are easily read and effectively aid in the mitigation of the harmful effects of different kinds of floods [9].
Recently, modern techniques and data, including remote sensing, GIS, and satellite images with various spatial resolutions, along with different datasets of digital elevation models, have been successfully implemented in science and engineering applications [10,11,12]. In particular, applying geospatial analysis techniques to remote digital elevation model (DEM) data is a very effective strategy for understanding different hydrological conditions and the distribution of morphometric characteristics [13,14]. Hydrological and flood hazard assessment studies generally depend on the analysis of digital elevation model data [15,16]. The analysis of drainage networks and basin morphometries presents important insights into the evaluation of various hydrological conditions [6,17]. As a morphometric analysis involves applying mathematical processes to studying the morphology and dimensions of the earth’s surface, calculating drainage and basin parameters from DEM data is the most precise and efficient technique used in the majority of hydrological assessment studies [15,18]. Despite the significant usefulness of quantitative morphometric analysis in many critical disciplines (e.g., tectonic geomorphology, geological hazards, water resources management, and fault analysis) [19,20], there are no reports on a comprehensive model for quantifying drainage based on the morphometric analysis and hydro-morphological characteristics of Neom city. Additionally, Neom city represents a project of great strategic value, and the current study helps in adjusting and supporting development plans, particularly those for mitigating natural hazards.
Although scientists have provided important problem-solving keys to move toward an ideal and sustainable environment, several challenges stand to prevent our modern environments from becoming more effective and sustainable. Sustainability plans are mostly applied based on analyses of a range of environmental information and data. Providing extensive knowledge and comprehensive models of environmental characteristics and conditions aids our understanding of variations in environmental activity and evolution. Additionally, presenting reliable predictions of natural hazards—including flash floods, which have multiple causes due to hydrological characteristics and stream morphology—may aid in building effective and sustainable plans for flood hazard management technologies and strategies. In this text, several environmental variations were taken into account including basin hydro-geomorphology, drainage morphology and topography, soil erosion, basin lithology, and groundwater recharge impact. Hydro-morphological information is very useful for the development of the study city. The hydro-morphological data, together with other investigated factors, will help decision-makers select suitable positions for water supplies and natural resources. In addition, one effective method was run for initial flash flood mapping of the study city. Preventing and controlling flash flooding is a considerable item in most future sustainability plans. Therefore, the results of this study present an excellent environmental library that provides all the basic and necessary information and knowledge about future socioeconomic, ecological, and environmental sustainability management plans.
The current paper mainly attempts to present, for the first time, a complete and comprehensive model of one of the most promising large-scale mega-projects along the boundaries between the Asian and African continents by quantifying the most valuable morphometric parameters and hydro-morphometric characteristics. Thus, this work aims to establish a quantifying morphometric model of Neom city using morphometric parameters and geospatial analysis. An additional aim is to examine and characterize the hydrology, topography, and geology of the proposed area based on the different computed morphometric parameter groups (linear, areal, and relief parameter groups). It also aims to provide information on the flood-prone region and the mitigation models and plans using an effective method of flood hazard assessment. The valuable results in this paper could guide other researchers in building a comprehensive model for water resource management and planning and help decision-makers in the mitigation of flash flood hazards.

2. Study Area Description
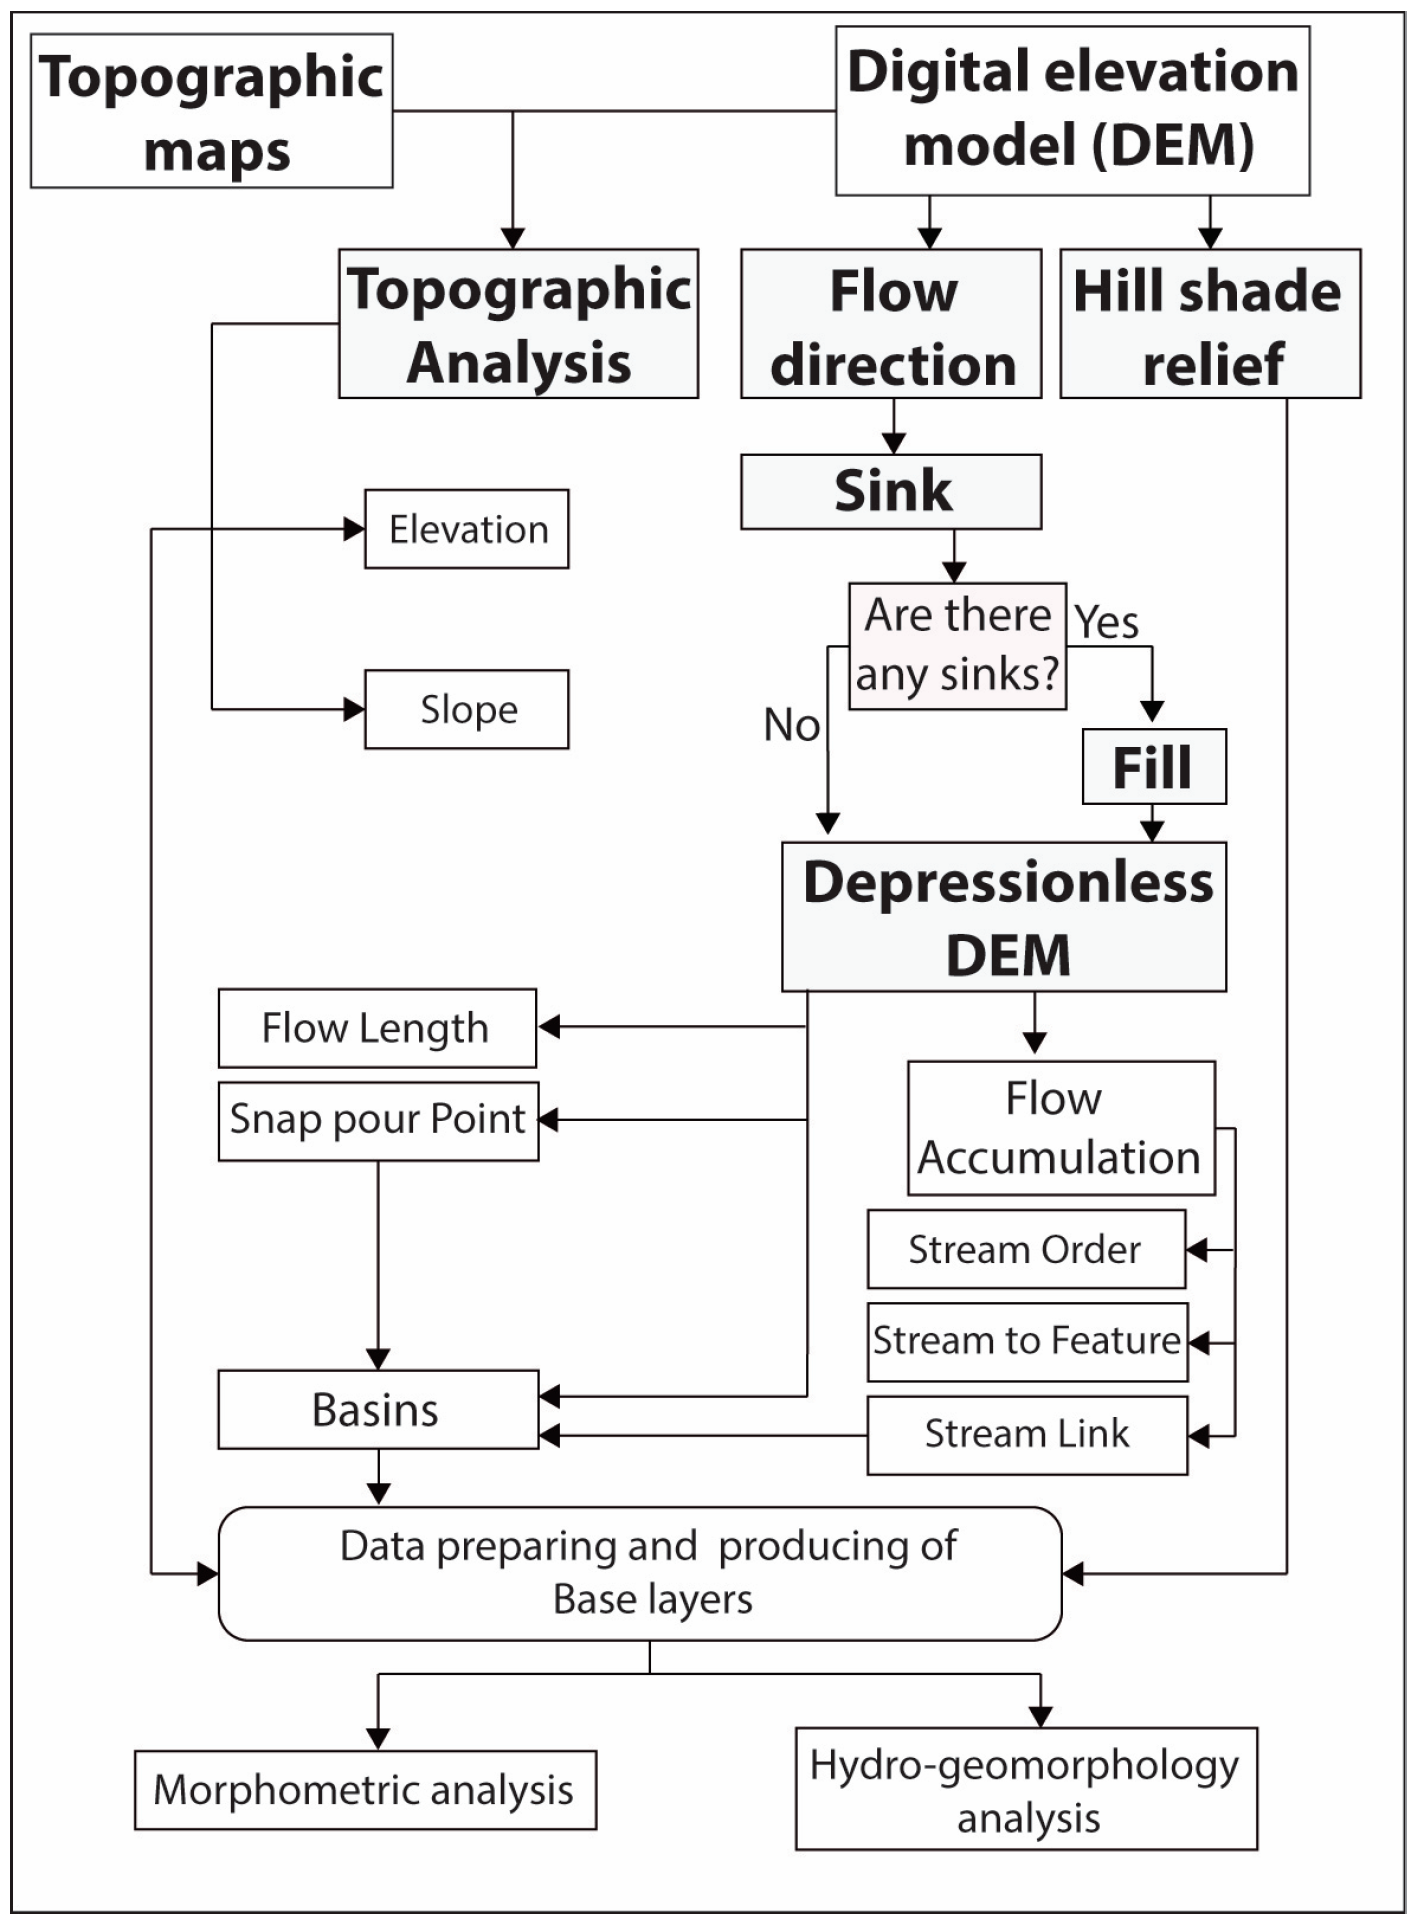
Neom city is located in the northern Red Sea in Saudi Arabia along the eastern border of the Gulf of Aqaba. It is bounded between 27°25′ N and 29°20′ N latitude and 34°40′ and 36°35′ E longitude and ranges in elevations between −20 m and 2625 m above sea level (a.s.l.) (Figure 1b). The total area of this city is about 26,500 km2 in Tabuk Province, particularly, at the most remote edge of Saudi Arabia. This large-scale project was designed by the Kingdom’s government to be a unique international, industrial, and commercial region leading to the future development of Saudi Arabia. Neom city is mapped within a complex geologic–tectonic system in the northern Red Sea including the Gulf of Suez, the Sinai Peninsula, and the Gulf of Aqaba. The major tectonic Red Sea presents an NNW–SSE-trending depression extending for about ≈2000 km between the African and Arabian plates. Appearing as a narrow and elongated half depression of about 195 km long and 17 km wide, the Gulf of Aqaba depression is bounded by an elevated mountainous chain mainly composed of Precambrian basement rocks and presenting an absolute narrow zone along the coastal zone [1]. The Gulf of Aqaba’s shore borders are bounded by faults showing sharp slope scarps that have been formed by the included faults [21]. Along the Gulf of Aqaba zone, a very complex tectonic framework is recorded as a result of a major tectonic extensional event that happened during the Olig-Miocene period in the Red Sea region [1]. This event is coupled with a post-Pliocene Arabian plate rotation toward the Dead Sea transform fault relative to the African plate. Along the Gulf of Aqaba coastal line, Quaternary faulting produces active signals, causing the uplifting of coast coral reefs about 6–8 m a.s.l. The authors of Refs. [1,22] claimed that the Sinai Peninsula was separated from the Arabian Shield by the Gulf of Aqaba during the Pleistocene time. The western border of the Gulf of Aqaba presents overstepping strike–slip left-lateral faults and pull-apart basins. Outside these graben landscapes, Phanerozoic sedimentary lithology was recorded as down-faulted facing the Precambrian basement units, forming about three pull-apart basins over this study area [23]. The suggestion is that similar Phanerozoic rock units that are represented by Paleozoic–Eocene sedimentary rock units have been recorded overlying the basement rock in the Sinai Peninsula [1]. The northern tip of the study area presents high mountains and steep slopes. The highest elevations were also recorded in the southeastern part of Neom city. Most of the study city is characterized by slopes between 3.15° and 5.60°, which are concentrated mainly along the central zone (Figure 2).

3. Data and Methods

ArcGIS version 10.4 and a 30 m spatial resolution digital elevation model (DEM) obtained from the Shuttle Radar Topography Mission (SRTM) were applied for morphological analysis of the study city. The DEM data were downloaded from the US Geological Survey (USGS) official website. In this study, the DEM data show high horizontal and vertical accuracy and are less affected by atmospheric conditions [6,13,24]. Generally, the resolution of the DEM dataset is limited to the level of uncertainty associated with morphometric parameters. Thus, in this work, we do not assign uncertainties to the morphometric parameters that were applied as in other similar works (e.g., [17,25]). Here, interpolation processing of missing data and the fill technique algorithm were applied as a pre-processing step for filling data gaps and reducing errors [6]. The topographic maps were also processed and used to aid in filling missing data. The DEM data were processed to produce different groups of morphometric parameters including linear, areal, and relief characteristics. The pre-processing was run through different steps, as shown in Figure 3. In this work, the landscape of Neom city was classified into 52 basins using hydrology tools in ArcGIS software (Figure 4).
Geospatial analysis is a powerful tool for calculating effective morphometric parameters because of its ability to process and visualize different quantifying morphological characters [14,26]. The morphometric analysis technique has been widely and successfully used in several studies. For example, Asfaw and Workineh in Ref. [27] quantified the hydro-morphometric characteristics of the Gumara and Ribb sub-watersheds in Ethiopia in order to extract reconnaissance information for water and soil conservation-related planning activities. Guidolini et al. in Ref. [28] examined the morphometric parameters of the Rio Grande basin in Brazil. Specifically, they described the drainage, relief, and geometric variables using a geospatial technique. Saha et al. in Ref. [29] analyzed the hydro-geomorphological characteristics of a small mountainous river watershed in Darjeeling Himalaya by examining the morphometric parameters using the GIS technique and remote sensing data. Particularly, they suggested that their study could be used to propose a comprehensive plan for watershed management. Chakraborty in Ref. [30] exemplified an Eastern Himalayan watershed, quantified the drainage network properties, and presented their exploration of whether these morphometric parameters could be used to investigate watershed hydro-geomorphological processes and how different factors influenced these quantitative parameters in a drainage watershed.
The analysis of morphometric parameters can effectively help to understand the primary signals of the flash flood magnitudes. The El-Shamy approach is one of the most effective methods used to figure out the relationship between flash flooding and recharge probabilities. This method was successfully applied by many workers in flash flooding studies [31,32,33]. This method runs with three effective morphometric parameters (the bifurcation ratio, drainage density, and stream frequency) presenting two charts between the bifurcation ratio against drainage density and stream frequency in order to provide a preliminary assessment of the intensity of the flood hazards.
The adapted data and methodologies of this paper were applied broadly and effectively in several disciplines including tectonic geomorphology, hydro-geomorphology, erosion priorities, seismic assessment, and flash flooding hazards assessment [14,34,35,36]. Morphometric analysis is a very valuable technique used to understand hydro-geomorphological and hydrological characteristics in different morpho-climatic settings and regions [37]. Additionally, illustrating relationships between some very effective parameters such as the bifurcation ratio, stream frequency, and drainage density aids in assessing flash flood hazard characterization [14,38]. Several comprehensive hydrological and erosion models were produced based on the interaction between the morphometric parameters in different climatic and morphological regions [6,16,34,39,40]. Therefore, this work assumes that the proposed methods can be applied to other basins elsewhere, particularly to those whose hydrological, morphological, and climatic features are not well recognized.
In this study, the geometric analysis shows that the total area of the basins ranges from 54.66 km2 to 1960.50 km2 (Figure 5). The values of the perimeter parameter were also extracted ranging from 428.66 km to 43.01 km (Figure 5). Additionally, the longest basin is basin 32 and the shortest is basin 42, measuring about 117.88 and 11.2 km, respectively. The distribution of the studied basins and their geometric values, including basin total area, perimeter, length, and maximum and minimum elevations are illustrated in Figure 3 and Figure 5. The calculated and analyzed morphometric parameters, methods, and equations applied in this study are summarized in Figure 3 and Table 1. Accordingly, the different measured and analyzed morphometric parameters were used to investigate the geological, hydrological, and topographical aspects of the study city (Table 1).

4. Results and Discussion

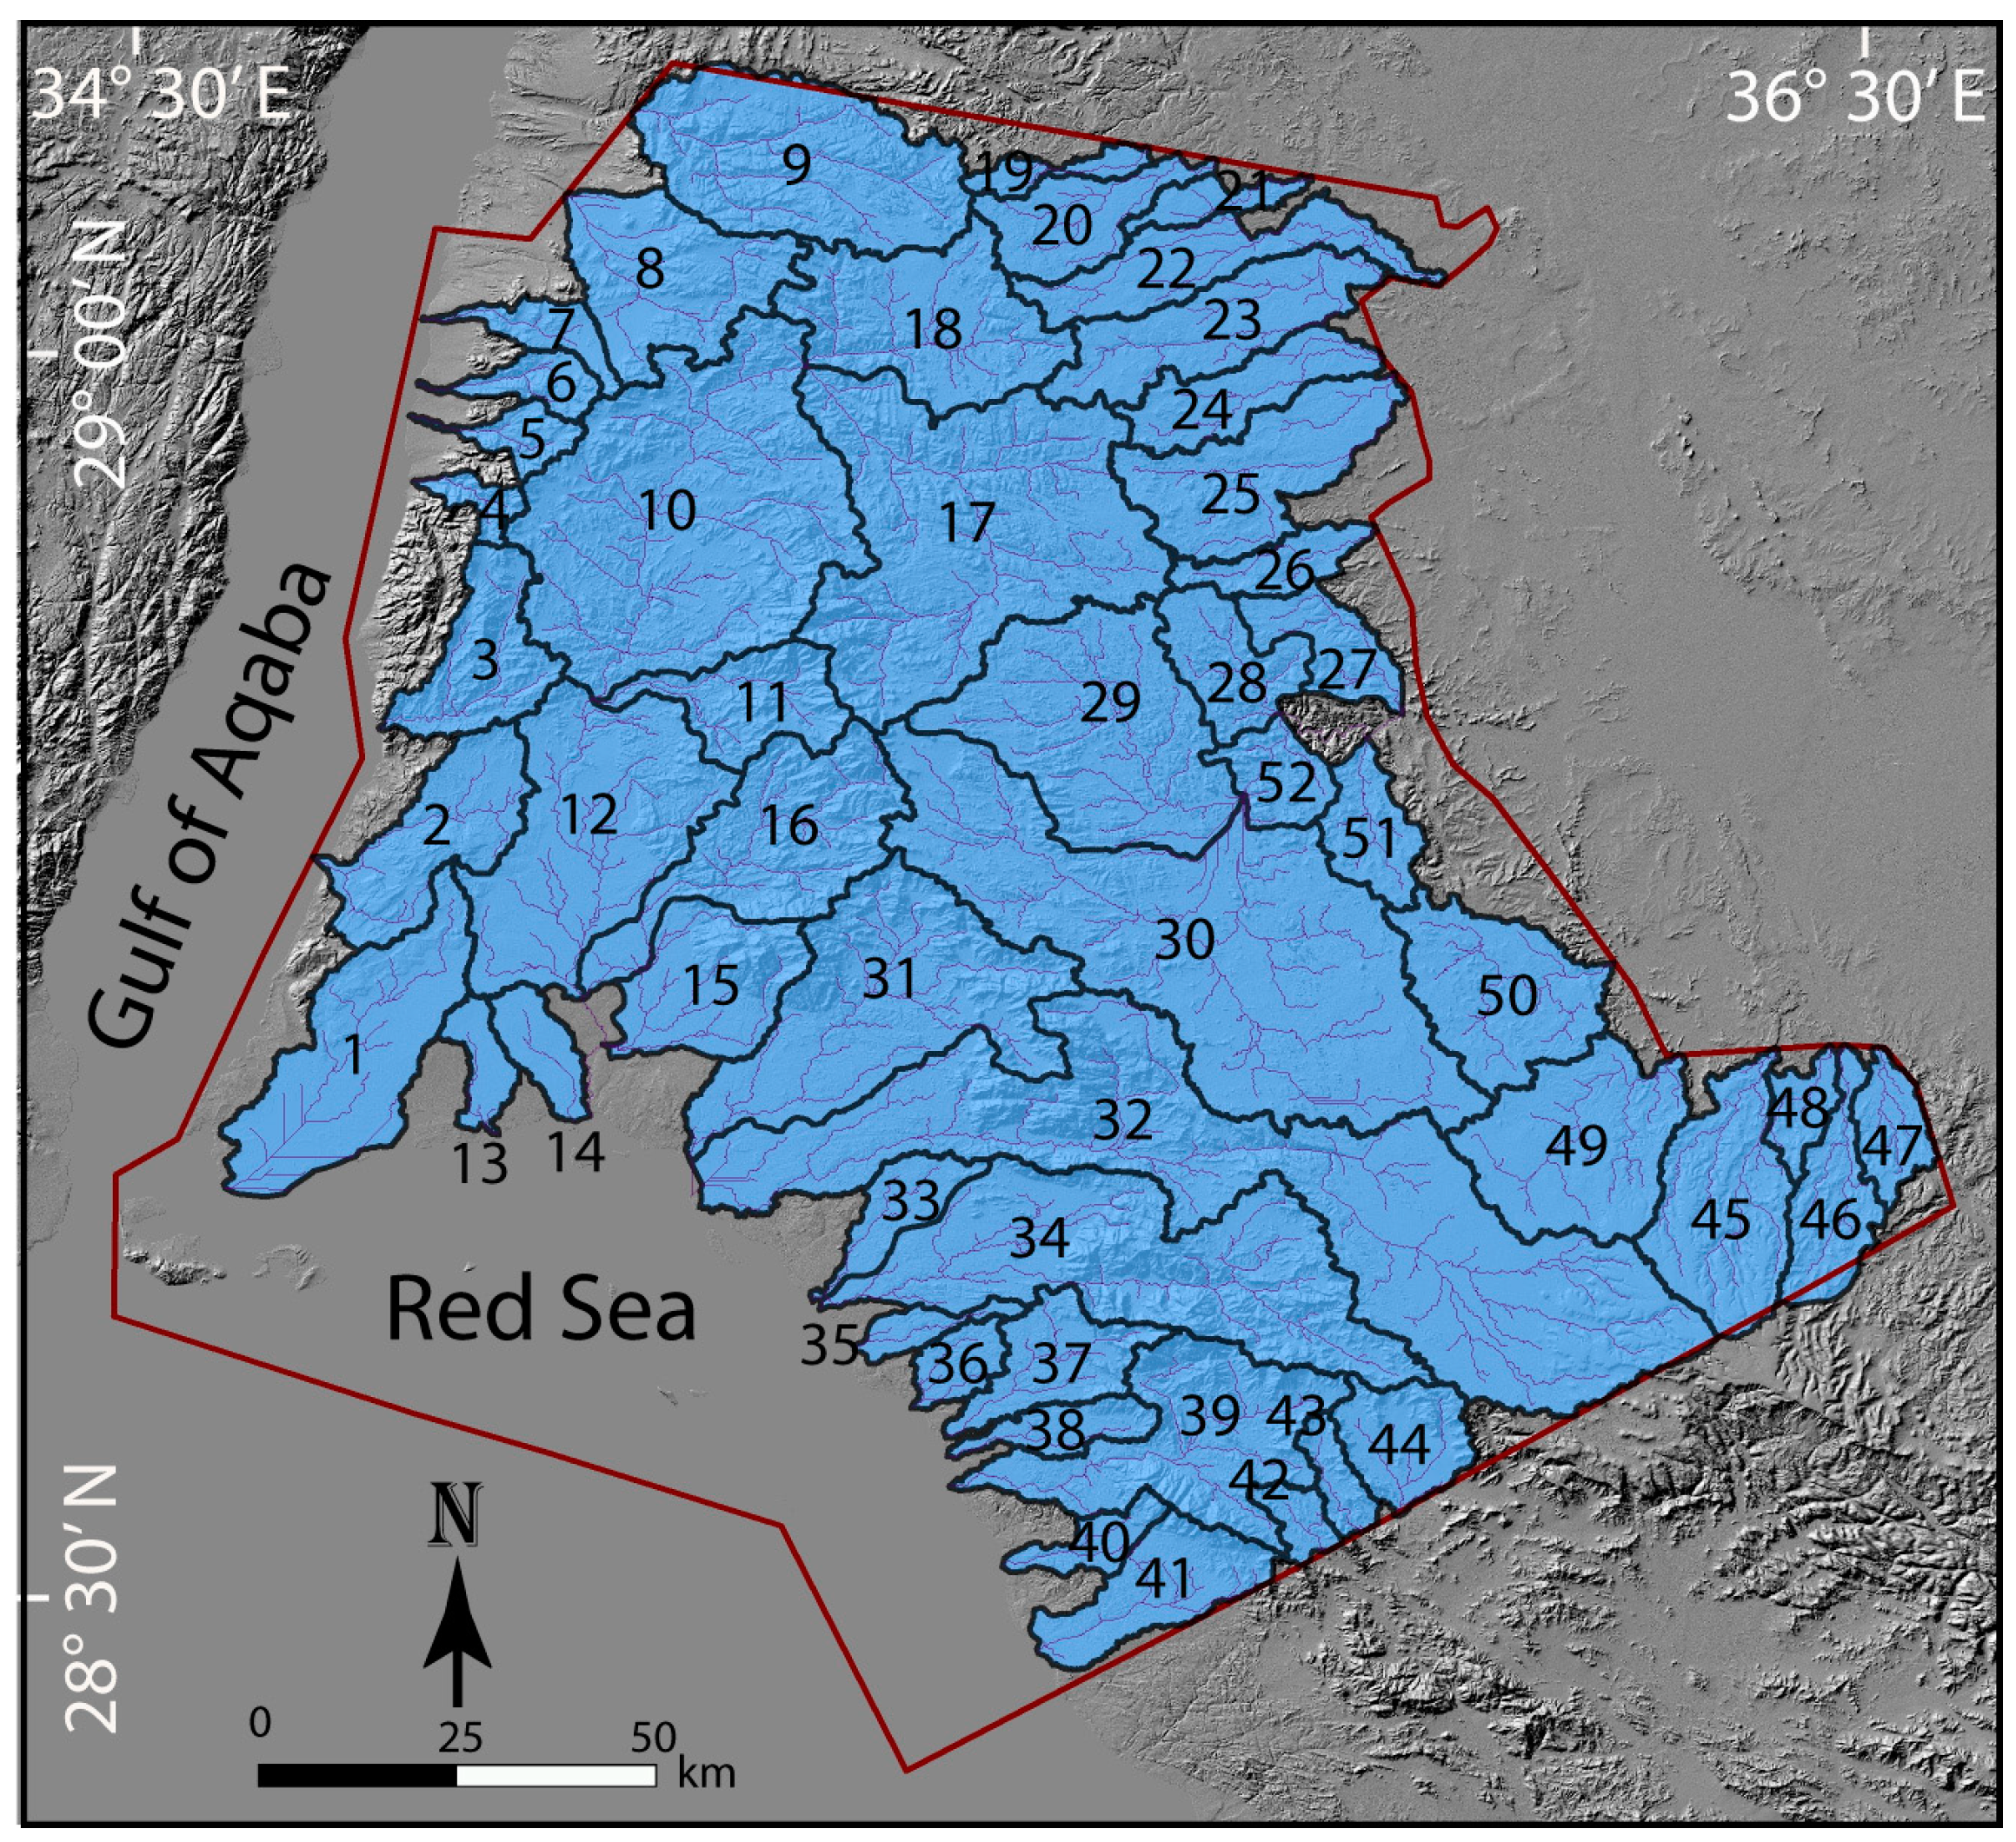
4.1. Morphometric Analysis

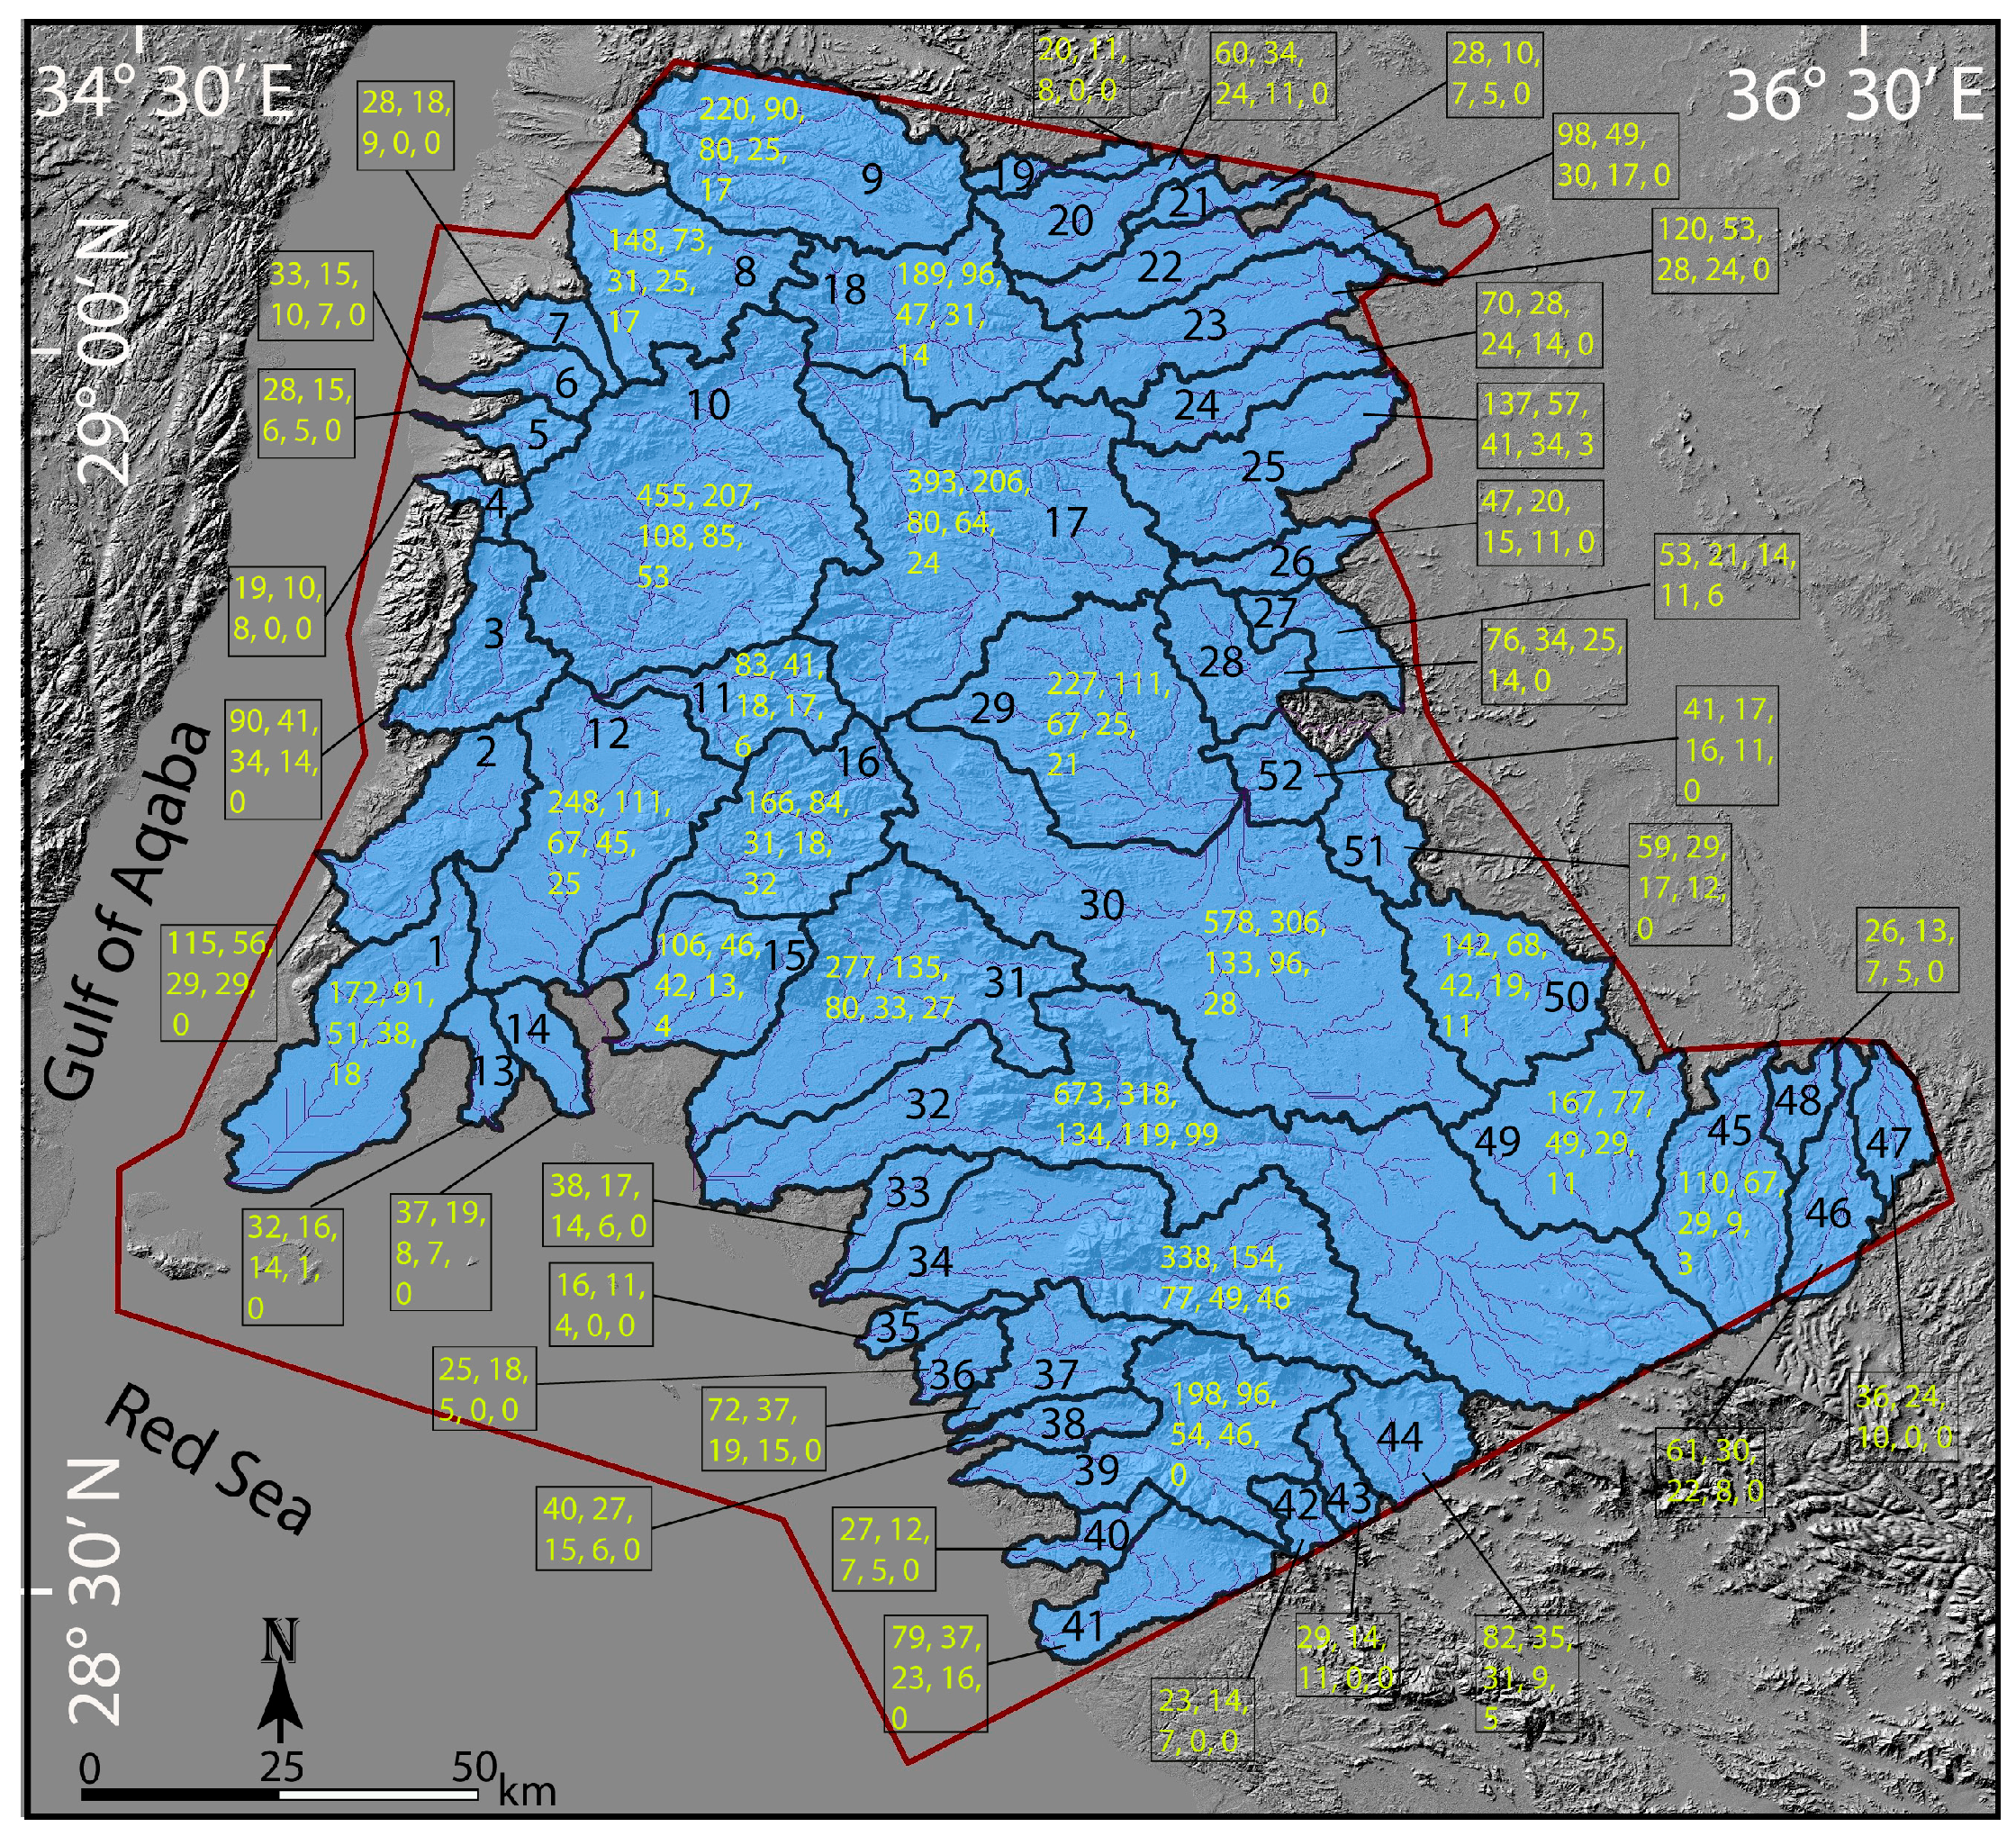
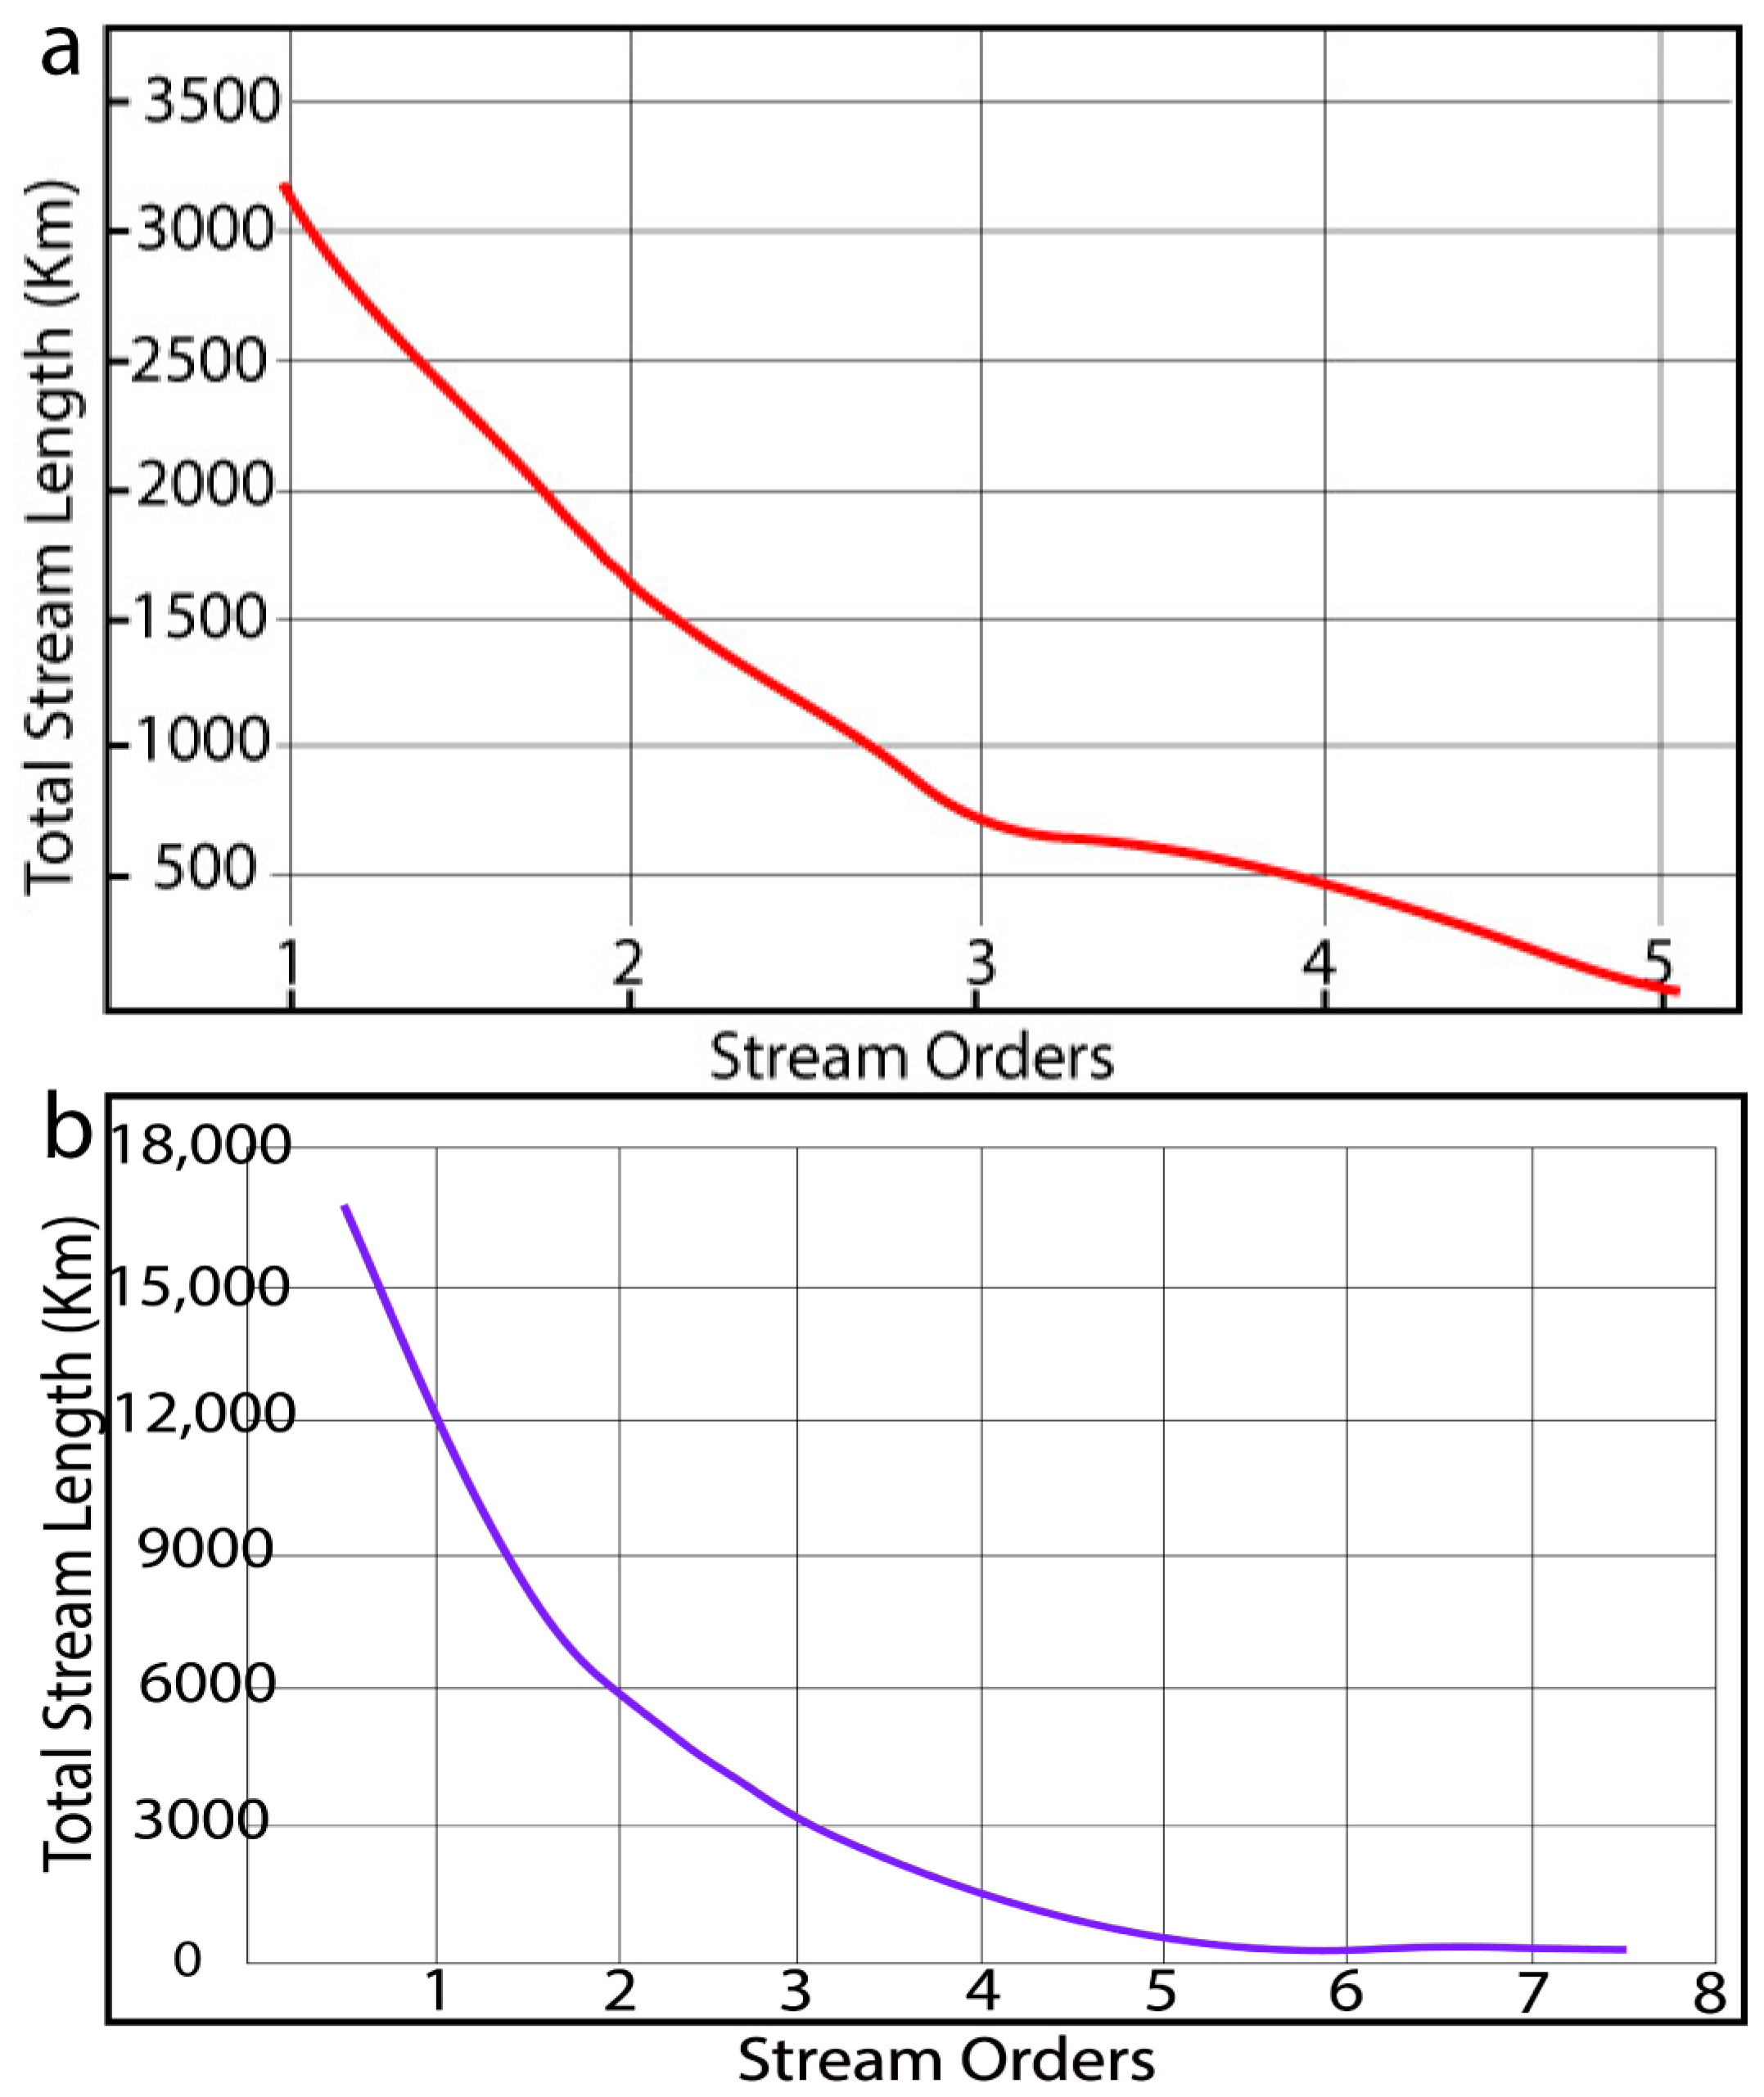
4.1.1. Linear Aspects

Figure 2 and Figure 3 present drainage patterns and basin boundaries extracted using methods by Strahler in Ref. [49]. Linear morphometric parameters were examined for 52 basins in Neom city, including stream orders, stream total lengths, stream numbers, stream length ratios, mean stream lengths, and bifurcation ratios. Almost all basins present dendritic drainage pattern systems showing streams of up to the fifth order (Figure 2d). This dendritic model states that almost all basins include resistance homogenous materials and lithology and may thus provide suitable conditions for generating significant streamflow quantity. Taking this into account, Kabit and Gessesse [6], and Wintanage et al. [50], suggested that the dendritic model of drainage systems as irregular segments of small rivers and streams with angles less than 90° can be totally developed over areas of uniform resistance lithology with no evidence of structural controls. Similarly, dendritic drainages are likely to run over complex metamorphic rocks over or on horizontal sedimentary beds [51]. This is in agreement with the geological map that was constructed by numerous authors, such as [23,52], which stated that all basins overlie igneous, complex metamorphic, and sedimentary rocks. Moreover, the study area is characterized by various lineaments showing several different trends, which present less suitable conditions for controlling groundwater recharge, surface runoff, and base flow. The stream order parameter (Qu) represents one of the most important factors that is applied in morpho-hydrology studies to measure mainly the size of a basin’s main river and extract a river’s rank classification [14]. In the current analysis, basins 17, 29, 30, and 34 present the fifth stream order, reflecting the highest stream order rank, while the remaining basins present orders of less than the fifth order (Figure 6). The stream length parameter (Lu) is analyzed in this study as a dimensional factor representing the characteristic size of the drainage system and its effect on the surface of the studied basin [43]. The longest stream length was recorded for basin 32 at 1824.47 km, while the shortest value was observed for basin 42 at 50.99 km in the southern part of the study city. Most morphometric studies stated that this parameter is a significant factor that can be used to investigate the condition of surface runoff [39,53]. The estimated total stream length of all the studied basins reaches 17,956.02 km. The longest total length is observed for the first stream order, while the shortest total length is accounted for by the fifth stream order. Moreover, Figure 7a illustrates the total stream length against stream orders, which indicates that they are inversely related. This finding is consistent with many similar studies (e.g., Figure 7b by Kabite and Gessesse [3,6,43]). Additionally, the mean stream length gives the highest value for the first order. Values of this parameter decrease from the highest to the lowest orders, indicating that the streams of the first order are numerous in number and short in length, while the fifth order presents the lowest stream numbers and long lengths. The long stream length could be due to the decreasing slope of the studied basins from the dividing line to the outlet boundaries of the studied basins. Thus, this indicates that the investigated basins give signals of tectonic uplifting, presenting conditions of the youthful development stage [41,50]. Furthermore, short streams present steep slopes, while longer streams are recognized by flatter gradients [50]. Generally, stream length and stream length ratio parameters represent valuable information that provides clues on the hydrologic characteristics of the studied basins. These parameters show variations in their values between different stream orders, indicating different conditions about the infiltration capacity at given stream orders of the study basins that could be produced due to the change in the topography and slopes [6,54].
The bifurcation ratio parameter (Rb) is a very effective parameter that is used to define the ramification level of basin drainage [18]. It is defined as a dimensionless factor used to examine the ratio of streams of a given order to the stream numbers of the next higher order. The bifurcation ratio results range from 3.15 to 7.17 for basins 4 and 45 as the lowest and highest values, respectively (Table 2). Similarly, the bifurcation ratio parameter gives different values for different stream orders for every single basin. Such variation in Rb results between the different stream orders revealed various conditions in forming and developing the lithological units of the drainage basin [49]. The highest values of the bifurcation ratio parameter usually correspond to areas with dissected and mountain basins [43,55]. Thus, it is usually used to check whether or not the drainage pattern is structurally controlled or not [3]. A bifurcation ratio value of less than 5 indicates two different characteristics: (i) the underlying drainage basin is a lithology of a uniform resistance [6] and (ii) streams of first, second, and third orders systematically branch with a large number of streams [5]. Just 15% of the basins (by number) have values less than 5 (2, 4, 7, 19, 35, 36, 43, 47, and 52), accounting for only 5.22% of the total area of the study city, while the remaining basins have values greater than 5.

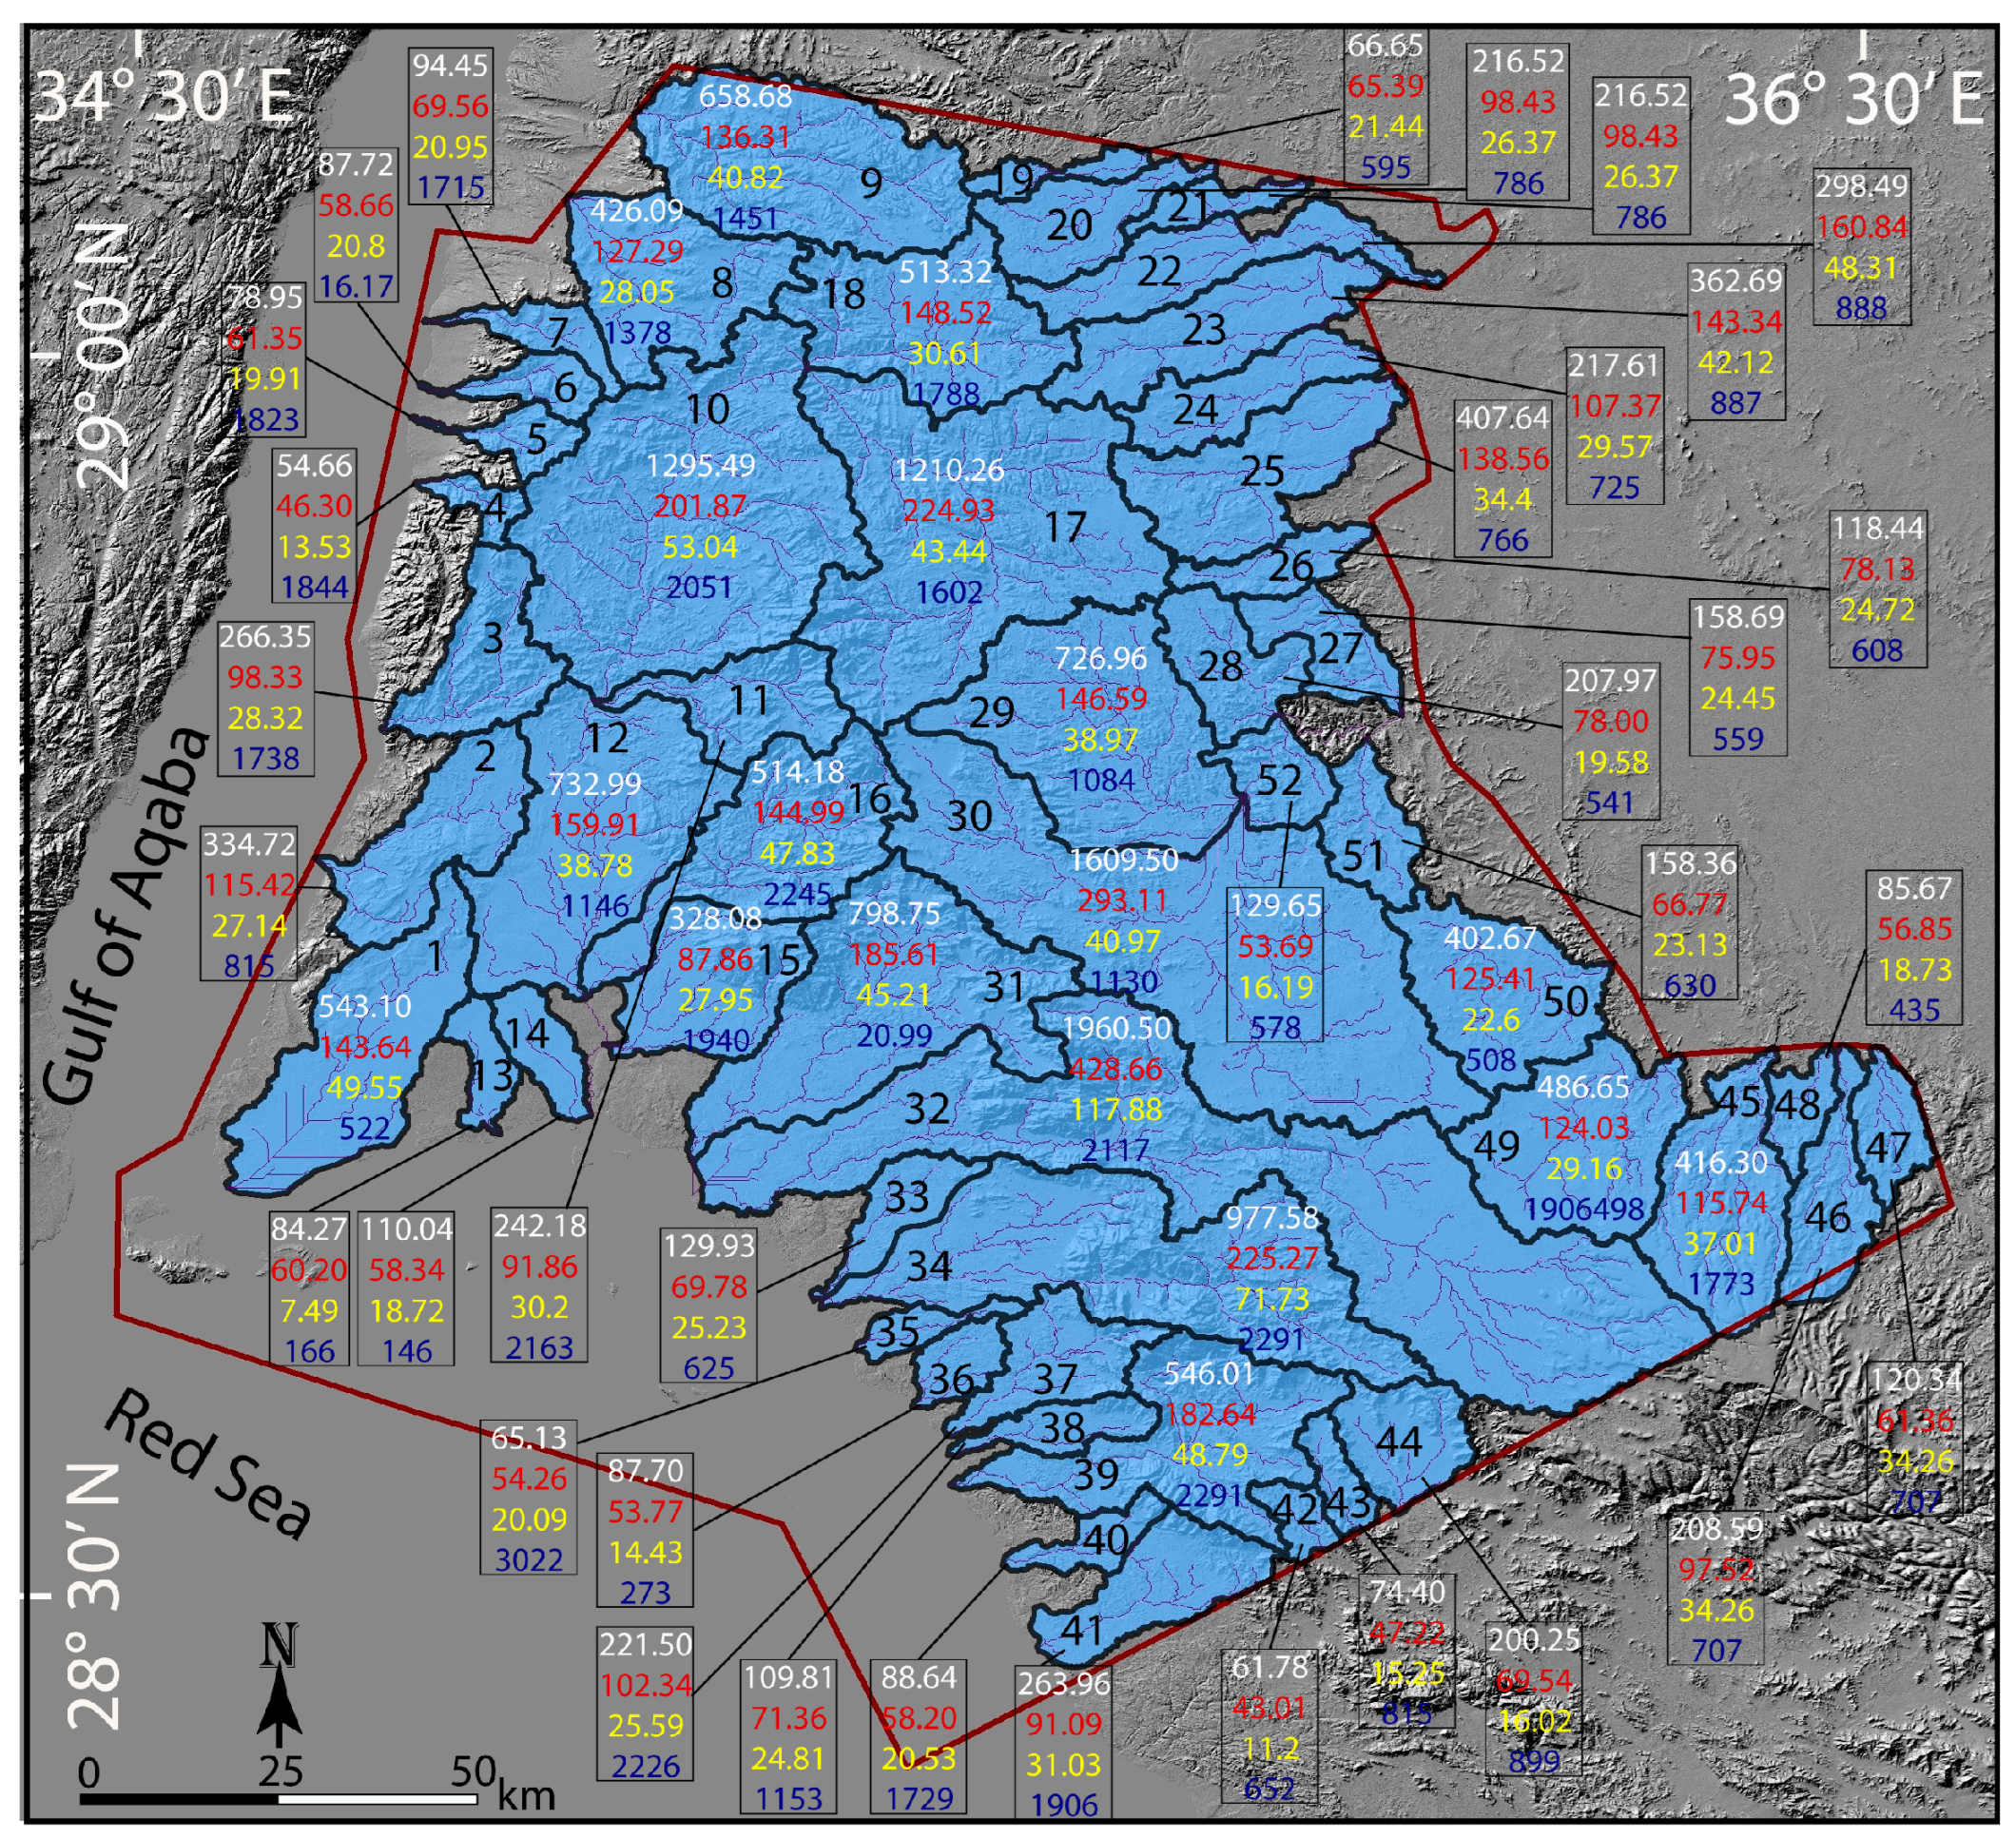
4.1.2. Areal Aspects

In this study, the total drainage area and the perimeter of all basins are 19,654.27 km2 and 5875.04 km, respectively. The vastest basin in Neom city is basin 32 (1960.50 km2), while the smallest area was recorded for basin 35 (65.13 km2). The perimeter factors of 428.66 km and 43.01 km are the highest and lowest values for basins 32 and 45, respectively. The drainage density (Dd) parameter was first defined and calculated in [42,43]. In the current study, the drainage density values range from 0.76 to 1.18 km/km2. The lowest value of this parameter was observed for basin 46 in the southeastern corner of the study city, while the highest Dd value was recorded for basin 13 in the western side of the study city, providing high possibilities for producing high runoff volumes (Table 2). The stream frequency (Fs) parameter was observed at 33.75 for the entire city, ranging from 0.48 for basin 35 and 0.80 for basin 38 (Table 2). In most flash flood studies, this parameter is applied to investigate the impervious surfaces of rocks and soils, vegetation cover, and high topography characteristics. Usually, high values of Fs indicate suitable conditions for a high quantity of runoff transmission [14,56]. Usually, the drainage texture (Td) parameter is detected and evaluated based on some factors, including types of rocks and soil, infiltration capacity, and basin relief [57]. The drainage texture parameter values ranged from 0.51 (basin 4) to 0.88 (basin 13) (Table 2). High values of this parameter are usually an indication of fine rock textures [57]. The distribution of the drainage texture values is illustrated in Table 2. The infiltration number parameter has been commonly applied in most recent morphometric analysis studies [16,58]. It is used to evaluate the infiltration characteristics of different basins [16,46].
In this study, the infiltration number parameter values ranged between 0.60 and 0.90 for basins 19 and 24, respectively. These results show that the highest values were observed in the northeastern part of the study city, while the lowest value was observed in the eastern side along the Gulf of Aqaba coastal zone. Thus, the northeastern part of the study city indicates suitable conditions for high volumes of runoff with a high rate of infiltration processes. Additionally, the lowest infiltration conditions were reported for the smallest basin in Neom city along the Aqaba Gulf coastal zone.
The drainage density, drainage texture, stream frequency, and infiltration number parameters of the studied basins show small to medium values, which indicate rocks of fine to coarse texture. This suggests that Neom city overlies rocks of medium permeability level. Based on the geological description of the Kahal [23], and Aboud et al. [1], a vast portion of Neom city is underlain by Quaternary deposits, gypsum, and anhydrite, which are moderately fractured. However, the drainage density and texture parameters, in addition to the stream frequency parameter of the basins, are correlated due to the evaluation of infiltration and permeability capacities [43].
The overland flow length parameter (Lg) values ranged from 0.38 km/km2 for basins 4 and 46 to 0.52 km/km2 for basins 24 and 44, respectively. Thus, this analysis, as argued by Chandrashekar et al. [5], suggests that the middle zone of the study city shows high infiltration conditions with remarks of low runoff versus the eastern and western sides. Similar to drainage density, the channel maintenance parameter constant is a factor used to measure basin texture characteristics. It is expressed in square kilometers and uses an inverse equation of drainage density parameter [59].
Table 2 presents the calculated values of the constant channel maintenance parameter. The results of this parameter range from 0.85 km/km2 (basin 13) to 1.31 km/km2 (basin 46) with a total average of 1.10 km/km2 throughout the study city. In general, the higher the value of the maintenance constant (C), the greater the level of permeability of the basin rocks. The lowest value is recorded at the eastern part of the study city in basin 13, indicating that only a small area is required to support 1 km of a stream channel providing conditions of low levels of permeability and infiltration rates. The form factor (Ff) parameter is commonly applied to measure the flow intensity of a basin [60]. The values of this parameter ranged between 0.14 and 0.96. The lowest values were observed for basins 19 and 32, while the highest value was observed for basin 30 (Table 2). Many authors (e.g., [60,61]) have suggested that this parameter describes the relationship between water discharge and duration. They stated high Ff values for a high discharge volume in a short duration, and vice versa. Additionally, the other areal morphometric parameters present that the elongation ratio (Re), circularity ratio (Rc), and basin shape (Bsh) parameters of the entire basins give values (0.99:12.51), (0.13:0.56), and (1.27:2.10), respectively (Table 2). The highest values of Re, Rc, and Bsh were recorded for basins 17, 52, and 35, respectively. These basin parameters usually are highly related to each other and are applied to give more information on the basin shape characterizations [6,26].
Strahler in Ref. [41] suggested that values of elongation shape less than 0.8 are representative of elongated basins that are characterized by high topography and a deep surface slope. Generally, the basins in the study city are relatively highly elongated basins providing very long lag times and low conditions of flooding and soil erosion risks in comparison with other similar areas [3,26,41]. Low values of the Rc parameter (i.e., 0.1) indicate that basins are elongated and could produce conditions of low runoff surface potential due to the existence of permeable rocks and soils [62] (Table 2). An analysis of channel maintenance, reflected by constant values, explains how much drainage basin area is needed to maintain the length of a channel, and it is detected by the rock resistance level, relief, and surface vegetation cover [6,63].

4.1.3. Relief Aspects

Relief parameters usually present information about erosion behaviors, topographical characteristics, steepness, and slopes of landscapes [16,64]. The basin relief (H) parameter assists in defining the general river flow path, runoff surface volume, and surface evolution of a given basin. In the current study, these parameter values ranged from 2291 m a.s.l. for basins 34 and 38 to 146 m a.s.l. for basin 14. Therefore, the general slope of the study city runs from the mountainous zone toward the Aqaba Gulf coastal zone. Generally, long and highly steep basins are highly exposed to the maximum level of runoff erosive power. The basin slope (Sb) parameter values ranged from 7.48 to 136.95. The lowest value of this index was observed for basin 14 on the eastern side of Neom city, while the highest value was recorded along the eastern coast of the Gulf of Aqaba for basin 4. The high value of the slope parameter suggests high basin relief providing a high degree of steepness slope with a high potential for soil erosion and surface runoff production. Moreover, the relief ratio (Rr) parameter had values between 7.48 (basin 14) and 136.95 (basin 4). The results of this parameter suggest that the studied basins show a steep slope that generates conditions of high potential energy for moving sediments and water downslope for every single unit length. The ruggedness number (Rn) parameter defines the degree of slope length and steepness that represents the landscape instability extension and ground surface [6,45]. In this study, the ruggedness number values vary from 0.14 (basin 14) to 3.01 (basin 35) (Table 2). A high value of the Rn parameter suggests that a basin is characterized by long slopes with high steep degrees, high conditions for erosion processes, and rapid signals of flash flooding [14]. The highest values of this parameter were observed for basins 35, 34, and 39 in the southern part of the study city (see Figure 3 for the basin positions), showing highly rugged relief surface, suitable conditions for the soil corrosion process, and complex structural framework of the study city. The distribution of the results of all morphometric parameters was mapped in 16 maps in the Supplementary Materials.

4.2. Hydro-Geomorphology of Neom City

Hydro-geomorphology characteristics basically deal with drainage basins with respect to neighboring landscapes. They are dependent on many factors including basin morphology, general surface relief, water runoff, etc. Several recent related papers have suggested that the morphometric characteristics of a basin are highly correlated with basin hydrological and physio-geographical processes. They presented significant information to model major hydrological processes such as flooding, erosion of soil, groundwater recharge, topography, and lithological formation using quantitative morphometric analyses. For example, Khalifa et al. [16], calculated the effective morphometric indexes along the area between El-Qussier and Marsa-Alam in order to assess the morphometric-hydro characterization and quantify surface water volume for two major flooding events. Another example is Kabit and Gessesse in Ref. [6]. They quantified the most valuable morphometric parameters. Additionally, they investigated hydro-geomorphology characteristics by extracting information about the hydrology, topography, and geology of the Dhidhessa river basin in Ethiopia.

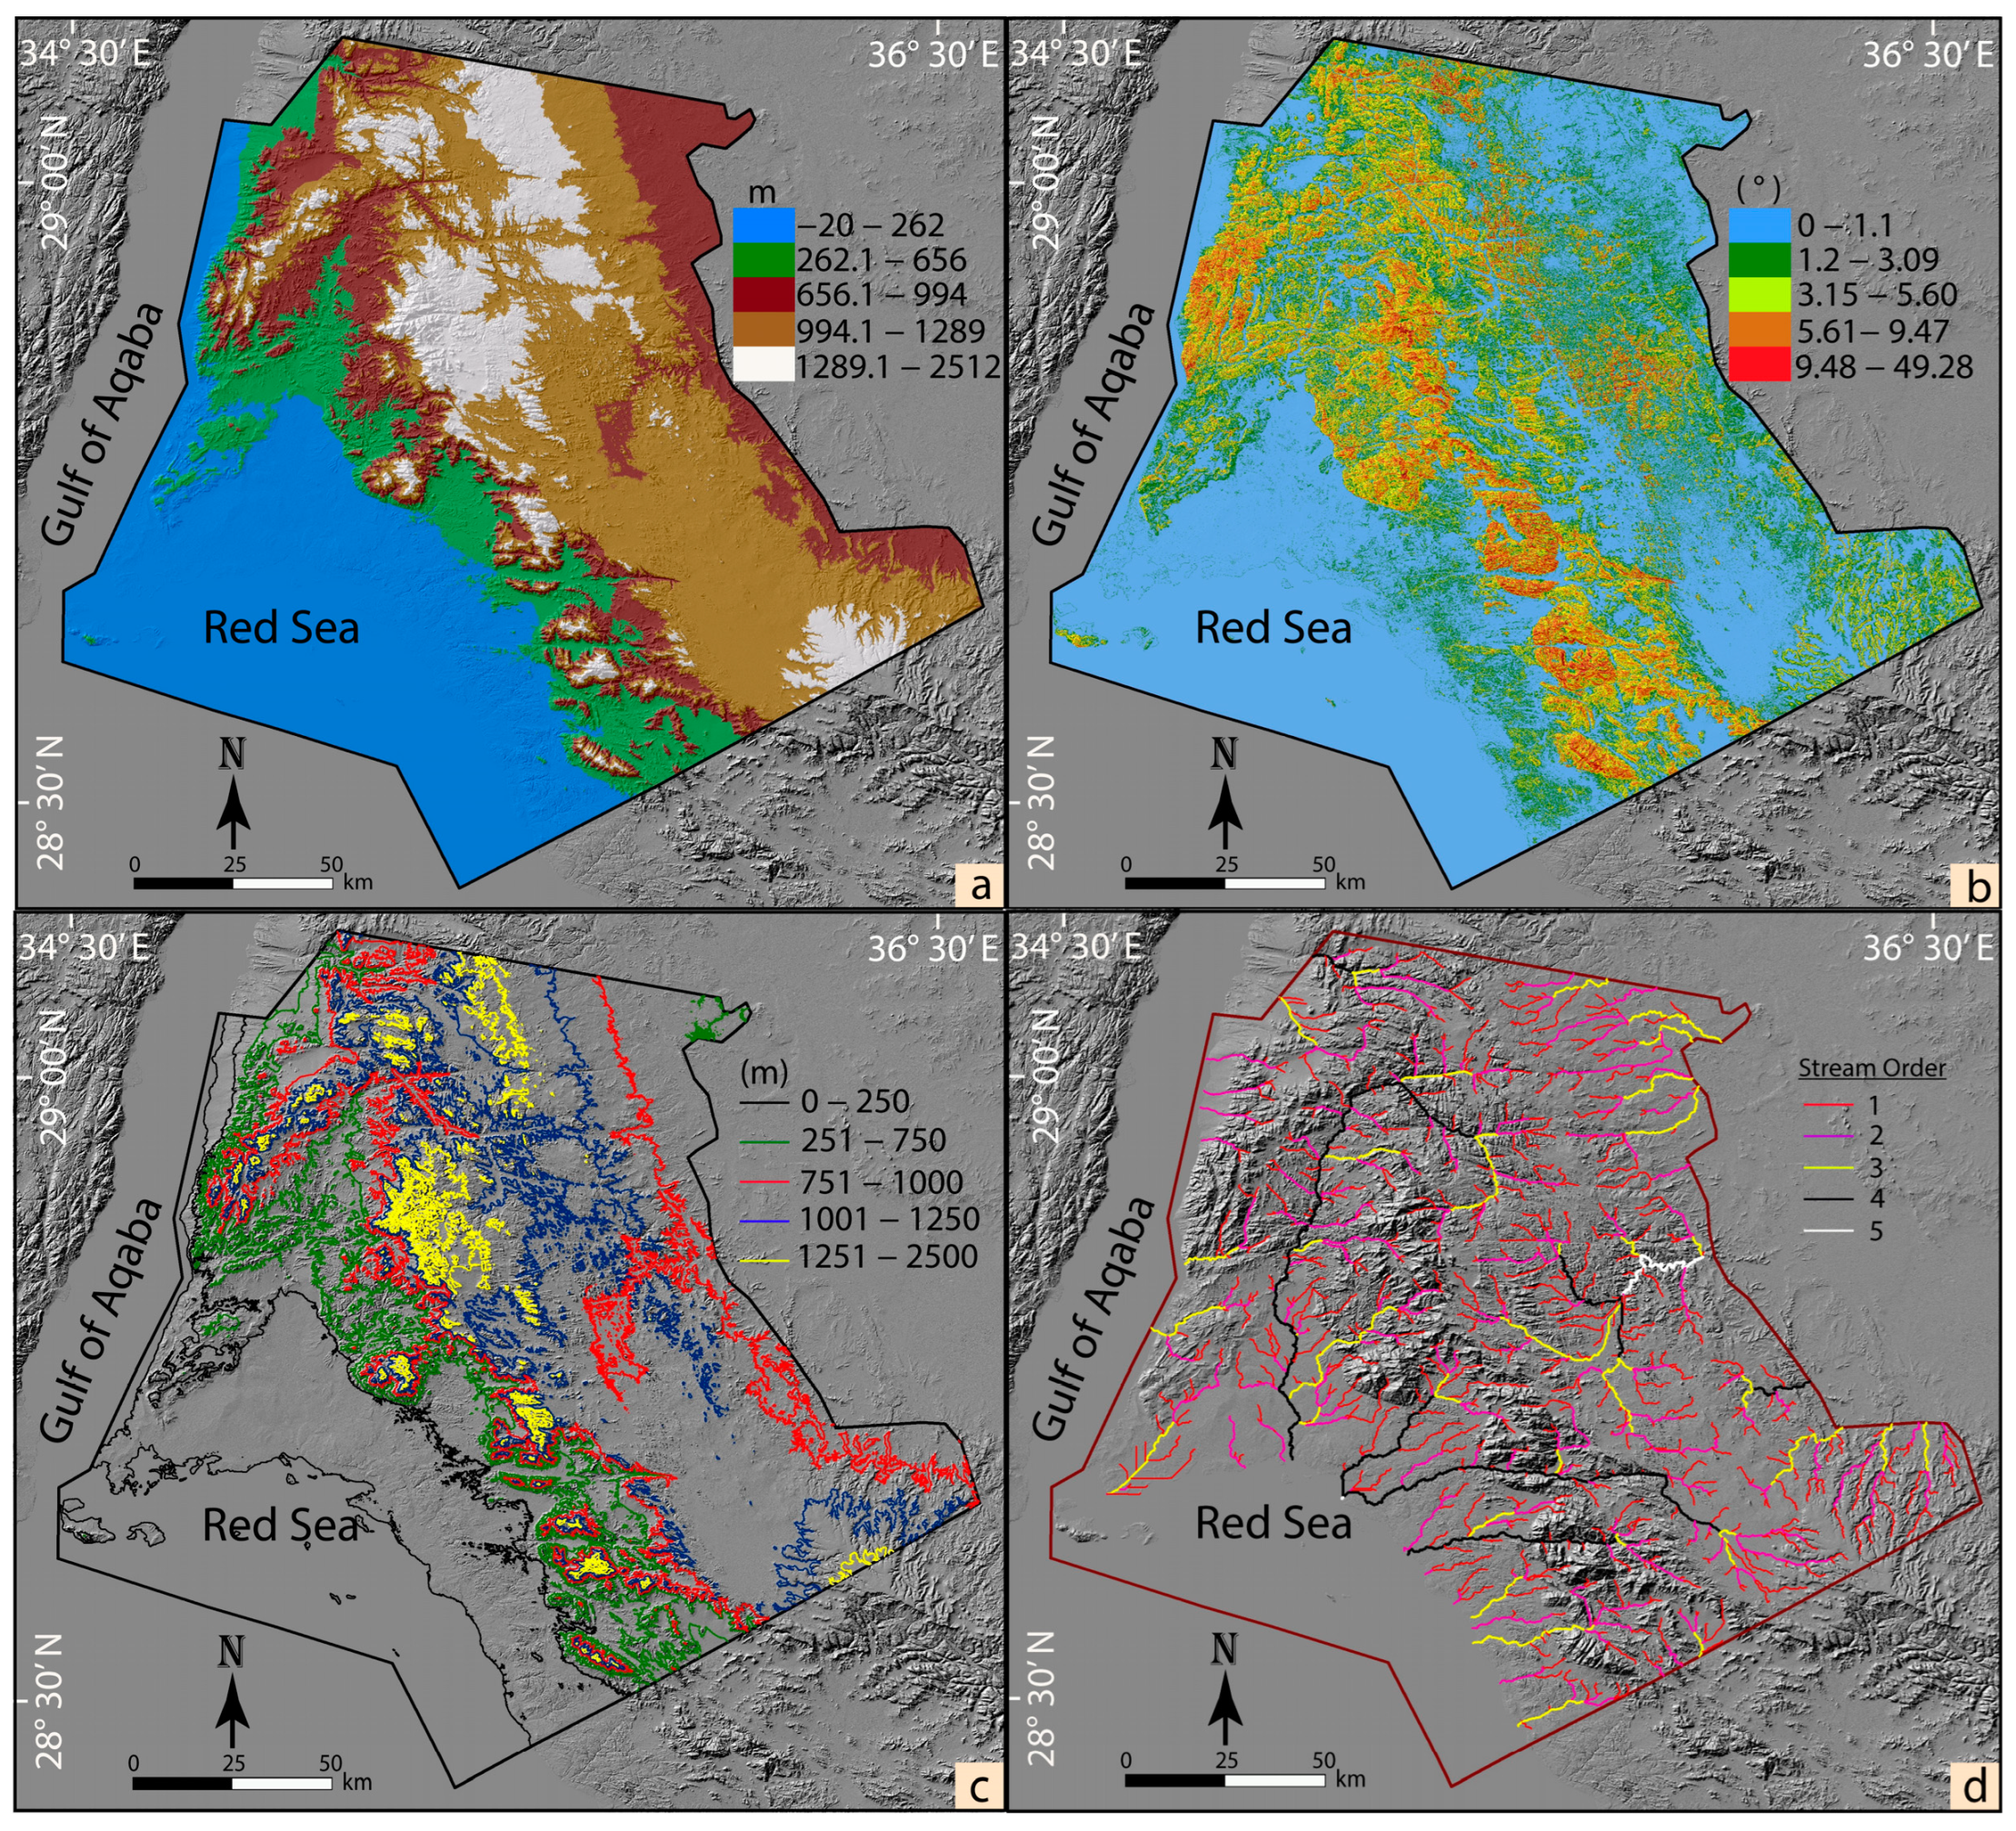
4.2.1. Drainage Morphology and Topography

The applied relief aspect parameters including basin relief, the relief ratio, basin slope, and the ruggedness number are basically significant indicators for topographic characteristics of different landforms [65,66]. In the current study, the analysis of relief morphometries suggests that Neom city is characterized by high-relief landforms, steep slopes, and mountainous zones in addition to rugged topography along the N-S middle zone (Figure 2 and Figure 5 and Table 1). The topography signatures gradually decrease toward the eastern side and the Gulf of Aqaba coastal zone. Such morphometric characteristics are extracted in high values of drainage density, drainage frequency, and drainage texture parameters [34]. On the other hand, drainage density, drainage frequency, and drainage texture parameters show total values of low to slightly medium, indicating that there are other effective parameters and conditions controlling the topographical characteristics of the landforms. These could be rock and soil types, permeability characteristics of the enclosing lithology, high intensity of rainfall, or vegetation cover.

4.2.2. Drainage Morphology and Lithology

Several hydro-morphological studies suggested that valuable information about enclosing lithology could be extracted from the analysis of the morphometric parameters such as drainage systems, mean stream length, the constant of channel maintenance, and the bifurcation ratio [45,50,67]. According to the current study, the lithology of Neom city is likely a complex ultramafic rocks, igneous rocks, and a large space of sedimentary Quaternary deposits, which is consistent with the characterization of geological units in previous studies [1,23]. Most of the lithology of the study city shows uniform resistance rocks and a moderate level of structural control. Moreover, significant variation in the bifurcation ratio and mean stream length values with respect to different stream orders suggests that the study basins show signatures of being in a stage of youthful development and, thus, the lithological of Neom city is spatially varied. In addition, the geological units of Neom city present similar results. According to the geological unit distributions of the study city [1,23], the underlying lithology of the basins is characterized by crystalline basement rocks, gypsum, and anhydrite in addition to recent deposits representing most of the area of the study city, which is covered by Quaternary deposits (≈50%). Furthermore, current work revealed that the recorded complex structures are particularly observed in the basement, slat, and phyllite rocks. Since lineaments show highly steep dipping, they present less control of the drainage system conditions and groundwater discharge characteristics.

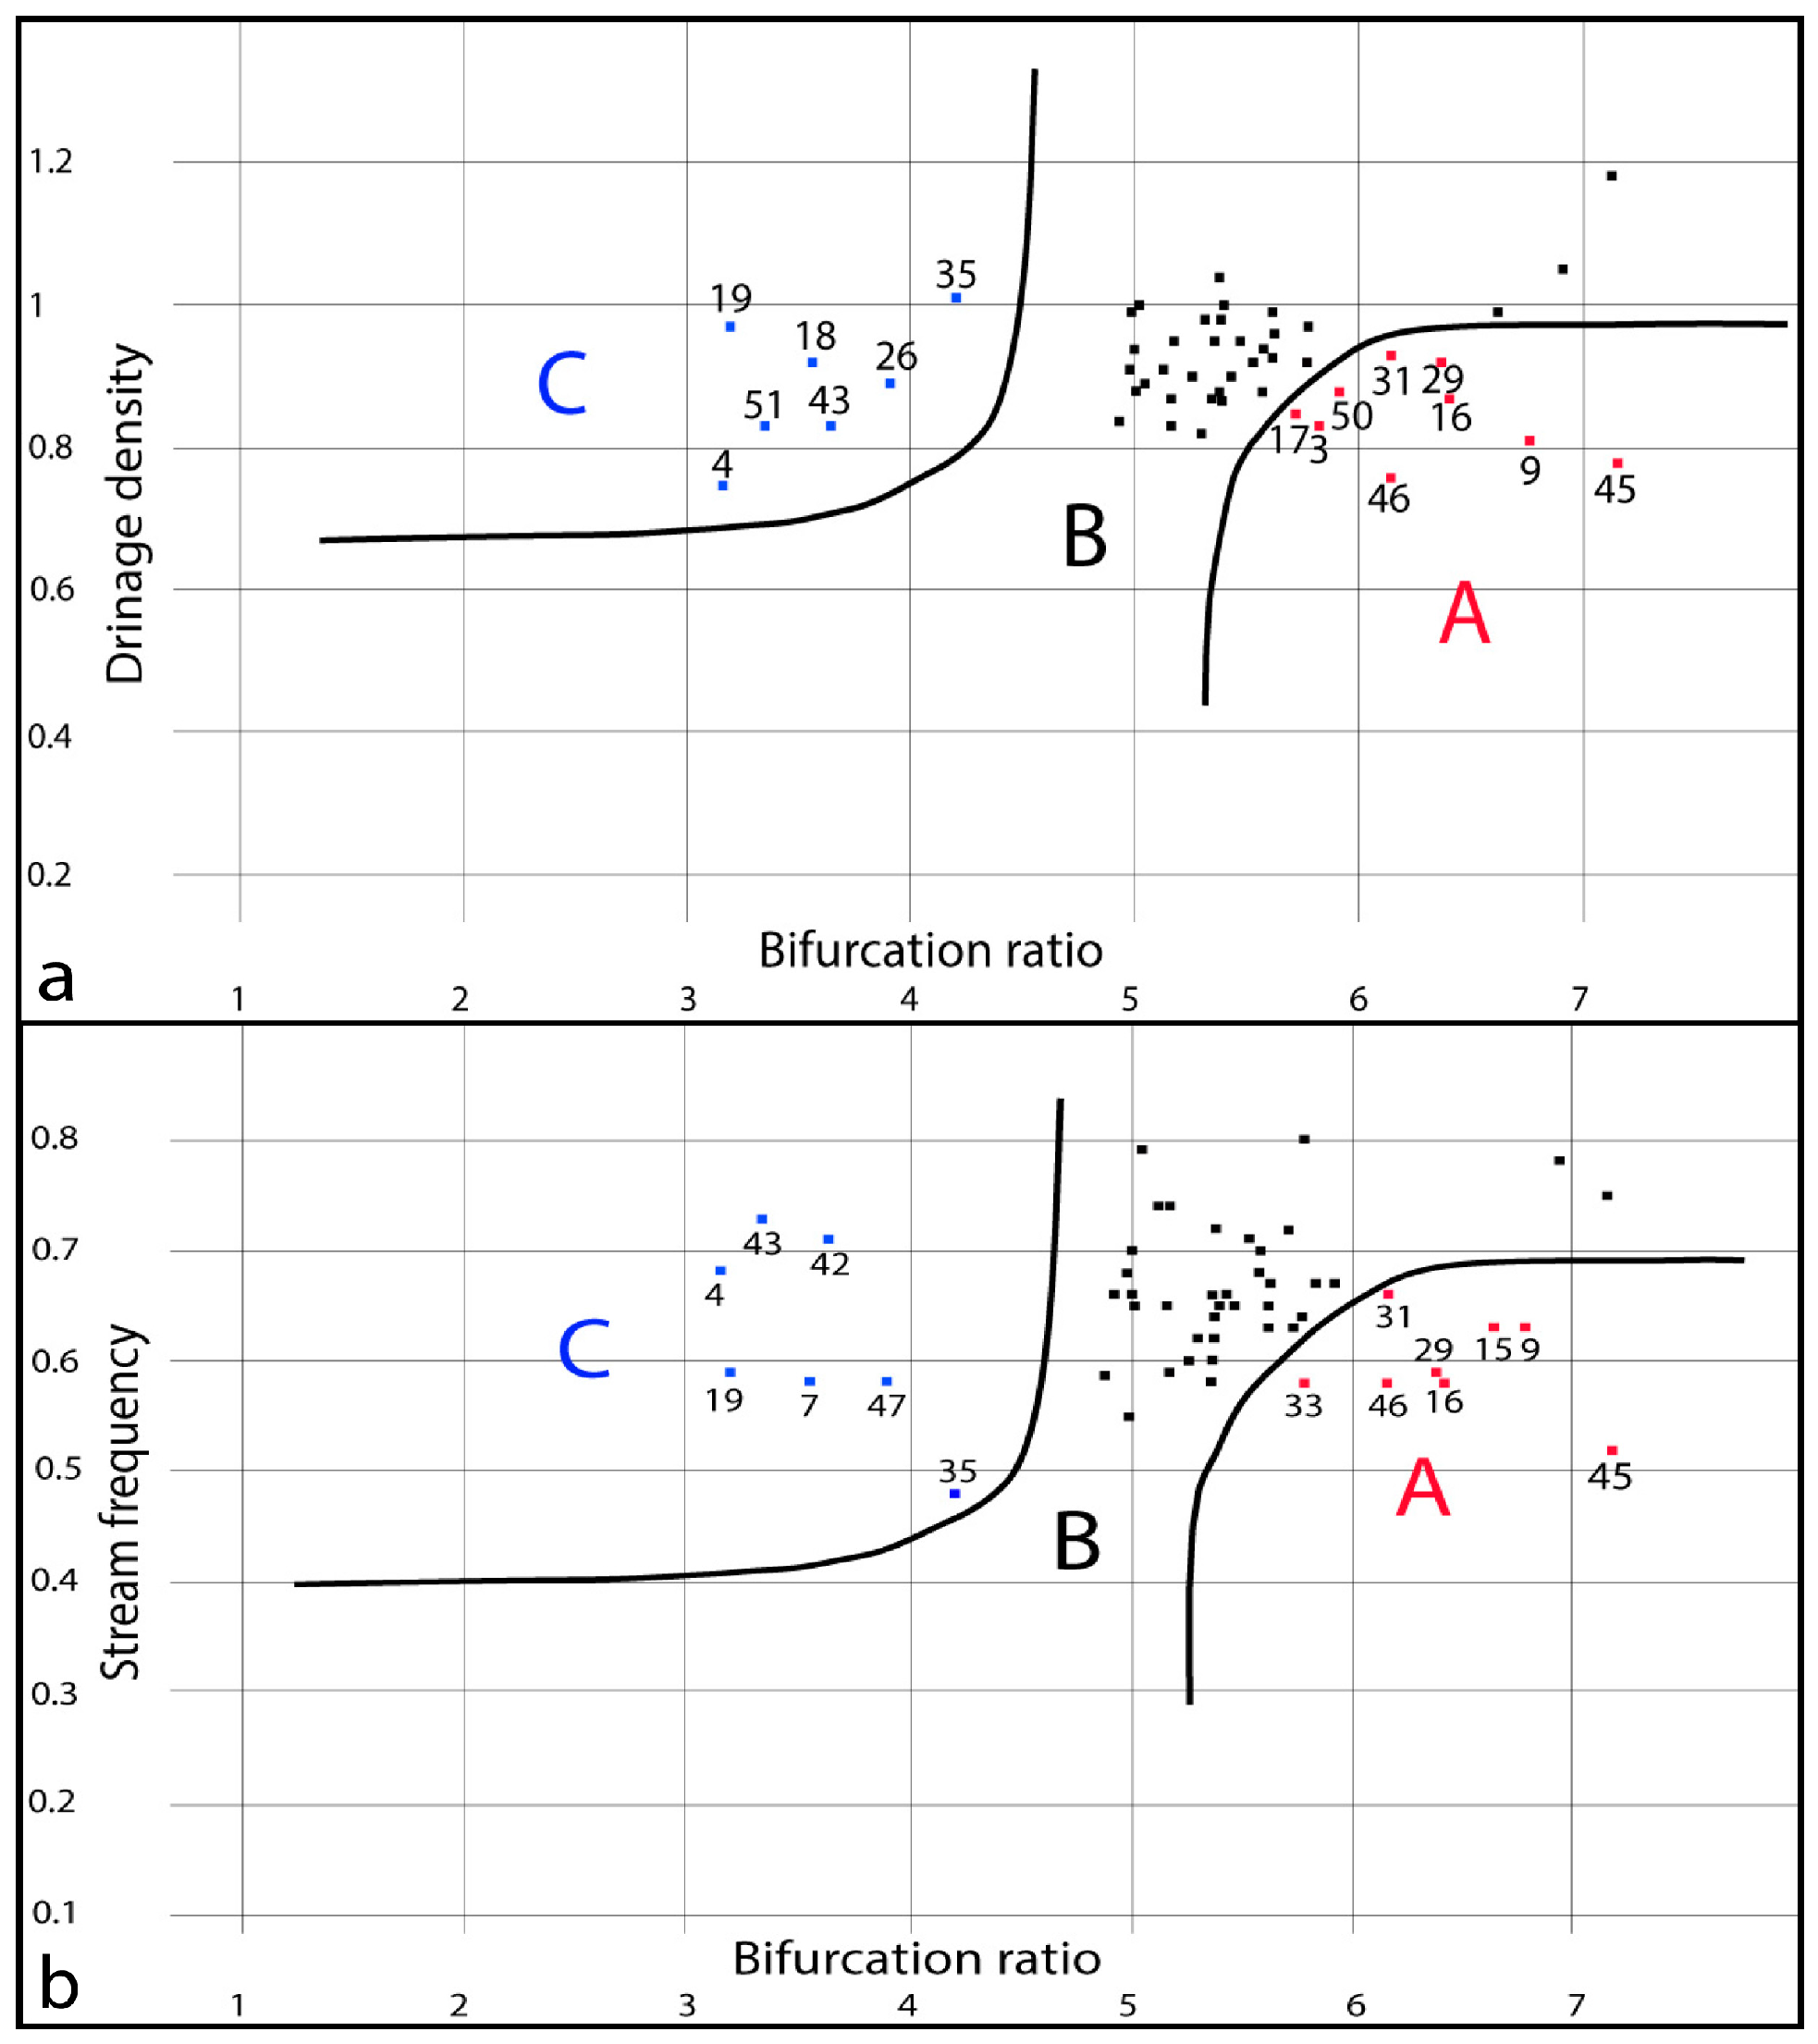
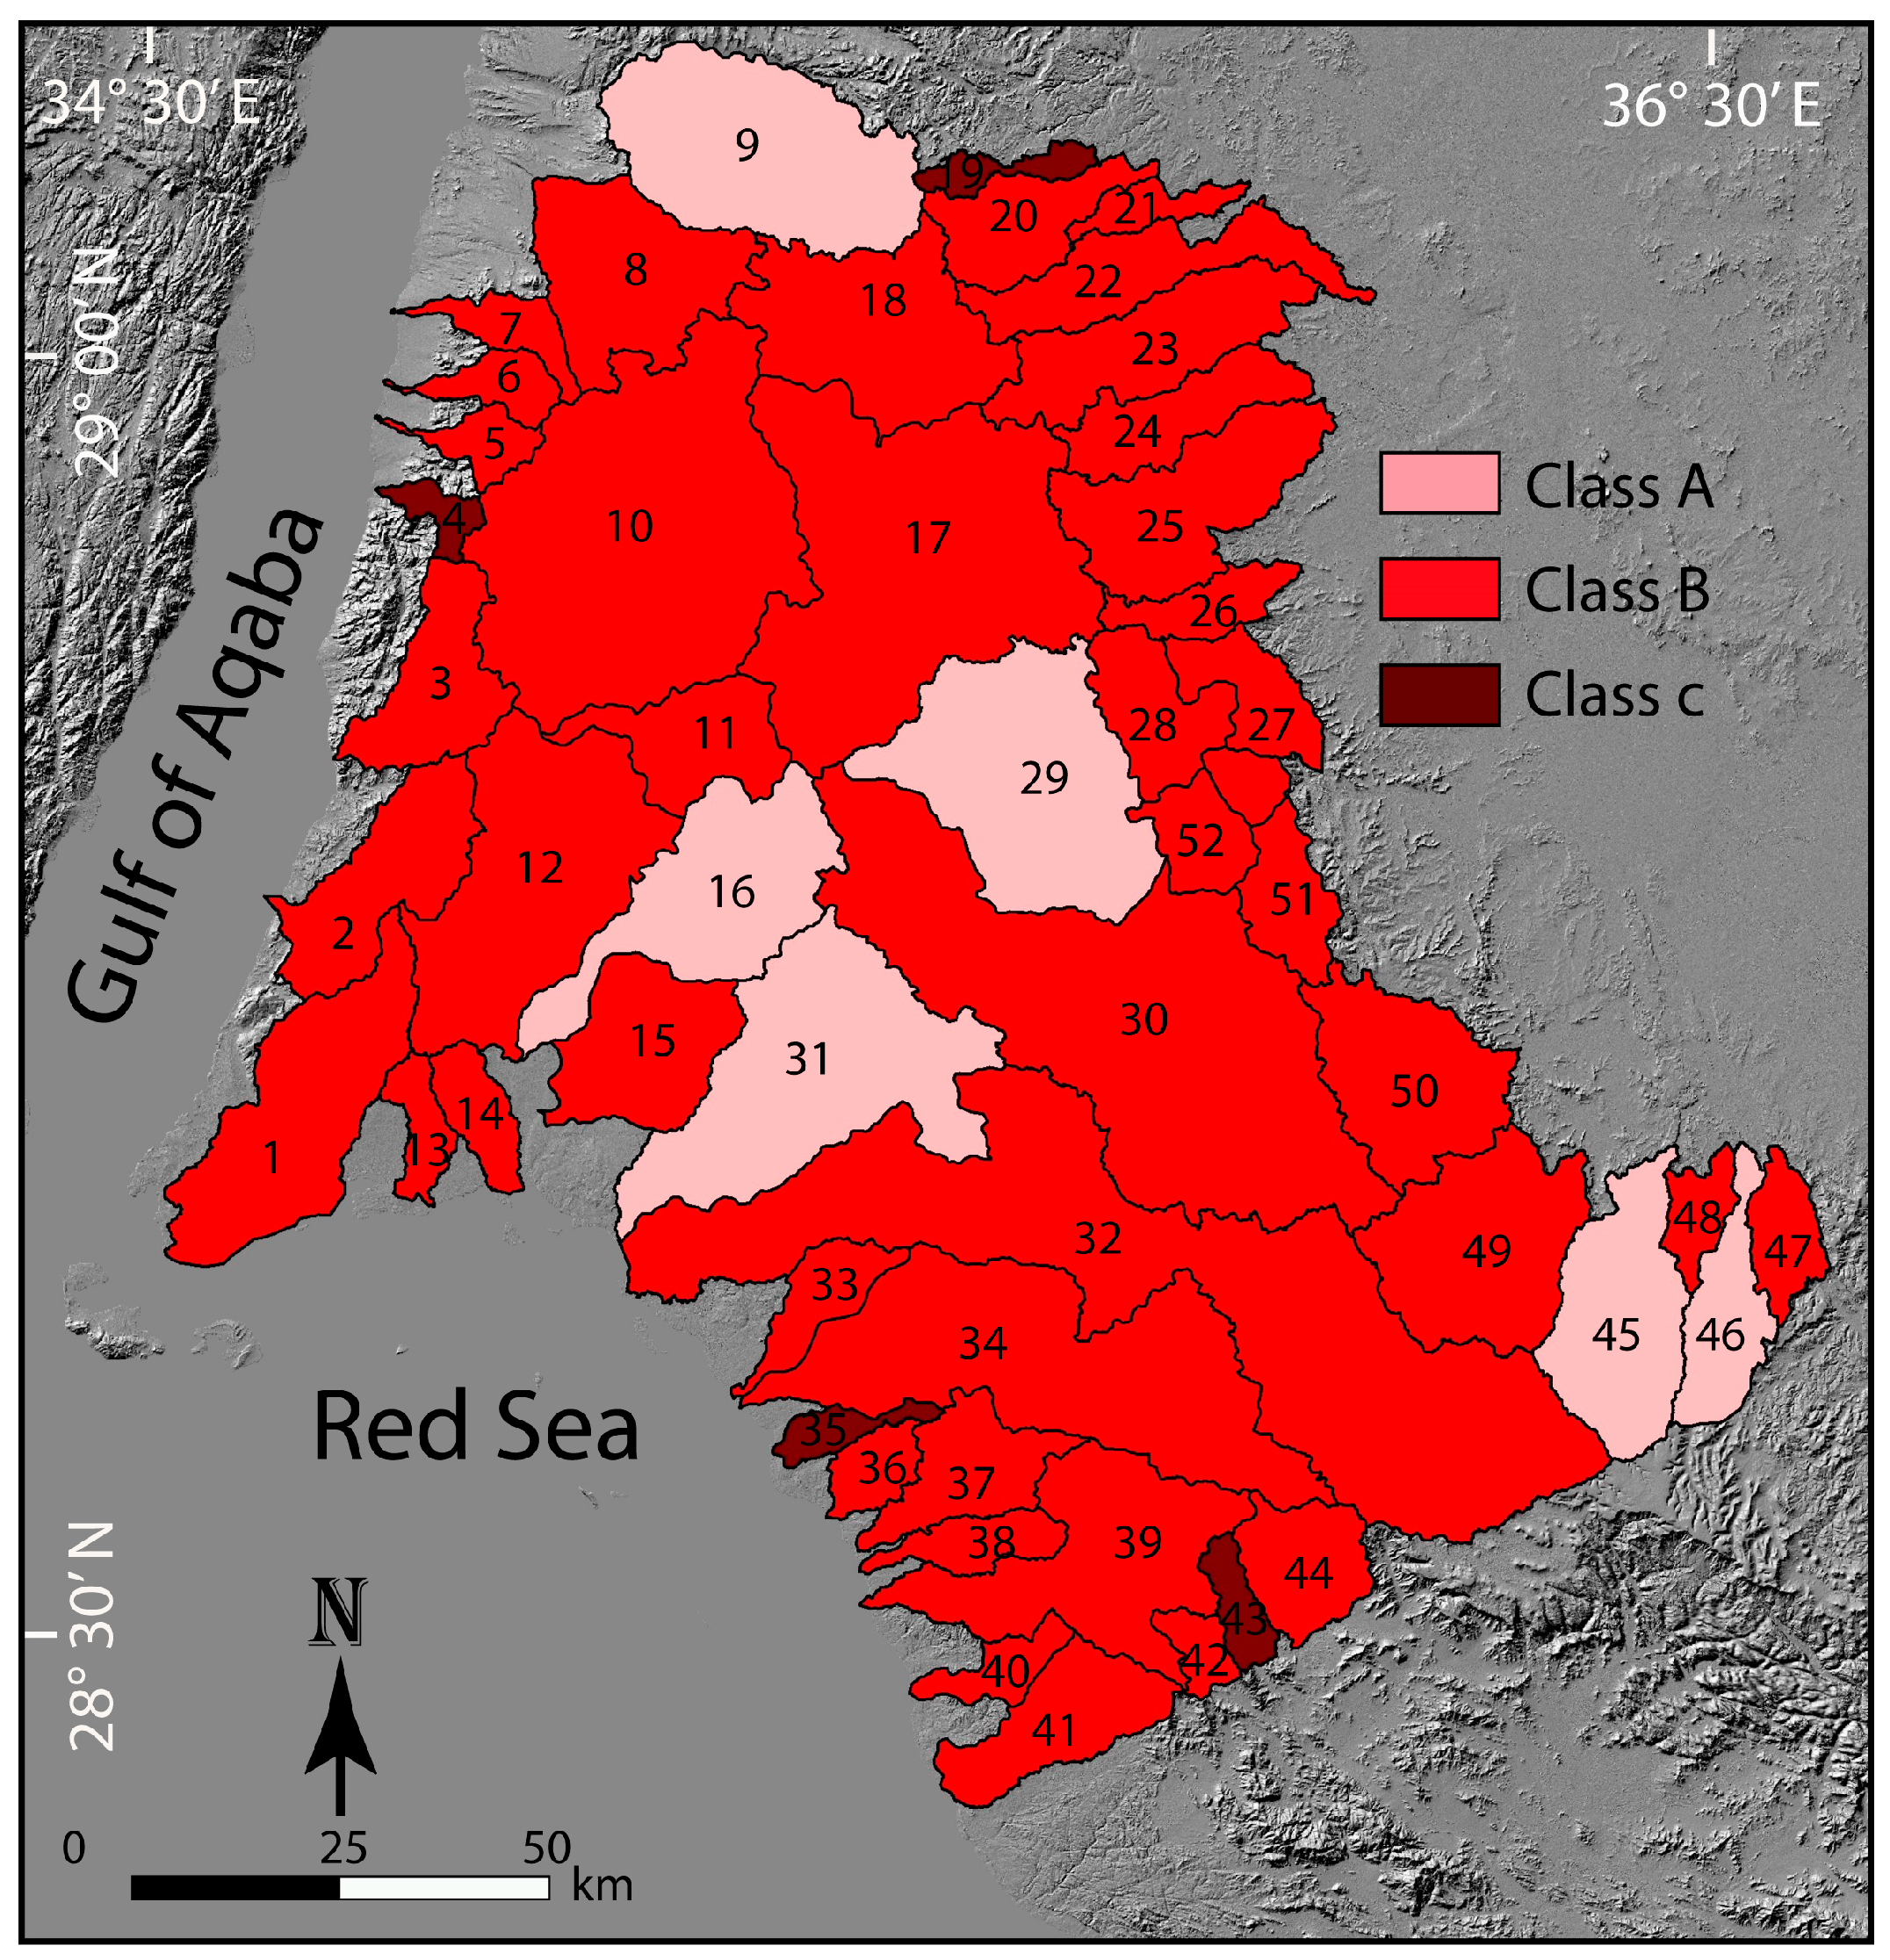
4.2.3. Morphometric Analysis, the El-Shamy Approach, and Flood Hazard Mapping

Different behaviors and conditions of flash flood hazards can be evaluated and modeled by investigating a number of morphometric parameters such as the area, length of the basins, basin elongation ratio, form factor, circularity ratio, drainage density, and drainage frequency. In general, medium values of drainage density and frequency parameters of different landforms are expected to indicate suitable conditions for the minimum peak of the runoff [3,41,47]. The results of these significant parameters suggested that the lag time is relatively high in the study city, indicating fewer chances for flash flooding events to happen, as these particular conditions support infiltration, more so than the runoff formation peak. Additionally, high conditions of infiltration capacity resulting from low values of the infiltration number parameter and different physical properties of the lithology of the study city suggest that the possibility of severe flooding is relatively very low. Generally, a high number of the permeability conditions of a drainage basin could be described by high rainfall amounts over a large area for a wet long season. Since basins 1, 10, 12, 17, 30, 31, 32, and 34 occupy most of Neom city (9128.452 km2), their morphometric parameters indicate less suitable conditions for the occurrence of flooding hazards in the lowland areas of the study basins. The upper part of the study city is less prone to flash flooding events compared with the rest of Neom city. In this study, the authors tried to confirm the flood hazard results from the analysis of the morphometric parameters using another effective method. The El-Shamy approach provides two different graphs. The first graph is a relationship between the bifurcation ratio and drainage density and the other is between the bifurcation ratio and stream frequency (Figure 8a,b). These relationships aim to investigate the most effective parameters in food hazard assessment including the bifurcation ratio, drainage density, and stream frequency of all the basins in the study city. Using this method, three different classes of flood hazard assessments were recognized as A, B, and C. According to the first chart, nine basins are plotted in zone A (3, 9, 16, 17, 29, 31, 45, 46, and 50); seven basins are plotted in zone C (4, 18, 19, 26, 35, 26, 43); and the rest are plotting in sone B. The second chart shows that zone A covers basins 9, 15, 16, 29, 31, 33, 45, and 46; zone C encompasses basins 4, 7, 19, 35, 42, and 43; and zone B covers the rest of the basins. In his work, El-Shamy [38] defined these three classes into the low flood hazard level (Class A), the moderate flood hazard level (Class B), and the high flood hazard level (Class C) (Figure 8). This classification can be used to assign landscapes and landforms into low, moderate, and high flood susceptibility zones for this kind of hazard. Finally, and according to this method, four basins (4, 19, 35, and 43) were recorded to be in Class C, which reflects high possible conditions for flood hazards (Figure 9). They represent about 1.32% of the total area. Six basins (9, 16, 29, 31, 45, and 46) were observed to belong to Class A, which presents low conditions of flood hazard by about 16.9% of the total area. Therefore, about 81.78% reflect moderate fold hazard signals, confirming that the majority of the study city is under moderate fold hazard conditions (Figure 8 and Figure 9). The El-Shamy approach suggests that the model of the El-Shamy method is compatible with the results of the morphometric analysis, confirming that the possibility of severe flash flooding hazards is relatively low.

4.2.4. Morphometric Parameters and Soil Erosion Processes

Soil erosion behaviors, intensity, and characteristics of different landforms can be modeled and inferred from relief aspect parameters including basin relief, the basin relief ratio, channel gradients, ruggedness number, and basin total length [6]. The averaged results of these parameters indicate that Neom city is topographically medium rugged and shows basins with steeper slopes, allowing small sediments to be produced and transported for short lengths. Thus, Neom city provides moderate conditions for soil erosion, which is high along the middle N-S zone of Neom city. Moreover, basins with high elongation characteristics and drainage configurations, including medium values of drainage density, coarse drainage textures, and low values of drainage density could help in facilitating an equilibrium state for the high rate of soil erosion processes that may be produced from topographic impact. Thus, basins 1, 2, 12, 30, 32, and 34 are highly susceptible to erosion of headwater compared with the other basins. In general, the presence of less resistant rocks and soils may significantly help in accelerating the soil erosion processes [68].

4.2.5. Basin Morphometric and Groundwater Recharge Impact

Several morphometric parameters influence landform groundwater recharge, including basin areal characteristics, stream frequency, drainage density, drainage texture, stream and overland flow lengths, and infiltration numbers. Previous analyses of the significant parameters helped to understand the infiltration capacity and runoff generation characteristics [26,62]. In the current study, values of those parameters, particularly the infiltration number parameter, reflected passive signals about the groundwater recharge. Thus, basins 4, 26, 38, 42, 43, and 51 present conditions of high groundwater impact in comparison with the other basins. On the other hand, the formation and transportation of water runoff could be processed based on the existence of permeable levels of rocks and soils, which is inferred from basin drainage characteristics and lithological and hydrological maps. Additionally, despite the high rate of observed infiltration, the runoff volume could be high due to many factors such as a large drainage area, a high amount of rainfall, and a high number of stream orders [26]. Data for the high/dry seasons of Neom city indicate a high amount of groundwater discharge during wet periods and base flow during dry periods. Furthermore, lithological studies (i.e., [23]) suggested that fractured rocks underlie a vast area of the city and provide suitable conditions for the formation of water aquifers. This suggests that Neom city has potentially vast surface water and groundwater resources.

5. Conclusions

In the current study, geospatial technique-based morphometric analysis was applied successfully to examine and assess an important region in Saudi Arabia. Neom city areas were classified into 52 different basins using hydrology tools in ArcGIS software. The morphometric analysis applied on these basins was used to calculate linear, areal, and relief aspects groups for every single basin in Neom city. Accordingly, the largest basins including basin 10, basin 12, basin 30, basin 32, and basin 34 had the highest values of stream orders and lengths and the lowest values of the bifurcation ratio. Furthermore, the highest values of drainage texture were observed for basin 13 and basin 38 at 0.88 and 0.80, respectively. Similarly, the highest values of the elongation ratio, channel maintenance constant, overland flow path, and infiltration number were 12.5, 1.33, 0.59, and 0.90 for basins 30, 4, 13, and 4, respectively. The highest relief was recorded for the middle zone of the study city including basins 8, 10, 16, 17, 30, 32, 34, and 44. Additionally, they present high values of the relief ratio, ruggedness number, basin slope, and gradient ratio. For more details, all morphometric parameter values are tabulated in Table 2, and their distributions are illustrated in the Supplementary Materials. Therefore, due to the current morphometric analysis, information on the characteristics of Neom city lithological units could be extracted from related parameters including the drainage system, mean stream length, constant of channel maintenance, and bifurcation ratio. The values of these parameters suggest that the underlying lithology of the study city provides uniform levels of resistance and fewer structural frameworks. It also suggests that the basins’ geological development is spatially distributed, and the region is less vulnerable to flood events. To confirm flood hazard assessment signals, in this study, the El-Shamy approach is applied based on three effective morphometric parameters, namely, the bifurcation ratio, drainage density, and stream frequency. The results of this method provide two relationship graphs showing the bifurcation ratio against drainage density and stream frequency. The bifurcation ratio against the drainage density graph shows that nine basins were plotted in zone A (3, 9, 16, 17, 29, 31, 45, and 46), while basins (4, 18, 19, 26, 35, 43, and 51) were plotted in zone C. The remaining basins were recorded in zone B. On the other hand, the bifurcation ratio against the stream frequency graph records basins (9, 15, 16, 29, 31, 33, 45, and 46) in zone A, while it shows basins (4, 7, 19, 35, 42, 43, and 47) in zone C. Based on these two graphs, only 1.32% of the total city area presents high conditions of flood hazard susceptibility. This conclusion is compatible with the results of the morphometric analysis, which suggest that the possibility of severe flood hazard is very low. Furthermore, Neom city presents a high susceptibility level to soil erosion resulting from different topographic factors, including relief roughness and slope steepness that generally accelerate the capabilities of heavy rainfall for both soil formation and transformation. Therefore, the results of this paper suggest that the N-S middle zone is highly susceptible to soil erosion processes. In the current study, soil erosion susceptibility could be reduced because of the depth of the soil and/or the presence of vegetation cover aiding in reducing the energy of the runoff and rainfall erosive processes. Moreover, characteristics of more elongated and longer basins could minimize the topographic influence on the studied soil erosion. The current quantitative analysis further suggests a high rate of groundwater resources in the proposed Neom city. Although high and rugged topography covers the middle N-S zone, in addition to the steep slope of the basins, low to medium values of their drainage characteristics suggest that there are other indices controlling the relief description of the study city. Thus, based on this study, we recommend further analyses to investigate these argued issues. In general, this study applied a time- and cost-effective technique to present valuable information about the hydro-geomorphological and geological characteristics of Neom city. Moreover, the results of this morphometric study should be complemented and discussed in other interdisciplinary studies (i.e., geophysical and hydrological studies) for eventual use by decision-makers. With the continuing and extensive efforts to develop the environment and protect it against natural hazards effects, sustainability strategies and methods have been developed and applied to big and important projects. Initiating a good sustainable management plan helps to obtain the most benefits and protections in the long run. The results and information extracted from the analysis of hydro-morphology, basin morphology and lithology, drainage topography, underground recharge, and soil erosion may aid in building a comprehensive model of environmental behaviors and characteristics of the study city. Additionally, natural hazards are obtaining more significance in the fields of sustainable management and design. In this study, a flash hazard map classified the city based on the flood intensity signals. Therefore, based on the hydrological analysis associated with morphological, lithological, and soil information, a good sustainable plan could be designed and discussed. This work recommends additional studies to assess the contribution of this study to the sustainability plan that will be run and that can present a better understanding of socioeconomic and scientific sustainability development plans. Finally, this study provides a comprehensive model of a critical and important region to the Saudi government in which few studies have been undertaken about an effective sustainability management plan of hydrology, natural hazards, and geomorphology.

Supplementary Materials

The following supporting information can be downloaded at: https://www.mdpi.com/article/10.3390/su16010023/s1, Distribution of results for the investigated all-morphometric parameters; Figures S1–S16. S1: Map showing the distribution of the stream length parameter results. S2: Map showing the distribution of the mean stream length parameter results. S3: Map showing the distribution of the bifurcation ratio parameter results. S4: Map showing the distribution of the drainage density parameter results. S5: Map showing the distribution of the stream frequency parameter results. S6: Map showing the distribution of the drainage texture parameter results. S7: Map showing the distribution of overland flow length parameter results. S8: Map showing the distribution of the channel maintenance constant parameter results. S9: Map showing the distribution of the form factor parameter results. S10: Map showing the distribution of the elongation ratio parameter results. S11: Map showing the distribution of the circularity ratio parameter results. S12: Map showing the distribution of the basin shape parameter results. S13: Map showing the distribution of the infiltration number parameter results. S14: Map showing the distribution of the relief ratio parameter results. S15: Map showing the distribution of the ruggedness number parameter results. S16: Map showing the distribution of the basin slope parameter results.

Author Contributions

Conceptualization, B.B. and A.A.; methodology, B.B.; software, A.A.; validation, B.B. and A.A.; formal analysis, B.B.; investigation, A.A.; resources, B.B.; data curation, B.B.; writing—original draft preparation, B.B. and A.A.; writing—review and editing, B.B. and A.A.; visualization, B.B.; supervision, A.A.; project administration, B.B. and A.A.; funding acquisition, B.B. and A.A. All authors have read and agreed to the published version of the manuscript.

Funding

This research was supported by the Researchers Supporting Project number (RSP2024R296), King Saud University, Riyadh, Saudi Arabia.

Institutional Review Board Statement

Not applicable.

Informed Consent Statement

Not applicable.

Data Availability Statement

Data are contained within the article and supplementary materials.

Conflicts of Interest

The authors declare no conflict of interest.

References

  1. Aboud, E.; Alqahtani, F.; Abdulfarraj, M.; Abraham, E.; El-Masry, N.; Osman, H. Geothermal Imaging of the Saudi Cross-Border City of NEOM Deduced from Magnetic Data. Sustainability 2023, 15, 4549. [Google Scholar] [CrossRef]
  2. Iqbal, M.; Sajjad, H.; Bhat, F.A. Morphometric Analysis of Shaliganga Sub Catchment, Kashmir Valley, India Using Geographical Information System. Int. J. Eng. Trends Technol. 2013, 4, 10–21. [Google Scholar]
  3. Singh, P.; Gupta, A.; Singh, M. Hydrological Inferences from Watershed Analysis for Water Resource Management Using Remote Sensing and GIS Techniques. Egypt. J. Remote Sens. Sp. Sci. 2014, 17, 111–121. [Google Scholar] [CrossRef]
  4. Bloomfield, J.P.; Bricker, S.H.; Newell, A.J. Some Relationships between Lithology, Basin Form and Hydrology: A Case Study from the Thames Basin, UK. Hydrol. Process. 2011, 25, 2518–2530. [Google Scholar] [CrossRef]
  5. Chandrashekar, H.; Lokesh, K.V.; Sameena, M.; Roopa, J.; Ranganna, G. GIS –Based Morphometric Analysis of Two Reservoir Catchments of Arkavati River, Ramanagaram District, Karnataka. Aquat. Procedia 2015, 4, 1345–1353. [Google Scholar] [CrossRef]
  6. Kabite, G.; Gessesse, B. Hydro-Geomorphological Characterization of Dhidhessa River Basin, Ethiopia. Int. Soil Water Conserv. Res. 2018, 6, 175–183. [Google Scholar] [CrossRef]
  7. Tariq, M.A.U.R.; Van de Giesen, N. Floods and Flood Management in Pakistan. Phys. Chem. Earth 2012, 47–48, 11–20. [Google Scholar] [CrossRef]
  8. Bajabaa, S.; Masoud, M.; Al-Amri, N. Flash Flood Hazard Mapping Based on Quantitative Hydrology, Geomorphology and GIS Techniques (Case Study of Wadi Al Lith, Saudi Arabia). Arab. J. Geosci. 2014, 7, 2469–2481. [Google Scholar] [CrossRef]
  9. Ullah, K.; Zhang, J. GIS-Based Flood Hazard Mapping Using Relative Frequency Ratio Method: A Case Study of Panjkora River Basin, Eastern Hindu Kush, Pakistan. PLoS ONE 2020, 15, e0229153. [Google Scholar] [CrossRef]
  10. Radaideh, O.M.A.; Grasemann, B.; Melichar, R.; Mosar, J. Detection and Analysis of Morphotectonic Features Utilizing Satellite Remote Sensing and GIS: An Example in SW Jordan. Geomorphology 2016, 275, 58–79. [Google Scholar] [CrossRef]
  11. Khalifa, A.; Çakır, Z.; Kaya, Ş.; Gabr, S. ASTER Spectral Band Ratios for Lithological Mapping: A Case Study for Measuring Geological Offset along the Erkenek Segment of the East Anatolian Fault Zone, Turkey. Arab. J. Geosci. 2020, 13, 832. [Google Scholar] [CrossRef]
  12. Khalifa, A.; Bashir, B.; Abdullah, A.; Öğretmen, N. Morpho-Tectonic Assessment of the Abu-Dabbab Area, Eastern Desert, Egypt: Insights from Remote Sensing and Geospatial Analysis. ISPRS Int. J. Geo-Inf. 2021, 10, 784. [Google Scholar] [CrossRef]
  13. Patel, A.; Katiyar, S.K.; Prasad, V. Performances Evaluation of Different Open Source DEM Using Differential Global Positioning System (DGPS). Egypt. J. Remote Sens. Sp. Sci. 2016, 19, 7–16. [Google Scholar] [CrossRef]
  14. Khalifa, A.; Bashir, B.; Alsalman, A.; Naik, S.P.; Nappi, R. Remotely Sensed Data, Morpho-Metric Analysis, and Integrated Method Approach for Flood Risk Assessment: Case Study of Wadi Al-Arish Landscape, Sinai, Egypt. Water 2023, 15, 1797. [Google Scholar] [CrossRef]
  15. Moore, I.D.; Grayson, R.B.; Ladson, A.R. Digital Terrain Modelling: A Review of Hydrological, Geomorphological, and Biological Applications. Hydrol. Process. 1991, 5, 3–30. [Google Scholar] [CrossRef]
  16. Khalifa, A.; Bashir, B.; Alsalman, A.; Bachir, H. Morphometric-Hydro Characterization of the Coastal Line between El-Qussier and Marsa-Alam, Egypt: Preliminary Flood Risk Signatures. Appl. Sci. 2022, 12, 6264. [Google Scholar] [CrossRef]
  17. Khalifa, A.; Çakir, Z.; Owen, L.A.; Kaya, Ş. Morphotectonic Analysis of the East Anatolian Fault, Turkey. Turkish J. Earth Sci. 2018, 27, 110–126. [Google Scholar] [CrossRef]
  18. Mesa, L.M. Morphometric Analysis of a Subtropical Andean Basin (Tucumán, Argentina). Environ. Geol. 2006, 50, 1235–1242. [Google Scholar] [CrossRef]
  19. Tsodoulos, I.M.; Koukouvelas, I.K.; Pavlides, S. Tectonic Geomorphology of the Easternmost Extension of the Gulf of Corinth (Beotia, Central Greece). Tectonophysics 2008, 453, 211–232. [Google Scholar] [CrossRef]
  20. Ul-hadi, S.; Khan, S.D.; Owen, L.A.; Khan, A.S.; Sciences, A. Geomorphic Response to an Active Transpressive Regime: A Case Study along the Chaman Strike-Slip Fault, Western Pakistan. Earth Surf. Process. Landforms 2013, 264, 250–264. [Google Scholar] [CrossRef]
  21. Alzahrani, H.; Abdelrahman, K.; Qaysi, S.; Baras, M. Seismicity of the Neom Megaproject Area, Northwestern Saudi Arabia. J. King Saud Univ.-Sci. 2022, 34, 101659. [Google Scholar] [CrossRef]
  22. Aboulela, H.A.; Aboud, E.; Bantan, R.A. Seismicity and Major Geologic Structures of Tiran and Sanafir Islands and Their Surroundings in the Red Sea. Environ. Earth Sci. 2017, 76, 793. [Google Scholar] [CrossRef]
  23. Kahal, A.Y. Geological Assessment of the Neom Mega-Project Area, Northwestern Saudi Arabia: An Integrated Approach. Arab. J. Geosci. 2020, 13, 345. [Google Scholar] [CrossRef]
  24. Sun, G.; Ranson, K.J.; Kharuk, V.I.; Kovacs, K. Validation of Surface Height from Shuttle Radar Topography Mission Using Shuttle Laser Altimeter. Remote Sens. Environ. 2003, 88, 401–411. [Google Scholar] [CrossRef]
  25. El Hamdouni, R.; Irigaray, C.; Fernández, T.; Chacón, J.; Keller, E.A. Assessment of Relative Active Tectonics, Southwest Border of the Sierra Nevada (Southern Spain). Geomorphology 2008, 96, 150–173. [Google Scholar] [CrossRef]
  26. Soni, S. Assessment of Morphometric Characteristics of Chakrar Watershed in Madhya Pradesh India Using Geospatial Technique. Appl. Water Sci. 2017, 7, 2089–2102. [Google Scholar] [CrossRef]
  27. Asfaw, D.; Workineh, G. Quantitative Analysis of Morphometry on Ribb and Gumara Watersheds: Implications for Soil and Water Conservation. Int. Soil Water Conserv. Res. 2019, 7, 150–157. [Google Scholar] [CrossRef]
  28. Guidolini, J.F.; Ometto, J.P.H.B.; Nery, T.D.; Arcoverde, G.F.B.; Giarolla, A. Hydro-Geomorphological Characterization of the Rio Grande Basin, Brazil, Using Geospatial Approach. Sustain. Water Resour. Manag. 2020, 6, 93. [Google Scholar] [CrossRef]
  29. Saha, S.; Das, J.; Mandal, T. Investigation of the Watershed Hydro-Morphologic Characteristics through the Morphometric Analysis: A Study on Rayeng Basin in Darjeeling Himalaya. Environ. Chall. 2022, 7, 100463. [Google Scholar] [CrossRef]
  30. Chakraborty, S. Application of Basin Morphometry for Hydro-Geomorphological Implications: A Study of the Indo-Bhutanese Duduya Watershed. J. Geol. Soc. India 2023, 99, 473–486. [Google Scholar] [CrossRef]
  31. Youssef, A.M.; Pradhan, B.; Gaber, A.F.D.; Buchroithner, M.F. Geomorphological Hazard Analysis along the Egyptian Red Sea Coast between Safaga and Quseir. Nat. Hazards Earth Syst. Sci. 2009, 9, 751–766. [Google Scholar] [CrossRef]
  32. Abdalla, F.; El Shamy, I.; Bamousa, A.O.; Mansour, A.; Mohamed, A.; Tahoon, M. Flash Floods and Groundwater Recharge Potentials in Arid Land Alluvial Basins, Southern Red Sea Coast, Egypt. Int. J. Geosci. 2014, 05, 971–982. [Google Scholar] [CrossRef]
  33. Asode, A.N.; Sreenivasa, A.; Lakkundi, T.K. Quantitative Morphometric Analysis in the Hard Rock Hirehalla Sub-Basin, Bellary and Davanagere Districts, Karnataka, India Using RS and GIS. Arab. J. Geosci. 2016, 9, 381. [Google Scholar] [CrossRef]
  34. Rekha, V.B.; George, A.V.; Rita, M. Morphometric Analysis and Micro-Watershed Prioritization of Peruvanthanam Sub-Watershed, the Manimala River Basin, Kerala, South India. Environ. Res. Eng. Manag. 2011, 57, 6–14. [Google Scholar]
  35. Mahmood, S.A.; Gloaguen, R. Appraisal of Active Tectonics in Hindu Kush: Insights from DEM Derived Geomorphic Indices and Drainage Analysis. Geosci. Front. 2012, 3, 407–428. [Google Scholar] [CrossRef]
  36. Romshoo, S.A.; Bhat, S.A.; Rashid, I. Geoinformatics for Assessing the Morphometric Control on Hydrological Response at Watershed Scale in the Upper Indus Basin. J. Earth Syst. Sci. 2012, 121, 659–686. [Google Scholar] [CrossRef]
  37. Mahala, A. The Significance of Morphometric Analysis to Understand the Hydrological and Morphological Characteristics in Two Different Morpho-Climatic Settings. Appl. Water Sci. 2020, 10, 33. [Google Scholar] [CrossRef]
  38. El-Shamy, I. Recent Recharge and Flash Flooding Opportunities in the Eastern Desert, Egypt. Annals of Geological Survey of Egypt. Ann. Geol. Surv. Egypt 1992, 18, 323–334. [Google Scholar]
  39. Bashir, B. Morphometric Parameters and Geospatial Analysis for Flash Flood Susceptibility Assessment: A Case Study of Jeddah City along the Red Sea Coast, Saudi Arabia. Water 2023, 15, 870. [Google Scholar] [CrossRef]
  40. Pal, B.; Samanta, S.P.D. Morphometric and Hydrological Analysis and Mapping for Watut Watershed Using Remote Sensing and GIS Techniques. Int. J. Adv. Eng. Technol. 2012, 3, 357–368. [Google Scholar]
  41. Strahler, A.N. Quantitative Geomorphology of Drainage Basins and Channel Networks. In Handbook of Applied Hydrology; Chow, V.T., Ed.; McGraw Hill B. Company: New York, NY, USA, 1964; pp. 4–11. [Google Scholar]
  42. Horton, R.E. Drainage-basin Characteristics. Trans. Am. Geophys. Union 1932, 13, 350–361. [Google Scholar] [CrossRef]
  43. Horton, R.E. Erosional Development of Streams and Their Drainage Basins: Hydrophysical Approach to Quantitative Morphology. Bull. Geol. Soc. Am. 1945, 56, 275–370. [Google Scholar] [CrossRef]
  44. Schumm, S.A. Evolution of Drainage Systems and Slopes in Badlands at Perth Amboy, New Jersey. Bull. Geol. Soc. Am. 1956, 67, 597–646. [Google Scholar] [CrossRef]
  45. Strahler, A. Dynamic Basis of Geomorphology. Geol. Soc. Am. Bull. 1952, 63, 923–938. [Google Scholar] [CrossRef]
  46. Smith, K.G. Standards for Grading Texture of Erosional Topography. Am. J. Sci. 1950, 248, 655–668. [Google Scholar] [CrossRef]
  47. Miller, V.C. A Quantitative Geomorphic Study of Drainage Basin Characteristics in the Clinch Mountain Area, Virginia and Tennessee; Department of Geology, Columbia University: New York, NY, USA, 1953; pp. 389–402. [Google Scholar]
  48. Faniran, A. The Index of Drainage Intensity—A Provisional New Drainage Factor. Aust. J. Sci. 1968, 31, 328–330. [Google Scholar]
  49. Strahler, A.N. Quantitative Analysis of Watershed Geomorphology. Trans. Am. Geophys. Union 1957, 38, 913–920. [Google Scholar] [CrossRef]
  50. Withanage, N.S.; Dayawansa, N.D.K.; De Silva, R.P. Morphometric Analysis of the Gal Oya River Basin Using Spatial Data Derived from GIS. Trop. Agric. Res. 2015, 26, 175. [Google Scholar] [CrossRef]
  51. Grade, R.J. River Morphology; New Age International (Pvt) Ltd.: New Delhi, India, 2005. [Google Scholar]
  52. Ramsay, C.R.; Odell, J.; Drysdall, A.R. Felsic Plutonic Rocks of the Midyan Region, Kingdom of Saudi Arabia-II. Pilot Study in Chemical Classification of Arabian Granitoids. J. Afr. Earth Sci. 1986, 4, 79–85. [Google Scholar] [CrossRef]
  53. Hajam, R.A.; Hamid, A.B. Application of Morphometric Analysis for Geo-Hydrological Studies Using Geo-Spatial Technology –A Case Study of Vishav Drainage Basin. J. Waste Water Treat. Anal. 2013, 4, 157. [Google Scholar] [CrossRef]
  54. Bharadwaj, A.K.; Pradeep, C.; Thirumalaivasan, D.; Shankar, C.P.; Madhavan, N. Morphometric Analysis of Adyar Watershed. IOSR J. Mech. Civ. Eng. 2014, 71–77. [Google Scholar]
  55. Bhat, M.S.; Alam, A.; Ahmad, S.; Farooq, H.; Ahmad, B. Flood Hazard Assessment of Upper Jhelum Basin Using Morphometric Parameters. Environ. Earth Sci. 2019, 78, 54. [Google Scholar] [CrossRef]
  56. Obi Reddy, G.P.; Maji, A.K.; Gajbhiye, K.S. Drainage Morphometry and Its Influence on Landform Characteristics in a Basaltic Terrain, Central India—A Remote Sensing and GIS Approach. Int. J. Appl. Earth Obs. Geoinf. 2004, 6, 1–16. [Google Scholar] [CrossRef]
  57. Babu, K.J.; Sreekumar, S.; Aslam, A. Implication of Drainage Basin Parameters of a Tropical River Basin of South India. Appl. Water Sci. 2016, 6, 67–75. [Google Scholar] [CrossRef]
  58. Bhatt, S.; Ahmed, S.A. Morphometric Analysis to Determine Floods in the Upper Krishna Basin Using Cartosat DEM. Geocarto Int. 2014, 29, 878–894. [Google Scholar] [CrossRef]
  59. Dar, I.A.; Prabu, P.; Dar, M.A. Erosion Modeling in Hard Rock Terrain Using Morphometry: A Case Study from Tamilnadu, India. Environ. Qual. Manag. 2013, 23, 47–60. [Google Scholar] [CrossRef]
  60. Gregory, K.J.; Wallingford, D.E. Drainage Basin Form and Process—A Geomorphological Approach; Edward Arnold: London, UK, 1973. [Google Scholar] [CrossRef]
  61. Alam, A.; Ahmed, B.; Sammonds, P. Flash Flood Susceptibility Assessment Using the Parameters of Drainage Basin Morphometry in SE Bangladesh. Quat. Int. 2021, 575–576, 295–307. [Google Scholar] [CrossRef]
  62. Suparta, W.; Rahman, R.; Singh, M.S.J. Monitoring the Variability of Precipitable Water Vapor over the Klang Valley, Malaysia during Flash Flood. IOP Conf. Ser. Earth Environ. Sci. 2014, 20, 012057. [Google Scholar] [CrossRef]
  63. Altaf, S.; Meraj, G.; Romshoo, S.A. Morphometry and Land Cover Based Multi-Criteria Analysis for Assessing the Soil Erosion Susceptibility of the Western Himalayan Watershed. Environ. Monit. Assess. 2014, 186, 8391–8412. [Google Scholar] [CrossRef]
  64. Beven, K.J.; Kirkby, M.J. A Physically Based, Variable Contributing Area Model of Basin Hydrology. Hydrol. Sci. Bull. 1979, 24, 43–69. [Google Scholar] [CrossRef]
  65. Oruonye, E.; Ezekiel, B.; Atiku, H.; Baba, E.; Musa, N. Drainage Basin Morphometric Parameters of River Lamurde: Implication for Hydrologic and Geomorphic Processes. J. Agric. Ecol. Res. Int. 2016, 5, 1–11. [Google Scholar] [CrossRef]
  66. Weiss, A. Topographic Position and Landforms Analysis. In Proceedings of the ESRI User Conference, San Diego, CA, USA, 9–13 July 2001; Volume 64, pp. 227–245, Poster Present. [Google Scholar]
  67. Nag, S.K. Morphometric Analysis Using Remote Sensing Techniques in the Chaka Sub-Basin, Purulia District, West Bengal. J. Indian Soc. Remote Sens. 1998, 26, 69–76. [Google Scholar] [CrossRef]
  68. Altaf, F.; Meraj, G.; Romshoo, S.A. Morphometric Analysis to Infer Hydrological Behaviour of Lidder Watershed, Western Himalaya, India. Geogr. J. 2013, 2013, 178021. [Google Scholar] [CrossRef]
Figure 1. (a) Google Earth map of the Red Sea region showing the main countries and water bodies. The inset map and white dashed box show the location of the study and Neom city (b), respectively.
Sustainability 16 00023 g001
Figure 2. General geomorphological characteristics of Neom city: (a) Digital elevation model map (SRTM 30 spatial resolution), (b) Slope map. (c) Digital contouring map showing constant elevation, and (d) Stream order map presenting the river networks of the study city.
Sustainability 16 00023 g002
Figure 3. Simple flowchart showing the pre-processing steps.
Sustainability 16 00023 g003
Figure 4. Map of the study city showing the distribution of basins from 1 to 52 delineated by ArcGIS.
Sustainability 16 00023 g004
Figure 5. Map of the study city presenting basic geometries of the study basins. The colors white, red, yellow, and blue indicate the area (km2), perimeter (km), basin length (km), and basin relief (m), respectively.
Sustainability 16 00023 g005
Figure 6. Map of the study city presenting stream orders of the study basins. Yellow numbers indicate stream orders from I to V for all basins; respectively and black numbers show the basin numbers.
Sustainability 16 00023 g006
Figure 7. (a) Total stream length against stream order of Neom city, and (b) is an example from Kabite and Gessesse [6].
Sustainability 16 00023 g007
Figure 8. Flood susceptibility: (a) bifurcation ratio against drainage density, (b) bifurcation ratio against stream frequency. The A, B, and C symbols indicate Class A, Class B, and Class C, respectively.
Sustainability 16 00023 g008
Figure 9. Flood hazard map based on the El-Shamy approach method.
Sustainability 16 00023 g009
Table 1. Methods applied in the analysis of morphometric parameters.
Morphometric
Group
Morphometric
Parameters
MethodsReferences
Linear characteristicsStream order (Ou)Hierarchical rank[41]
Stream length (Lu) Lu = L1 + L2 + …… + Ln[42]
Stream number (Nu)Nu = N1 + N2 + …… + Nn[43]
Mean stream length (Lm)Lm = Lu/Nu[43]
Bifurcation ratio (Rb) Rb = Nu/Nu + 1; where Nu is a stream number value of any analyzed order and Nu + 1 indicates the stream number value of the next higher order [44]
Areal characteristicsDrainage density (Dd)Dd = Lu/A; where Lu represents the total basin stream length and A is the total basin area[45]
Stream frequency (Fs) Fs = Nu/A; where N is the stream number[43]
Drainage texture (Td)Td = Dd × Fs[46]
Overland flow length (Lg) Lg = ½ Dd [43]
Channel maintenance constant (C)C = 1/Dd[44]
Form factor (Ff) Ff = A/L2; where L is the basin length[43]
Elongation ratio (Re) Re = 2/L (A/π) ½[44]
Circularity ratio (Rc)Rc = 4πA/P2; where P is the basin perimeter[47]
Basin shape (Bsh) Is = 1/Fs[42]
Infiltration number (If) If = Fs/Dd[48]
Relief characteristicsBasin relief (H)H = Z − z; where Z = basin maximum elevation and z = basin minimum elevation[44]
Relief ratio (Rr) Rr = H/L[44]
Basin slope (Sb)Sb = Z/L [44]
Ruggedness number (Rn)Rn = H × Dd/1000[47]
Table 2. Values of morphometric parameters of every single basin of the study Neom city. Please refer to Table 1 for the abbreviation definitions.
BasinsLuLmRbDdFsTdLgCEfReRcBshIfRrRnSb
1543.001.545.021.000.650.650.501.000.223.490.331.470.6510.530.5210.35
2305.611.334.980.910.680.620.461.100.453.930.321.460.7530.030.7430.03
3220.221.235.830.830.670.560.411.210.333.000.351.490.8161.371.4461.55
441.141.113.150.750.680.510.381.330.301.290.321.480.90136.291.39136.95
569.761.295.570.880.680.600.441.130.201.260.261.460.7791.561.6191.76
679.501.225.130.910.740.670.451.100.201.340.321.350.8277.741.4777.93
786.961.583.560.920.580.540.461.090.221.440.251.720.6381.861.5882.10
8422.071.525.620.990.650.680.501.010.544.840.331.450.6649.131.3661.21
9536.291.296.770.810.630.540.411.230.405.140.451.500.7735.551.1845.12
101132.751.325.390.870.660.610.441.140.457.730.401.430.7538.411.7944.87
11210.341.325.360.870.660.590.431.150.272.550.361.470.7671.621.8883.18
12717.341.525.380.980.640.660.491.020.496.020.361.480.6629.551.1231.23
1399.131.5717.141.180.750.880.590.850.281.530.291.340.649.490.209.38
14104.571.475.470.950.650.610.481.050.311.870.411.550.687.800.147.48
15323.471.566.630.990.630.630.491.010.423.740.531.550.6469.411.9170.63
16447.001.496.410.870.580.560.431.150.223.420.311.550.6746.941.9548.34
171034.401.365.730.850.630.550.431.170.648.870.301.550.7336.881.3756.01
18474.501.315.530.920.710.680.461.080.555.340.291.360.7758.411.6585.76
1964.941.673.190.970.590.570.491.030.140.990.201.710.6027.750.5878.17
20205.771.605.360.950.600.570.481.050.312.610.281.680.6329.810.7565.30
2172.291.455.630.960.670.640.481.040.151.080.201.500.6923.980.5159.62
22298.951.545.401.000.650.650.501.000.131.970.141.540.6518.380.8933.06
23355.041.585.320.980.620.630.491.020.202.740.221.550.6321.060.8738.58
24226.991.675.381.040.620.650.520.960.252.340.241.600.6024.520.7650.25
25384.531.435.000.940.660.630.471.060.343.770.271.500.7022.270.7244.39
26105.921.145.050.890.790.700.451.120.191.530.241.270.8824.600.5457.52
27130.491.325.300.820.620.540.411.220.272.070.351.510.7622.860.4657.63
28182.541.235.380.880.720.630.441.140.543.380.431.400.8227.630.4774.00
29671.011.556.380.920.590.580.461.080.485.940.421.600.6427.821.0051.94
301516.961.355.580.940.700.670.471.060.9612.510.241.400.7427.581.0650.38
31739.391.416.160.930.660.640.461.080.395.630.291.450.7146.431.9446.41
321824.471.475.620.930.630.640.471.070.145.300.131.460.6817.961.9717.87
33119.781.605.780.920.580.530.461.080.201.640.341.730.6324.770.5824.69
34901.811.445.770.920.640.640.461.080.194.340.241.450.7031.942.1131.94
3565.652.124.201.010.480.480.500.990.150.990.282.100.47144.593.05125.60
3686.481.804.990.990.550.540.491.010.421.940.381.830.5618.920.2718.78
37192.891.355.160.870.650.560.441.150.342.760.271.550.7486.991.9487.22
38107.041.225.780.970.800.780.491.030.181.410.271.250.8246.471.1246.47
39494.921.265.010.880.700.610.441.140.243.680.211.430.8046.962.0146.94
4084.261.655.360.950.580.550.481.050.211.370.331.740.6184.221.6484.17
41251.151.625.180.950.590.560.481.050.272.710.401.700.6261.421.8161.23
4250.991.163.640.830.710.590.411.210.491.760.421.400.8658.210.5493.30
4361.671.143.340.830.730.600.411.210.321.550.421.380.8853.440.6878.43
44209.981.346.921.050.780.850.520.950.783.980.521.240.7556.120.9481.96
45326.721.527.170.780.520.410.391.270.303.580.391.910.6647.911.3970.93
46158.981.316.150.760.580.440.381.310.181.940.281.720.7620.640.5444.75
47106.671.523.900.890.580.520.441.130.291.900.401.720.6622.600.4164.00
4877.281.525.260.900.600.540.451.110.241.460.331.680.6623.220.3967.59
49436.581.365.430.900.660.610.451.110.575.310.401.460.7417.080.4546.98
50355.001.315.920.880.670.620.441.130.795.670.321.430.7622.480.4559.96
51132.091.135.160.830.740.620.421.200.302.180.451.350.8927.240.5364.72
52108.771.284.930.840.660.550.421.190.492.550.561.530.7835.700.4891.60
Disclaimer/Publisher’s Note: The statements, opinions and data contained in all publications are solely those of the individual author(s) and contributor(s) and not of MDPI and/or the editor(s). MDPI and/or the editor(s) disclaim responsibility for any injury to people or property resulting from any ideas, methods, instructions or products referred to in the content.

