Abstract
Transportation is vital to life in society; it enables economic, social, and environmental development through connections between areas, cities, and countries, facilitating interactions and integrations. However, transportation is one of the sectors that most impacts sustainability, causing, among other things, emissions of gases, noise, and accidents. Through an integrative bibliographic framework, this study aims to assess the indicators used to evaluate the sustainability of land transportation in various contexts. To this end, relevant papers were selected with intuition to present their main characteristics, and through correlations between the variables analyzed, a framework was built indicating the current situation and future perspectives of the study. In terms of results, some common points were identified among papers, and some categories were pointed out as priorities for a future research agenda, such as the lack of standardization of indicators regarding metrics and nomenclature to emphasize sustainability. A lack of studies covering sustainability as a whole was found, which limits the results of sustainability assessments by only focusing on classic indicators and their deficiencies in relation to social inclusion, political–legal issues, and civil and human rights, as well as the standardization of indicators in other specific sectors.
1. Introduction
Today, transportation is vital to life in society []. It is through transportation that economic, social, and environmental development is allowed [], through connections between areas, cities, and countries, facilitating interactions and integrations through mobility []. Because it is so important to life in modern society, it becomes essential. However, transportation has impacts on sustainability, both in the economic and social as well as in the environmental spheres [,].
Transportation is one of the most impactful sectors regarding sustainability [], being one of the main sectors that generate greenhouse gas emissions [] and therefore responsible for climate changes []. In addition, there is a deficit in the socialization of transportation that generates inaccessibility, accidents, noise, and social inequalities [], which are unsustainable for society. The sustainability of transportation should be a topic of great importance for the main government managers and the whole of society [].
Sustainable transportation can be defined as the possibility of meeting the current needs of locomotion and mobility without interfering with future needs [], while maintaining a balance among the economic, social, and environmental dimensions []. This would be in line with the main definition of sustainability stated in the Brundtland report []. However, the limited use of these three dimensions has generated divergence among researchers; some point out that sustainability goes beyond these three dimensions, as mentioned by Macedo et al. [], warning of the existence of another dimension: the cultural.
On the one hand there is great concern for sustainable transportation development. Medlol and Alwash [] point out that an efficient transportation system is a major part of sustainable development. On the other hand, sustainability in transportation has not advanced enough to enable sustainable development [].
For monitoring the level of transportation sustainability, there must be evaluations. Transportation sustainability assessments should use scientific methods that would enable the analysis and measurement of the sustainability level of this sector []. To this end, it is important to identify the current propositions of sustainability assessment for land transportation.
The challenge that arises with sustainable transportation is how to evaluate the level of sustainability of this sector [,], due to the complexity that connects other sectors and the fact that sustainability encompasses several dimensions []. The evaluation of transportation sustainability may be useful for society representatives, as they assist with information on decision-making and planning regarding sustainable development [].
Two of the most used methods for the evaluation of sustainability are indicators and indexes, considered accepted as effective methods for measuring a phenomenon [,]. These enable statistical monitoring towards the desired outcome [,].
The major obstacle has been developing indicators that can measure the level of transportation sustainability []. This is because there has been no consensus among the parameters used to evaluate the sustainability of transportation with indicators that are scientifically accepted [,].
Thus, in view of the complexity and relevance of this theme, this study aims to analyze, through an integrative bibliographic framework, the propositions of the evaluation of terrestrial transportation sustainability and, through correlations between the variables analyzed, to present the indicators used to evaluate the sustainability of land transportation in various contexts. To this end, relevant papers were selected with intuition to present their main characteristics, and through correlations made between the variables analyzed, a framework indicating the current situation and future perspectives of the study is presented.
To achieve the proposed objective, the methodological procedures, including the research steps and the coding and classification of the data, are presented in Section 2. Section 3 shows the results of the integrative literature review. A framework presenting a synthesis of the main results obtained in the literature systematization on the assessment of sustainability is presented in Section 4, and the main conclusions are presented in Section 5.
2. Methodological Procedures
The purpose of this integrative literature review is to synthesize, evaluate, and integrate previous research on the specific topic, in order to provide an overview of the current state of knowledge. This integrative review seeks to include relevant empirical, theoretical, and conceptual studies, not just those with a particular method or approach, and seeks to identify gaps in knowledge, highlight standards and inconsistencies in existing research, and identify questions for future research [,,,,,].
This integrative review presents an in-depth analysis of the main studies that deal with the current state of sustainability in transportation. In this research, the methodological procedures proposed by Lage Junior and Godinho Filho [] were adapted to the specific demands of this study, which are divided into six systematic work steps.
The first step was to conduct a bibliographic survey on articles with the theme “practices, indicators, and sustainability rates in transport”; these keywords are the consensus when used as a method of evaluation [].
The Scopus and ScienceDirect database consultation was held from April to June 2022. The keywords researched were the following: “Transport and Sustainability Practices”, “Transport and Sustainability Indexes”, “Transport and Sustainability Indicators “and” Transport and Sustainability Index”.
Only the articles relevant to this study proposal that were available for download were considered. Due to the large number of results, 300 articles classified by relevance from each database and keyword search were analyzed. Through this selection based on keywords, we found 285 articles.
The second step was to analyze the summary and select only the studies on the evaluation of land transportation sustainability through indicators, indexes, and practices. Studies deemed not relevant were excluded, leaving 100 articles that were fully analyzed. In this study, we used “Sustainability Indicators” to represent “Sustainability Indicators, Indexes, and Practices”.
The third step consisted of mapping each paper onto the indicators, indexes, and practices used to evaluate the sustainability of transportation: the analysis tools, the country focus, the mode of transportation, the keywords, the authors, the year of publication, the category of the sustainability dimension analyzed, and the publication journals.
In the fourth step, a classification system was developed with logically structured coding for the categorization of the analyzed variables.
The coding of the indicators was elaborated from groups and subgroups due to the extensive list of identified indicators: 1202 (Appendix E) groups were categorized in alphabetical order (groups from A to AY) and subgroups were categorized in numerical order (e.g., group A, subgroups A1, A2, and A3), as shown in Table 1.

Table 1.
Classification and coding of indicators.
The coding of study focuses was organized with the code “FC” varying in numerical order (FC1 to FC19), according to Appendix A. Each study can have more than one objective focus.
The codification of the analysis tools was performed using alphabetical order, with the “Ant_” code and the letter indicating the alphabetical order, according to Appendix B.
The coding of the types of transportation was performed through the identification and classification of groups. The groups were codified by unit (Un), type (Ty), modality (Mo), transported category (Ca), sector (Se), transportation mode (Mt), and transportation locality (Lo). The subgroups were classified by numerical order, as shown in Appendix C. It is noteworthy that each study can include more than one group, of which the total will indicate the specificity of transportation.
The fifth step consisted of applying the classification system to selected articles in order to structure the existing knowledge on the studied theme and present the relevant profile through its main results.
The sixth step comprises the analysis of results and the presentation of gaps, opportunities, and challenges for future studies.
3. Results of the Integrative Literature Review
Through an integrative review of the literature, we analyzed the articles relevant to our purpose regarding practices, indicators, and indexes of sustainability in land transportation. Appendix D presents the classification and coding applied to the selected studies, and the Figure 1, Figure 2, Figure 3 and Figure 4 were built from the analysis and correlations of the information.
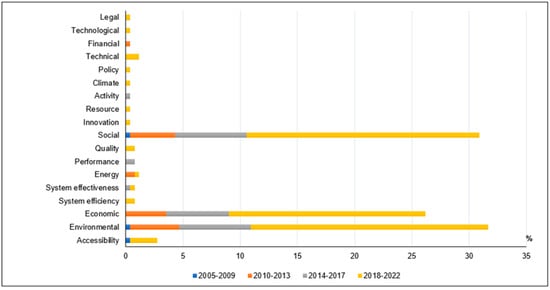
Figure 1.
Sustainability dimensions in relation to the year of publication.
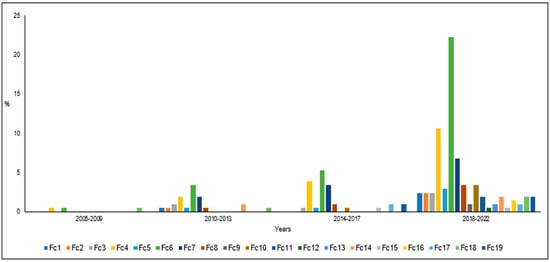
Figure 2.
Study focuses in relation to the year of publication.
Figure 3.
Indicators to evaluate sustainability in transportation in relation to the year of publication.
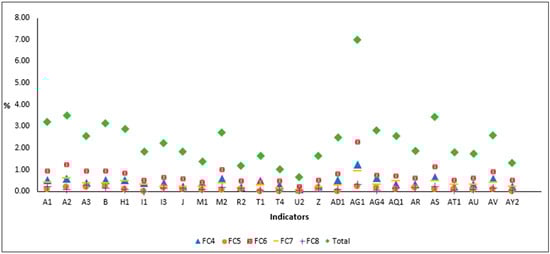
Figure 4.
Most frequent indicators in relation to the most frequent study focuses.
From the results, it was found that most of the analyzed articles (78%) were published in journals with index Q1, which states the quality of the articles under study. Of the total, 45% of the articles are in journals with an SJR indicator greater than 1. The journals that published the most articles on this study theme were Sustainability (15%), Ecological Indicators (9%), Case Studies on Transportation Policy (7%), Journal of Cleaner Production (7%), and Transportation Research Procedures (7%).
The most frequently used keywords in studies are “Sustainability”, “Sustainable Transportation”, and “Public transportation”.
There has been exponential growth in the theme of sustainability indicators in land transportation in recent years, where 53% of the articles published over the last 3 years (from 2020 to 2022) were in this theme.
India (10%) and Brazil (8%) showed the highest concentrations of studies on the theme of sustainability indicators in land transportation, followed by the United Kingdom (5%), Taiwan (5%), China (4%), Australia (3%), Canada (3%), and Sweden (3%), and 14% of studies were conducted in more than one country, mostly in Europe (25%).
The dimensions of sustainability (Figure 1) identified in this survey are as follows: environmental (31.70%), social (30.75%), and economic (26.23%), totaling the Triple Bottom Line with 87.4%. In addition to these, other dimensions were identified to compose the sustainability of transportation: accessibility (2.83%), policy (0.57%), technological (0.57%), legal (0.57%), the technician (1.13%), energy (0.94%), financial (0.38%), system effectiveness (0.57%), innovation (0.38%), activity (0.19%), system efficiency (0.75%), performance (0.75%), resource (0.57%), climate (0.57%), and quality (0.57%).
A total of 19 categories of study focus (Appendix A and Figure 2) were identified, of which 3 groups concentrate most publications (65.34%): FC6 (33.19%), which analyzes an urban region, FC4 (18.10%), which presents the sustainability indicators, and FC7 (14.05%), which presents the consideration of the indicators through experts. The less studied study focuses were FC12 (0.48%), which analyzes the coverage of the transportation network, FC9 (0.97%), which classifies transportation by type in relation to sustainability, FC13 (0.97%), which presents more sustainable modes of transportation, and FC15 (0.97%), which reviews the definitions of sustainability.
This integrative review of the literature cataloged 1202 (Appendix E) different indicators, which differ in the metric or nomenclature, but most resemble each other in essence. Thus, there was a need to create groups and subgroups for the framing of these indicators (Table 1 and Figure 3).
The groups of indicators (Table 1 and Figure 3) with higher frequencies (58.13%) among the articles are as follows: AG (pollution; 10.81%), A (accessibility; 9.3%), H (energy consumption, fuel, and natural resources; 5.95%), Y (infrastructure; 5.36%), I (costs; 4.86%), AQ (satisfaction and quality; 4.37%); M (availability and diversity of modes; 3.87%); AS (security; 3.57%); T (environmental impact; 3.47%); AD (occupation and capacity of transportation modes; 3.37%), and B (traffic accidents; 3.37%). It is worth mentioning the subgroup AG1 (air pollution), with 66.99% from the AG group and 7.24% of the overall from groups and subgroups.
The groups of indicators with lower frequencies (3.08%) are as follows: AJ (social projects; 0.20%); AW (value added; 0.30%); F (environmental certification; 0.30%); Q (minimum specifications of transportation mode; 0.30%); AI (cultural preservation; 0.40%); AL (environmental protection; 0.40%); C (social benefit of transportation worker; 0.40%); N (civil and human law; 0.40%); and P (geographical space; 0.40%). The subgroups that have lower frequencies in relation to the total (groups and subgroups) are as follows: AF3 (monetary policy) with 0.10%, which comprises group AF (public policy) with only 4.35% in appearances in this group.
From the 49 groups of cataloged indicators, no study contains all groups, and the ones that come closest are the studies of Rajak et al. [] and Tafidis et al. [], in which 77.55% and 79.59% of the indicator groups were identified, respectively. When analyzing from the perspective of the total groups and subgroups of indicators (total 89), 42.70% were identified in the study by Rajak et al. [] and 43.82% in the study by Tafidis et al. [].
In studies that used the pollution indicator group (AG), the main focuses of studies were the groups FC6 (32.19%), which analyzes the urban region, FC4 (17.81%), which presents the sustainability indicators, and FC7 (13.01%), which presents the consideration of the indicators through experts. Among the studies that used the AG (pollution) indicator group, none of these used the objective that analyzes the coverage of the transportation network (FC12).
Among the studies, 59 different analysis tools were identified, including AnTo_35 (hierarchical analysis of the process; AHP; 8.58%), AnTo_13 (descriptive and graphic statistical analysis; 7.09%), AnTo_12 (data enveloping analysis; DEA; 6.34%), and AnTo_33 (fuzzy logic; 6.34%). It is noteworthy that the multicriteria decision-making methods obtained a higher frequency (30.97%), having 15 distinct methods.
4. Discussion of Results
This section presents a summary of the extensive integrative literature review, showing the correlations made between the variables in this study (indicators, years, dimensions, study focus, and analysis tools) the perspectives of future studies on the evaluation of sustainability in land transportation.
After consolidating the results, some common points were identified, and some categories are indicated as priorities for a future research agenda. The following analyses are based on Figure 1, Figure 2, Figure 3, Figure 4 and Figure 5 and Appendix D.
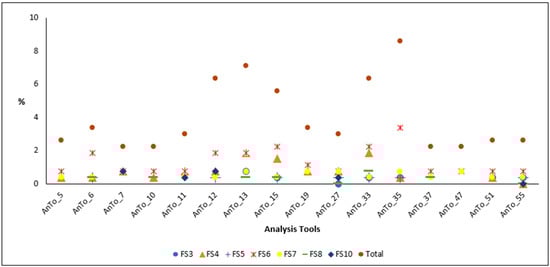
Figure 5.
Most frequent indicators in relation to the most frequent analysis tools.
Only the indicators AT2 (trip distance), Y2 (financial evaluation: revenues), AU (traffic), M2 (modal diversity), A2 (accessibility of range), AS (security), and AG1 (air pollution) appeared in the four separation ranges of years (2005–2009, 2010–2013, 2014–2017, and 2018–2022). Some indicators that appeared only between 2018 and 2022 are as follows: O1 (effectiveness of the system), AF3 (monetary policy), AF4 (budget policy), AJ (social projects), AY1 (viability), R1 (environmental management), AW (added value), T4 (energy efficiency), and AL (environmental protection).
Some other observed highlights are that Y5 (infrastructure: exclusive bands) was the only unidentified indicator in studies between 2018 and 2022. AG1 (air pollution) is the most frequent indicator in the years 2018–2022, followed by AS (security; 2.28%), AG4 (noise pollution; 2.08%), A2 (accessibility of range; 2.08%), B (traffic accidents; 1.79%), AQ1 (transportation and infrastructure; 1.79%), A3 (tariff accessibility; 1.59%), AV (soil use; 1.59%), A1 (physical accessibility; 1.49%), H1 (energy consumption; 1.49%), and AD1 (mode occupation; 1.49%).
The analysis of indicators revealed higher study frequencies regarding the following: AG1 (air pollution; 6.98%), AS (security; 3.44%), A2 (accessibility of range; 3.49%), B (traffic accidents; 3.16%), A1 (physical accessibility; 3.21%), AG4 (noise pollution; 2.83%), A3 (tariff accessibility; 2.55%), M2 (modal diversity; 2.73%), H1 (energy consumption; 2.88%), and AV (soil use; 2.59%). In relation to the study focus, the following results were obtained (Figure 4):
- (I)
- Studies that contemplate AG1 (air pollution) are concentrated at 63.51% in the areas sustainability index (FC4), analyzes the urban region (FC6), and presents the classification of indicators (weights) through experts (FC7), and there are no studies regarding this indicator in the area analyzes the coverage of the transportation network (FC12).
- (II)
- Studies with AS (security) are concentrated at 65.75% in the areas sustainability index (FC4), analyzes the urban region (FC6), and the classification of indicators (weights) through experts (FC7), and there are no studies regarding this indicator in the areas with classification by type of transportation in relation to sustainability (FC9), the coverage of the transportation network (FC12), review the sustainability definitions (FC15), sustainability composite indicator (FC16), or focus on urban mobility (FC19).
- (III)
- Studies with A2 (accessibility of range) are concentrated at 68.92% in the areas sustainability index (FC4), analyzes the urban region (FC6), and the classification of indicators (weights) through experts (FC7), and there are no studies regarding this indicator in the areas with classification by type of transportation in relation to sustainability (FC9), focus on accessibility to public transportation (FC11), analyzes the coverage of the transportation network (FC12), more sustainable modes of transportation (FC13), sustainability composite indicator (FC16), and identifies the main studies on sustainable transportation (FC18).
- (IV)
- Indicator B (traffic accidents) is concentrated at 65.67% in the areas sustainability index (FC4), focusing on energy consumption (FC5), analyzes the urban region (FC6), and the classification of indicators (weights) through experts (FC7), and although focusing on energy consumption (FC5) has the lowest appearance, it demonstrates growth between 2018 and 2022; this indicator does not have studies in the areas accessibility to public transportation (FC11), analyzes the coverage of the transportation network (FC12), more sustainable modes of transportation (FC13), and identifies the main studies on sustainable transportation (FC18).
- (V)
- A1 (physical accessibility) concentrates 66.18% of its studies in the areas sustainability index (FC4), analyzes the urban region (FC6), the classification of indicators (weights) through experts (FC7), and focused on the emission of gases (FC8), and has no studies in the areas classification by type of transportation in relation to sustainability (FC9), analyzes the coverage of the transportation network (FC12), review the sustainability definitions (FC15), or presents sustainability composite indicator (FC16).
- (VI)
- AG4 concentrates 60.00% of its studies in the areas sustainability index (FC4), analyzes the urban region (FC6), and the classification of indicators (weights) through experts (FC7), and has no studies in the areas analyzes the coverage of the transportation network (FC12), evaluate perspective performance (FC14), or review the sustainability definitions (FC15).
- (VII)
- A3 (tariff accessibility) is concentrated at 85.19% in the areas sustainability index (FC4), focusing on energy consumption (FC5), analyzes the urban region (FC6), the classification of indicators (weights) through experts (FC7), and focused on the emission of gases (FC8), and has no studies in the areas with classification by type of transportation in relation to sustainability (FC9), application of different technologies (FC10), focus on accessibility to public transportation (FC11), analyzes the coverage of the transportation network (FC12), review the sustainability definitions (FC15), sustainability composite indicator (FC16), and identifies the main studies on sustainable transportation (FC18).
- (VIII)
- Indicator M2 (modal diversity) is concentrated at 77.59% in the areas sustainability index (FC4), analyzes the urban region (FC6), the classification of indicators (weights) through experts (FC7), and focused on the emission of gases (FC8), and has no studies in the areas with classification by type of transportation in relation to sustainability (FC9), focus on accessibility to public transportation (FC11), analyzes the coverage of the transportation network (FC12), evaluate perspective performance (FC14), or review the sustainability definitions (FC15).
- (IX)
- H1 (energy consumption) concentrates 63.93% of its studies in the areas in sustainability index (FC4), analyzes the urban region (FC6), and the classification of indicators (weights) through experts (FC7), and has no studies in the areas with classification by type of transportation in relation to sustainability (FC9), focus on accessibility to public transportation (FC11), analyzes the coverage of the transportation network (FC12), review the sustainability definitions (FC15), or sustainability composite indicator (FC16).
- (X)
- AV (soil use) concentrates 78.18% of its studies in the areas sustainability index (FC4), analyzes the urban region (FC6), the classification of indicators (weights) through experts (FC7), and focused on the emission of gases (FC8), and has no studies in the areas classification by type of transport in relation to sustainability (FC9), with focus on accessibility to public transportation (FC11), analyzes the coverage of the transportation network (FC12), review the sustainability definitions (FC15), and sustainability composite indicator (FC16).
The indicators AG1 (air pollution), AS (security), A2 (accessibility of range), and M2 (modal diversity) with the study focus FC6 (analyzes the urban region) appeared in all groups of years (2005–2009; 2010–2013; 2014–2017; and 2018–2022).
AG1 (air pollution) was the indicator most present in the sustainability dimensions accessibility, environmental, economic, energy, social, performance, resource, climate, system, technical, financial, and quality. The second most present indicator was H1 (energy consumption), being in the dimensions accessibility, environmental, economic, energy, social, performance, innovation, resource, activity, climate, system, and financial. The AJ (social projects) and Q (minimum transportation mode specifications) indicators appear only in the social dimension, and only the social dimension contemplates all indicators.
Environmental and social dimensions are present in all groups of years (2005–2009, 2010–2013, 2014–2017, and 2018–2022). The energy dimension was most frequent in studies between 2010–2013 and 2018–2022, and 9 of the 18 dimensions identified appeared only in studies of the years 2018–2022.
The environmental and social dimensions include all focuses of study. In the economic dimension, only review the sustainability definitions (FC15) was not identified in papers. The analyzes the urban region (FC6) focus did not show frequency in studies on activity, performance, innovation, and quality dimensions.
The sustainability index (FC4) and analyzes the urban region (FC6) focuses appeared in all groups of years. The focuses on the emission of gases (FC8) and application of different technologies (FC10) stand out in the 2018–2022 years for obtaining growth in the approach to studies near the main focuses of study. Finally, the focuses of study that appeared only in the years 2018–2022 were classification by type of transportation in relation to sustainability (FC9), focus on accessibility to public transportation (FC11), analyzes the coverage of the transportation network (FC12), more sustainable modes of transportation (FC13), sustainability composite indicator (FC16), and identifies the main studies on sustainable transportation (FC18). The analyzes the coverage of the transportation network (FC12) focus appeared the least in studies among all years.
The analyzes the urban region (FC6) focus is present in all indicators: AG1 (air pollution) was the most frequent indicator (in almost all study focuses) and was not found only in analyzes the coverage of the transportation network (FC12). The focus of study at a lower frequency was review the sustainability definitions (FC15), which contains the smallest number of indicators, only A2 (accessibility of range), AB (mobility), AG1 (air pollution), B (traffic accidents), and J (demand).
The FC6 (analyzes the urban region) study focus presents the largest number of analysis tools, highlighting the ANT_35 (hierarchical analysis method, AHP) tool, and did not present the analysis tools Anto_2 (comparative analysis of methodologies), Anto_17 (comparative performance evaluation), Anto_21 (BWM-D), Anto_30 (Malmquist index), Anto_31 (Java Space Model (JSM)), Ant_40 (SIR method), Anto_46 (transverse research), Anto_48 (Promethee), Anto_50 (logistics regression), Ant_56 (reliability tests), Ant_57 (non-parametric tests), and Anto_59 (TODIM). FC12 (analyzes the coverage of the transportation network) showed the lowest frequency, only appearing in the ANT_35 (hierarchical analysis method, AHP) analysis tool (Figure 5).
From the analyses and correlations between the variables, some points stand out:
- (I)
- The theme under research has been growing in proportion, especially in the years 2018–2022, appearing in 69.57% of the selected studies, demonstrating the importance of the theme but also reflecting that there are no methods or criteria established for the sustainability assessment of land transportation yet.
- (II)
- The most frequent study focus was FC6, analyzes an urban region, with 33.19% of studies largely appearing as an attempt to validate the proposed method.
- (III)
- The study focus less frequently appearing was FC12, analyzes the coverage of the transportation network, which may indicate the difficulty of researchers in proposing the evaluation of transportation as a whole due to the complexity of the theme of sustainability in land transportation.
- (IV)
- The three dimensions of sustainability that appear most frequently are those described as the Triple Bottom Line (economic, social, and environmental), with 87.84%. However, in addition to these 3 dimensions, 15 other dimensions categorized in this study were mapped. This may indicate that sustainability is beyond the three dimensions commonly used.However, these 15 dimensions, according to specific contexts, can fit the description of the Triple Bottom Line. That being said, it is evident that even if these dimensions are categorized as groups, they have a greater prominence, which perhaps, as credited by the researchers, makes them more important for transportation and allows them to stand out in relation to the other identified ones.
- (V)
- The cataloged identification of 1202 different indicators demonstrates a lack of standardization of indicators regarding metrics and nomenclature, which is necessary to evaluate sustainability. In addition, many of these appear in their generic form, such as the identified indicator “accidents”. Thus, it is believed that these indicators should be more specific and standardized, as they are intended to be evaluated.
- (VI)
- The identification that none of the analyzed articles include all indicators may indicate a failure by researchers to compose their studies, not encompassing sustainability as a whole, which limits the results of sustainability assessments.
- (VII)
- The indicators that appear most in studies, AG (pollution) and A (accessibility), may be an indication that land transportation could have more impacts on sustainability through pollution and accessibility. However, the focus on these indicators can minimize or exclude indicators that are also relevant in sustainability assessments, as sustainability should add to the whole.
- (VIII)
- The indicator groups with fewer appearances in the studies (social projects (AJ), added value (AW), environmental certification (F), minimum transportation mode specifications (Q), cultural preservation (AI), environmental protection (AL), transportation worker social benefit (C), civil and human rights (N), and geographic space (P)) may indicate that researchers believe that these groups do not have a great impact or relevance on the sustainability of transportation and/or for the reason that these indicators are difficult to measure.However, researchers should be cautious about the use of an indicator; as an example, indicator N (civil and human rights) appears to be a relevant item to achieve sustainability because it fits as a fundamental item of the social dimension of sustainability.
- (IX)
- Only the indicators AT2 (trip distance), Y2 (network density), AU (traffic), M2 (modal diversity), A2 (accessibility of range), AS (security), and AG1 (air pollution) appeared in the four separation ranges of years, which may indicate that these groups and subgroups are the main ones already established with agreement among researchers.
- (X)
- The indicators O1 (effectiveness of the system), AF3 (monetary policy), AF4 (budget policy), AJ (social projects), AY1 (viability), R1 (environmental management), AW (added value), T4 (energy efficiency), and AL (environmental protection), which appeared only in the years 2018–2022, may indicate that in recent years there has been a deepening of studies due to meeting sustainability as a whole.
- (XI)
- The AG1 (air pollution) indicator was most often measured in the years 2018–2022, more than any other indicator in any year, appearing to be an established and extremely important criterion for sustainability assessment.
- (XII)
- The classification of transportation that appears most in studies is willing in its generic form (Un2-transportation), and few studies have specificity regarding this, which could improve transportation evaluations as specifics have different characteristics.
- (XIII)
- The most commonly used analysis tool in studies is AHP (8.58%), which composes multicriteria decision support methods and appeared in 30.97% of studies, indicating that the multicriteria method is well accepted as a tool of analysis.
However, because the AHP method uses the criteria to be compared with each other, it could lead to inconsistency problems, given the large number of criteria (indicators) that appear for sustainability assessment.
Other multicriteria methods less used in studies, among others, are Electre, Promethee, Topsis, and BWM. These could make up for the lack of the AHP method in developing or selecting a larger number of criteria (indicators) for transportation assessment.
Another prominent point is that specific research has not been identified regarding the evaluation of rural transportation.
5. Conclusions
This study aimed to analyze the sustainability assessment indicators in land transportation in order to present the current situation and prospects for future studies.
The analysis of an integrative bibliographic review in relation to a large number of published works was used. Among the evaluations made there are study focuses, indicators, year of publication, sustainability dimensions, analysis tools, and so on. The main results of this research pointed out the results given below.
There has been growth in the theme of sustainability indicators in land transportation in recent years, and 53% of papers were published in 2020–2022.
Although 88.68% of studies are focused on the social, environmental, and economic scope, many have other dimensions because they attribute differentiated importance, such as climate, quality, and legal innovation.
The main study objectives are related to analyzing an urban region; the proposition and weighting of sustainability indicators; the analysis of interactions between sustainability indicators; energy consumption; and governmental and political issues.
The most commonly identified indicators are related to pollution, accessibility, energy consumption, fuel and natural resources, infrastructure, satisfaction and quality, availability and diversity of transportation, safety, environmental impact, occupation and capacity of the transportation mode, accidents in transit, and air pollution.
Most of the analysis tools are concentrated in multicriteria decision support methods and statistical methods.
Some common points have been identified in papers, and some categories are indicated as priorities for a future research agenda: the lack of standardization of indicators regarding metrics and nomenclature to assess sustainability and the lack of studies covering sustainability as a whole, which limit the results of sustainability assessments.
Deficiencies in relation to indicators include social inclusion, political–legal issues, and civil/human rights, in addition to the standardization of indicators in specific sectors, since each sector has its own specificity: for example, the standardization of indicators to evaluate public schools, agricultural cargo, containers, taxis, etc.
Another indicator that can make it difficult to assess the sustainability of transportation is how the sustainability dimensions are separated. A solution could be the resizing of the traditional dimensions to include others, such as innovation, performance, public policies, social inclusion, resources, technicians, etc. This can assist researchers and sector managers in proposing forms of sustainability assessment in transportation more efficiently.
Finally, it is emphasized that most studies give importance to data availability to compose indicators, i.e., the barriers to availability and data access. However, if this is a mistake, if a group or category of indicator does not have data availability, would it be discarded from the evaluation? Sustainability assessment should cover the whole, regardless of the difficulty of evaluating. This is a barrier for research in this sector, generating the need for discussion for a solution.
Thus, this study contributes to the academic community, government managers, and society by pointing out a vast bibliographical study on the indicators used to evaluate sustainability in land transportation from various perspectives and research contexts.
Author Contributions
Conceptualization and methodology: J.H.d.S.G. and R.F.; software, validation, formal analysis, and investigation: J.H.d.S.G. and R.F.; resources for publication fee: P.P.D.A.J.; review: A.M.-F. and D.J.H.; visualization, supervision, and project administration: R.F. All authors have read and agreed to the published version of the manuscript.
Funding
This research received no external funding.
Informed Consent Statement
Not applicable.
Data Availability Statement
Not applicable.
Acknowledgments
The authors would like to thank the Federal University of Technology—Paraná (UTFPR), the State University of Londrina (UEL), and the Federal University of Santa Catarina (UFSC).
Conflicts of Interest
The authors declare no conflict of interest.
Appendix A
| Coding of Study Focuses | |
| Cod. | Description |
| FC1 | Analyzes the interaction between the sustainability indicators |
| FC2 | Government political issues: political intervention, consequences of government actions in transportation, improvement policies, sustainability goals, etc. |
| FC3 | It analyzes a specific sector: food, cargo, cars, car sharing, school bus, energy, industrial, public transportation. |
| FC4 | Presents sustainability index |
| FC5 | Focusing on energy consumption |
| FC6 | Analyzes the urban region |
| FC7 | Presents the classification of indicators (weights) through experts |
| FC8 | Focused on the emission of gases |
| FC9 | Classification by type of transport in relation to sustainability |
| FC10 | Application of different technologies |
| FC11 | Focus on accessibility to public transportation |
| FC12 | Analyzes the coverage of the transport network |
| FC13 | Presents more sustainable modes of transportation |
| FC14 | Evaluate perspective performance |
| FC15 | Review the sustainability definitions |
| FC16 | Presents sustainability composite indicator |
| FC17 | Identifies the methodologies used to create index/indicators |
| FC18 | Identifies the main studies on sustainable transportation |
| FC19 | Focus on urban mobility |
Appendix B
| Codification of Analysis Tools | |
| Cod. | Description |
| AnTo_1 | Quantitative scientometric analysis |
| AnTo_2 | Comparative analysis of methodologies |
| AnTo_3 | TAPIO Approach |
| AnTo_4 | ELGRAI |
| AnTo_5 | Cluster Analysis |
| AnTo_6 | Analysis of Main Components (PCA) |
| AnTo_7 | MONTE CARLO Analysis |
| AnTo_8 | Stochatic Border Analysis |
| AnTo_9 | Process Analysis (PAM) |
| AnTo_10 | Network Analysis |
| AnTo_11 | Regression Analysis |
| AnTo_12 | Data Envelopment Analysis (DEA) |
| AnTo_13 | Descriptive and Graphic Statistical Analysis |
| AnTo_14 | Factor analysis |
| AnTo_15 | Qualitative analysis |
| AnTo_16 | ANOVA |
| AnTo_17 | Comparative performance evaluation |
| AnTo_18 | Data -oriented evaluation |
| AnTo_19 | Benchmarking |
| AnTo_20 | Brainstorming |
| AnTo_21 | BWM-D |
| AnTo_22 | Pearson Correlation |
| AnTo_23 | Dematel |
| AnTo_24 | Electrus |
| AnTo_25 | Interviews |
| AnTo_26 | Likert Scale |
| AnTo_27 | Decision Support Tool (DMT) |
| AnTo_28 | Sustainability Assessment Tool |
| AnTo_29 | Remote Sensing Tools |
| AnTo_30 | Malmquist Index |
| AnTo_31 | Java Space Model (JSM) |
| AnTo_32 | Logarithmic Mean Divisa Index (LMDI) |
| AnTo_33 | Fuzzy logic |
| AnTo_34 | Fuzzy Cognitive Maps (FCMS) |
| AnTo_35 | Hierarchical Analysis Method (AHP) |
| AnTo_36 | Equal weight method |
| AnTo_37 | Delphi Method |
| AnTo_38 | Integrated Value Method for Sustainability Assessment (MEVES) |
| AnTo_39 | Euclidian Buffer Method |
| AnTo_40 | SIR METHOD |
| AnTo_41 | VIseKriterijumska Kompromisno Rangiranje Method (IF-VIKOR) |
| AnTo_42 | Modeling |
| AnTo_43 | Model of weighted gravity |
| AnTo_44 | Own Model: Multicriterium Evaluation Method for Sustainability Assessment of Public Bus Technologies. |
| AnTo_45 | MIN-MAX normalization |
| AnTo_46 | Transverse research |
| AnTo_47 | PRISM |
| AnTo_48 | Promethee |
| AnTo_49 | Questionnaires |
| AnTo_50 | Logistics regression |
| AnTo_51 | Systematic review |
| AnTo_52 | SMARTER |
| AnTo_53 | Machine Learning Technique |
| AnTo_54 | Test-t |
| AnTo_55 | DEMPSTER-SHAFER THEORY (DS) |
| AnTo_56 | Reliability tests |
| AnTo_57 | Non -Parametric Tests |
| AnTo_58 | Workshop |
| AnTo_59 | TODIM |
Appendix C
| Classification and Coding of Transport Types | |
| Description | Cod. |
| Unit | Un1-Transport System; Un2-Transportation; |
| Type | Ty1-terrestrial; Ty2-Air; Ty3-Maritime; |
| Modality | Mo1-Railway; Mo2-Road; Mo3-Rail and Road |
| Transported category | Ca1-School; Ca2-Passenger; Ca3-Cargo; Ca4-Passengers and loads; |
| Sector | Se1-Public; Se2-Private; |
| Transport mode | MT1-Bus; MT2-Truck; MT3-Automobile; MT4-Not motorized |
| Transportation | Lo1-Urban; Lo2-Rural; |
Appendix D
| Classification and coding of studies | |||||||||
| Authors | Journal | Journal Index | Country Focus | Methodology | Dimension | Indicators | Study Focus | Types of Transport | Analysis Tools |
| [] | Transactions on Transport Sciences | Q3 | Review | Environmental; economic; accessibility | A2; A1; B; D2; H1; I2; I3; I1; J; M1; O2; R3; S2; S1; V1; Y6; AA; AB; AE; AF6; AQ2; AR; AS; AU; AV; AY3 | FS4; FS14 | Un1; Se1 | AnTo_51 | |
| [] | Transportation Research Part D | Q1 | Case study | Environmental; economic; social | D1; D2; H3; M2; R1; T1; Y7; AC; AD1; AG1; AG4; AV | FS3; FS4 | Un2; Ca3; Lo1 | AnTo_13 | |
| [] | Sustainability | Q1 | Review | Environmental; economic; social | A1; A2; D2; H2; H1; I1; I3; I2; J; M2; R3; S1; AD1; AG1; AG4; AH; AQ1; AQ2; AR; AS; AT1; AU; AY1; AY2; AY3 | FS1; FS2; FS6; FS7 | Un2; Mo1 | AnTo_47 | |
| [] | European Journal of Sustainable Development | Case study | Environmental; economic; social | H5; T1; T2; W; AM; AR; AW; AY2 | FS3; FS6 | Un1; MT3 | AnTo_51 | ||
| [] | Ecological Indicators | Q1 | Several countries | Case study | Environmental; economic; social | A1; A2; D2; H1; H2; H5; R1; S2; T1; AD1; AE; AF2; AG1; AG4; AQ3; AS; AV | FS3; FS4; FS7 | Un2; MT3 | AnTo_22 |
| [] | Habitat International | Q1 | Taiwan | Case study | Environmental; economic; social | A1; A3; D1; E; H1; I3; M2; Z; AC; AG4; AG1; AQ1; AR; AS; AV | FS2; FS6; F S7; FS8; FS13 | Un2 | AnTo_37 |
| [] | Transport Reviews | Q1 | Review | Environmental; economic; social | A1; A2; A3; B; D1; D2; H1; H2; H4; M1; M2; O2; S2; T1; V2; Y1; Y2; AD1; AE; AG1; AE; AG1; AG4; AM; AQ2; AS; AT1; AT2; AU; AV; AY2 | FS6; FS7 | Un2; Se1 | AnTo_51 | |
| [] | Transportation Research Procedia | India | Case study | Environmental; economic; social | I1; I2; I3; P; R1; R2; V2; AB; AD1; AD2; AG1; AG4; AQ1; AS; AT1 | FS11 | Un2; Se1; MT1 | AnTo_17; AnTo_22; AnTo_56 | |
| [] | Journal of cleaner production | Q1 | Brazil | Case study | Environmental; economic; social | B; I3; W; AD1; AD2; AG1; AG4; AT1; AY2 | FS4; FS9 | Un1; Mo3 | AnTo_33 |
| [] | Research in Transportation Business & Management | Q1 | Taiwan | Case study | Social | A3; R3; V1; AD2; AQ1; AS | FS2; FS6 | Un2; Ca4 | AnTo_23 |
| [] | Transport Policy | Q1 | United Kingdom | Case study | Environmental; economic; Social | T1; AB; AY2 | FS4; FS6; FS7 | Un2; Ca4 | AnTo_9 |
| [] | Sustainability | Q1 | Case study | Environmental; economic; social | A2; H4; I1; J; AQ3; AU | FS3; FS6; FS7; FS14 | Un1; Ca1; MT1 | AnTo_35; AnTo_55 | |
| [] | Sustainable Production and Consumption | Q1 | United Kingdom | Case study | Environmental; economic; social | I1; I2; T1; V1; AE | FS7 | Un2; Ca3 | AnTo_21; AnTo_59 |
| [] | Procedia Environmental Sciences | Malaysia | Case study | Environmental; economic; social | A2; A3; B; D2; I3; J; L; M2; U2; V2; W; Y2; AG1; AH; AS | FS6; FS8 | Un1; Se1 | AnTo_13; AnTo_49 | |
| [] | Transportation Research Procedia | Portugal | Case study | Social | A2 | FS4; FS6; FS15 | Un2; Se1 | AnTo_39; AnTo_10 | |
| [] | Transport | Q2 | Case study | Environmental; economic; social | A3; H5; S2; U1; AB; AE; AG1; AG2; AG4; AI; AL; AS | FS6 | Un2; Se1 | AnTo_13 | |
| [] | Sustainable Cities and Society | Q1 | Several countries | Case study | Environmental; economic; social | A2; A3; B; E; G; J; M2; R2; Y3; Y4; Y6; Y7; Z; AB; AC; AE; AF1; AF2; AF5; AG1; AU | FS6 | Un2; Mo2 | AnTo_37 |
| [] | Sustainability | Q1 | Brazil | Case study | Environmental; economic; social | A1; A3; D2; G; O1; Y1; Y3; Y4; Y6; Y7; Z; AB; AC; AD1; AF5; AO; AS | FS1; FS6 | Un2; Mo2 | AnTo_35 |
| [] | Habitat International | Q1 | India | Case study | Social | A3; G; Q; AA; AH; AN; AQ1; AQ3; AR; AS | FS3 | Un2; Mo2; Ca3; MT2 | AnTo_33; AnTo_50; AnTo_57 |
| [] | Journal of Enterprise Information Management | Q1 | Case study | Social | C; N; M2; R3; S1; AE; AF6; AJ; AP; AQ3; AR | FS4; FS6 | Un1; Se1; Lo1 | AnTo_33 | |
| [] | Sustainability | Q1 | Poland | Case study | Environmental; economic; social | H1; V1; Z; AF2; AG1; AQ1 | FS4; FS6; FS7; FS14 | Un1 | AnTo_11 |
| [] | Transportation Research Part D | Q1 | Canada | Case study | Environmental; economic; social | A1; A2; B; D2; H4; I1; I3; M1; M2; O1; S1; AD1; AG1; AR; AT2; AV; A1; AQ2 | FS4; FS6; FS10 | Un1; Lo1 | AnTo_7; AnTo_27; AnT o_28 |
| [] | Smart Cities Symposium Prague 2021 | Norway | Case study | Environmental; economic; social | A1; A2; A3; J; M2; R2; T4; Y1; Z; AB; AD1; AF4; AG1; AQ1; AU; AX | FS4; FS6; FS8 | Un2; Lo1 | AnTo_58 | |
| [] | Sustainability | Q1 | Several countries | Case study | Environmental; economic; social | B; AD1; AG1 | FS6; FS16 | Un1; Ca2; Lo1 | AnTo_5 |
| [] | Transportation Research Part D | Q1 | Case study | Environmental; social | AG1; AS | FS6; FS10; FS11 | Un1; Ca2 | AnTo_12 | |
| [] | Journal of cleaner production | Q1 | Brazil | Case study | Environmental; economic; social | B; I1; I3; AG3; AG4; AG1; AM | FS1; FS16 | Un1; Lo1 | AnTo_51 |
| [] | Environmental Impact Assessment Review | Q1 | Indonesia | Case study | Environmental; economic; social | I1; I3; AG1; AQ1 | FS7; | Un2; Se1; Lo1 | AnTo_31 |
| [] | Case studies on Transport Policy | Q1 | India | Case study | Environmental; economic; social | A2; A3; H1; L; O2; T3; T4; AG1; AS; AV; AY2 | FS6; FS7 | Un2 | AnTo_33; AnTo_6 |
| [] | Sustainable Cities and Society | Q1 | India | Case study | Environmental; economic; social | B; E; R2; AG1; AG4; AQ1 | FS17 | Un1 | AnTo_19 |
| [] | Journal of environmental Management | Q1 | Bangladesh | Case study | Environmental | T1; AG1 | FS3 | Un2; Mo2; Ca3 | AnTo_29 |
| [] | Ecological Indicators | Q1 | Several countries | Case study | Environmental; economic; social | A2; A3; A1; B; H1; S2; Y2; AF6; AG1; AP; AT1; AV; AY3 | FS4; FS6; FS7 | Un1; Ca3 | AnTo_19; AnTo_5 |
| [] | Sustainability | Q1 | China | Case study | Accessibility | A1 | FS6; FS8; FS11 | Un2; Se1 | AnTo_10; AnTo_43 |
| [] | Transportation Research Procedia | Poland | Case study | Environmental | H4; H5; AG1; AG2; AG4; AL; AV | FS4; FS6 | Un2; Se1 | AnTo_42 | |
| [] | Sustainability | Q1 | Several countries | Case study | Environmental; economic; political; technological; legal | I3; N; T2; V1; Z; AF3; AF4; AL; AP; AX | FS6; FS12; FS13 | Un1; Se1; MT4 | AnTo_35 |
| [] | Ecological Indicators | Q1 | Taiwan | Case study | Environmental; economic; social | B; D2; H2; H3; J; M2; T1; Y2; Y3; Y5; Y6; Y7; AB; AD1; AD2; AG1; AI; AO; | FS1; FS6 | Un1; MT1; Lo1 | AnTo_34; AnTo_35 |
| [] | Ecological Indicators | Q1 | Review | Environmental; economic; social; technological; accessibility | A2; B; M2; P; R2; AF1; AG1; AQ1; AX; AY2 | FS6; FS7 | Un2 | AnTo_47 | |
| [] | Sustainability | Q1 | France | Case study | - | F; J; M2; O1; R1; R2; Z; AD1; AN | FS6; FS16 | Un1; Se1; Lo1 | AnTo_20; AnTo_25; AnTo_4 |
| [] | Journal of cleaner production | Q1 | India | Review | Social | A3; C; N; Q; R2; R3; S1; V1; W; Y6; Z; AE; AF6; AI; AJ; AM; AN; AP; AQ2; AR | FS5; FS6; FS8 | Un2 | AnTo_33 |
| [] | Environment and Planning B: Urban Analytics and City Science | Q1 | USA | Case study | Environmental; social | A2; AG1; AT1 | FS6; FS7 | Un2; Ca3 | AnTo_13 |
| [] | IOP Conference Series: Materials Science and Engineering | Iraq | Case study | Environmental; economic; social | I3; AG1; AG4; AS | FS4; FS6 | Un2 | AnTo_13 | |
| [] | Transport | Q2 | Russia | Case study | Environmental; economic | O2; AG1 | FS4; FS6; F S7 | Un2; Se1 | AnTo_18 |
| [] | Case Studies on Transport Policy | Q1 | Brazil | Case study | Economic; social | O2; AQ3 | FS18; | Un2 | AnTo_12; AnTo_30 |
| [] | Transportation Research Part D | Q1 | United Kingdom | Case study | Environmental; economic; social | A2; A1; B; G; H1; I3; J; M1; M2; AC; AG1; AQ1; AU | FS4; FS6; FS7 | Un1; Lo1 | AnTo_35 |
| [] | Procedia Engineering | Russia | Case study | Economic; social | B; R3; Y4; Z; AF5; AU | FS4; FS6; FS7 | Un1; Lo1 | AnTo_27 | |
| [] | Energy Reports | Q1 | Nigeria | Case study | Environmental | AG1 | FS2; FS6 | Un2; Lo1 | AnTo_32; AnTo_3 |
| [] | Journal of Enterprise Information Management | Q1 | Several countries | Case study | Environmental | E; F; H4; R1; R2; T4; Y6; Z; AA; AF1; AG1; AL; AN; AO; AV | FS6 | Un2 | AnTo_35; AnTo_41 |
| [] | Transportation Research Part D | Q1 | Taiwan | Case study | Environmental, economic; energy; financial | A1; A2; H1; I1; J; AG1; AG4; AS | FS2; FS6 | Un2 | AnTo_35; AnTo_55 |
| [] | Case studies on Transport Policy | Q1 | India | Case study | Environmental; economic; social | A3; V2; AB; AC; AG1; AQ1; AQ3; AQ2; AS; AT1; AV; AY3 | FS7; FS8 | Un2 | - |
| [] | Journal of cleaner production | Q1 | Review | FS4; FS6 | Un2 | AnTo_1; An To_15; | |||
| [] | Environment, Development and Sustainability | Q1 | India | Review | Environmental; economic; social | A3; B; H4; J; Y3; AG1; AG4; AQ3; AS; AT1; AU | FS5; | Un2; Mo2 | AnTo_27; AnTo_35; AnTo_55 |
| [] | Case studies on Transport Policy | Q1 | Bangladesh | Case study | Environmental; economic; Social | A1; A2; A3; E; M2; T4; Y6; AD1; AG1; AG4; AS; AT1; AX | FS6; | Un1 | AnTo_54; AnTo_16 |
| [] | Sustainability | Q1 | Switzerland | Case study | Environmental; economic; social | M2; T4; AC; AG1; AG4; AV | FS4; FS6; FS19 | Un2; Lo1 | AnTo_15 |
| [] | Procedia Social and Behavioral Sciences | Sweden | Case study | Environmental; economic; social | A1; A3; H5; O2; AG1; AM; AS | FS4; FS8 | Un1 | AnTo_15 | |
| [] | Transport Policy | Q1 | France | Case study | Environmental; economic; social | A1; A2; A3; B; G; H2; H3; M1; M2; R2; R3; X1; X2; Y2; Y3; Y6; AC; AD1; AE; AF5; AG1; AG4; AH; AO; AP; AQ1; AQ3; AS; AT2; AU; AV; AX | FS4; FS6; F S7 | Un1; Lo1 | AnTo_15 |
| [] | International Journal of Transportation Science and Technology | Q1 | Several countries | Case study | Environmental | AG1 | FS7; FS14 | Un2 | AnTo_27; AnTo_40 |
| [] | Land Use Policy | Q1 | Australia | Case study | Environmental; economic; social | A1; B; H3; I3; I2; AG1; AR; AV | FS5; FS6; FS8 | Un1 | AnTo_6; AnTo_14 |
| [] | Sustainability | Q1 | Australia | Case study | Environmental; economic; social | D1; H3; H5; I1; R1; V2; AG1; AR; AS; AV | FS4; FS6; FS7 | Un2; Se1 | AnTo_19 |
| [] | Journal of cleaner production | Q1 | China | Case study | Environmental, economic; social; effectiveness of the System | A2; A3; D1; H3; I3; M2; U2; V2; Y2; Y4; Y7; AD1; AD2; AG1; AG4; AH; AU; AV; AY2 | FS6 | Un1 | AnTo_14; AnTo_12 |
| [] | Case studies on Transport Policy | Q1 | Several countries | Case study | Environmental; economic; social | A2; A3; B; D1; I2; Y7; AG1; AM; AQ1 | FS6 | Un2; Se1 | AnTo_19 |
| [] | Environmental Modelling & Software | Q1 | United Kingdom | Case study | Environmental; economic; social; Energy | G; H1; I1; Z; AG1; AS | FS18 | Un2; Se1; MT1 | AnTo_35; AnTo_55 |
| [] | Journal of Urban Planning and Development | Q1 | Spain | Case study | Environmental; economic; social | A1; E; H1; I1; M2; R2; Y7; AC; AG1; AG4; AQ1; AS | FS4; FS6 | Un1 | AnTo_38 |
| [] | Ecological Economics | Q1 | Several countries | Case study | Environmental; economic; social | A3; B; T4; U2; V2; AD1; AG1; AQ1; AT1 | FS6; FS14 | Un2; Mo2 | AnTo_24 |
| [] | Scientific African | Q1 | Nigeria | Case study | Environmental | T1 | FS4; FS6; FS10; FS11 | Un2; Se1; Lo1 | AnTo_11 |
| [] | Case studies on Transport Policy | Q1 | Brazil | Case study | Social | A1; A2; E; M1; Q; X1; X2; Y4; Y6; AA; AD2; AF2; AH; AN; AQ1; AS; AT1; AU | FS1; FS6 | Un1; Lo1 | AnTo_35 |
| [] | Sustainability | Q1 | China | Case study | Environmental; economic; social | A2; B; D1; H1; V2; AG1; AV; AW; AX; AY3 | FS10 | Un2; Ca3 | AnTo_12 |
| [] | Research in Transportation Economics | Q1 | Several countries | Case study | Environmental; economic; social | A1; B; H1; I1; I2; J; M2; O1; AD1; AG1; AT1; AT2; AV | FS6 | Un2; Ty1 | AnTo_54; AnTo_22 |
| [] | Int J Syst Assur Eng Manag | Q2 | Review | Environmental | H5; I3; AG1; AG3; AG4; AO | FS5; FS10 | Un2; Se1; MT1 | AnTo_25; AnTo_46 | |
| [] | Transportation Research Interdisciplinary Perspectives | Q1 | United Kingdom | Case study | Environmental; accessibility; innovation | A1; A2; B; H1; J; M1; R1; T3; Z; AF2; AT1 | FS5; FS10 | Un2; Se1; MT1 | AnTo_45 |
| [] | Socio-Economic Planning Sciences | Q1 | Case study | Social | A3; A2; B; O2; V1; V2; Z; AG1 | FS5 | Un2 | AnTo_12 | |
| [] | Journal of cleaner production | Q1 | Canada | Case study | Accessibility | A2; AQ1 | FS5; FS19 | Un2; Lo1 | AnTo_42 |
| [] | Transportation Research Procedia | Italy | Case study | Environmental; Social | B; J; AB; AG1 | FS15 | Un2; Ca2 | AnTo_5; AnTo_19 | |
| [] | Transportation Research Procedia | Case study | Environmental; economic; social | C; E; I1; S1; AG1; AH | FS6; FS9 | Un2; Lo1 | AnTo_53 | ||
| [] | Transportation Research Part D | Q1 | China | Case study | Environmental; economic; social | A1; B; H2; AD1; AG1; AW | FS1; FS2 | Un2; Ca4 | AnTo_12 |
| [] | Sustainability | Q1 | Sweden | Case study | Environmental; economic; Social; Technological | D1; I1; I2; T1; T4; Z; AG1; AG4; AS | FS4; FS6 | Un1 | AnTo_44 |
| [] | Sustainability | Q1 | Sweden | Case study | Environmental; economic; social; technological | D1; I1; I2; T1; T4; Z; AG1; AG4; AS | FS4; FS7 | Un1; Lo1 | AnTo_44 |
| [] | Computational Intelligence | Q2 | Several countries | Case study | Energy | A2; J; U2; V2; Y3; AT1; AT2; AX | FS6; FS19 | Un1; Lo1 | AnTo_12 |
| [] | Ecological Indicators | Q1 | India | Case study | Environmental; economic; social; activity | A3; A1; D1; F; G; H1; M2; R1; S1; U1; W; Y7; AD1; AD2; AF1; AF2; AG1; AG4; AQ1; AR; AS; AT1; AU; AV; AY2 | FS17 | Un2; Lo1 | AnTo_5 |
| [] | Transportation Research Part A | Q1 | Case study | Environmental; social | A1; H1; H2; AT2 | FS3; FS6 | Un2; Se1; MT1 | AnTo_15 | |
| [] | Sustainability | Q1 | Lithuania | Case study | System efficiency | B; J; M1; M2; Y1; Y2; AU | FS8 | Un2; Ca3 | AnTo_42 |
| [] | Journal of Transport Geography | Q1 | Case study | Environmental; social | A2; H4; AG1; AS; AU | FS6 | Un2 | AnTo_15 | |
| [] | Environment, Development and Sustainability | Q1 | India | Case study | Environmental; economic; social | A2; H1; L; T3; T4; AG1; AS; AV; AY2; AY3 | FS6 | Un2; Ca2; Lo1 | AnTo_6; AnTo_14 |
| [] | Ecological Indicators | Q1 | Case study | Environmental; economic; social; system efficiency | A2; A3; B; C; H1; H4; H5; I3; I1; N; M1; M2; O2; R1; R3; T2; U1; V1; V2; W; Y3; AA; AD 1; AE; AF1; AG1; AG2; AG4; AI; AN; AO; AQ3; AR; AS; AT1; AU; AV; AY2 | FS4; FS6 | Un2 | AnTo_33 | |
| [] | Transportation Research Procedia | Greece | Case study | Environmental; economic; social | A1; A2; A3; B; D1; D2 ; E; H1; H2; H4; I1; I3; J; L; M1; M2; T1; T4; U2; V2; W; Y1; Y2; Y3; Y7; AD1; AF2; AG1; AG3; AG4; AM; AQ1; AQ2; AR; AS; AT1; AU; AV; AX | FS4; FS6; FS7 | Un1 | AnTo_26 | |
| [] | Transportation Research Procedia | Several countries | Case study | Environmental; economic; social | B; M2; T1; U2; AD1; AG1; AG4; AQ3; AS | FS3; FS4 | Un2; Ca3 | AnTo_13 | |
| [] | Research in Transportation Business & Management | Q1 | Several countries | Case study | System efficiency | M1; V2; Y2; AD1; AQ1 | FS4; FS6; FS7 | Un2; Mo1 | AnTo_12; AnTo_8 |
| [] | Ecological Indicators | Q1 | Spain | Case study | Environmental | AG1 | FS6; FS17; FS19 | Un2 | AnTo_13 |
| [] | Case studies on Transport Policy | Q1 | Brazil | Case study | Environmental; social; performance | A2; A3; B; H1; J; Y4; Y7; AC; AG1; AT1; AT 2 | FS4; FS7; F S19 | Un2 | AnTo_13 |
| [] | Current Opinion in Environmental Sustainability | Q1 | Brazil | Review | Environmental; economic; social | A2; A3; B; D2; H1; I3; L; M2; R2; S1; S2; AG1; AG4; AQ1; AQ3; AR; AS; AV | FS5; FS6 | Un2; Lo1 | AnTo_15 |
| [] | Ecological Indicators | Q1 | Australia | Case study | Environmental; economic; social | A1; B; H3; I3; I2; AG1; AR; AV | FS6 | Un2; Mo1 | AnTo_6; AnTo_14; |
| [] | European Transport - Trasporti Europei | Q3 | India | Case study | Environmental; economic; social | A2; A3; H3; O1; O2; T3; T4; AG1; AS; AV; AY2 | FS4; FS6 | Un1 | AnTo_6; AnTo_33; AnTo_36 |
| [] | Journal of cleaner production | Q1 | Serbia | Case study | Social; economic; resource; climate | H1; H3; M1; R2; T1; T2; V2; AD1; AG1; AR; AS; AY2 | FS4; FS6; FS8 | Un1 | AnTo_33 |
| [] | Ecological Indicators | Q1 | Taiwan | Case study | Environmental; economic; social | B; D1; H1; AB; AD2; AG1; AQ2 | FS6; FS10; FS14 | Un2; Mo2 | AnTo_23 |
| [] | Procedia Engineering | Several countries | Case study | Environmental; economic; social; performance | A2; A1; M2; P; R2; Y3; Y4; Y5; AB | FS7 | Un2 | AnTo_2 | |
| [] | Sustainability | Q1 | Several countries | Case study | Environmental; economic; social; accessibility; quality | A1; A2; B; U2; V2; AG1; AG4; AQ1; AT1 | FS17; FS19 | Un1; Lo1 | AnTo_48 |
| [] | International Journal of Applied Earth Observation | Q1 | Canada | Case study | Accessibility | M2; Y2; AT2 | FS4; FS18 | Un2 | AnTo_13 |
| [] | Research in Transportation Business & Management | Q1 | Case study | Environmental; economic; social | A1; H1; I1; Y7; AA; AB; AD1; AD2; AG1; AG4; AQ1; AS; AV; AY2 | FS18 | Un2; Lo1 | AnTo_12 | |
| [] | Traffic Management Original Scientific Paper | Q3 | Hungary | Case study | Quality | AQ1 | FS18 | Un2 | AnTo_50 |
| [] | Transportation Research Interdisciplinary Perspectives | Q1 | Bangladesh | Case study | Environmental | T1; AG1; | FS4; FS6 | Un2; Lo1 | AnTo_12 |
| [] | Research in Transportation Business & Management | Q1 | Brazil | Case study | Environmental; social | H1; I3; AG1 | FS4; FS6; FS10 | Un2; Lo1 | AnTo_7 |
| [] | Transport | Q2 | Denmark | Case study | Environmental; economic; social | A1; E; P; T1; Y6; AG1; AG4; AY1 | FS18 | Un2; Lo1 | AnTo_35; AnTo_52 |
Appendix E
| Cod. | Indicators Cataloged in the Papers in Relation to Indicator Coding |
| A1 | %Bus Difficulties; Access to public transportation; Access to TP, facilities and vehicles; accessibility; Accessibility for the elderly and disabled; Accessibility of public transportation; Accessibility of vehicles/public transport stations; Accessibility to people with reduced mobility; Adaptation of bus stops; Means of transport for people with disabilities; Provisions for the mobility of children/elderly/people with disabilities; PT vehicle quota and accessible wheelchairs arrests; Public transportation level of accessibility; Reduction of social exclusion due to low accessibility to transport services for people with mobility problems; System Accessibility Index; Transport and Accessibility Network; Transportation to disabled; Universal Accessibility for UPT; User Accessibility |
| A2 | % of the population that lives 0.5 km from public transportation; Access; Access to an integrated information system to passengers; Access to basic services; Access to education and employment opportunities; Access to important services (schools, hospitals…); Access to infrastructures for transportation and/or production companies located outside the city center; Access to modes of transport and convenience; Access to public transport (population served by public transport near a train station, subway, bus stop); Access to public transport (population served by public transport near train, subway, bus stop); Access to traffic; Accessibility for pedestrian; Accessibility for women; Accessibility on foot; Accessibility to modes; Accessibility to public services; Accessibility to traffic modes and related installations; Accessibility to villages with rural roads; Achievement; Bicycle network length; Bicycle origin-down; Bike paths (segregated/unspatched); Convenient access to the public transport service; Cycle Long and Walking Trails; Fixed route bus service miles; Increase in pedestrian kilometers; Increase in the number of kilometers traveled in public transport; Increase in the number of kilometers traveled on bicycle; Km of the PT system; Length of paved roads; Origin-destination traveled on foot; Pedestrian access to public transportation; Pedestrian crossings by road length; Pedestrian network length; Proportion of residents with TP service within, for example, 300 or 500 m of residential location; PT network coverage; Public transport access; Public Transport Offer: Vehicle-Quilometer in local bus services by the local authority; Public transportation coverage index; Quantity of bus stops; Railway network length; Reduce portion of accessible destinations by people with disabilities and low income; Reduction in average distance on foot/for bus stops to specific pairs of resignation.; Road network length; Road Network Length; Service Accessibility; Service coverage; Spatial Accessibility; Spatiality of Displacement; Total extension of roads (railways, filed) (km of infrastructure by 1000 inhabitants); Traffic light in favor of cyclists/pedestrians/public transport; Transport line length; Transport modes and related installations; Transportation services for remote areas; |
| A3 | Ability to pay; Access to free public passenger transport; Accessibility; Accessibility - Travel Costs as part of the income; Accessibility (portion of revenue dedicated to transport); Accessibility and household expenses; Accessibility of public transport (expenses such as percentage of the family budget/subsidies for vulnerable groups, etc.); Accessibility of the PT (portion of the income of families dedicated to travel through the PT); Cost per travel of the passenger in transit, adjusted by inflation; Direct cost of the user regarding the trip by the PT; Direct cost of the user regarding trips in private vehicles; Domestic expenses attributed to transportation (% of the budget); Economic accessibility to UPT; Efficient prices; Families who cannot afford a car (AF); Family expenses in transportation; Portion of household spending; Proportion of life expense in the transportation sector; PT accessibility to the poorest group; Total consumption of families for transportation (CON); Total per capita transportation expenses; Transportation costs; Transportation costs and expenses; Transportation costs and expenses for users and community; Transportation expenses with transportation; Travel cost; Unit price; User costs; |
| B | Accidents for 1000 VKM, millions operation of inhabitants; Deaths in Traffic; Fatality and injured in traffic accidents; Geolocation and registration of events (accidents) on the roads along with their view on the city map; Number of accidents per type (fatal/non -fatal) and modality (total/per capita); Number of deadly victims in road accidents per million inhabitants; Number of traffic accidents; Number of traffic accidents for 1000 inhabitants; Number of transit fatalities per 100,000 inhabitants; People killed by 1000 VKM, millions inhabitants operation; Proportion of cases of traffic accidents for 10,000 populations; Road Deaths; Traffic deaths per 100,000 inhabitants; Traffic victims; Traffic-accidents |
| C | Fair claim for death/worker injury; Paternity leave; Regular assessment of workers’ salaries and benefits; Regular wage assessment; Rendering of retirement benefit, pension fund and gratuity; Workers Health Insurance; |
| D1 | Carbon Reduction Credit (CRC); Investment; Investment benefit; Investment in public transport systems; Investment in Transport Infrastructure (per capita and way of GDP); Investments in Transport and Infrastructure Systems; Liquid benefit; Need for investments in infrastructure; Public spending, investments and subsidies in the transportation system; Total investment in fixed assets; Transport government investment; Transport investment in fixed assets; |
| D2 | % of subsidized costs PKM per unit GDP (passenger km traveled); Alternative fuel incentives; Cost and benefit of the local government; Cost and direct benefit to the consumer; Direct subsidies to the PT; Direct subsidies to transportation; Grant; Harmful subsidies and green fiscal policies; Incentives for deliveries with clean vehicles; Incentives for the use of electric vehicles; Indirect cost and benefit to the consumer; Local Government Transport (Annual, GDP) expenses; Public spending, investments and subsidies in the transportation system; Public Transport Subsidies; Public transportation expenses (operations and investments); Transportation allowance in remote areas; |
| E | Adequacy of public transportation; Average age of vehicle fleet (years); Average Ages of the PT Fleet; Engine standards; Introduction of electric buses in the city’s public transport system; Mixed and use; Modal characteristics; Motorization rate; Road Vehicle Fleet Structure; Technical Characteristics; Travel characteristics; Use of long and heavy vehicles; Vehicle adaptation; Vehicle age; Vehicle Characteristics; Vehicle type; |
| F | Ecological footprint; Environmental Certification of Cargo Transporters; Percentage of carriers that obtained the CO2 objective certification |
| G | Acceptance; Communication channel with society; environmental education; Environmental sympathy; Holding events and actions encouraging residents to use ecological transportation; Promotional campaigns (frequency, description, attendance); public awareness; Public awareness of transport sustainability issues; |
| H1 | Alternative energy consumption; Amount of energy consumed; Daily consumption of per capita energy for passenger transport; Energy consumption; Energy consumption of the road transport sector; Energy consumption on the road; Energy consumption rate; Energy intensity; Energy used by resource; Final energy consumption of the transport sector regarding the urban level; Per capita energy consumption, by fuel and mode; Per capita transport energy consumption; Reduction of energy consumption; Total energy consumption; Transport energy consumption; Transportation consumption in transportation; Use of energy |
| H2 | Consumption of alternative and renewable energies; Green Energy Use; Renewable energy; Renewable energy consumption; Renewable energy type; The amount of renewable energy in total energy used for transportation; Use of clean energy, renewable and alternative fuels; Use of renewable energy sources and biofuels; |
| H3 | Energy consumption (standard coal); Exhaustion of fossil fuel resource; Exhaustion of non -renewable resources; Fossil energy consumption by transportation system; Fossil fuel depletion (FFD); Fossil fuel energy consumption; |
| H4 | Amount of fuel consumed energy; Fuel consumption; Fuel consumption and efficiency; Fuel consumption of private vehicles; Reduce per capita fuel consumption; Type of fuel used in the PT fleet; Use of alternative fuels |
| H5 | Exhaustion of resources; Natural Resources Consumption; Other resources; resource conversation; Use of resources; Water consumption; Water Consumption (WC) |
| I1 | % of costs recovered; Average financial cost; Capital costs throughout the system; Comparative cost index outside the vehicle; Cost; Cost internalization; Cost of the Railway Company; Cost recovery (recovered cost ratio); Cost stability; Costs; Implementation cost; Individual Route Capital Costs; Infrastructure Costs; Integrated cost; Investment cost; Life Cycle Cost (LCC); Scheme Cost; Social Transport Cost; transportation costs; Urban Transport Costs; Vehicle cost comparative index |
| I2 | Annual operating cost; Car ownership costs; Comparative Operating Cost Performance Index; Operating costs of the public transport system; Operational costs; Total Cost of Property; |
| I3 | Accident cost; Annual number of useful tires; Average cost of time; Comparative cost of vehicle fuel; Comparative Cost of Vehicle Maintenance; Congested traffic; Congestion delay; Cost of delay; Cost of pollution; Damage by accident; Economic loss of traffic accidents; External costs of transportation activities by way; External Transport Costs; Fuel prices and taxes; Fuel prices for motor vehicles; Gasoline price; Girdle; Gravity of congestion; per capita congestion cost; Per capita congestion costs (total time spent in traffic); Social/External Transport Costs; Total T.KM Transport Cost; Travel cost; Vehicle costs and general accidents; Vehicle costs and general accidents, active transport benefits |
| J | % of passengers using a different travel mode from the personal vehicle; Airport passengers; Annual number of passengers in per capita transit; Annual PT per capita travel number; Annual trips for public transportation by capita; Bus passenger percentage; Daily or annual passenger-km through PT; Demand; Maximum number of public transport passengers at peak times; Number of users; Passenger km traveled by PIB PKM/$ US unit; Passenger/day; Passenger-Quilometer in Public Transportation; Per day or annual passengers in private vehicles; Percentage of all trains passengers; Percentage of cargo transported by road; Percentage of residents using public transport to go to work/gym; Percentage of residents who go to work/gym on foot; Percentage of residents who use private car to go to work/gym; Percentage of volumes managed by transport mode (road, rail, waterway); Public Transport Demand; Public transport demand: Passenger trips in local bus services 2018/19 (Millions); Response Capacity to Demand; Traffic demand; Traffic Service intensity; Transport intensity; |
| L | Capital expenses by way; Expenses and Funds of Traffic System Operators; Expenses of Funds Transport and Allocation System Operators; R&D expenses in eco-ves; Total expenses in pollution prevention and cleaning; Total transportation expenses (vehicles, parking, roads and traffic services).; |
| M1 | % public mode (bus, London subway, train, taxi, other public transport); Availability and quality of various modes and accessible types of travel; Availability of the main services locally; bicycle trips %; Capital measured by the bus number; Car Travel %; Frequency; Frequency of public transport service (by location); Number of Travel; pedestrian trips %; Per capita annual trips; Product availability; PT frequency during peak hours; public transport trips %; Service frequency; Speed ?? and flow of traffic from TP and privately; Transport availability; Travel from/to schools; |
| M2 | Common passenger cars for; Common trucks for highways; Community habitability diversity; Diversity of non-motorized planning transportation; Diversity of the transportation system/variety of transportation; Diversity of transport governance bodies; Diversity of transportation; Diversity of Transportation Resource Efficiency; Division of mode: part of the trip made on foot, by bicycle, passenger, public transport and teleworking; Division of public transport mode; Electromobility penetration (number of electric/hybrid vehicles in % of the total fleet); Introduction of electric delivery vehicles for urban transport of goods; Less private cars; Load ratio of trucks carrying goods from shippers; Modal division; Modal division of non -motorized modes; Modal Division of Travel Made; Modal Installment; Modal Office; Modal participation of active and public transportation in hanging travels; Modal Traffic Division; motorization rate; Number of PT means; Number of transport modes available; Passenger transport trends by modal (modal division); Penetration of autonomous cars (number of autonomous vehicles in % of the total fleet); Penetration of cars sharing (Uber, etc.); Percentage of trucks in the average flow; Population Travel Mode; Public Transport Modal Installment; Public transportation; Railroad locomotives; Railway passenger wagons; Shape; Terrestrial means of transportation; Transport System Diversity; transportation means mainly used to reach the workplace/training: Automobile (%); Transportation means mainly used to reach the workplace/training: public transport + bicycle (%); Travel Mode Index; Travel Participation; Vehicle route by mode (non -motorized, car and public transport). |
| N | Child Labor Prevention; Civil and Human Rights; Civil rights of workers; Freedom of expression; Freedom related to participation in vote and other political freedoms; Human Rights Complaint Mechanism; Indigenous rights; Labor law; No religious discrimination; Prevention of child and forced labor; Protection of human rights and freedom; Respect for workers’ civil rights; Without forced labor and analogous to the slave |
| O1 | Delivery windows; Effectiveness of public transportation; Effectiveness of the System; Number of empty kilometers for trucks without goods; Public Transport Fleet Size |
| O2 | Economic Efficiency and Development; Economic efficiency of the transport system; Efficiency; Efficiency Change Index; Efficient transportation operations; Network efficiency; Operational efficiency; Public transportation efficiency; Transportation efficiency |
| P | Coherence between regions; Comparative coverage of the city; Comparisons: Spatial/Temporal Classification; Spatial and functional continuity of the pedestrian corridor; |
| Q | Adequate ventilation; Availability of first aid and safety equipment; Cleaning; Closed doors during the trip; Driver’s cabin of the vehicle equipped with fire extinguisher; Regular vehicle maintenance; |
| R1 | Annual Publication of the Environmental Sustainability Report; Audit and Environmental Compliance Programs; Avoid empty transport practices; Collaborative partnership with other goods transport companies; Comparative environmental performance index; Coordinated Logistics and Transportation Programs; Environment Management; Environmental knowledge sharing between cargo transportation actors; Environmental Management System, ie ISO: Certifications of the 14000 Series; Environmental sustainability goals of organizations; Establishment of new expertise and intercoming group dedicated to sustainability; Fossil Fuel Conservation (CFF); Frequency of environmental meetings with carriers; Frequency of meetings with other divisions (production, purchases, R&D) in relation to environmental issues; Green awareness collaborative training program; High Administration Support; Promote environmental awareness program for employees; Promote the use of green container (expert contribution); Provide incentives and benefits for the practice of green behavior; Sharing a cargo vehicle with other transportation companies; Sharing information on greenhouse gas goals; Support for the development of intelligent growth; Sustainable actions/objectives in public transport in intelligent transportation intervention; Training frequency for transport buyers; Used oil management and leaks; Waste; |
| R2 | Comparative economic activity; Comparative economic index; Comparative performance index of the city; Comparative reality index; Comparative resource performance index; Comparative Travel Performance Index; Competitive pressure from other transport companies; Cost and investment transparency; Economic opportunity; Growth and Development; Informality in transportation; Introduction of collective deliveries in the city center; Introduction of deadlines (the so -called time windows to make deliveries) for urban freight; Introduction of Night Deliveries in Urban Transportation of Goods; Loading and unloading operation out of the road; Operator Comparative Performance Index; Organizational; Participation in final dairy products; Participation in raw milk processing; Percentage of pallets received and charged by carriers who registered in the Fret 21 letter; Percentage of pallets received and loaded by ISO 14001 certified carriers; Performance Management; Presence of the company at the international or national level; Transportation; |
| R3 | Anti -corruption practices; Business corruption free practices; Corporate governance; Development of Community Capital; Fair employment practices; Fair transport contract practices; Fix some work for minority people; Hire local talents as a worker and driver; Human capital; Institutional aspects; Integrated, comprehensive and inclusive planning; Management of individual and public transport logistics; Perception of corruption in execution (based on research); Productive capital; Promote a challenging work environment to develop a diverse workforce; Provide accessible house to workers; Support of the High Direction; Sustainability sets with other cargo transportation organizations; The diversity of governance bodies; Total professionalism in the logistics business; |
| S1 | Cumulative opportunity; Equal job opportunities for all; Equal opportunities for all; Equality; Gender equality; Gender equality between societies and groups; Salary equality at the same level; Social equality; |
| S2 | Equity; Gender -based equity; Gender equity between societies and groups; Social equity (justice); |
| T1 | Ambiental degradation; Biocapacity index; Biodiversity and Environmental Protection; Environmental damage related to transportation; Environmental Effect Factor; Environmental impact; Environmental impact of the transportation installation; Habitat and ecosystem disruption; Impact Exercise in Dex; impact of modal change; Impact on Biodiversity; Impacts on Habitats; Impacts on the Fjord; Local/regional impact on terrestrial and aquatic environments; Ozone destruction; Proximity of transport infrastructure with environmentally sensitive areas (ESAS); Quality in the ecosystem; Reason Reason Exercise; The extension of ecologically correct transportation by city area (in km2); Wild life; |
| T2 | Climate changes; Global warming potential; Transport infrastructure and operations affected by climate change |
| T3 | Ecological buses; Environmental efficiency; Environmental Efficiency of Vehicles |
| T4 | Energetically Efficient Load Terminals; Energy efficiency; Energy intensity (IS); Materials handling equipment with energy efficiency; Primary energy efficiency not renewable; PT Fleet Fuel Efficiency; Renewable energy potential; Resource efficiency; |
| U1 | City economy; Local economic development; Support for local industries |
| U2 | Contribution of measures to the city’s various economic sectors (tourism, entrepreneurship, etc.); Economic Activity (GDP); GDP; GDP per capita; GDP per inhabitant 2010; GDP percentage contributed by transport; Gross Domestic Transport Product; Portion of GDP contributed by the transportation sector; Transport contribution to GDP (VAG) |
| V1 | ageing population; Crescent population; Impact of cargo transportation on local communities that live near the cargo source; Impacts on Habitats; Increase benefits to society without compromising future generations; Operation Effect; Passenger transport; Reduce the impact of low -income families that spend more than 20% of transportation budgets; Rehabilitation of local communities; social impact; |
| V2 | 3 -year job; Access to work and employment; Accessibility to employment; Additional job; Comparative Urban Employment; Contribution of the transportation sector (by way) to the growth of employment; Contribution of the transportation sector for employment growth (EMP); Creation of local jobs; Employment in Road Transport and Railway Sector; Employment tax; Increase of new jobs; labor measured by the number of employees; Number of employees; Proportion of employees in high school and higher education; Transport professionals |
| W | Contribution to National GDP; Cost Tax on Society (Monetary); Imposed by km; Minimum fuel taxation; Regular taxes paid by the company; Relative taxation of vehicles and use of vehicles; Special Tax on Road Transport Fuel (gasoline, diesel for 1000 liters); Taxes; Transport Budget and Road Taxes (Tax Revenues); Vehicle taxation; |
| X1 | Clarity/frequency of signaling and information systems (electronic/conventional); Information (bus stops); Information (vehicle) |
| X2 | Clarity/frequency of signaling and information systems (electronic/conventional); Sign (roads); Signal (bus stops) |
| Y1 | Bicycle network density; Bike lanes; Bike path net density (km/km2); Cycling infrastructure; Km of bike paths and bike lanes; Sidewalks and pedestrian routes; |
| Y2 | average network extension; Complicity; Density of the Public Transport Network; density of the railway network; Density of the streets network (km/km2); Highway density; Infrastructure density (km infrastructure by 1000 km surface; number of lines; Pedestrian network density; Population density; Population density (total and district); Population/Building densities (average/in CBD/around IE Tod traffic stations); Public transport density (km/km2); Railway density in operation; Road Network Density; Traffic Distribution Density; Urban compactions population |
| Y3 | Park and Ride system; Bicycle parking availability; Capacity of Park and Ride facilities; Circulation and parking rates; Kissandride parking parks allow for a quick stop - from a few minutes to a quarter of time to go down a passenger to school or station; Parking; Parking availability (max./Min. Land use parking spaces); Parking demand; Parking rates (by location); Parking space area; Proximity to bicycle parking lot; The proportion of parking lots for Park and Ride (P&R); Underground and logistics parking |
| Y4 | Allocation of land (roads) in the city for logistics operations; Dynamic Road Situation Forecast based on online video cameras, detectors and traffic controllers; Highway length; Mileage implanted (km); Pavement; Paving; Preventive Maintenance of Roads; Railroad length in operation; Rua Proportion |
| Y5 | Service level of circulation corridors; The proportion of exclusive bus lanes; |
| Y6 | Aesthetics; Build a city distribution center; Buildings of buildings (average and district); Charging stations for electric vehicles (coverage of the area); Distribution centers; Ecological warehouse design; Exclusive spaces for load/discharge; Existence of banks; Existence of coverage; NMT Installations; Provide proper sanitation, drinking water facilities for the worker; Provision of bicycle service points (coverage area); Provision of bike racks for land use (residential/commercial) and type (open/sheltered); Removal of goods transport generators due to the city’s revitalization or revitalization; scenic adaptation; The effect of public deposit on the transhipment of cargo; Using Public Infrastructure |
| Y7 | Cargo vehicle restriction; Condition of transport networks; Double -way railway ratio; Infrastructure; Introduction of load and discharge zones for delivery vehicles; Introduction of toll zones for entry into the city center of heavy vehicles; Introduction of toll zones for the city center for passenger cars; Parking restriction; Proportion of expressways and class I, II; PT size in relation to the population; Rail network; Restriction to low occupation vehicles; Restriction to passenger vehicles; Spatial restrictions for goods transport vehicles, depending on their weight and size; Superior Public Transport Network (Trams, VLT, Metro, BRT, VLT); To what extent transport plans cover public transport, intermodal facilities and infrastructure for active modes; TPU infrastructure; Transport infrastructure in remote areas; Transport Network Characteristics; urban form; Urban model |
| Z | % Bus with live readers who accept intelligent cards Oyster/ITSO1 by status of metropolitan area, local buses, only operators; % bus with live readers who can accept payment cards without contact1 for metropolitan area status, local bus operators only; % buses used as public service vehicles with automatic vehicle location device (AVL) by metropolitan region status of the area, only local bus operators; % buses used as public service vehicles with CCTV by status of the metropolitan area and country, local buses only operators; % buses used as public service vehicles with free Wi-Fi for metropolitan and country status, local buses only operators; % of buses with AVL to provide real -time service information to customers for metropolitan status, local bus operators only; Annual DCIe for Data Center; Application of ICT practices; Cargo Transport Communication System; Crowshipping; Daily operational availability; Improve Innovation in Delivery; Increase innovation; Innovation; "Mobility as a service; Unauthorized vehicle detection: It has a bus lane inspection system/bus/bus gate only"; Open Data Platform/API; P&D Green and Innovation; Percentage of operators equipped with telematics; Rapid development; Smartphone applications that allow you to buy public transport tickets and optimize routes; Sociotec system services; Technical maturity; Technological Change Index; Technology Application and Management; Transport applications and digital resources; UPT Communication System; Vehicle routes tracking |
| AA | Interconnectivity of transport modes; Intermodal integration; Intermodality; Liberalization and interoperability of the railway market; Location of bus stops and route planning; Modal Integration; Route connectivity; Use of intermodal/multimodal for long -haul transportation; |
| AB | Comparative urban mobility; Efficient mobility; Impacts of disadvantaged mobility; Introduction of banning passenger car access to the city center; Low impact mobility; Mobility; Mobility and intensity of railway use; mobility and transport for the elderly and disabled people; Mobility Options; Urban Mobility (Modal Office); Use of mobility space; Walking; |
| AC | Bicycle sharing system; Delivery services in pedestrian/traffickers; Introduction of bicycle transport for delivery of goods in the city; More sustainable and non -motorized modes; Motorized modes; Non -motorized planning; Non -motorized planning security; Non -motorized transport portion (including walking); Non -motorized transportation; Number of bicycle trips; Percentage of residents who use bikes to go to work/gym; Use of public and non -motorized vehicle; |
| AD1 | Acceptance of active displacement; Average passenger occupation rate vehicles; Average rate of occupancy of passenger vehicles; Cargo transport; Commercial transportation; Comparative use of vehicle personnel; Comparative use of vehicle travel; Installment of Non -Motorized Individual Transportation (NMOT); Mile; National National Road Transport of Goods by Charging Regions by City Area (1,000 t/km2); Occupancy rate; Occupancy rate of private modes; Occupancy rates of private vehicles; Occupation; Participation of the internal passenger car transport (CPT); Passenger and goods road and goods; Passenger km; Passengers-Quilometers (PKM); Passengers-Quilometers Transported (PKT); PT occupation; Public transport service; Railway transportation; Road of Terrestrial shipping (RTF); Shipping Ton-Children; Tons-Quilometers (TKM); Total miles traveled by vehicles; Transport of goods (percentage of traffic volume, impact on noise, pollution, safety, etc.); Travel rate; UPT Cargo transportation; Vehicle-kilometer; Volume of business; Volume transported by m2; Weight of goods charged by pallet and then by truck |
| AD2 | battery capacity; Capacity; Capacity and railway assets; Comparative transport capacity; Fleet; Load factor; Passenger capacity; Passenger load factor (ridership); Traffic loading factor; Transportation capacity; Truck load factor |
| AE | Accept suggestions and comments on new ventures; Active citizen; Citizen participation in the transportation decision; Community capital; Community cohesion; Creation of a forum (or other ideas) dedicated to the ecological urban transport of goods; Fair transport contract practices; Inclusive communities; Influence of other stakeholders in transportation; Influence of other transportation actors; Public participation (No. of people present at meetings/public hearings on transport issues, monthly/annually); Public participation in planning, decision making and action; Public support; Response capacity to traditional communities; The scope of a city’s partnership with specialists/institutions/entities specializing in integrated sustainable urban passengers and goods to improve passenger and/or goods transportation |
| AF1 | Compliance of the Law and Government Transportation Practices; Encourage transport operators to use alternative fuels; Environment -related policies; Policies to protect high value agricultural land and ecological habitat; Review and report of the environmental policy |
| AF2 | Coordination of tariffs and public transport hours; Fare; Local bus tariff index (at current prices) by metropolitan and country status; Price; Price policies; PT price trends; Tariff integration; Transport price; |
| AF3 | Exchange rate; Inflation rate; |
| AF4 | Fiscal policy; Net public finances; |
| AF5 | A city’s spatial development plan includes the transport needs of goods; Collaborative government policies; Organization and management of public parking spaces; The city implemented formal regulations on the collection of data on individual transportation; The city implemented formal regulations on the collection of data on urban cargo transportation; The city implemented formal regulations on the collection of public passenger transport data; The local administration (City Hall) has a position/department responsible for the transportation of goods; The local government has a comprehensive plan prepared in the integrated sustainable urban transport of passengers and goods, both for the transport of passengers and goods; The local government has a work partnership for the quality of goods transport in the city; The local government has prepared a cargo transportation plan for the city; Time from the moment the local government began to include issues related to the transport of goods in the city’s long -term plans; Time since the local government began planning the organization of a city in terms of reducing environmental pollution; Tour Time Plans; Transport plans for companies; Transport plans to schools |
| AF6 | Adoption of government driving policies; Anti -corruption policies and procedures; Discounts on public transport tariffs for the elderly and students; Policies to reduce the impact of transportation activities on local communities; Special Discounts |
| AG1 | (%) Reduction of CO2 and NOX emissions caused by traffic; (CO2) Emissions; Air polluting emissions; Air pollution; Air pollution and reduction of population exposure; Air Pollution Control; Air quality; Ammonia Emissions (NH3); Atmospheric pollutant emission intensity; Atmospheric pollutant emission intensity (CO, NOX, PM10)/km; Atmospheric pollutant emissions; Average annual concentration of NO2; Average annual PM concentration; Carbon dioxide; Carbon emissions for transportation; CFCs Issuance (ChlorofluorCarbons) and HFCs (HydrofluorCarbons); CH4 Emissions (per capita); Climate change emissions; CO2 (per capita) emissions; CO2 mass, CH4, N2O, issued to the atmosphere; CO2 emissions; CO2 emissions of road transportation; CO2 emissions related to transportation; CO2, per capita emissions; Comparative air quality; conventional pollutant emissions; Cost of air pollution emissions; CoV emissions; Economy of greenhouse gas emissions; Emission of atmospheric pollutants; Emissions; Emissions produced by public transport modes by user; Exposure and health to atmospheric pollution; GEE (CO2-E) emissions; GEE emission intensity; GEE emissions; GEE emissions index; Global hearing potential (PAG); Greenhouse Gas (GHG) (CO2-E) emissions; Greenhouse gas (GHG) emissions; Greenhouse gas emissions; Greenhouse gas emissions resulting from the transportation sector; Integrated Pollutant Emissions; Issued particles (PM10 and PM2.5); Kg of CO2 by IT feature; Kg of CO2 certified out of you; Local air pollutants; Local atmospheric pollutant emissions, including maximum PM2.5 concentration; low emission zone; Low emission zones (LEZ) for delivery vehicles above 3.5 t; Low Emissions Zones (LEZ) for passenger cars; Mass of total pollutants emitted (for example, NOX, COV, CO2); Nitrogen oxide emissions (NOX); NOX (per capita) emissions; NOX emissions; Number of days that ozone concentrations O2 exceed 120 μg/m3; O3 concentration (per capita); Other air pollutants (CO, NO2, PM10); Ozone precursor emissions (OZ); Particular Material Emissions; Particular Transport Material (PM) emissions; Per capita CO emissions and other gees; Per capita emissions of global atmospheric pollutants (CO2, CFCs, CH4, etc.); Per capita vehicle emissions; PM10 and PM2.5 emissions (per capita); PM10 road transport emissions; Pollutant mass (NOX, CO, CO2, PM, HG) emitted in the soil, air and water; Pollutant volume; Pollutant/GEES levels; Pollution; Pollution by transport emissions; Pollution caused by the type of vehicle (light/heavy); Pollution production; Population exposed to air pollution resulting from the transport sector; Portion of the fleet of vehicles that meets certain atmospheric emissions standards; Reduction of atmospheric pollution; Reduction of environmental pollution; Remittances with reported CO2 emissions; Road transport emissions; Road transport N2 emissions; Road user emissions; Satisfaction with air quality (%); Scheme Life Cycle Emissions; SOX (per capita) emissions; SOX, NOX and PMB emissions; Sulfur oxide emissions (SOX); Tons of avoided CO2; Total pollution; Total Transport Greenhouse Gas emissions; Traffic gas pollutants; Transport CO2 emissions; Transport Gee emissions; Use of less polluting and older vehicle; Vehicle emissions; Vehicle environmental emissions causing pollution |
| AG2 | Water; Water pollution; Water pollution control |
| AG3 | Dangerous waste; Discarded hazardous waste; Metal waste; Quantity of used oil discarded annually; Transport related to transportation and related recovery rates; Volatile organic compound emissions (VOA); |
| AG4 | (%) Reduction of sound emissions caused by traffic; Comparative noise quality; Cost of sound pollution in traffic; Effective vehicle noise pollution; Noise; Noise level; Noise of traffic; Noise pollution; Noise pollution control; Population exposed to transport noise; Population exposed to transport noise 65 dB; Satisfaction with noise level (%); Sound; Sound impacts; Sound pollution level (DB); Vibration; |
| AH | Afternoon; Flaws; Morning Punctuality; Number of minutes between bus scheduled; Punctuality; Punctuality rate of charging trains in operation; Punctuality rate of passenger trains in operation; Punctuality/reliability of public transport (by location); Shipments on time |
| AI | Cultural preservation; Preservation of cultural resources and traditions; Prevention of cultural barriers; Promote cultural diversity in the workplace; Transportation culture |
| AJ | Contribute to community health and education programs; Donation to educational and community health services; Support Community Projects; Support for primary education in communities; |
| Al | Biodiversity Protection; Eco-consuction and monitoring of driving speed practices; Environmental performance and monitoring practices; Environmental Protection; Habitat preservation; Open space preservation; |
| AM | Air quality; Air quality in the city (PM 10); Habitability; Macroeconomic well-being; Quality and accessibility of transport to disadvantaged groups; Quality of life; Transportation quality for disadvantaged people |
| AN | Ability and knowledge growth; Average training hours per year per employee; Behavior and Language of Bus Colleagues; Behavior and Language of Office Staff; Behavior and Language of the attendant; Continues to learn, developing and improving; Cordiality; Development of the workforce; Driver’s Behavioral and Ligering; Driving skills; Percentage of drivers who received eco -driving training during the previous two years; Quality of the human being of organizations resource; Regular training in traffic management and direction; Safe driving; |
| AO | By vehicle/mode/object not recyclable/ratio of recyclable materials; Collection points; End -of -Life Vehicle Reclication; Percentage of infrastructure recyclable materials; Recycling of used tires; Recycling of vehicles/parts of life vehicles (No. of recycled vehicles as % of lifetime fleet); Scrap of batteries used by vehicles annually; Use of recyclable packaging; |
| AP | A driving speed limit (SS134); Contract termination clauses; Contribution to RSE activities; Data protection; Fair Code of Conduct; Fines for illegal parking, speeding, giving priority to cyclist, pedestrians, etc.; Follow the government safety rules of the government; Follow the legislation of fuels friendly with the environment and other legislation; Follow the rules of government driving; For safety measurement purposes; Health and Safety Legislation; Night driving hours restrictions; Number of violations per type and location; Occupational Health and Safety Certification; Punctual payment of the salary; Regulation; Rule and regulation firm about not drinking and driving |
| AQ1 | Bus and subway user evaluation; Comfort; Comfort and pleasure; Comfort of residents; Comparative time index outside the vehicle; Comparative User Comparison Index; Improve the quality of infrastructure offered for walks; Improve the quality of the public transport system; Improve the quality offered of the cycling infrastructure; Internet availability; NMT Quality (not motorized); Office seats offered (SKO); Place to sit on the bus; PT Comfort; Public transport comfort; Quality; Quality and reliability of public transportation; Quality of pedestrian routes, crossings, etc.; Quality of Public Transport (QPT); Quality of public transportation; Quality of rail service; Resident preferences; service level; Service quality; Sustainability Evaluation; Transport Evaluation; Transport quality for disadvantaged groups; Transport quality for disadvantaged people people (disabled, low income, children, no driver, etc.); Travel without noise and quiet; Vehicle Quality/Public Transportation Station (heating/air conditioning, cleaning, overcrowding/image, etc.); |
| AQ2 | Ensure delivery reliability for each shipment; Mutual confidence among all other goods transport services providers; PT reliability; Reliability; |
| AQ3 | Additional facilities provided; Citizens’ satisfaction and variety and quality of transportation options (on foot, cycling, rides sharing and public transport).; Customer satisfaction; Ease of travel with school backpack; Excel with customer satisfaction; Residents’ satisfaction (research); Responses to Consumer Demand; Satisfaction; Satisfaction with public transport (%); Satisfaction with the financial situation of the household aggregate of respondents (%); Satisfaction with the state of the streets and buildings (%); User Satisfaction; |
| AR | Cases of chronic respiratory diseases by vehicle pollution; Effects on air pollutant mortality; Health; Health and Safety Practices; "Health aspects; "; Health danger; Health Impacts; Human health; Human Health Based on the Exhaustion of the Issue Vehicle (HHVEE) **; Hygiene; Impacts on Human Health; Load of diseases related to traffic systems; Number of health -related premature deaths caused by the negative impact of the transport of goods; Occupational Health and Safety (OHAS); Pollutant exposure; Population exposed to related emissions transit; Regular check-up of drivers’ health; Stress caused by heavy traffic and traffic jam; WORKERS HEALTH AND SAFETY |
| AS | Assault Prevention (Crime) to the traveler; Assault protection; Comparative User Safety Index; Energy security; Hazard Prevention; Human security; Human security in public transportation; Occupational Security (OHAS); Percentage of those who consider public transport insecure; Petroleum Safety; Product Food Security; Promotion of Public Security; Protection against all weather; PT security; Public security; Risk and danger; Road security and vulnerable users; Safe trip; Safety and protection; Safety and protection in transport and traffic; Safety and protectionAFETY AND PROTECTION; SAFETY OF THE OPERATION; Security; Security in the city (%); Traffic Safety; Transport User Safety; Women’s Traffic Safety; Workers Safety; |
| AT1 | Average operational speed; Average passenger travel time; Average PT Speed; Average speed of private vehicles; Average time; Average travel duration; Average travel time; Average travel time to work; Average user displacement time and transport cost to users, reflecting costs for the public power by user; Average vehicle speed; Comparative Time Index in the vehicle; Displacement Time (com); Minimum average travel time to reach the main closest services for public transport and on foot; Reduction of time between certain pairs; Reduction of time between specific peers; Time of travel; Time to arrive at the next Public Transportation Parade (TPTS); Transfer time; Travel duration; Travel time; Travel time index |
| AT2 | Average daily distances traveled/average number of daily travel (personal/per domestic); Average user distance; Average user travel distance; Distance per capita daily travel for motorized transportation; Kilometers of vehicles traveled; Number of trips or km traveled; Travel distance propability; Travelled distance; |
| AU | Average traffic flow during peak hours (Aut./H); Average velocity in the peak of traffic flow (km/h); Congested traffic; Congestion; Congestion and delays; Congestion level; Congestion level in the city according to the TomTom index for the main hubs of the Tent network; Congestion levels and road traffic; Load trains circulation speed; Motorized traffic volume; percentage of daily traffic under congestion conditions; Portion of streets with measures of traffic calm; Traffic calm zones; Traffic flow modeling based on the analysis of the road situation; Trugs transit in pico time |
| AV | Change in land use by transport infrastructure; Degree of mixture/segregation of land use (gini index); Density of the railway network; Dirt; Earth Use (Lu); Ecological impacts of the right of passage; Efficient soil use for terminal construction; Impact of land use; Land area consumed by the public transport facilities; Land area consumed by traffic premises M2; Land consumption; Land occupation by transport infrastructure mode; Land use density (people and jobs per land unit); Land Use Objectives; Land used in transport corridors; Mix of land use; Pavement of land for transport facilities; Per capita waterproof surface area; Soil consumption for infrastructure and transport facilities; Soil use and development; Soil use density; Soil use in transport corridors; Soil use in transport infrastructure; Space consumed by transport infrastructure (roads, parking) by type of land use (residential/commercial); Terr consumption for transport; Terr taking by transport; Terrestrial consumption for infrastructure transport (roads, parking, etc.); The terrestrial consumption of transport infrastructures; Transport land use; Urban land use rate; Urbanism and soil use |
| AW | Added value; Added value of the transportation sector; Gross added value |
| AX | Car property level; Number of per capita personal cars; Number of Private Vehicles; Number of registered vehicles; Private car possession; Private car property; |
| AY1 | Economic viability; Technical viability; Viability |
| AY2 | Dividends; Gains and Financial Losses; Gross income; Income, Economic Activity - GDP Per capita; Medium Employee Gains; Public transport by GDP revenue; Public Transport Revenue; Railway company revenue; Recipe recipes and sources; Revenue; Revenue generated by transportation system operators; Revenue generated from transportation; Total recipe per km; Traffic System Operators Revenue; Transport System operators’ income |
| AY3 | Economic productivity; Passenger and cargo turnover; Productivity; Productivity Losses; Productivity of public transport modes; Productivity of traffic system operators; |
References
- Yang, R.; Liu, Y.; Liu, Y.; Liu, H.; Gan, W. Comprehensive Public Transport Service Accessibility Index—A New Approach Based on Degree Centrality and Gravity Model. Sustainability 2019, 11, 5634. [Google Scholar] [CrossRef]
- Sakib, N.; Appiotti, F.; Magni, F.; Maragno, D.; Innocenti, A.; Gissi, E.; Musco, F. Addressing the Passenger Transport and Accessibility Enablers for Sustainable Development. Sustainability 2018, 10, 903. [Google Scholar] [CrossRef]
- Badassa, B.B.; Sun, B.; Qiao, L. Sustainable Transport Infrastructure and Economic Returns: A Bibliometric and Visualization Analysis. Sustainability 2020, 12, 2033. [Google Scholar] [CrossRef]
- Zhao, X.; Ke, Y.; Zuo, J.; Xiong, W.; Wu, P. Evaluation of sustainable transport research in 2000–2019. J. Clean. Prod. 2020, 256, 120404. [Google Scholar] [CrossRef]
- Rechkoska, G.; Rechkoski, R.; Georgioska, M. Transport of Dangerous Substances in the Republic of Macedonia. Procedia Soc. Behav. Sci. 2012, 44, 289–300. [Google Scholar] [CrossRef][Green Version]
- Zope, R.; Vasudevan, N.; Arkatkar, S.S.; Joshi, G. Benchmarking: A tool for evaluation and monitoring sustainability of urban transport system in metropolitan cities of India. Sustain. Cities Soc. 2019, 45, 48–58. [Google Scholar] [CrossRef]
- Menendez, M.; Ambühl, L. Implementing Design and Operational Measures for Sustainable Mobility: Lessons from Zurich. Sustainability 2022, 14, 625. [Google Scholar] [CrossRef]
- Abam, F.I.; Ekwe, E.B.; Diemuodeke, O.E.; Ofem, M.I.; Okon, B.B.; Kadurumba, C.H.; Archibong-Eso, A.; Effiom, S.O.; Egbe, J.G.; Ukueje, W.E. Environmental sustainability of the Nigeria transport sector through decomposition and decoupling analysis with future framework for sustainable transport pathways. Energy Rep. 2021, 7, 3238–3248. [Google Scholar] [CrossRef]
- Ali, N. Evaluating sustainable urban transport systems: A Review study for the identification of smart mobility indicators. Trans. Transp. Sci. 2021, 12, 16–23. [Google Scholar] [CrossRef]
- Sdoukopoulos, A.; Pitsiava-Latinopoulou, M.; Basbas, S.; Papaioannou, P. Measuring progress towards transport sustainability through indicators: Analysis and metrics of the main indicator initiatives. Transp. Res. Part D Transp. Environ. 2019, 67, 316–333. [Google Scholar] [CrossRef]
- Rao, S.-H. A hybrid MCDM model based on DEMATEL and ANP for improving the measurement of corporate sustainability indicators: A study of Taiwan High Speed Rail. Res. Transp. Bus. Manag. 2021, 41, 100657. [Google Scholar] [CrossRef]
- Richardson, B.C. Toward a Policy on a Sustainable Transportation System. Transp. Res. Rec. J. Transp. Res. Board 1999, 1670, 27–34. [Google Scholar] [CrossRef]
- World Commission on Environment and Development. Sustainable transportation: A US perspective. In Our Common Future; World Commission on Environment and Development: Geneva, Switzerland, 1987; Volume 17, pp. 1–91. [Google Scholar]
- Macedo, J.; Rodrigues, F.; Tavares, F. Urban sustainability mobility assessment: Indicators proposal. Energy Procedia 2017, 134, 731–740. [Google Scholar] [CrossRef]
- Medlol, S.G.; Alwash, A.A.A. Economic, Social, and Environmental Sustainable Operation of Roadways within the Central Business District (CBD) sector at Hilla City Incorporated with Public Transport. In IOP Conference Series: Materials Science and Engineering; IOP Publishing: Bristol, UK, 2020; Volume 928, p. 022100. [Google Scholar] [CrossRef]
- Greene, D.L. Sustainable Transportation. In International Encyclopedia of the Social & Behavioral Sciences; Elsevier: Amsterdam, The Netherlands, 2015; pp. 845–849. [Google Scholar] [CrossRef]
- Junior, I.C.L.; de Souza, J.G.D.N.; Guabiroba, R.C.D.S.; Guimarães, V.D.A.; Motta, G.D.S. Probabilistic evaluation of truck transport performance based on ecoefficiency measures in Brazil. Res. Transp. Bus. Manag. 2021, 46, 100741. [Google Scholar] [CrossRef]
- Bojković, N.; Anić, I.; Pejčić-Tarle, S. One solution for cross-country transport-sustainability evaluation using a modified ELECTRE method. Ecol. Econ. 2010, 69, 1176–1186. [Google Scholar] [CrossRef]
- Illahi, U.; Mir, M.S. Sustainable Transportation Attainment Index: Multivariate analysis of indicators with an application to selected states and National Capital Territory (NCT) of India. Environ. Dev. Sustain. 2021, 23, 3578–3622. [Google Scholar] [CrossRef]
- Maity, G.; Roy, S.K.; Verdegay, J.L. Analyzing multimodal transportation problem and its application to artificial intelligence. Neural Comput. Appl. 2020, 32, 2243–2256. [Google Scholar] [CrossRef]
- Marsden, G.; Rye, T. The governance of transport and climate change. J. Transp. Geogr. 2010, 18, 669–678. [Google Scholar] [CrossRef]
- Lopez-Carreiro, I.; Monzon, A. Evaluating sustainability and innovation of mobility patterns in Spanish cities. Analysis by size and urban typology. Sustain. Cities Soc. 2018, 38, 684–696. [Google Scholar] [CrossRef]
- Joumard, R.; Gudmundsson, H.; Folkeson, L. Framework for Assessing Indicators of Environmental Impacts in the Transport Sector. Transp. Res. Rec. J. Transp. Res. Board 2011, 2242, 55–63. [Google Scholar] [CrossRef]
- Häkkinen, T. Trends and Indicators for Monitoring the EU Thematic Strategy on Sustainable Development of Urban Environment; Final Report; Summary and Recommendations; European Commission: Brussels, Belgium, 2007. [Google Scholar]
- Santos, A.S.; Ribeiro, S.K. The role of transport indicators to the improvement of local governance in Rio de Janeiro City: A contribution for the debate on sustainable future. Case Stud. Transp. Policy 2015, 3, 415–420. [Google Scholar] [CrossRef]
- Bachok, S.; Ponrahono, Z.; Osman, M.M.; Jaafar, S.; Ibrahim, M.; Mohamed, M. Apreliminary Study of Sustainable Transport Indicators in Malaysia: The Case Study of Klang Valley Public Transportation. Procedia Environ. Sci. 2015, 28, 464–473. [Google Scholar] [CrossRef]
- Munira, S.; Santoso, D.S. Examining public perception over outcome indicators of sustainable urban transport in Dhaka city. Case Stud. Transp. Policy 2017, 5, 169–178. [Google Scholar] [CrossRef]
- Regmi, M.B. Measuring sustainability of urban mobility: A pilot study of Asian cities. Case Stud. Transp. Policy 2020, 8, 1224–1232. [Google Scholar] [CrossRef]
- Fidelis, R.; Guerreiro, E.D.R.; Horst, D.J.; Ramos, G.M.; de Oliveira, B.R.; Junior, P.P.d.A. Municipal solid waste management with recyclable potential in developing countries: Current scenario and future perspectives. Waste Manag. Res. J. Sustain. Circ. Econ. 2023. [Google Scholar] [CrossRef] [PubMed]
- Souza, M.T.D.; Silva, M.D.D.; Carvalho, R.D. Revisão integrativa: O que é e como fazer. Einstein 2010, 8, 102–106. [Google Scholar] [CrossRef] [PubMed]
- Jabbour, C.J.C. Environmental training in organisations: From a literature review to a framework for future research. Resour. Conserv. Recycl. 2013, 74, 144–155. [Google Scholar] [CrossRef]
- Luiz, J.V.R.; Jugend, D.; Jabbour, C.J.C.; Luiz, O.R.; de Souza, F.B. Ecodesign field of research throughout the world: Mapping the territory by using an evolutionary lens. Scientometrics 2016, 109, 241–259. [Google Scholar] [CrossRef]
- Amui, L.B.L.; Jabbour, C.J.C.; de Sousa Jabbour, A.B.L.; Kannan, D. Sustainability as a dynamic organizational capability: A systematic review and a future agenda toward a sustainable transition. J. Clean. Prod. 2017, 142, 308–322. [Google Scholar] [CrossRef]
- ElHaffar, G.; Durif, F.; Dubé, L. Towards closing the attitude-intention-behavior gap in green consumption: A narrative review of the literature and an overview of future research directions. J. Clean. Prod. 2020, 275, 122556. [Google Scholar] [CrossRef]
- Junior, M.L.; Filho, M.G. Variations of the kanban system: Literature review and classification. Int. J. Prod. Econ. 2010, 125, 13–21. [Google Scholar] [CrossRef]
- Newman, P.; Kenworthy, J. Sustainability and Cities: Overcoming Automobile Dependence; Island Press: Washington, DC, USA, 1999. [Google Scholar]
- Rajak, S.; Parthiban, P.; Dhanalakshmi, R. Sustainable transportation systems performance evaluation using fuzzy logic. Ecol. Indic. 2016, 71, 503–513. [Google Scholar] [CrossRef]
- Tafidis, P.; Sdoukopoulos, A.; Pitsiava-Latinopoulou, M. Sustainable urban mobility indicators: Policy versus practice in the case of Greek cities. Transp. Res. Procedia 2017, 24, 304–312. [Google Scholar] [CrossRef]
- Kraus, L.; Proff, H. Sustainable Urban Transportation Criteria and Measurement—A Systematic Literature Review. Sustainability 2021, 13, 7113. [Google Scholar] [CrossRef]
- Nguyen, T.T.; Brunner, H.; Hirz, M. Towards a Holistic Sustainability Evaluation for Transport Alternatives. Eur. J. Sustain. Dev. 2020, 9, 1. [Google Scholar] [CrossRef]
- Haghshenas, H.; Vaziri, M. Urban sustainable transportation indicators for global comparison. Ecol. Indic. 2012, 15, 115–121. [Google Scholar] [CrossRef]
- Wey, W.-M.; Huang, J.-Y. Urban sustainable transportation planning strategies for livable City’s quality of life. Habitat Int. 2018, 82, 9–27. [Google Scholar] [CrossRef]
- Karjalainen, L.E.; Juhola, S. Urban transportation sustainability assessments: A systematic review of literature. Transp. Rev. 2021, 41, 659–684. [Google Scholar] [CrossRef]
- Gurjar, J.; Agarwal, P.; Jain, P. A Comprehensive Methodology for Comparative Performance Evaluation of Public Transport Systems in Urban Areas. Transp. Res. Procedia 2020, 48, 3508–3531. [Google Scholar] [CrossRef]
- Bandeira, R.A.; D’Agosto, M.A.; Ribeiro, S.K.; Bandeira, A.P.; Goes, G.V. A fuzzy multi-criteria model for evaluating sustainable urban freight transportation operations. J. Clean. Prod. 2018, 184, 727–739. [Google Scholar] [CrossRef]
- Smith, T.; Axon, C.; Darton, R. A methodology for measuring the sustainability of car transport systems. Transp. Policy 2013, 30, 308–317. [Google Scholar] [CrossRef]
- Chen, L.; Deng, X. A Modified Method for Evaluating Sustainable Transport Solutions Based on AHP and Dempster–Shafer Evidence Theory. Appl. Sci. 2018, 8, 563. [Google Scholar] [CrossRef]
- Pamucar, D.; Deveci, M.; Canıtez, F.; Paksoy, T.; Lukovac, V. A Novel Methodology for Prioritizing Zero-Carbon Measures for Sustainable Transport. Sustain. Prod. Consum. 2021, 27, 1093–1112. [Google Scholar] [CrossRef]
- Ribeiro, J.; Fontes, T.; Soares, C.; Borges, J.L. Accessibility as an indicator to estimate social exclusion in public transport. Transp. Res. Procedia 2021, 52, 740–747. [Google Scholar] [CrossRef]
- Wangai, A.; Kale, U.; Kinzhikeyev, S. An application of impact calculation method in transportation. Transport 2020, 35, 435–446. [Google Scholar] [CrossRef]
- Kiba-Janiak, M.; Thompson, R.; Cheba, K. An assessment tool of the formulation and implementation a sustainable integrated passenger and freight transport strategies. An example of selected European and Australian cities. Sustain. Cities Soc. 2021, 71, 102966. [Google Scholar] [CrossRef]
- Senne, C.M.; Lima, J.P.; Favaretto, F. An Index for the Sustainability of Integrated Urban Transport and Logistics: The Case Study of São Paulo. Sustainability 2021, 13, 12116. [Google Scholar] [CrossRef]
- Bhatnagar, A.; Gupta, A.; Joshi, A.; Bolia, N. An integrated framework for the improvement of school bus services: Understanding commuters’ perceptions for sustainable school bus transportation. Habitat Int. 2022, 126, 102602. [Google Scholar] [CrossRef]
- Kumar, A.; A, R. An MCDM framework for assessment of social sustainability indicators of the freight transport industry under uncertainty. A multi-company perspective. J. Enterp. Inf. Manag. 2020, 33, 1023–1058. [Google Scholar] [CrossRef]
- Patalas-Maliszewska, J.; Łosyk, H. Analysis of the Development and Parameters of a Public Transport System Which Uses Low-Carbon Energy: The Evidence from Poland. Energies 2020, 13, 5779. [Google Scholar] [CrossRef]
- Miller, P.; de Barros, A.G.; Kattan, L.; Wirasinghe, S. Analyzing the sustainability performance of public transit. Transp. Res. Part D Transp. Environ. 2016, 44, 177–198. [Google Scholar] [CrossRef]
- Rasca, S.; Major, J.H. Applicability of Existing Public Transport Sustainability Indicators to Norwegian Small Cities and Towns. In Proceedings of the 2021 Smart City Symposium Prague (SCSP), Prague, Czech Republic, 27–28 May 2021; pp. 1–6. [Google Scholar] [CrossRef]
- Shen, Y.; Bao, Q.; Hermans, E. Applying an Alternative Approach for Assessing Sustainable Road Transport: A Benchmarking Analysis on EU Countries. Sustainability 2020, 12, 10391. [Google Scholar] [CrossRef]
- Wang, D.D. Assessing road transport sustainability by combining environmental impacts and safety concerns. Transp. Res. Part D Transp. Environ. 2019, 77, 212–223. [Google Scholar] [CrossRef]
- de Campos, R.S.; Simon, A.T.; De Campos Martins, F. Assessing the impacts of road freight transport on sustainability: A case study in the sugar-energy sector. J. Clean. Prod. 2019, 220, 995–1004. [Google Scholar] [CrossRef]
- Ambarwati, L.; Verhaeghe, R.; van Arem, B.; Pel, A.J. Assessment of transport performance index for urban transport development strategies—Incorporating residents’ preferences. Environ. Impact Assess. Rev. 2017, 63, 107–115. [Google Scholar] [CrossRef]
- Illahi, U.; Mir, M.S. Assessment of transport sustainability using a hybrid approach: A comparison of four metropolitan cities of India. Case Stud. Transp. Policy 2021, 9, 703–714. [Google Scholar] [CrossRef]
- Labib, S.; Neema, M.N.; Rahaman, Z.; Patwary, S.H.; Shakil, S.H. Carbon dioxide emission and bio-capacity indexing for transportation activities: A methodological development in determining the sustainability of vehicular transportation systems. J. Environ. Manag. 2018, 223, 57–73. [Google Scholar] [CrossRef]
- Alonso, A.; Monzón, A.; Cascajo, R. Comparative analysis of passenger transport sustainability in European cities. Ecol. Indic. 2015, 48, 578–592. [Google Scholar] [CrossRef]
- Strulak-Wójcikiewicz, R.; Lemke, J. Concept of a Simulation Model for Assessing the Sustainable Development of Urban Transport. Transp. Res. Procedia 2019, 39, 502–513. [Google Scholar] [CrossRef]
- Buran, B.; Erçek, M. Convergence or Divergence among Business Models of Public Bus Transport Authorities across the Globe: A Fuzzy Approach. Sustainability 2021, 13, 10861. [Google Scholar] [CrossRef]
- Shiau, T.-A.; Liu, J.-S. Developing an indicator system for local governments to evaluate transport sustainability strategies. Ecol. Indic. 2013, 34, 361–371. [Google Scholar] [CrossRef]
- Illahi, U.; Mir, M.S. Development of indices for sustainability of transportation systems: A review of state-of-the-art. Ecol. Indic. 2020, 118, 106760. [Google Scholar] [CrossRef]
- Touratier-Muller, N.; Jaussaud, J. Development of Road Freight Transport Indicators Focused on Sustainability to Assist Shippers: An Analysis Conducted in France through the FRET 21 Programme. Sustainability 2021, 13, 9641. [Google Scholar] [CrossRef]
- Kumar, A.; Anbanandam, R. Development of social sustainability index for freight transportation system. J. Clean. Prod. 2019, 210, 77–92. [Google Scholar] [CrossRef]
- Sevtuk, A.; Amindarbari, R. Does metropolitan form affect transportation sustainability? Evidence from US metro-politan areas. Environ. Plan. B Urban Anal. City Sci. 2021, 48, 2385–2401. [Google Scholar] [CrossRef]
- Makarova, I.; Shubenkova, K.; Pashkevich, A. Efficiency assessment of measures to increase sustainability of the transport system. Transport 2021, 36, 123–133. [Google Scholar] [CrossRef]
- Suguiy, T.; de Carvalho, M.F.H.; Ferreira, P.A.V. Efficiency versus satisfaction in public transport: Practices in Brazilian cities. Case Stud. Transp. Policy 2020, 8, 938–945. [Google Scholar] [CrossRef]
- Castillo, H.; Pitfield, D.E. ELASTIC—A methodological framework for identifying and selecting sustainable transport indicators. Transp. Res. Part D Transp. Environ. 2010, 15, 179–188. [Google Scholar] [CrossRef]
- Makarova, I.; Pashkevich, A.; Shubenkova, K. Ensuring Sustainability of Public Transport System through Rational Management. Procedia Eng. 2017, 178, 137–146. [Google Scholar] [CrossRef]
- Kumar, A.; Anbanandam, R. Environmentally responsible freight transport service providers’ assessment under data-driven information uncertainty. J. Enterp. Inf. Manag. 2020, 34, 506–542. [Google Scholar] [CrossRef]
- Shiau, T.-A. Evaluating sustainable transport strategies with incomplete information for Taipei City. Transp. Res. Part D Transp. Environ. 2012, 17, 427–432. [Google Scholar] [CrossRef]
- Errampalli, M.; Patil, K.S.; Prasad, C. Evaluation of integration between public transportation modes by developing sustainability index for Indian cities. Case Stud. Transp. Policy 2018, 8, 180–187. [Google Scholar] [CrossRef]
- Kumar, R.; Mishra, R.K.; Chandra, S.; Hussain, A. Evaluation of urban transport-environment sustainable indicators during Odd–Even scheme in India. Environ. Dev. Sustain. 2021, 23, 17240–17262. [Google Scholar] [CrossRef]
- Toth-Szabo, Z.; Várhelyi, A. Indicator Framework for Measuring Sustainability of Transport in the City. Procedia Soc. Behav. Sci. 2012, 48, 2035–2047. [Google Scholar] [CrossRef]
- Chakhtoura, C.; Pojani, D. Indicator-based evaluation of sustainable transport plans: A framework for Paris and other large cities. Transp. Policy 2016, 50, 15–28. [Google Scholar] [CrossRef]
- Jahromi, H.N.; Talebian, A.; Isaai, M.T. Investigating Environmentally Sustainable Transport Based on DALY Weights and SIR Method. Int. J. Transp. Sci. Technol. 2012, 1, 275–285. [Google Scholar] [CrossRef]
- Reisi, M.; Aye, L.; Rajabifard, A.; Ngo, T. Land-use planning: Implications for transport sustainability. Land Use Policy 2016, 50, 252–261. [Google Scholar] [CrossRef]
- Hoque, N.; Biswas, W.; Mazhar, I.; Howard, I. Life Cycle Sustainability Assessment of Alternative Energy Sources for the Western Australian Transport Sector. Sustainability 2020, 12, 5565. [Google Scholar] [CrossRef]
- Tian, N.; Tang, S.; Che, A.; Wu, P. Measuring regional transport sustainability using super-efficiency SBM-DEA with weighting preference. J. Clean. Prod. 2020, 242, 118474. [Google Scholar] [CrossRef]
- Kolosz, B.; Grant-Muller, S.; Djemame, K. Modelling uncertainty in the sustainability of Intelligent Transport Systems for highways using probabilistic data fusion. Environ. Model. Softw. 2013, 49, 78–97. [Google Scholar] [CrossRef]
- Oses, U.; Rojí, E.; Cuadrado, J.; Larrauri, M. Multiple-Criteria Decision-Making Tool for Local Governments to Evaluate the Global and Local Sustainability of Transportation Systems in Urban Areas: Case Study. J. Urban Plan. Dev. 2018, 144, 04017019. [Google Scholar] [CrossRef]
- Abam, F.; Inah, O.; Effiom, S.; Ntunde, D.; Ugwu, H.; Ndukwu, M.; Samuel, O. Projection of sustainability indicators, emissions and improvement potential of the energy drivers in the Nigerian transport sector based on exergy procedure. Sci. Afr. 2022, 16, e01175. [Google Scholar] [CrossRef]
- dos Santos, J.B.; Lima, J.P. Quality of public transportation based on the multi-criteria approach and from the perspective of user’s satisfaction level: A case study in a Brazilian city. Case Stud. Transp. Policy 2021, 9, 1233–1244. [Google Scholar] [CrossRef]
- Ma, F.; Li, X.; Sun, Q.; Liu, F.; Wang, W.; Bai, L. Regional Differences and Spatial Aggregation of Sustainable Transport Efficiency: A Case Study of China. Sustainability 2018, 10, 2399. [Google Scholar] [CrossRef]
- Currie, G.; Truong, L.; De Gruyter, C. Regulatory structures and their impact on the sustainability performance of public transport in world cities. Res. Transp. Econ. 2018, 69, 494–500. [Google Scholar] [CrossRef]
- Alawaysheh, I.; Alsyouf, I.; Tahboub, Z.E.-A.; Almahasneh, H.S. Selecting maintenance practices based on environmental criteria: A comparative analysis of theory and practice in the public transport sector in UAE/DUBAI. Int. J. Syst. Assur. Eng. Manag. 2020, 11, 1133–1155. [Google Scholar] [CrossRef]
- Chen, Y.; Silva, E.A. Smart transport: A comparative analysis using the most used indicators in the literature juxtaposed with interventions in English metropolitan areas. Transp. Res. Interdiscip. Perspect. 2021, 10, 100371. [Google Scholar] [CrossRef]
- Stefaniec, A.; Hosseini, K.; Assani, S.; Hosseini, S.M.; Li, Y. Social sustainability of regional transportation: An assessment framework with application to EU road transport. Socio-Econ. Plan. Sci. 2021, 78, 101088. [Google Scholar] [CrossRef]
- Chen, Y.; Bouferguene, A.; Li, H.X.; Liu, H.; Shen, Y.; Al-Hussein, M. Spatial gaps in urban public transport supply and demand from the perspective of sustainability. J. Clean. Prod. 2018, 195, 1237–1248. [Google Scholar] [CrossRef]
- Persia, L.; Cipriani, E.; Sgarra, V.; Meta, E. Strategies and Measures for Sustainable Urban Transport Systems. Transp. Res. Procedia 2016, 14, 955–964. [Google Scholar] [CrossRef]
- Castaneda, J.; Cardona, J.F.; Martins, L.D.C.; Juan, A.A. Supervised Machine Learning Algorithms for Measuring and Promoting Sustainable Transportation and Green Logistics. Transp. Res. Procedia 2021, 58, 455–462. [Google Scholar] [CrossRef]
- Stefaniec, A.; Hosseini, K.; Xie, J.; Li, Y. Sustainability assessment of inland transportation in China: A triple bottom line-based network DEA approach. Transp. Res. Part D Transp. Environ. 2020, 80, 102258. [Google Scholar] [CrossRef]
- Ammenberg, J.; Dahlgren, S. Sustainability Assessment of Public Transport, Part I—A Multi-Criteria Assessment Method to Compare Different Bus Technologies. Sustainability 2021, 13, 825. [Google Scholar] [CrossRef]
- Dahlgren, S.; Ammenberg, J. Sustainability Assessment of Public Transport, Part II—Applying a Multi-Criteria Assessment Method to Compare Different Bus Technologies. Sustainability 2021, 13, 1273. [Google Scholar] [CrossRef]
- Jiang, J. Sustainable achievement efficiency of transport energy consumption based on indicator analysis. Comput. Intell. 2020, 37, 1268–1285. [Google Scholar] [CrossRef]
- Jain, D.; Tiwari, G. Sustainable mobility indicators for Indian cities: Selection methodology and application. Ecol. Indic. 2017, 79, 310–322. [Google Scholar] [CrossRef]
- Holden, E.; Linnerud, K.; Banister, D. Sustainable passenger transport: Back to Brundtland. Transp. Res. Part A Policy Pract. 2013, 54, 67–77. [Google Scholar] [CrossRef]
- Ogryzek, M.; Adamska-Kmieć, D.; Klimach, A. Sustainable Transport: An Efficient Transportation Network—Case Study. Sustainability 2020, 12, 8274. [Google Scholar] [CrossRef]
- Richardson, B.C. Sustainable transport: Analysis frameworks. J. Transp. Geogr. 2005, 13, 29–39. [Google Scholar] [CrossRef]
- Cheba, K.; Saniuk, S. Sustainable Urban Transport—The Concept of Measurement in the Field of City Logistics. Transp. Res. Procedia 2016, 16, 35–45. [Google Scholar] [CrossRef]
- Aloulou, F.; Ghannouchi, I. The impact of ownership and contractual practice on the technical efficiency level of the public transport operators: An international comparison. Res. Transp. Bus. Manag. 2021, 46, 100707. [Google Scholar] [CrossRef]
- Márquez-Ramos, L. The relationship between trade and sustainable transport: A quantitative assessment with indicators of the importance of environmental performance and agglomeration externalities. Ecol. Indic. 2015, 52, 170–183. [Google Scholar] [CrossRef]
- Santos, A.S.; Ribeiro, S.K. The use of sustainability indicators in urban passenger transport during the decision-making process: The case of Rio de Janeiro, Brazil. Curr. Opin. Environ. Sustain. 2013, 5, 251–260. [Google Scholar] [CrossRef]
- Reisi, M.; Aye, L.; Rajabifard, A.; Ngo, T. Transport sustainability index: Melbourne case study. Ecol. Indic. 2014, 43, 288–296. [Google Scholar] [CrossRef]
- Illahi, U. Transport Sustainability Performance Evaluation using a Multi-stage Multi-tool Hybrid Model. Eur. Transp. Eur. 2021, 81, 1–15. [Google Scholar] [CrossRef]
- Djekic, I.; Smigic, N.; Glavan, R.; Miocinovic, J.; Tomasevic, I. Transportation sustainability index in dairy industry—Fuzzy logic approach. J. Clean. Prod. 2018, 180, 107–115. [Google Scholar] [CrossRef]
- Rao, S.-H. Transportation synthetic sustainability indices: A case of Taiwan intercity railway transport. Ecol. Indic. 2021, 127, 107753. [Google Scholar] [CrossRef]
- Morfoulaki, M.; Papathanasiou, J. Use of the Sustainable Mobility Efficiency Index (SMEI) for Enhancing the Sustainable Urban Mobility in Greek Cities. Sustainability 2021, 13, 1709. [Google Scholar] [CrossRef]
- Zhang, Y.; Guindon, B. Using satellite remote sensing to survey transport-related urban sustainability: Part 1: Methodologies for indicator quantification. Int. J. Appl. Earth Obs. Geoinform. 2006, 8, 149–164. [Google Scholar] [CrossRef]
- Djordjević, B.; Mane, A.S.; Krmac, E. Analysis of dependency and importance of key indicators for railway sustainability monitoring: A new integrated approach with DEA and Pearson correlation. Res. Transp. Bus. Manag. 2021, 41, 100650. [Google Scholar] [CrossRef]
- Lakatos, A.; Mándoki, P. Analytical, Logit Model-based Examination of the Hungarian Regional Parallel Public Transport System. Promet Traffic Transp. 2020, 32, 361–369. [Google Scholar] [CrossRef]
- Fattah, A.; Morshed, S.R. Assessing the sustainability of transportation system in a developing city through estimating CO2 emissions and bio-capacity for vehicular activities. Transp. Res. Interdiscip. Perspect. 2021, 10, 100361. [Google Scholar] [CrossRef]
- Barfod, M.B. Supporting sustainable transport appraisals using stakeholder involvement and MCDA. Transport 2018, 33, 1052–1066. [Google Scholar] [CrossRef]
Disclaimer/Publisher’s Note: The statements, opinions and data contained in all publications are solely those of the individual author(s) and contributor(s) and not of MDPI and/or the editor(s). MDPI and/or the editor(s) disclaim responsibility for any injury to people or property resulting from any ideas, methods, instructions or products referred to in the content. |
© 2023 by the authors. Licensee MDPI, Basel, Switzerland. This article is an open access article distributed under the terms and conditions of the Creative Commons Attribution (CC BY) license (https://creativecommons.org/licenses/by/4.0/).