Abstract
A large amount of redundant energy gained from incident solar energy is dissipated into the environment in the form of low-grade heat, which significantly reduces and limits the performance of photovoltaic cells, so removing or storing redundant heat and converting it back into available thermal energy is a promising way to improve the utilization of solar energy. A new combined water-based solar photovoltaic-thermophotovoltaic system embedded in the phase change material (PCM) mainly is proposed and designed. The effects of the water flow rate, cell operating temperature, the presence of PCM, and the thickness of the PCM factor on the overall module performance are explored comprehensively. The maximum thermal power output and the corresponding efficiency of the combined-system-embedded PCM are calculated numerically, The results obtained are compared with those of the PV (photovoltaic) and PVT(photovoltaic-thermal) cells with the same solar operating conditions. In addition, the PVT-PCM system possesses a higher power output and overall efficiency in comparison with the PVT and PV system, and the maximum cell temperature reduction of 12.54 °C and 42.28 °C is observed compared with PVT and PV systems. Moreover, an increased average power of 1.13 W and 4.59 in PVT-PCM systems is obtained compared with the PVT system and the PV system. Numerical calculation results illustrate that the maximum power output density and efficiency of the PVT-PCM are 3.06% and 16.15% greater than those of a single PVT system and PV system in the working time range, respectively. The obtained findings show the effectiveness of using PCM to improve power output and overall efficiency.
1. Introduction
The burning of fossil fuels is one of the main contributors to global warming and climatic changes. Many countries with rich fossil resources highly depend on fossil fuels for the industrial sector, and the continuous increase in energy demand will likely increase fossil fuel consumption, resulting in a further increase in CO2 emissions [1]. Therefore, governments across the world have been taking initiatives to address this issue by encouraging the promotion and implementation of renewable energy (RE); renewable and alternative energy has great potential to replace the dependency on fossil fuels by reducing product costs and improving energy conversion efficiency [2].
Solar energy, as an eco-friendly excellent candidate and a continuous and stable renewable energy resource, has enormous under-utilized potential to reduce CO2 emissions and slow down the trend of global warming, which can significantly change local energy policy and energy structure and contribute to the low-carbon and carbon-neutral ambitions under the 2015 Paris Agreement [3].
A large amount of incident solar energy is dissipated into the environment in the form of low-grade heat during solar energy use, which greatly reduces the performance of PV cells [4]. At the same time, the heat buildup within conventional PV systems causes an increase in internal temperature within the cells, resulting in a drastic decrease in energy conversion efficiency. Only 5–25% of the solar radiation received by traditional solar photovoltaic panels is converted into electricity. The rest of the energy (75–95% of the solar radiation) would be stored as thermal energy in the photovoltaic cell, which results in a temperature increase and energy conversion efficiency decrease [5]. The solar conversion efficiency of PV modules decreases due to an increase in the internal charge carrier complex rate at high temperatures, which reduces system power output [6]. Solar energy accounts for only 0.5% of total primary energy demand, while the proportion of energy supplied by solar PV is only 0.04%, it is indicated that there is huge potential for improvement in solar PV technology and thermal use [7].
The heat collection module from PVT generates both electricity and thermal energy separately, eliminating the heat buildup issues that plague conventional PV systems. The heat gathered by the PV cells after absorbing solar radiation is the primary heat source of the collector system. As a result, the PV cell coverage of the PV module has a significant impact on the amount of light and heat. The PVT system can achieve a comprehensive light and heat efficiency of 68% and can effectively heat to water by optimizing the PV cell coverage, and it is a feasible way to improve the light and heat performance and practicality of the PVT system [8]. Kazem et al. summarized the effects of solar irradiance and ambient temperature on the electrical performance of water-based PVT systems [9]. The power of the PV panels is determined by the amount of solar irradiance, while the cooling water flow and temperature affect the power output characteristics of the PV panels [10]. Gaur et al. proposed a PV system model to investigate the performance of a commercial PV module and showed that the electrical efficiency of the system with and without water cooling is 7.36% and 6.85%, respectively [11]. Singh et al. conducted an experiment to compare the effect of the presence or absence of water flow on the temperature of PV panels. The PVT system was shown to have a lower temperature than conventional PV panels. The PV panel temperature decreased by 15.23% when the water mass flow rate was 0.0166 kg/s [12]. The efficiency of the PVT system at high mass flow rates is also worth considering when compared to low flow rates of water. When the water flow rate exceeds 0.15 kg/s, the temperature of the PV panel gradually decreases and the output power increases, whereas the mass flow rate follows an opposite trend for the temperature. Furthermore, the collector installation angle has little effect on the system’s electrical efficiency while having a significant impact on its thermal efficiency [13]. At low Reynolds numbers, the heat transfer coefficient increases with the depth of the cooling channels, which results in increasing the electrical and thermal efficiency of the system. However, at higher Reynolds numbers (Re1000), the channel depth has no significant effect on heat transfer efficiency [14]. Al-Waeli et al. propose four evaluation criteria for new hybrid PV/T collectors, each of which can be used to serve different PV/T configurations and designs for comparing the operating performance of different PV/T systems [15]. In winter, the performance of the dual-fluid PVT system was improved compared to the single-fluid PVT system, with a 20% increase in heat gain from the fluid mass and a 15.3% increase in total solar energy conversion, but a 0.2% loss in power output. In the summer, dual-fluid systems do not improve collector performance [16]. Three different materials, aluminum, copper, and TPT (Tedlar/PET/Tedlar), are used as heat-absorbing substrates for the PVT system. It was shown that the PVT system with TPT substrate has the lowest average temperature and higher photovoltaic efficiency, and the PVT system with copper as the substrate has the highest photothermal efficiency and COP(Coefficient Of Performance) [17].
Because solar energy is intermittent, there is a large gap between energy supply and demand in PVT systems, with plenty of heat available during the day but none at night. In addition to increasing energy efficiency, the use of PCM increases the timing and flexibility of heat supply to the PVT modules [18]. The melted PCM is used as a heat source to heat the water overnight until the next morning, resulting in a higher water temperature than in the absence of PCM [19]. However, the collector may cause overheating of the PCM after a long period of operation. A relatively low conditioning temperature of the cooling mass can enhance the heat exchange with the PCM, and the use of appropriate intermittent conditioning can significantly improve the conversion efficiency of the system to solar energy, where the PVT-PCM system with 45 °C indirect conditioning has a better performance compared to full-time conditioning [20]. Preet et al. investigated the output of three different PV systems, natural convection, water-based PVT, and water-based PVT-PCM, in terms of open circuit voltage (Voc) and short circuit current (Isc) at different operating flows [21]. When compared to the PV system, the PVT-PCM system reduces the temperature of the heat-absorbing panels and solar cells by 15 °C and 20 °C, respectively, resulting in a 21% increase in solar thermal efficiency. At the same time, the temperature of the heat-absorbing panels in the PVT-PCM system is lower than that of the PV panels, avoiding the impact of the heat-absorbing panels on the efficiency of the PV panels [22]. Yuan et al. investigate the performance of water-based PVT systems and PVT-PCM systems during the daytime and at nighttime. The experiments revealed that the use of PCM could improve the system’s photovoltaic efficiency by 1.7% during the daytime. Furthermore, the temperature of the PVT-PCM system is significantly higher at night in winter, whereas increasing the PCM thickness improved the anti-freeze function of the water-based PVT system [23]. Yang et al. found that sensible and latent heat can be stored in the PCM layer, and the PCM releases the absorbed heat energy into the water, maintaining the water temperature in the tank for a longer period of time by comparing the water temperature in the storage tank of PVT and PVT-PCM systems [24]. Modjinou found that PCM improves the performance of photovoltaic cells, and the thickness and density of the PCM can further improve the working performance of PVT systems [25].
The efficiency of the photovoltaic cells is primarily influenced by factors such as solar radiation intensity, photovoltaic cell temperature, and the cell’s own material properties. According to the literature above, water-based PVT collectors have been investigated in terms of various structures and operating parameters. The research aims to 1. Explore the daily energy performance (choosing from a typical day condition) of the plate-and-tube water-based PVC collectors; 2. Study the use/adoption of thermal energy storage technology by PCM to improve the overall energy conversion utilization efficiency.
However, the performance comparison of PV, PVT, and PVT-PCM under the same conditions and the applicability of the water-based PVT-PCM system have not been investigated extensively. Therefore, in this study, Firstly, the water-based PVT-PCM collector is designed with an air layer between the photovoltaic cells and the glass cover plate to reduce the system’s heat loss, optimize the structure and minimize the negative impact of temperature on photovoltaic cells by using a plate-and-tube. Secondly, PCM is selected and integrated into the water-based PVT collector to further improve the heat transfer inside the collector and enhance the overall efficiency of the system. Finally, based on the water-based plate-and-tube PVT-PCM collector, a simulation study was conducted to compare the photovoltaic panel temperature and photothermal performance of PV/T-PCM, PV/T, and PV systems under different conditions, and the influence of water flow rate, presence of PCM and different PCM layer thicknesses on the collector’s performance is also evaluated.
2. Model and Condition Setting
2.1. Model Setting
A physical model of the water-cooled PVT-PCM system was developed based on the energy conservation between the different components of the water-cooled PVT-PCM collector. As shown in Figure 1, the late-model plate-and-tube in water-based PVT-PCM collectors was designed and optimized. The design parameters for the collectors are given in Table 1. The PCM parameters used for the simulation are shown in Table 2 [26].
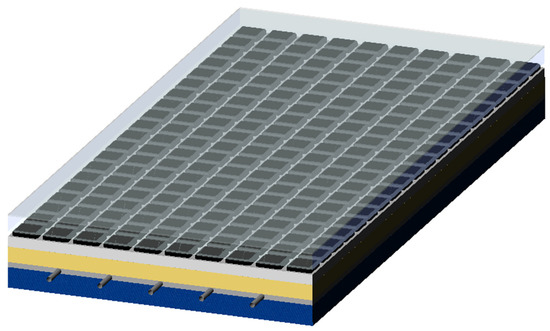
Figure 1.
Schematic diagram of the water-cooled PVT-PCM system.

Table 1.
Design parameters for collectors.
Table 2.
Thermal properties of PCM [27,28].
2.2. Ma
The solar heat is divided into two components by the addition of PCM: water and PCM heat gain. The cross-section of the collector system is shown in Figure 2. The heat transfer process both inside and outside the system is shown in Figure 3. The following assumptions are made in this paper to establish the corresponding numerical model and ensure the accuracy of the simulation results: (1) The system as a whole is operating in a stable environment. (2) Internal heat conduction and temperature distribution are considered to be uniform, and temperature variations along the thickness direction can be ignored due to the small thickness of the glass cover, photovoltaic module, and heat-absorbing plate. (3) The temperature difference between system components is negligible, and internal radiative heat transfer can be also ignored.
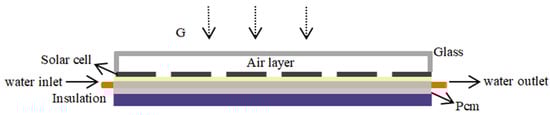
Figure 2.
Cross-sectional view of water-cooled PVT-PCM system.
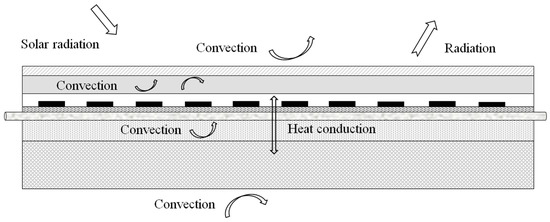
Figure 3.
Schematic diagram of the PVT-PCM system heat exchange.
2.3. Mathematical Models
2.3.1. Glass Cover
Convective and radiant heat transfers occur between the glass cover and the atmosphere, the radiant heat exchange occurs within the photovoltaic panels, and the convective heat exchange occurs between the air inter-layer and the photovoltaic panels.
The total heat transfer coefficient between the glass cover and the atmosphere is expressed as Equation (2) [29].
Ts is the effective sky temperature and is expressed as Equation (3) [30].
The convective heat transfer coefficient between the upper side of the glass cover and the environment as a function of the ambient wind speed is given by the empirical Equation (4) [31].
The radiative heat transfer coefficient between the glass cover and the PV panel is expressed as Equation (5).
The convective heat transfer coefficient of the air layer between the glass cover and the photovoltaic panel is expressed as Equation (6) [29].
The physical parameters of the system components are shown in Table 3.
Table 3.
Parameters of photovoltaic modules [32,33].
2.3.2. Photovoltaic Cell
The photovoltaic panel absorbs the solar radiation through the glass cover and converts a portion of it into electrical energy, which is exchanged with the glass cover for radiation as well as convection heat exchange with the inter-layer air, and conductive heat exchange with the heat absorbing plate. The energy balance equation is shown in Equation (7).
The electrical conversion efficiency of the photovoltaic module is expressed as Equation (8) [34].
The thermal resistance of the thermal conductivity between the photovoltaic panel and the heat absorbing panel is expressed as Equation (9).
2.3.3. Heat Absorbing Panel
Heat transfer occurs between heat-absorbing panels and PV panels, as well as between the PCM and the cooling water pipes. The energy conversation equation is expressed as Equation (10).
2.3.4. Cooling Mass Pipes
The pipe conducts heat exchange with the heat absorbing plate and the PCM and convective heat exchange within the water in the pipe. The energy equation is shown in Equation (11).
The coefficient of convective heat transfer between the working mass within the tube and the tube wall is expressed as Equation (12).
The heat transfer coefficients between the pipe and the heat absorbing plate and the PCM are expressed as Equations (13) and (14) [29].
Convective heat exchange takes place between the working fluid and the tube wall. The energy equation is expressed as Equation (15).
2.3.5. PCM Layer
During the process of phase change melting and solidification, heat transfer between PCM and adjacent layers mainly occurs in the form of conduction. Even if there is strong convective heat transfer, it is still not significant compared to heat conduction. The convective heat transfer effect at the solid–liquid interface can be ignored [35].
If Qpcm < Qsol,
If Qsol < Qpcm < Qliq,
If Qliq < Qpcm,
where, Qpcm: real-time heat flux inside the PCM layer, J; Qsol, Qliq: the heat flux inside the PCM layer at the beginning of the phase transition and at the end of the phase transition, J, respectively; Tpcm: real-time temperature of the PCM layer, K; Tmt: phase transition temperature of the PCM, K.
The mass, momentum, and energy conservation equations in the heat transfer process of PCM are described as shown in Equations (20)–(22) [36], respectively.
where, ρ, μ, λ: density, thermal conductivity and dynamic viscosity of PCM; T, p, u: temperature, pressure, and velocity; F: the body force;
The enthalpy-based method considers both temperature and enthalpy as variables to be solved and does not require separate calculations for the solid-liquid two-phase region. The advantage of the enthalpy-based method is that it is more computationally convenient and suitable for computing multi-dimensional cases. The energy equation for the enthalpy-based model is shown in Equation (23).
where, Tn+Δt: real-time temperature of PCM; hsl and fliq are the latent heat and liquid region.
The relationship between temperature and enthalpy is given by Equation (24),
The relationship between the enthalpy and the liquid phase fraction can be described by [37]:
where, Hs and Hl are the solid and liquid enthalpy. The temperature and liquid phase fraction for each new time step can be obtained directly without re-iterations, improving the computational efficiency. In this study, the enthalpy-based method is used to numerically simulate the PCM phase change heat transfer process in the melting and solidification model.
2.3.6. Insulation Layer
The energy equation for the insulation layer can be expressed as Equation (26).
2.3.7. Performance Evaluation Methods
The heat gained through the collector is represented by the heat gain from the water after passing through the pipes and the heat gain from the PCM, which can be expressed by Equation (27).
The electrical power of the photovoltaic module is expressed by Equation (28).
Thermal efficiency, electrical efficiency, and overall efficiency are used as the criteria to evaluate the performance of PV solar thermal systems, which can be expressed by the following Equations (29)–(31), respectively [38]. The total efficiency of photovoltaic and solar thermal systems is calculated by using a power conversion factor due to the high electrical energy grade.
2.4. Numerical Simulation
ANSYS16.0 software was used for numerical simulation, and the flowchart of the simulation procedure is shown in Figure 4. The simulation process first involves building a geometric model and performing structured meshing. Since the system is mostly composed of hexahedral structures, structured meshing provides more precise solving results and better handling of viscous flow problems. This study involves energy transfer, low Reynolds number weak turbulence flow, and phase change processes. Therefore, the Energy equation, RNGk-ε, and Solidification/Melting models were selected. Material parameters were set and loaded into the corresponding calculation domain. There is convective and radiative heat transfer between the glass cover plate and the environment, which is set as a mixed wall boundary condition. The insulation layer and the environment have convective heat transfer, and the radiative heat transfer effect can be ignored due to the small temperature difference between the two, set as a Convention boundary condition. The working medium is set with a velocity inlet and pressure outlet boundary condition. Part of the solar radiation received by the photovoltaic cells is converted into electrical energy, while the rest becomes an internal heat source that participates in subsequent heat exchange between components. The formula for calculating the internal heat source is shown in Equation (33). Since this article conducts dynamic simulation, the UDF (User-Defined Function) function is used to compile the meteorological parameters and the function of the photovoltaic panel’s internal heat source strength changing hourly into Fluent. The results of PCM energy, liquid phase rate, photovoltaic cells, and outlet water temperature are monitored. The pressure-based solver is used to calculate the model, and a second-order upwind scheme is chosen to solve the momentum and energy equations of the system. The pressure-velocity coupling is achieved through the PISO algorithm, and the time step is set to 10 s.
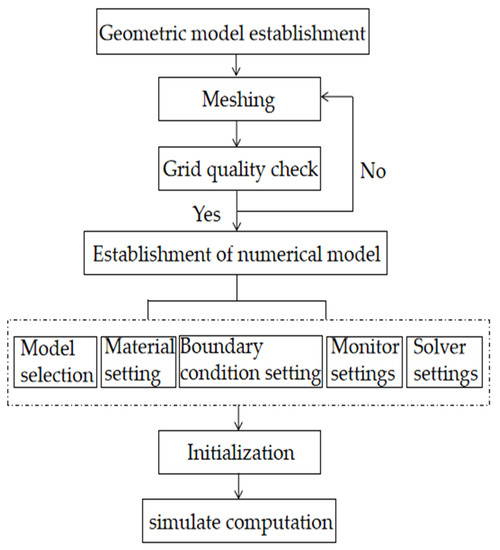
Figure 4.
Flowchart of simulation procedure.
2.5. Model Validation
Kong et al. [39] designed a PV/T system with PCM integration and conducted experimental research. To validate the reliability of the numerical model established in this paper, numerical calculations were performed under the same conditions as in the experiment(Table 4 and Figure 5). The PV panel temperature is the object of verification, and the average value of three temperature measurement points uniformly distributed on the back of the PV panel in the central axis is taken.
Table 4.
Parameter setting for photovoltaic modules and PCM [39].
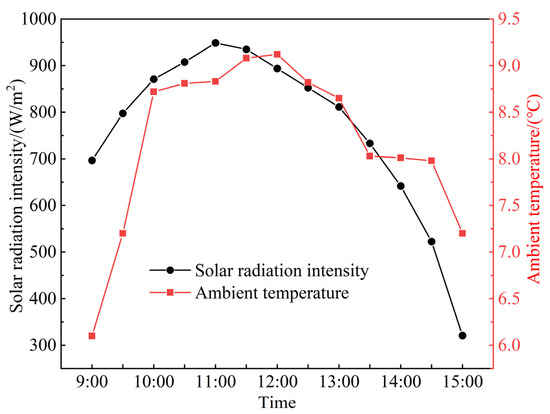
Figure 5.
Hourly variation of solar irradiance and ambient temperature in the simulation [39].
The experimental design and meteorological parameters are shown in Table 4 and Figure 5, respectively. Meteorological data were recorded from 9:00 to 15:30, during which the solar irradiance ranged from 93.9 W/m2 to 953.4 W/m2, and the wind speed ranged from 0.1 m/s to 2.9 m/s, with an average of 0.8 m/s. The experiment was conducted in November when the availability of sunlight was limited in the later part of the day. As a result, the experiment was conducted until around 3:00 pm to ensure that the system could work properly under the given conditions.
, : The simulated and experimental temperature values for the PV panels at different times are shown; r: a correlation coefficient.
The hourly variations of the error and the standard deviation of the error for the PV panel temperature from 9:30 to 15:00 are shown in Figure 6. The simulated PV panel temperature values are higher than the experimental values until 12:00 and lower after 13:00, which could be attributed to an increase in ground temperature and the effect of solar diffuse radiation during the experiment. The correlation coefficients of the curves are evaluated by using Equation (32) to compare the reliability of the simulated results. It is observed that the experimental and simulation results have a maximum error of 6.8% at 10:00 and a high correlation agreement with a correlation coefficient of r = 0.936, which indicates the high reliability and accuracy of the simulation results.
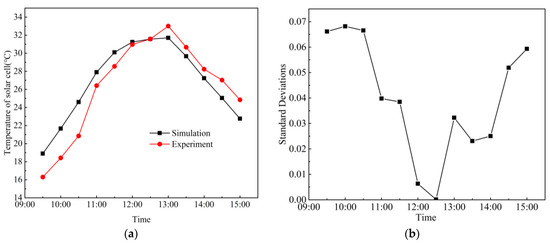
Figure 6.
Comparison of experimental and simulated values of PV panel temperatures and standard deviations. (a) Comparison of the PV panel temperatures; (b) Comparison of the standard deviations.
3. Simulation Results and Analysis
The variation of solar irradiance and ambient temperature during a typical summer day in the Lhasa area, which has a rich solar resource, is shown in Figure 7 [40]. It is found that the simulation results show that solar irradiance reached an all-day maximum of 976.59 W at 13:00 and the ambient temperature reached an all-day maximum of 20.7 °C at 15:00 from 8:00 to 18:00. The environmental wind speed is assumed to be a constant average value, and the inlet water temperature is assumed to be equal to the ambient temperature. The solar radiation is converted to an internal heat source for the PV panels by Equation (33) [41] compiled into Fluent in the form of UDF for ease of calculation. The various design parameters of the collector are shown in Table 1, Table 2 and Table 3. A series of simulation results including thermal-electric efficiency, photovoltaic cell temperature, and electrical power will be analyzed in detail.
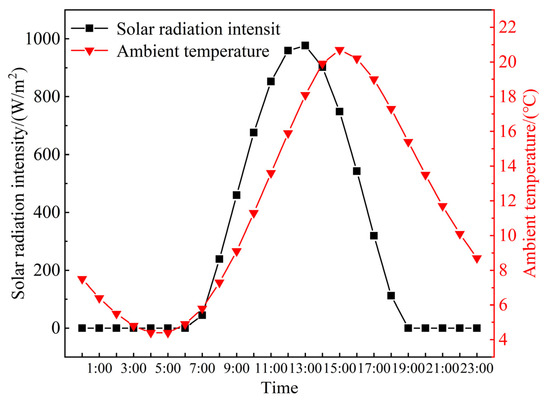
Figure 7.
Hourly variation of solar irradiance and ambient temperature in the simulation.
3.1. The Effect of Water Flow Rate on the Electrical Performance of PVT System
Figure 8 shows the hourly variations of PV panel temperature and the photoelectric efficiency at different water flow rates in the range from 0.004 to 0.1 m/s, with the operating hours from 8:00 am to 18:00. It is found that the temperatures of the PV panels gradually decrease and the photoelectric efficiency significantly increases with the increase in the water flow rate from 0.004 to 0.1 m/s. The influences of the water flow rates on the effectiveness and the temperature of PV panels are obvious in the range of the water flow rate from 0.004 to 0.1 m/s for the recorded time between 8:00–16:00. It is shown that when water flow rates increase from 0.004 to 0.1 m/s, the PV panel temperatures are respectively increased from 327.89 K to 297.92 K and the photoelectric efficiency is decreased from 12.1% to 10.1% at 13:30. Simultaneously, it is observed that the maximum temperature of PV panels occurs from 13:00 to 14:00, but the temperature of PV panels decreases rapidly once recorded time exceeds 14:00.
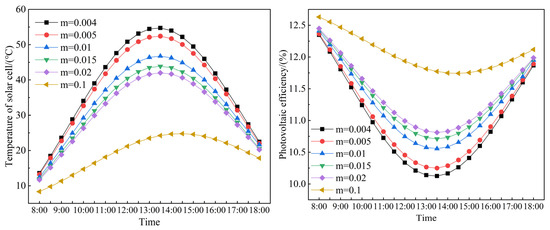
Figure 8.
Hourly variation of the solar cell temperature and the photovoltaic efficiency.
The simulation results indicate that continuously increasing the mass flow rate of cooling water can effectively improve the photoelectric efficiency and reduce the temperature of the solar cell because the excessive flow rate enhances the heat exchange efficiency within the photovoltaic panel and reduces the heat exchange time.
3.2. The Effect of Water Flow Rate on the Thermal Performance of PVT Systems
The hourly variation of the temperature difference between the water flow inlet and outlet is shown in Figure 9. The water temperature difference between the flow inlet and outlet is inversely proportional to the water flow rate and corresponds to the solar irradiance trend. It is observed that the temperature difference reaches a peak at 13:00 and then gradually deceases. Simultaneously, it is found that when the water mass rate is 0.004 kg/s, the maximum water difference between the flow inlet and outlet reaches 16.5 °C at 13:00, whereas when the water mass rate is 0.1 kg/s, the maximum water difference between the flow inlet and outlet is only 0.81 °C at 13:00. The simulation results indicate that the effect of increasing the water flow rate continuously on the inlet and outlet temperature difference is very significant.
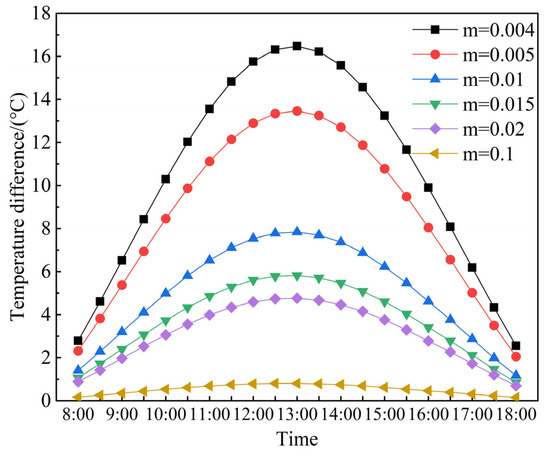
Figure 9.
Hourly variation in water temperature difference.
The photothermal efficiency of the water-based PV/T collectors is evaluated at the different water mass flow rates, depending on the various hours, as shown in Figure 10. It is found that the Photothermal efficiency of the water-based PVT-PCM collectors gradually increases with the increase in the mass flow rates from 0.004–0.01 kg/s and operating hours from 8:00 to 18:00 on a typical working day. However, once the mass flow rate exceeds 0.1 kg/s, the photothermal efficiency of the water-based PVT-PCM collectors will significantly decrease instead, so there is an optimal range for the mass flow rate, which is between 0.015–0.02. Simultaneously, it is observed that the photothermal efficiency maintains a steady increase with increasing solar intensity in the operating time range from 8:00–16:00. The influence of the water mass flow rate and operating times on the photothermal efficiency is obvious for the water-based PV/T collectors operated on a typical day. Therefore, there is a combined effect of mass flow and temperature difference on solar thermal efficiency, which has the best thermal effect when the water mass flow rate is 0.02 kg/s. The main reason for the increase in photothermal efficiency is that increasing the flow rate enhances internal heat transfer within the collector, however, when the flow rate is too high, the temperature rise of water decreases significantly due to the short heat transfer time, leading to a decrease in efficiency. Therefore, there exists an optimal operating flow rate with maximum efficiency.
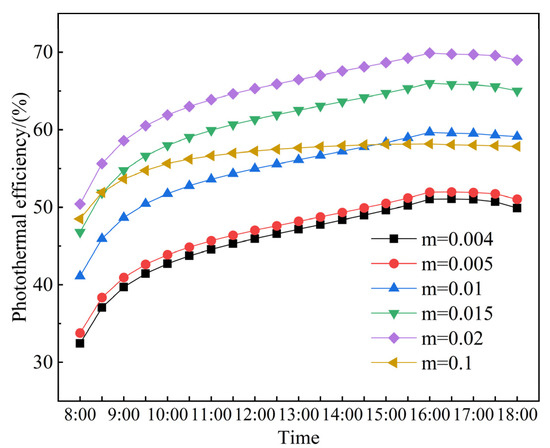
Figure 10.
Hourly variation of photothermal efficiency.
Figure 11 shows the variations of the thermal power at different mass flow rates, ranging from 0.004 to 0.1 kg/s, with the operating time between 8:00 and 18:00. It is found that the thermal power increases significantly with the increase in the operating time from 8:00 to 12:30. Simultaneously, it is observed that the thermal power decreases rapidly once the operating time exceeds 13:00, and the thermal power increases up to 398.94 W when the mass flow rates reach 0.02 kg/s but it drops sharply when the mass flow exceeds 0.02 kg/s. Figure 9 shows that increasing the water flow rate can improve the thermal power of the system, but the thermal power reaches a limit as the water flow rate increases.
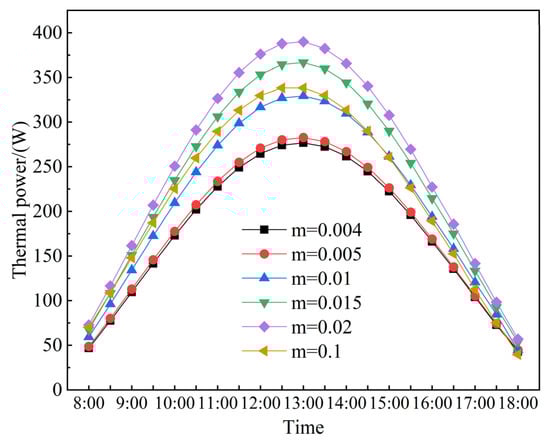
Figure 11.
Hourly variation of collector thermal power at different mass flow rates.
The influence of the water mass flow rate and solar irradiance on the effectiveness of the thermal power is obvious for the water-based PV/T collector in a range of water mass flow rates between 0.004–0.1kg/s. It is difficult to achieve a large water temperature rise with the same heat amount because of the large heat capacity and high flow rate of water. As a result, the temperature of the photovoltaic panels is well regulated under high water flow rate conditions, while the temperature rise of the cooling water is relatively small.
3.3. Effect of the Presence of PCM on the Performance of PVT Systems
The temperature of a solar cell and the photoelectric efficiency of the three systems (PV, PVT, and PVT-PCM) are compared under the hourly operating conditions shown in Figure 10. It is indicated that the temperature of solar cell rises and then declines, but the photoelectric efficiency declines and then rises for the three systems (PV, PVT, and PVT-PCM), due to constant absorption of heat from hourly sufficient irradiance resulting in increased temperature and decreased efficiency.
As shown in Figure 12, the solar cell temperature gradually increases as the operating hours gradually go up to 13:00, at which time, the PVT-PCM system has the largest difference in cell temperature compared to the PV/T and PV systems, decreasing by 26.7% and 55.4%, respectively. The photovoltaic efficiency gradually decreases as the operating hours gradually go up to 13:00, at which time, the difference in electrical output capacity is the largest, and the PVT-PCM system has the largest difference in photovoltaic efficiency compared to the PV/T and PV. The PVT-PCM system has a 3.06% and 16.15 increase in photovoltaic efficiency compared to the PV/T and PV systems, respectively. With the operating time after 15:00 gradually rising, the difference in the temperature of the solar cell and the photoelectric efficiency of the above three systems gradually decreases. After 17:00, the PV/T-PCM system PV panel temperature starts to be higher than the PV/T system due to the PCM phase change exotherm, and this heat is eventually used mainly to extend the heating of water. The main reason for the increase in thermal efficiency is that the temperature of the PVT-PCM system remains at the lowest level among the three operating systems, which is due to the fact that the sensible and latent heat absorption of the melting PCM and heat of the water takes away part of the heat within the PV plate.
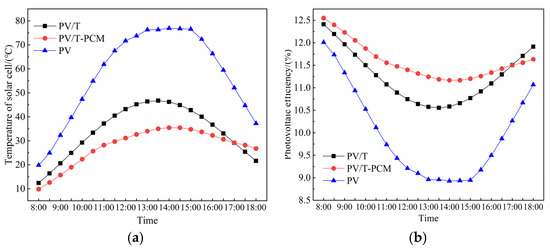
Figure 12.
Hourly variation of solar cell surface temperature and photoelectric efficiency. (a) Hourly variation of solar cell surface temperature; (b) Hourly variation of photoelectric efficiency.
The simulation results indicate that there is an important impact on reducing the temperature inside the shell and improving the efficiency of the system by using PCM materials inside solar panels.
Figure 13 shows the hourly variation of the electrical power. It is observed that the PVT-PCM system always has a higher electrical power output than the PVT and PV systems from 8:00 to 18:00, and the electrical power difference between them increases and then decreases, which is due to the variation of the solar irradiation intensity. The electrical power output of all three systems obtains its maximum value at 13:00 at 42.74 W, 40.19 W, and 34.06 W, respectively, while their power output difference also has its maximum value for the whole day at that time at 2.55 W and 8.68 W, respectively. Then, the difference between them decreases as the irradiance starts to decrease. The presence of PCM can, therefore, improve the effectiveness of the system’s electrical power output, especially at high irradiance levels. The average electrical power output for the three systems’ operating time periods is 28.59 W, 27.47 W, and 24.00 W, respectively, with a performance increase of 4.08% and 19.13% compared to PV/T and PV systems.
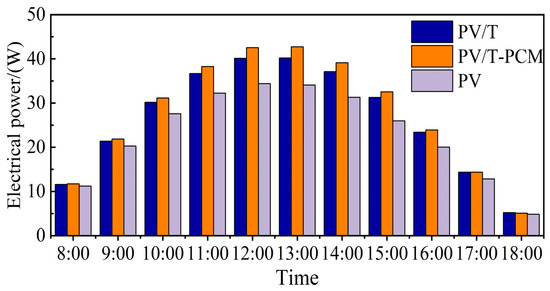
Figure 13.
Hourly variation of electrical power.
It is found that photoelectric efficiency gains obvious improvements and the temperature of solar cells significantly decreases with the application of PCM to the solar cell, which is due to the fact that absorbed heat from solar irradiance by melting PCM is in the form of latent heat and hence the temperature within the solar cell obviously decreases. Therefore, there is an obvious advantage to using PCM solar cells to reduce the temperature of the solar cell and improve photoelectric efficiency.
3.4. Effect of PCM Thickness
In order to derive the effect of PCM on system performance, the collector performance is calculated and analyzed for different PCM layer thicknesses “h”.
Figure 14 indicates the PV panel temperature and photovoltaic efficiency, with respect to the operating time between 8:00 to 18:00 and PCM thicknesses ranging from 0.02 to 0.04 m. It is observed that the temperature of solar energy decreases and the photovoltaic efficiency increases when the PCM thickness increasingly ranges from 0.02 to 0.03 m within the operating time, and then the temperature hardly increases and the photovoltaic efficiency decreases when the PCM thickness exceeds 0.03 m. While the thickness of the PCM had a negative effect on the effectiveness when exceeding 0.03 m.
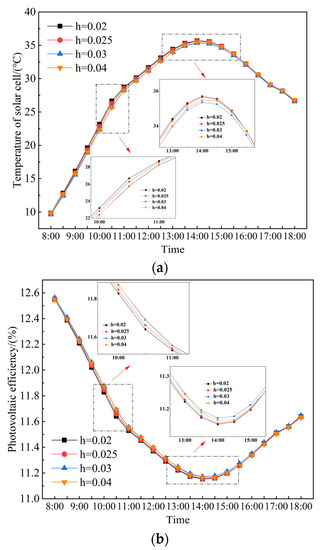
Figure 14.
Hourly variation of panel temperature and photovoltaic efficiency for different PCM thicknesses. (a) Hourly variation of panel temperature for different PCM thicknesses; (b) Hourly variation of photovoltaic efficiency for different PCM thicknesses.
As shown in Figure 14, the maximum temperature of the solar cell respectively decreased by 1.6%, 3.5%, and 3.6% as the thickness of the PCM gradually went up to 0.04m. The maximum photovoltaic efficiency respectively increased by 0.18%, 0.42%, and 0.44% and the photoelectric efficiency respectively increased by 0.05%, 0.18%, and 0.12% compared to the PCM thickness of 0.02 m based on the operating conditions.
Figure 15 indicates the photothermal efficiency, with respect to the operating time between 8:00 to 18:00 and PCM thicknesses ranging from 0.02 to 0.04 m. It is observed that photothermal efficiency increases in the operating time from 8:00 to 14:30, and then the photovoltaic efficiency hardly decreases when the operating time exceeds 14:30.
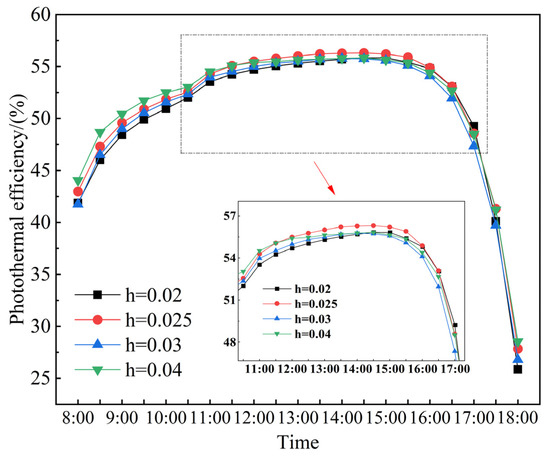
Figure 15.
Hourly variation in photothermal efficiency for different PCM thicknesses.
As shown in Figure 15, the maximum photothermal efficiency respectively increased by 5.8%, 2.9%, and 4.7% as the thickness of the PCM gradually went up to 0.04mm in the operating time from 8:00 to 11:30. The maximum photovoltaic efficiency respectively increased by 0.18%, 0.42%, and 0.44% and the photothermal efficiency respectively increased by 0.13% and decreased by 0.16% and 0.66% as the thickness of the PCM gradually went up to 0.04 m compared the PCM thickness of 0.02 m when the operating time exceeds 14:30.
It is found that photovoltaic efficiency and photothermal efficiency see a slight improvement, but the effect is not obvious as with the thickness of PCM, which is due to the fact that PV panel temperature by solar irradiance rises to the melting temperature of the PCM, the PCM absorbs heat in the form of latent heat, and gradually liquefies and maintains the temperature constant. Therefore, it is recommended that the thickness of the PCM should be kept between 0.02–0.03 m to effectively reduce the temperature of the solar cell and improve photoelectric efficiency.
Figure 16 shows the heat absorption rate of the PCM based on different thicknesses of PCM, with respect to the operating time between 8:00 to 18:00 and PCM thicknesses ranging from 0.02 to 0.04 m. It is observed that the heat absorption rate of different thicknesses of PCM slowly increases until 10:30, it sharply increases between 10:30 and 12:30, and starts to obviously decrease after 13:00, which is due to variable solar irradiance in the given operating time.
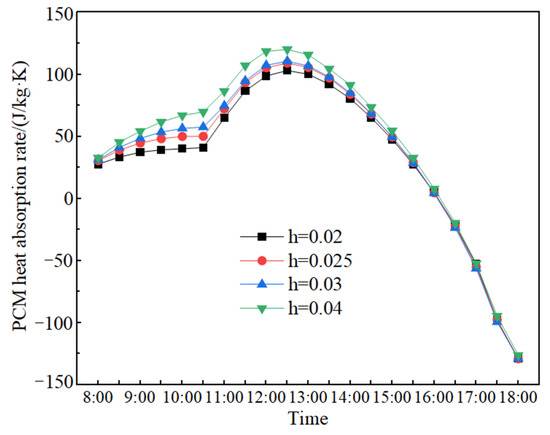
Figure 16.
Hourly variation of heat absorption rates for different thicknesses of PCM.
Figure 17 shows the liquid phase rate of different thicknesses of PCM, with respect to the operating time between 8:00 to 18:00 and PCM thicknesses ranging from 0.02 to 0.04 m. It is observed that the liquid phase rate of PCM is almost constant until 10:30, the heat absorption rate of PCM sharply increases between 10:30 and 16:00, and then the liquid phase rate of PCM starts to slowly decrease after 16:00, which is due to variable solar irradiance in the given operating time.
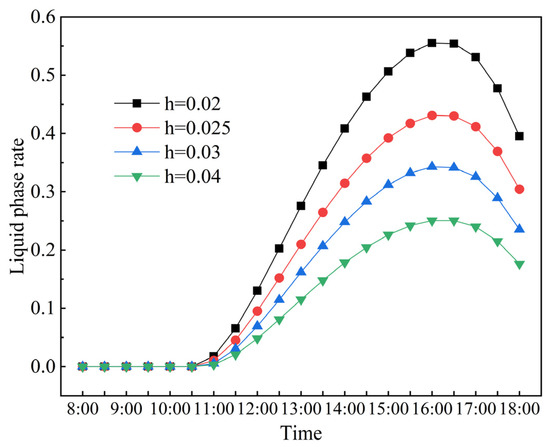
Figure 17.
Hourly variation of liquid phase rate for different thicknesses of PCM.
It is observed that there is no phase change of PCM in all working conditions before 10:30, and the liquid phase rate of PCM is slow due to not absorbing enough heat to melt. The heat absorption rate of PCM sharply increases between 10:30 and 16:00 due to the fact the PCM starts to absorb heat and melt to generate a phase change and the liquid phase rate starts to rise. The temperature inside the collector reaches its peak as the irradiance starts to decrease after 13:00, while the liquid phase rate of the PCM starts to decrease but the temperature of the PV panel is still higher than the melting temperature of the PCM, so the liquid phase rate also continues to increase. The liquid phase rate of the PCM reaches its maximum value of the day around 16:00, while the heat absorption rate of the PCM drops to 0, the collector temperature is lower and the melting temperature of the PCM is reached again, the PCM starts to solidify and becomes exothermic, the liquid phase rate then drops and the heat absorption rate of the PCM is negative. In all operating conditions, the heat absorption rate of the PCM is highest at h = 0.04 m, when the mass of the PCM is the largest and the internal potential energy and heat saturation are low, so the heat exchange with the collector is the most effective, and the heat absorption rate of the PCM reaches its maximum value of 120.2 J/s for the whole day at 12:30. The 0.02 m thick PCM layer has the lowest rate of heat absorption with a maximum value of 103.1 J/s throughout the day.
Based on the analysis above, it can be concluded that increasing the water flow rate can significantly improve the electrical efficiency of the system but at the cost of a decrease in temperature rise, leading to a decrease in thermal efficiency. The optimal operating flow rate exists at a maximum value when the flow rate is too high, causing a significant decrease in efficiency due to the reduced heat transfer time. The best overall performance is achieved when the water flow rate is 0.02 kg/s. Compared to the worst operating conditions, the thermal-electric efficiency increased by 40.7% and 4.1%, respectively. In the three systems (PVT-PCM, PVT, and PV), the PVT-PCM system’s photovoltaic efficiency increased by 3.06% and 16.15% while the electrical output increased by 4.08% and 19.13%. When the collector height was 0.03 m, the PVT-PCM system’s photovoltaic efficiency improved the most, with an increase of 0.18% compared to a height of 0.02 m. As the PCM thickness exceeded 0.03 m, the collector’s photothermal performance improvement was not significant. Therefore, it is recommended to choose a PCM thickness of 0.03 m to ensure good performance.
4. Conclusions
In this study, a plate-and-tube water-based PV/T-PCM collector with an air gap was proposed to reduce energy losses and mitigate the negative impact of temperature rise on PV cells. A numerical investigation is conducted in this work to examine the effect of water flow rates, the presence of PCM, and PCM thickness on the power output and efficiency of the solar collector. The interactions between the studied input factors and their combined impact on the power output and efficiency of the solar collector are observed. The optimal values of some important parameters of the PVT-PCM at the maximum efficiency are also calculated. Moreover, the performances of the PVT-PCM, PVT, and single PV cell are compared. The application of PCM significantly improves the power generation capacity of the system and enhances the solar energy utilization efficiency of the plate-and-tube water-based PVT collector. It is vital to find the optimal values of some key parameters, which will be of great guiding significance for the design and operation of solar energy systems and can be determined through theoretical calculation. In addition, the application of the PCM can improve the shortcomings of PVT systems with fluctuating photothermal efficiency due to irradiance and keep the stability of the thermal power output. Other findings are as follows:
(1) The water flow rate has a maximum value of m = 0.02 kg/s for system performance improvement. The thermal-electric efficiency increased by 40.7% and 4.1% compared to m = 0.004 kg/s. However, as the flow rate continues to increase to m = 0.1 kg/s, the electrical efficiency increased by 5.55%, but the thermal efficiency decreased by 13.4% due to the higher flow rate and the resulting lower temperature rise of the water.
(2) Compared to the system without PCM, the electrical power output at 13:00 increased by 2.55 W and 8.68 W, and the average photoelectric efficiency increased by 3.06% and 16.15%, respectively. In the calculation time, the maximum temperature differences of the respective PV cells in the three systems are 25.67 °C, 34.32 °C, and 57.11 °C, respectively, which, to some extent, improves their service life.
(3) For the water-based plate-and-tube PV/T-PCM collector, the results show that the 0.03 m thickness of PCM has the best selection value compared to other thicknesses of the PCM.
Author Contributions
Conceptualization, M.L.; methodology, L.L.; validation, L.L. and K.Y.; formal analysis, M.L. and Z.Y.; investigation, M.L. and Z.Y.; resources, L.L., K.Y. and Y.L.; writing—original draft preparation, M.L. and Z.Y.; writing—review and editing, K.Y. and Y.L.; funding acquisition, M.L. and Y.L. All authors have read and agreed to the published version of the manuscript.
Funding
This research received no external funding.
Institutional Review Board Statement
Not applicable.
Informed Consent Statement
Not applicable.
Data Availability Statement
The data presented in this study are available on request from the corresponding authors.
Conflicts of Interest
The authors declare no conflict of interest.
Nomenclature
| G | solar radiation intensity, W/m2 |
| τ | transmission coefficient |
| α | absorption coefficient |
| M | mass flow rate, kg/s |
| T | temperature, K |
| ηpv | Photovoltaic efficiency |
| vwind | ambient wind speed, m/s |
| λ | thermal conductivity, W/m·K |
| D | equivalent diameter, m |
| W | width, m |
| R | thermal resistance |
| Nu | Nusselt |
| δ | thickness, m |
| cp | constant pressure specific heat capacity, kJ/kg·K |
| H | convective heat transfer coefficient, W/m2·K |
| Pa | encapsulation factor |
| COP | coefficient of performance |
| TPT | Tedlar/PET/Tedlar |
| Subscript | |
| E | environment |
| S | sky |
| G | glass cover |
| Pv | solar cell |
| I | insulation layer |
| W | water |
| Ab | heat absorbing panel |
| A | air layer |
| T | tube |
References
- Mohsin, M.; Rasheed, A.; Sun, H.; Zhang, J.; Iram, R.; Iqbal, N.; Abbas, Q. Developing low carbon economies: An aggregated composite index based on carbon emissions. Sustain. Energy Technol. Assess. 2019, 35, 365–374. [Google Scholar] [CrossRef]
- Malahayati, M. Achieving renewable energies utilization target in South-East Asia: Progress, challenges, and recommendations. Electr. J. 2020, 33, 35–40. [Google Scholar] [CrossRef]
- Heffron, R.; Halbrugge, S.; Korner, M.; Obeng-Darko, N. Justice in solar energy development. Sol. Energy 2021, 218, 68–75. [Google Scholar] [CrossRef]
- Shockley, W.; Queisser, H. Detailed balance limit of efficiency of p-n junction solar cells. J. Appl. Phys. 1961, 32, 510–519. [Google Scholar] [CrossRef]
- Kant, K.; Shukla, A.; Sharma, A.; Biwole, P. Thermal response of poly-crystalline silicon photovoltaic panels: Numerical simulation and experimental study. Sol. Energy 2016, 134, 147–155. [Google Scholar] [CrossRef]
- Zhao, B.; Chen, W.; Hu, J.; Qiu, Z.; Qu, Y.; Ge, B. A thermal model for amorphous silicon photovoltaic integrated in ETFE cushion roofs. Energy Convers. Manag. 2015, 100, 440–448. [Google Scholar] [CrossRef]
- Sultan, S.; Efzan, M. Review on recent Photovoltaic/Thermal (PV/T) technology advances and applications. Sol. Energy 2018, 173, 939–954. [Google Scholar] [CrossRef]
- Garg, H.; Adhikari, R. Conventional hybrid photovoltaic/thermal (PV/T) air heating collectors: Steady-state simulation. Renew. Energy 1997, 11, 363–385. [Google Scholar] [CrossRef]
- Kazem, H. Evaluation and analysis of water-based photovoltaic/thermal (PV/T) system. Case Stud. Therm. Eng. 2019, 13, 100401. [Google Scholar] [CrossRef]
- Belyamin, B.; Fulazzaky, M.; Roestamy, M.; Subarkah, R. Influence of cooling water flow rate and temperature on the photovoltaic panel power. Energy Ecol. Environ. 2021, 7, 70–87. [Google Scholar] [CrossRef]
- Gaur, A.; Tiwari, G. Performance of a-Si thin film PV modules with and without water flow: An experimental validation. Appl. Energy 2014, 128, 184–191. [Google Scholar] [CrossRef]
- Kamal, S.; Satyendra, S.; Kandpal, D.; Kumar, R. Experimental performance study of photovoltaic solar panel with and without water circulation. Mater. Today 2021, 46, 6822–6827. [Google Scholar]
- Pang, W.; Cui, Y.; Zhang, Q.; Yu, H.; Zhang, L.; Yan, H. Experimental effect of high mass flow rate and volume cooling on performance of a water-type PV/T collector. Sol. Energy 2019, 188, 1360–1368. [Google Scholar] [CrossRef]
- Nahar, A.; Hasanuzzaman, M.; Rahim, N.; Parvin, S. Numerical investigation on the effect of different parameters in enhancing heat transfer performance of photovoltaic thermal systems. Renew. Energy 2019, 132, 284–295. [Google Scholar] [CrossRef]
- Al-Waeli, A.H.A.; Sopian, K.; Kazem, H.A.; Chaichan, M.T. Novel criteria for assessing PV/T solar energy production. Case Stud. Therm. Eng. 2019, 16, 100547. [Google Scholar] [CrossRef]
- Manssouri, O.; Hajji, B.; Tina, G.; Gagliano, A.; Aneli, S. Electrical and Thermal Performances of Bi-Fluid PV/Thermal Collectors. Energies 2021, 14, 1633. [Google Scholar] [CrossRef]
- Abbas, S.; Yuan, Y.; Zhou, J.; Hassan, A.; Yu, M.; Ji, Y. Experimental and analytical analysis of the impact of different base plate materials and design parameters on the performance of the photovoltaic/thermal system. Renew. Energy 2022, 187, 522–536. [Google Scholar] [CrossRef]
- Yu, Q.; Chen, X.; Yang, H. Research progress on utilization of phase change materials in photovoltaic/ thermal systems: A critical review. Renew. Sustain. Energy Rev. 2021, 149, 111313. [Google Scholar] [CrossRef]
- Gaur, A.; Menezo, C.; Giroux-Julien, S. Numerical studies on thermal and electrical performance of a fully wetted absorber PVT collector with PCM as a storage medium. Renew. Energy 2017, 109, 168–187. [Google Scholar] [CrossRef]
- Xu, H.; Wang, N.; Zhang, C.; Qu, Z.; Karimi, F. Energy conversion performance of a PV/T-PCM system under different thermal regulation strategies. Energy Convers. Manag. 2021, 229, 113660. [Google Scholar] [CrossRef]
- Preet, S.; Bhushan, B.; Mahajan, T. Experimental investigation of water based photovoltaic/thermal (PV/T) system with and without phase change material (PCM). Sol. Energy 2017, 155, 1104–1120. [Google Scholar] [CrossRef]
- He, Y.; Xiao, L.; Wang, F.; Wang, J. Design and experimental study of thermal storage PV/T/PCM solar collector. Int. Conf. N. Energy Future Energy Syst. 2019, 354, 012014. [Google Scholar] [CrossRef]
- Yuan, W.; Ji, J.; Modjinou, M.; Zhou, F.; Li, Z.; Song, Z.; Huang, S.; Zhao, X. Numerical simulation and experimental validation of the solar photovoltaic/thermal system with phase change material. Appl. Energy 2018, 232, 715–727. [Google Scholar] [CrossRef]
- Yang, X.; Sun, L.; Yuan, Y.; Zhao, X.; Cao, X. Experimental investigation on performance comparison of PV/T-PCM system and PV/T system. Renew. Energy 2018, 119, 152–159. [Google Scholar] [CrossRef]
- Modjinou, M.; Ji, J.; Yuan, W.; Zhou, F.; Holliday, S.; Waqas, A.; Zhao, X. Performance comparison of encapsulated PCM PV/T, microchannel heat pipe PV/T and conventional PV/T systems. Energy 2019, 166, 1249–1266. [Google Scholar] [CrossRef]
- Kant, K.; Shukla, A.; Sharma, A.; Biwole, P.H. Heat transfer studies of photovoltaic panel coupled with phase change material. Sol. Energy 2016, 140, 151–161. [Google Scholar] [CrossRef]
- Malvi, C.; Dixon-Hardy, D.; Crook, R. Energy balance model of combined photovoltaic solar-thermal system incorporating phase change material. Sol. Energy 2011, 85, 1440–1446. [Google Scholar] [CrossRef]
- Su, D.; Jia, Y.; Alva, G.; Liu, L.; Fang, G. Comparative analyses on dynamic performances of photovoltaic-thermal solar collectors integrated with phase change materials. Energy Convers. Manag. 2018, 131, 79–89. [Google Scholar] [CrossRef]
- Yazdanifard, F.; Ebrahimnia-Bajestan, E.; Ameri, M. Investigating the performance of a water-based photovoltaic/thermal (PV/T) collector in laminar and turbulent flow regime. Renew. Energy 2016, 99, 295–306. [Google Scholar] [CrossRef]
- Xie, Y.; Simbamba, M.M.; Zhou, J.; Jiang, F.; Cao, X.; Sun, L.; Yuan, Y. Numerical investigation of the effect factors on the performance of a novel PV integrated collector storage solar water heater. Renew. Energy 2022, 195, 1354–1367. [Google Scholar] [CrossRef]
- Duffie, J.A.; Beckman, W.A. Solar Engineering of Thermal Processes; John Wiley & Sons: Hoboken, NJ, USA, 2013; p. 3. [Google Scholar]
- Shan, F.; Cao, L.; Fang, G. Dynamic performances modeling of a photovoltaic-thermal collector with water heating in buildings. Energy Build. 2013, 66, 485–494. [Google Scholar] [CrossRef]
- Kazemian, A.; Salari, A.; Ma, T. A year-round study of a photovoltaic thermal system integrated with phase change material in Shanghai using transient model. Energy Convers. Manag. 2020, 210, 112657. [Google Scholar] [CrossRef]
- Yu, Q.; Hu, M.; Li, J.; Wang, Y.; Pei, G. Development of a 2D temperature-irradiance coupling model for performance characterizations of the flat-plate photovoltaic/thermal (PV/T) collector. Renew. Energy 2020, 153, 404–419. [Google Scholar] [CrossRef]
- Lamberg, P.; Lehtiniemi, R.; Henell, A. Numerical and experimental investigation of melting and freezing processes in phase change material storage. Int. J. Therm. Sci. 2004, 43, 277–287. [Google Scholar] [CrossRef]
- Huo, Y.; Rao, Z. The quasi-enthalpy based lattice Boltzmann model for solid-liquid phase change. Appl. Therm. Eng. 2017, 115, 1237–1244. [Google Scholar] [CrossRef]
- Huang, R.; Wu, H.; Cheng, P. A new lattice Boltzmann model for solid–liquid phase change. Int. J. Heat Mass Transf. 2013, 59, 295–301. [Google Scholar] [CrossRef]
- Kuo, C.; Liu, J.; Umar, M.; Lan, W.; Huang, C.; Syu, S. The photovoltaic-thermal system parameter optimization design and practical verification. Energy Convers. Manag. 2019, 180, 358–371. [Google Scholar] [CrossRef]
- Kong, X.; Zhang, L.; Li, H.; Wang, Y.; Fan, M. Experimental thermal and electrical performance analysis of a concentrating photovoltaic/thermal system integrated with phase change material (PV/T-CPCM). Sol. Energy Mater. Sol. Cells 2021, 234, 111415. [Google Scholar] [CrossRef]
- Available online: https://kdocs.cn/l/cnv9dWiLR8ME (accessed on 1 January 2023).
- Karaaslan, I.; Menlik, T. Numerical study of a photovoltaic thermal (PV/T) system using mono and hybrid nanofluid. Solar Energy 2021, 224, 1260–1270. [Google Scholar] [CrossRef]
Disclaimer/Publisher’s Note: The statements, opinions and data contained in all publications are solely those of the individual author(s) and contributor(s) and not of MDPI and/or the editor(s). MDPI and/or the editor(s) disclaim responsibility for any injury to people or property resulting from any ideas, methods, instructions or products referred to in the content. |
© 2023 by the authors. Licensee MDPI, Basel, Switzerland. This article is an open access article distributed under the terms and conditions of the Creative Commons Attribution (CC BY) license (https://creativecommons.org/licenses/by/4.0/).