Abstract
In order to solve the current problems of the single effect of traditional sand control measures, the high cost of cleaning and maintenance, and the inability to provide long-term sustainable protection, this paper proposes a new type of sand barrier with the dual effect of sand conduction and sand blocking. Through field research of wind and sand disasters along the Hami-Lop Nor Railway, wind tunnel testing and numerical simulation of the new sand barrier, the wind velocity flow field, wind speed variation curve, wind protection effectiveness and sand barrier retention rate of the new sand barrier under different design parameters were studied. The results show that the sand barrier with 10H spacing (H is the height of the sand barrier) has the worst sand guiding and blocking effect. The sand barriers with 6H and 8H spacing have less difference in sand guiding and sand blocking effects. Both of them are better than the sand barrier with 10H spacing. The sand blocking effect of the new sand barrier was proportional to the angle (α). The sand guide effect was the opposite. When the angle is certain, the greater the wind speed and the better the sand guide effect. The results show that the new sand barrier is different from the traditional sand barrier in that it has both sand guiding and sand blocking functions, which provides a new method and scientific basis for sand damage control of Hami-Lop Nor Railway.
1. Introduction
As a significant environmental problem, desertification has attracted the public attention of the international community. China is one of the countries with serious desertification hazards, and many researchers have studied wind and sand movement patterns and the evolution of desert desertification [1,2]. In the context of China’s “One Belt, One Road” and western development, railroad construction in the central and western regions is developing rapidly. The completion of the Hami-Lop Nor section of the railroad through the sand not only promotes the development of mineral resources along the line but also has a vital significance in promoting the development of tourism resources along the line and improving the regional transportation network. The wind is strong and high in frequency along the Hami-Lop Nor railroad line. According to the actual observation, the wind and sand hazard section of the Hami-Lop Nor railroad is 195.532 km long as of now, accounting for about 52% of the total length of the line [3]. Additionally, the occurrence of sand accumulation disasters on railroad lines significantly affects the safe operation of trains. It limits economic development and ecological stability between regions. It has been a pressing issue to solve how to effectively use engineering sand control measures to improve the sandy environment in desertified areas [4,5].
It is a sand barrier that dominates the existing railroad sand control projects. Its fundamental principle is to significantly reduce the wind speed near the surface and weaken the intensity of sand transport. Thus, it achieves the effect that the sand is not affected by the wind [6]. Researchers have conducted many numerical simulations, wind tunnel tests, and field experiments on various structural forms of sand barriers and their effect on wind and sand control. They have also analysed the mechanism of wind and sand disaster control [7,8]. Horvat et al. [9] used computational wind engineering methods to simulate local wind and sand flows to obtain ground shear stress fields and derive sand deposition/erosion patterns. The simulated deposition/erosion patterns are qualitatively consistent with the field evidence observed along desert railroads. Based on wind tunnel tests and numerical simulations, Song et al. [10] evaluated the railway catenary’s wind deflection under crosswind. Sarafrazi et al. [11] simulated air and sand particles using Eulerian and Lagrangian models to determine the correlation between the distance behind the barrier to prevent sand deposition and the height of the barrier at different wind speeds. The effect of sand blocking is mainly influenced by the geometry of sand barriers, such as height, spacing, angle, etc. [12,13]. Fang et al. [14] suggested that double and triple rows of sand barriers were optimal for reducing wind speed, which was confirmed in a subsequent study [15]. The optimal sand barrier spacing of 6–8H (H is the height of the sand barrier) was recommended by Papesch [16] and Wu et al. [17]. Kim et al. [18] established a CFD model considering design characteristics such as wind speed and wind fence height to evaluate the wind speed reduction effect of wind fences quantitatively. Bo et al. [19] used a wind tunnel study to conclude that wind speed and sand particle size had no significant effect on the distribution pattern of the falling velocity of sand particles. Wang and Yan used wind tunnel tests to simulate the variation of flow field structure and wind speed for various models [20,21]. Some sand control measures were applied in engineering practice and achieved good results [21]. However, the existing sand barrier measures can only play a role in blocking and fixing the wind and sand flow; it does not have the effect of guiding and diverting. With time in the field, severe sand burial and accumulation in the continuous sand transport area will occur. As the sand accumulation near the sand barrier measures increases, resulting in the sand barrier measures being gradually buried, the efficacy of the sand barrier is reduced significantly. The surrounding sand accumulation must be removed periodically to maintain effectiveness [20]. The current sand accumulation cleaning is mainly carried out manually or mechanically. However, due to the long lines and the high cleaning and maintenance costs, it is difficult to solve the problem of sand blocking fundamentally.
Based on this, a new type of sand barrier with a dual effect of sand conduction and sand blocking is proposed in this paper. In order to have some reference by which to construct and improve the sand control system of the Hami-Lop Nor Railway, the wind velocity flow field around the sand barrier, the wind velocity change curve, the adequate protection range and the sand transport volume change are combined as the leading indicators to evaluate the effectiveness of sand conduction and sand blocking. The critical parameters of the new sand barrier (angle α, spacing) are optimized through field observation, numerical simulation and wind tunnel test of the Hami-Lop Nor Railway.
2. Overview of the Study Region
The Hami-Lop Nor Railway starts from the Hongguang Station of the Lanzhou-Xinjiang Railway in the north. It follows the South Ring Road to the west and, after reaching the Hami South Station, the route turns south and crosses the Hami Basin. The Hami-Lop Nor Railway passes through the Hami Industrial Park, the Hami-Lop Nor Highway, and the Lop Nor Plain, and then heads southwest to Lop Nor [3]. The climate around Lop Nor is arid, with high diurnal temperature difference, evaporation, and low precipitation, which is typical of the arid continental climate. Severe dust, sandstorm weather, and high salinity aerosol phenomena have been observed in the region due to global climate change. The overall climatic characteristics along the Hami-Lop Nor railroad line show very little precipitation and intense evaporation. The number of months with monthly precipitation below 1 mm is 73%, and the number of months with more than 20 mm is 3% in Lop Nor. The average annual precipitation is 29 mm [3]. The weak windy season is from March to May every year, when the average wind speed in Lop Nor can reach 7.2 m/s. The strong windy season is from June to August, with a maximum wind speed of 36.8 m/s. The wind and sand flow are more robust during the windy season, and the sand causes severe damage to the railroad. The wind direction along the Hami-Lop Nor Railway was monitored and analysed. The dominant wind direction in the study area was NE–SW, with a gentle wind direction. The geomorphological characteristics of the section with severe sand damage were studied, reflecting the current situation of wind and sand disasters in the area, and providing support for the excellent configuration of sand control measures.
3. Materials and Methods
In this section, firstly, the geometric structure and working principle of the new sand barrier are explained, followed by a detailed description of the relevant parameter settings for wind tunnel test design and numerical simulation, and, finally, the processing of the data obtained from the wind tunnel test is explained.
3.1. New Sand Barrier Geometry Model
The structure of the new sand barrier is shown in Figure 1a,b, and its working principle is shown in Figure 1c–f. As shown in Figure 1c,e when the sand barrier is used to block the sand, the sand flow is forced to consume much kinetic energy during the climbing period, which reduces the sand carrying capacity. When the sand flow crosses the sand blocking surface and continues to run under the effect of the inverse pressure gradient, a vortex flow is formed behind the sand blocking surface. The speed of the sand flow in this area is significantly reduced. Because the velocity of airflow movement is less than the wind speed of the sand particles themselves, the sand particles are forced to settle under the action of their gravity, forming an apparent sand accumulation. As shown in Figure 1d,f, when the role of the sand barrier is to divert the sand flow, the sand barrier is configured in such a way that a narrow tube effect is created between adjacent sand barriers. The energy behind the first row of sand barriers is volatile, forming a turbulent area with vortices of different sizes, which increases the energy of the near-surface sand flow and accelerates the sand flow, carrying away the sand particles deposited between the sand barriers. Once sand accumulation occurs, it can be removed by natural wind power, thus saving a lot in workforce and material resources.
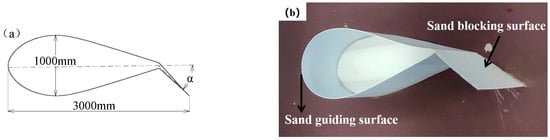
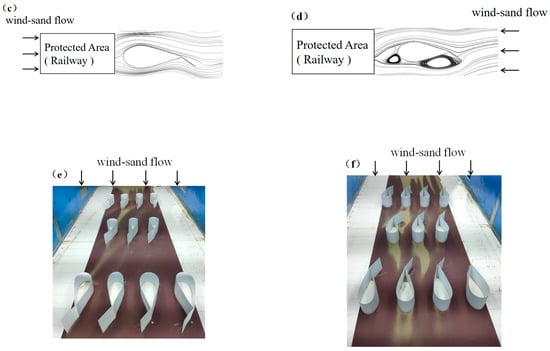
Figure 1.
New sand barrier: (a) is the real dimensions of sand barrier near the railway track; (b) is the model of the Barrier; (c) is the sand guiding diagram; (d) is the sand blocking diagram; (e) is a pre-experiment on the effect of sand guiding; (f) is a pre-experiment on the effect of sand blocking.
3.2. Wind Tunnel Test
In order to investigate the flow field and the structure of wind and sand flow around the sand barrier, a wind tunnel experiment was conducted at the Xinjiang Institute of Ecology and Geography, Chinese Academy of Sciences. The wind tunnel is a DC low-speed wind tunnel consisting of a power section, a rectification section, a test section, and a diffusion section, which is 16.2 m long in total. The test section is 8 m long, and the experimental section where the model can be placed is 4 m long, with a cross-sectional width of 1.3 m and a height of 1 m. The transverse diffusion structure is used with a diffusion angle of 0.2° on both sides. The experimental wind speed is continuously adjustable from 5 to 20 m/s. The wind tunnel experiment meets the conditions of geometric similarity, motion similarity and dynamic similarity [22], and the model used in the experiment adopts a similarity ratio of 1:10. In terms of geometric similarity, the model blockage does not exceed 6% in order to prevent interference from the cave wall [23]. In this wind tunnel test, the maximum thickness of the attached surface layer is 15 cm, and the height of the sand barrier model is 10 cm, which satisfies the relevant conditions. The flow pattern and wind speed profile are mainly considered similar regarding motion similarity. The wind speed profile was verified by pre-experiments and conformed to the logarithmic distribution [24]. The maximum indicated wind speed of the experiment is 10 m/s. The wind tunnel height must be above 0.73 m, which is lower than the current wind tunnel height (1.0 m) and satisfies the dynamic similarity criterion.
The wind tunnel test mainly monitors the wind speed variation around the sand barrier and the wind-sand flow structure. Wind speed was measured by a measurement system consisting of a Pitot tube connected to a micro differential pressure transmitter. The wind speed data were recorded automatically by computer with a frequency of 1 s. In order to obtain a more stable and accurate wind speed, each recording time was 5~7 min, and the average value was taken for three tests. The wind speed was collected at 1 cm, 2 cm, 3 cm, 5 cm, 7 cm, 10 cm, 15 cm, 30 cm, and 50 cm. The wind speeds of 6 m/s, 8 m/s, and 10 m/s were selected for the wind speed observation without the sand barrier model (empty field) and with the sand barrier model. The sand barrier model was fixed during the test in the wind tunnel test section (Figure 2). The location of the first row of sand barriers was taken as 0H, the left side of the first row of sand barriers was the windward side, and the area between the sand barriers was the transition area. The right side of the last row of sand barriers was the leeward side. The detailed distribution of wind speed measurement points is shown in Table 1, where H is the height of the sand barrier, and the negative value represents the windward side of the sand barrier.
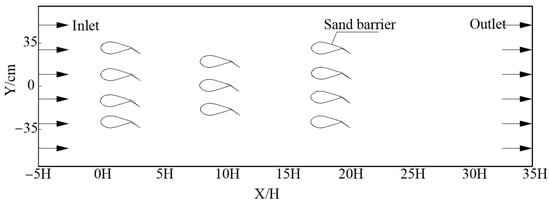
Figure 2.
Wind tunnel test layout and computational domain for numerical simulation.

Table 1.
Distribution of measurement points under different sand barrier parameters.
In the wind-sand flow monitoring experiment (Figure 3), sand was spread uniformly in the wind tunnel with a thickness of 5 cm. To ensure uniform mixing of wind and sand, sand was laid at 10H on the left side of the first row of sand barriers. The gradient sand collector was located at 7H after the last row of sand barriers. The sand collector was equipped with 10 sand collection ports in the vertical direction with a cross-sectional area of 20 mm × 20 mm, and a corresponding sand collection box was connected to the rear side of the said sand collection port for collecting sand volume during the experiment. The blowing of the model without a sand barrier (empty field) and the placed sand barrier model was carried out under wind speeds of 6 m/s, 8 m/s, and 10 m/s. At the end of the experiment, the sand collected from each layer on the sand collector was weighed using a 0.001 g precision electronic balance.
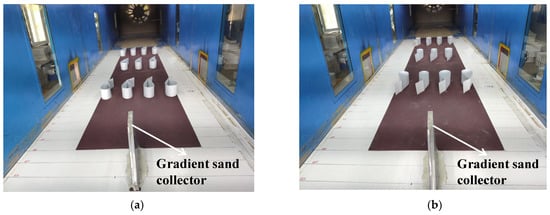
Figure 3.
Wind and sand flow monitoring test. (a) Sand Barrier works as a sand blocking effect; (b) Sand Barrier works as a sand guiding effect.
3.3. Numerical Simulation
The wind-sand flow problem is considered a gas-solid two-phase flow problem in Fluent and is solved in this paper using the Eulerian two-fluid model [25]. The computational domain is 4 m long, 1.3 m wide, and 1 m high (Figure 2). The computational domain is unstructured, and the grid around the sand barrier and near the wall is locally encrypted because the sand particles are mainly concentrated in the range of 0~30 cm from the surface [26,27]. The total number of grids is about 5 million, and the maximum inclination of the grids is below 0.7. The quality of the grids is good and meets the requirements of calculation accuracy. The media type in the calculation area is Fluid. The sand flow is an incompressible fluid, so the wind velocity inlet at the left boundary is set to Velocity-inlet, the wind velocity outlet at the right boundary is set to Out-flow, the upper wall is set to Symmetry, and the sand barrier and the lower wall are both set to Wall. The Eulerian two-fluid model and the standard κ-ε turbulence model are used for numerical simulations. The specific parameter settings are shown in Table 2. The energy equation was not considered because the heat exchange between the wind and sand flows can be neglected. The control equations involved mainly include the continuity equation, the momentum equation, and the dual equation of the κ-ε turbulence model [18].
Table 2.
Parameter setting in numerical simulation.
3.4. Data Processing
3.4.1. Effective Protection Distance
Based on field observations and wind tunnel simulation results, scholars consider the distance between the sand barrier and the obstacle as the effective protection distance when the wind direction under the sand barrier or obstacle returns to 50% of the open field wind speed at the same height [28]. Since the study of effective protection distance has not formed a unified definition [29], this paper selects 50% of the attenuated open field wind speed to determine the effective protection distance, and the calculation formula is as follows:
where: Vkij is the wind speed value (m/s) when there is a model in the wind tunnel at the point of coordinates (i, j) at k wind speed; Vkj is the wind speed value (m/s) in the empty field of the wind tunnel; bijk is the acceleration rate at the point of coordinates in (i, j) at k wind speed, also known as the wind speed weakening percentage, and the larger the value of bkij, the better its wind protection effect.
3.4.2. Sand Barrier Retention Rate
The sand barrier retention rate is a major quantifiable evaluation parameter of the sand retention effect of sand barriers. The concept of retention rate is invoked by assuming that the erosion process of sand grains on the ground is the superposition of pure wind shear stress and sand-bearing wind impact abrasion [30]. When eroding sand grains pass through a sand barrier, some of the sand grains are retained and the percentage of sand grains retained to the total sand erosion is called the sand barrier retention rate [31]. The calculation formula is as follows:
where: n is the sand barrier retention rate; W is the sand transport flux (g·cm−2·min−1) for the same wind speed and height layer airfield; Q is the sand transport flux (g·cm−2·min−1) after sand barrier blockage.
4. Results and Discussion
In this section, the airflow velocity clouds, wind speed variation curves, wind protection effectiveness, and sand barrier retention rate of the new sand barrier with different design parameters (spacing, angle α) are profiled, which are the main indicators to evaluate the advantages and disadvantages of the sand conductivity and sand barrier effect of the new sand barrier. In turn, the sand barrier design parameters are optimized.
4.1. Flow Field Structure of Sand Barriers with Different Spacing
4.1.1. Sand Barrier Works as a Sand Blocking Effect
When the role of the sand barrier is to block the wind and sand flow, Figure 4 shows the airflow velocity clouds of the sand barrier at different spacing gradients. The flow field structure around the sand barrier is strongly disturbed, and the wind speed on the windward side of the sand barrier is reduced by the sand barrier. When the sand barrier spacing is 6H, the airflow starts to fluctuate around −4H on the windward side of the sand barrier. The sand barrier disturbs the airflow and the streamline is encrypted, forming a vortex and weak wind area. When the airflow reaches −2H, the low-level airflow changes slowly and remains in the weak wind area. The high-level airflow changes intensify, showing a falling and then rising trend. As the airflow moves to 0H, the change of upper airflow is enhanced under the blockage of the sand barrier. When the airflow crosses the model, the lifting airflow appears to be separated by the attached surface layer. The airflow streamlines behind the sand barrier are encrypted, forming a weak or static wind area. However, the upper airflow streamline is sparse, forming a vital wind area in a particular area. When the airflow passed the first line of the sand barrier, the near-surface airflow was strongly disturbed by the sand barrier and the wind speed dropped sharply. When the airflow continued to advance, influenced by the second row of sand barriers and the third row of sand barriers, the near-surface airflow could not rise, resulting in a continuous decline. The streamlines settled and separated near the horizontal position 14H, and the wind speed began to recover. When the sand barrier spacing is 8H, the change characteristics of the velocity field are the same as those of the 6H spacing sand barrier. The near-surface airflow generally shows the law of “first falling, gradually stabilizing, and then rising”. The windward side of the sand barricade −4H is the turning point of wind speed change. The horizontal position of 18H near the airflow sinking began to rebound gradually. When the distance between sand barriers is 10H, the air velocity field change characteristics are the same as those of sand barriers with distances of 6H and 8H. The windward side of the sand barrier−4H has been the turning point of the wind speed change. The airflow sinks near the horizontal position 23H and starts to rebound gradually.
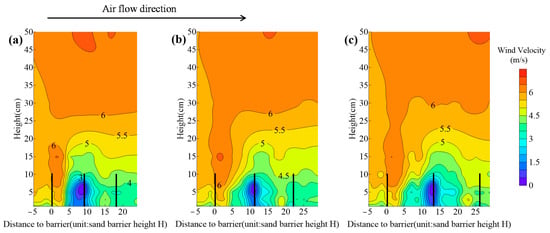
Figure 4.
Contour diagrams of airflow velocity around the sand barrier at different pitch gradients: (a) 6H; (b) 8H; (c) 10H. The wind speed in this example is 6 m/s and the angle is 30°. In order not to affect the display of the results, the location of the left side of the sand barrier is indicated by a black vertical bar in the figure.
According to the observed data of wind tunnel test, the variation of horizontal wind speed around the sand barrier with different spacing gradients is shown in Figure 5, which is similar to the numerical simulation results. There are apparent stratification phenomena in the vertical direction from 0.01 to 0.3 m. The airflow within 0.01~0.15 m is more complicated. The flow line is roughly “saddle” shaped. There are several subdivisions, such as the local deceleration zone, turbulence zone, and airflow recovery zone. The horizontal interception line (0.15 m) is the airflow stratification line of 6H, 8H, and 10H sand barriers. The average airflow velocity between 0.01 and 0.15 m decreases to 4.25 m/s, 4.24 m/s, and 4.53 m/s at different sand barrier spacing. Compared with the indicated wind speed of 6 m/s, the wind speed was reduced by 29.17%, 29.33%, and 24.5%. The sand blocking effect of sand barriers at spacing 10H was poor compared to sand barriers at spacing 6H and 8H. The wind speed variation curves around the sand barriers all had significant rise and fall segments due to the sand barrier effect. When the sand barrier spacing is 10H, the sand barrier spacing is too large to give full play to its sand blocking effect, and the wind speed on the leeward side of the sand barrier rises rapidly. In the case of 6H and 8H sand barrier spacing, the wind speed between sand barriers is mainly under the wind speed the sand started at. and the sand barriers can have an excellent sand blocking effect.
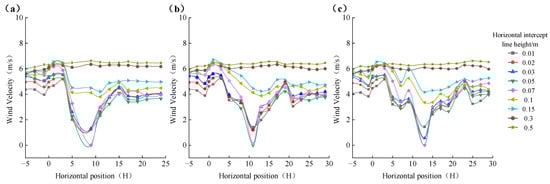
Figure 5.
Variation of horizontal wind speed around the sand barrier at different spacing gradients: (a) 6H; (b) 8H; (c) 10H. The wind speed in this example is 6 m/s and the angle is 30°.
4.1.2. Sand Barrier Works as a Sand Guiding Effect
When the role of the sand barrier is to divert the wind and sand flow, Figure 6 shows the airflow velocity clouds of the sand barrier at different spacing gradients. All three contour maps show evident deceleration, acceleration, and vortex zones. When the sand barrier spacing is 6H, the airflow starts to undulate from −4H, and in the range of −2H~0H, the lower airflow is relatively gentle, forming a weak wind area while the upper airflow has a lifting phenomenon. At this time, the sand barrier arrangement is sparse and permeable, and part of the airflow can pass through the model, so it does not have a static wind area on the leeward side. Near-surface airflow forms a weak wind zone at 0~2H under the model’s action. The airflow floats up and down between 2~13H, and the wind speed gradually returns to the open field wind speed after 20H. When the sand barrier spacing is 8H, the upper airflow on the windward side rises slowly. The lower airflow at −4H, there is an inflexion point of airflow change, and the airflow in the range of −4~−2H starts to flow slowly after fluctuations occur, and a weak wind area appears before −2H to the sand barrier. When the airflow keeps moving forward, the upper airflow lifts above the sand barrier, and the lower airflow drops rapidly after passing the sand barrier. The separation point of the sinking airflow occurs near 17H. When the distance between sand barriers is 10H, −4H is the inflexion point of airflow change on the windward side of sand barriers, the upper airflow on the windward side rises slowly, and a weak wind area appears in front of −2H to the model. When the airflow continues to move forward, the upper airflow rises above the model, and a substantial wind area is formed on the sand barrier model, the lower airflow develops a vortex, and the vortex gradually increases. The inflexion point of airflow sinking and separation is located near 21H. When the airflow passes through the sand barrier, the airflow is squeezed and separated due to the separation of the boundary layer, thus forming a solid shear layer, which leads to the change of the duct section and causes the little tube effect. The incoming flow is squeezed and accelerated. At the same time, the pressure difference of the shear layer also makes the flow line bend. When the airflow is close to the ground, the flow line returns to the separation area, thus compensating for the part of the airflow that is sucked away. Finally, the acceleration zone is formed on both sides of the sand barrier to divert the wind and sand flow.
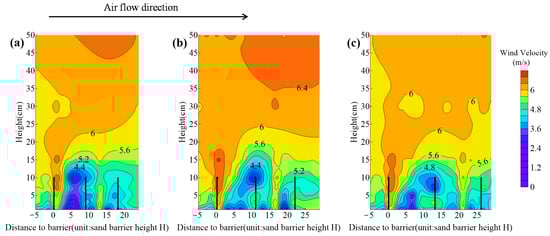
Figure 6.
Contour diagrams of airflow velocity around the sand barrier at different pitch gradients: (a) 6H; (b) 8H; (c) 10H. The wind speed in this example is 6 m/s and the angle is 30°. In order not to affect the display of the results, the location of the left side of the sand barrier is indicated by a black vertical bar in the figure.
Figure 7 shows the horizontal wind speed variation around the sand barrier at different spacing gradients. The airflow runs up to the windward side of the sand barrier, and there is evident stratification in the vertical direction from 0.01 to 0.15 m. The wind speed variation curve shows a wavy pattern. The horizontal intercept line (0.15 m) is the stratification line of airflow at 6H, 8H, and 10H sand barriers. When the sand barrier spacing is 6H, 8H, and 10H, the average airflow velocity between 0.01 and 0.15 m decrease to 4.92 m/s, 4.87 m/s, and 4.71 m/s. Compared with the indicated wind speed of 6 m/s, the wind speed decreases by 18.00%, 18.83%, and 21.50%. In the two cases of sand barrier spacing at 8H and 10H, the airflow experienced a significant energy loss when passing through the sand barrier, resulting in sand deposition in the transition zone, which was challenging to the role of sand channelling. In the case of sand barrier spacing at 6H, wind speed reduction was minor, which was favourable for wind and sand flow channelling. When sand barriers play the role of sand conduction, due to the configuration of sand barriers resulting in too much sparse permeability, there are a large number of ventilation orifices between adjacent sand barriers to form a narrow tube effect so that the near-surface airflow energy increases, and wind speed becomes larger. The wind speed does not drop significantly around the sand barricade. The wind speed decreases slightly near the sand barricade. It then quickly returns to the incoming flow level, which indicates that the sand barricade has good sand deflecting effect.
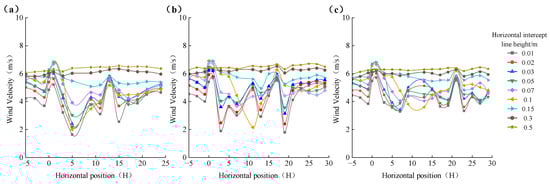
Figure 7.
Contour diagrams of airflow velocity around the sand barrier at different pitch gradients: (a) 6H; (b) 8H; (c) 10H. The wind speed in this example is 6 m/s and the angle is 30°.
4.2. Changes in the Effective Protection Range of Sand Barriers with Different Spacing
4.2.1. Sand Barrier Works as a Sand Blocking Effect
As can be seen from Figure 8, the wind protection effectiveness of the three spaced new sand barriers decreases with the increase of wind speed under the effect of 6 m/s, 8 m/s, and 10 m/s indicated wind speed. The wind protection effectiveness of the windward side of the sand barrier increases gradually in the range of −5~0H, increases rapidly in the range of 5~15H, and then decreases. At the same time, the wind protection effectiveness of the leeward side of the sand barrier also shows a similar change pattern. The effective protection range is calculated according to 50% of the wind speed reduction of the sand barrier in the open field. The effective protection ranges of 6H sand barriers at 6 m/s, 8 m/s, and 10 m/s were 6~13H, 6~12H, and 7~11H, and the average values of wind protection effectiveness were 17.91%, 16.03%, and 15.20%. When the sand barrier spacing is increased to 8H, the protection range is 13~17H at 6 m/s wind speed, almost 0 at 8 m/s wind speed, and 11~15H at 10 m/s wind speed, and the average values of their wind protection effectiveness reach 18.08%, 15.84%, and 16.57%. The protection benefit is the lowest for sand barriers with a spacing of 10H, and there is not much difference between the protection benefits of new sand barriers with a spacing of 6H and 8H. The percentage reduction of wind speed for sand barriers with a spacing of 10H is consistently below 50% due to the narrow tube effect due to the large spacing and the slight surface roughness.
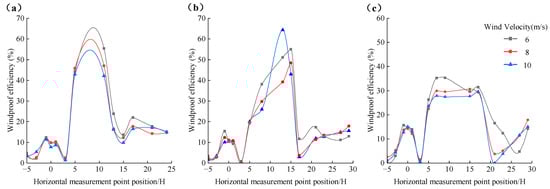
Figure 8.
Variation of wind protection effectiveness of new sand barriers with different spacing (sand blocking effect): (a) 6H; (b) 8H; (c) 10H.
4.2.2. Sand Barrier Works as a Sand Guiding Effect
As can be seen from Figure 9, the wind protection effectiveness of the three spaced sand barriers gradually increases in the intervals from −5 to 0H at the indicated wind speeds of 6 m/s, 8 m/s, and 10 m/s. The wind protection performance reaches the maximum in the intervals from 5 to 15H. The trend of wind protection effectiveness is similar to that of the sand barriers when they act as sand barriers. Because the sand barrier acts as a sand guide at this time, the percentage reduction of wind speed is relatively small. The effective protection range was calculated based on the sand barriers’ 50% reduction of wind speed in the open field. Only sand barriers with a spacing of 10H have a wind speed reduction percentage of more than 50%, so they have the weakest sand guiding effect. The percentage reduction of wind speed for 6H and 8H sand barriers is below 50%. The average values of wind protection effectiveness reached 11.55%, 9.73%, and 8.27% at wind speeds of 6 m/s, 8 m/s, and 10 m/s for sand barrier spacing of 6H. The average wind protection effectiveness of the sand barriers at a spacing of 8H reached 15.87%, 13.79%, and 13.26% under wind speeds of 6 m/s, 8 m/s, and 10 m/s. Since the sand barrier plays the role of the sand guide at this time, the smaller the average value of wind protection effectiveness is, the better the sand guide effect is. Therefore, the sand-conducting effect of the sand barrier with 6H spacing is better than that of the sand barrier with 8H spacing. The sand-conducting effect of the sand barrier with 10H spacing is the weakest.
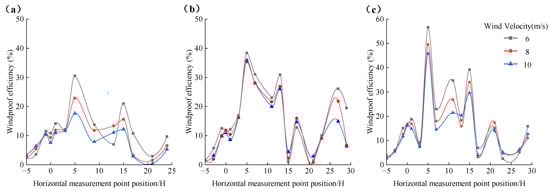
Figure 9.
Variation of wind protection effectiveness of new sand barriers with different spacing (sand guiding effect): (a) 6H; (b) 8H; (c) 10H.
4.3. Flow Field Structure of Sand Barriers with Different Angle
4.3.1. Sand Barrier Works as a Sand Blocking Effect
The sand barrier angle directly influences the flow field form, Figure 10 shows the airflow velocity clouds of the sand barrier at different angles gradients. When the angle is 30°, the airflow starts to undulate from −4H around the sand barrier’s windward side. The lower airflow is encrypted and generates vortices under the sand barrier’s disturbance, accompanied by weak wind area formation. When the airflow travels in the −4~−2H range, the variation of the lower-level airflow becomes weaker, and the variation of the upper-level airflow increases. After 0H, the airflow starts to rise and cross the sand barrier. Under the action of the first row of sand barriers, the wind speed near the surface gradually decreases. When the airflow passes the subsequent sand barriers, the wind speed decreases sharply, and when the airflow runs to 20H, the wind speed gradually rises again. When the angle is 45°, the change characteristics of the velocity field of the airflow are the same as the 30° angle sand barrier, and the near-surface airflow is generally “first decreasing, gradually stabilizing, and then increasing”. The low-level airflow is disturbed by the sand barrier, the streamline is encrypted, vortices appear, and a weak wind area is formed. In contrast, the streamlining of the high-level airflow is relatively stable, although there are fluctuations. At 0H, the airflow starts to lift and cross the model. After 20H of horizontal position, the wind speed gradually picks up. When the angle is 60°, −4H is still the inflexion point of airflow change on the windward side, −2H to the front of the model is a section of airflow lifting area, and a substantial wind area is formed above the sand barrier. With the increase of angle, the airflow change on the windward side is not much.
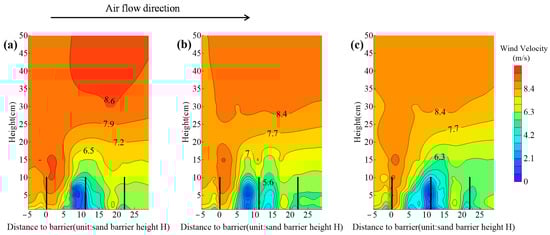
Figure 10.
Contour map of airflow velocity around the sand barrier at different angle gradients: (a) 30°; (b) 45°; (c) 60°. The wind speed in this example is 8 m/s and the spacing is 8H. In order not to affect the display of the results, the location of the left side of the sand barrier is indicated by a black vertical bar in the figure.
Figure 11 shows the changes in horizontal wind speed around the sand barrier under different angle gradients. When the angle of the sand barrier is 30°, the wind speed variation as a whole shows a smooth variation on the windward side of the sand barrier, and the horizontal wind speed variation at the horizontal positions 0H and 18H is more prominent, with different degrees of lift. The airflow in the 0.01~0.3 m vertical height showed evident stratification. In the range of 5~12H, the airflow velocity was sharply decreased by the obstruction of the sand barrier, showing the form of a “V” shaped airflow field. The horizontal interception line (0.15 m) is the dividing line between the upper and lower airflow. The average airflow speed between 0.01~0.15 m drops to 6.38 m/s, which is 20.25% lower than the indicated wind speed. When the angle of the sand barrier is 45°, the pattern of airflow variation along the vertical height at different locations—such as the windward side of the sand barrier, transition area and leeward side—is the same under the influence of the angle of 30°. The average airflow velocity between 0.01~0.15 m drops to 6.07 m/s, which is 24.13% lower than the indicated wind speed. When the angle of the sand barrier was increased to 60°, the average velocity of the airflow between 0.01 and 0.15 m decreased to 5.78 m/s, which was 27.75% lower than the indicated wind speed, and the reduction of wind speed was significantly more than that of the 30° and 45° sand barriers.
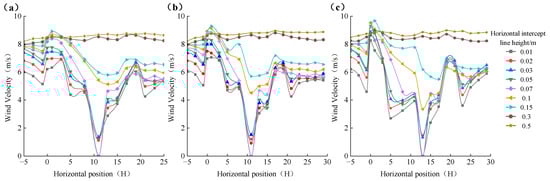
Figure 11.
Variation of horizontal wind speed around the sand barrier at different angular gradients: (a) 30°; (b) 45°; (c) 60°. The wind speed in this example is 8 m/s and the spacing is 8H.
4.3.2. Sand Barrier Works as a Sand Guiding Effect
The airflow fields of different angles of the sand barrier were compared (Figure 12). Within the height of the sand barrier, the average wind reduction effect tends to increase with the increase of the angle. When the angle of the sand barrier is 30°, the wind speed in front of the barrier does not change much with the change of horizontal distance, which is favourable to the wind and sand flow diversion. However, with the increase of angle, the pressure difference between the two sides of the sand barrier becomes more prominent, the blocking effect of the sand barrier is enhanced, and the flow guiding effect is weakened. This is because the angle between the sand barrier and the wind direction determines the difference between the wind and sand protection mechanism. When the angle is acute, the diversion effect is the main effect and the blocking effect is supplementary. The airflow will be affected by the sand barrier and will follow the sand barrier forward. When the angle of the sand barrier increases, the airflow blocking effect is more and more significant, as the airflow through the sand barrier will be forced to lift over the sand barrier. Therefore, the sand barrier angle of 30° is the most conducive to wind and sand flow diversion. At this degree, the angle between the sand barrier and the main wind direction is slight, near the surface of the wind conversion. When the wind carries sand close to the sand barrier will be part of the reason sand particles stop in front of the sand barrier, due to pressure after the wind speed increases, and will begin to land in the sand barrier near a part of the sand particles, and because of the impact of the new sand particles, become re-involved in the wind and sand runoff along the direction of the sand barrier as it continues to move forward to achieve the sand guide effect.
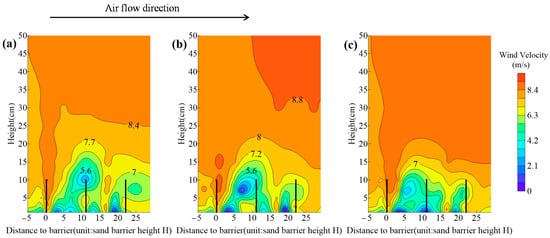
Figure 12.
Contour map of airflow velocity around the sand barrier at different angle gradients: (a) 30°; (b) 45°; (c) 60°. The wind speed in this example is 8 m/s and the spacing is 8H. In order not to affect the display of the results, the location of the left side of the sand barrier is indicated by a black vertical bar in the figure.
Figure 13 shows the changes in horizontal wind speed around the sand barrier under different angle gradients. The wind speed variation around the sand barrier is similar, and the overall flow field does not change much in front of the sand barrier. There is evident stratification in the vertical direction from 0.01 to 0.15 m. The wind speed variation curve is in the form of multiple “V” shapes. The horizontal interception line (0.15 m) is the stratification line of the horizontal airflow at different angles of the sand barrier. When the sand barrier angle is 30°, 45° and 60°, the average airflow velocity between 0.01 and 0.15 m decreases to 6.81 m/s, 6.57 m/s and 6.39 m/s, which is 14.88%, 17.88% and 20.13% lower than the indicated wind speed (8 m/s). It can be concluded that when the angle of the sand barrier is 45° and 60°, the wind speed curve changes more, and the airflow experiences an enormous energy loss when passing through the sand barrier, thus making it difficult for sand to be deposited in the transition zone and to play a role in de-silting. When the sand barrier angle is 30°, the wind speed curve changes more gently, and the sand barrier has less influence on the wind speed, which is conducive to diverting wind and sand flow.
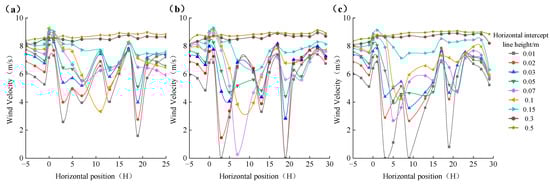
Figure 13.
Variation of horizontal wind speed around the sand barrier at different angular gradients: (a) 30°; (b) 45°; (c) 60°. The wind speed in this example is 8 m/s and the spacing is 8H.
4.4. Changes in the Effective Protection Range of Sand Barriers with Different Angle
4.4.1. Sand Barrier Works as a Sand Blocking Effect
Figure 14 shows that the wind protection effectiveness of sand barriers at the same angle under different wind speed conditions has a similar trend with distance. The wind protection effectiveness values from −5H to 0H are minor and do not change significantly, and the wind protection effectiveness from 5~15H changes significantly. The wind protection effectiveness values of the new sand barriers at different angles differed significantly. The effective protection range was calculated based on the sand barriers reducing the wind speed in the open field by 50%. At an angle of 30°, the wind protection effectiveness of the sand barrier can be close to 50% at 6 m/s, and the adequate protection range is 13H. At an angle of 45°, the adequate protection range of the sand barrier is 11~16H, 15H, and 13~17H at wind speeds of 6 m/s, 8 m/s, and 10 m/s, and the average values of wind protection effectiveness reach 18.08%, 15.84%, and 16.57%. At an angle of 60°, the mean values of wind protection effectiveness of the sand barrier at wind speeds of 6 m/s, 8 m/s, and 10 m/s reached 22.72%, 20.88%, and 19.86%. It can be concluded that the sand barrier angle of 60° has the best sand blocking effectiveness, the sand barrier angle of 45° has the second-best sand blocking effectiveness, and the sand barrier angle of 30° has the worst sand blocking effectiveness.
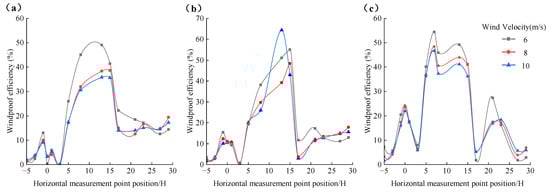
Figure 14.
Variation of wind protection effectiveness of new sand barriers with different angles (sand blocking effect): (a) 30°; (b) 45°; (c) 60°.
4.4.2. Sand Barrier Works as a Sand Guiding Effect
Under different wind speed conditions, the wind protection effectiveness of the new sand barrier at the same angles follows roughly the same trend as with distance, as shown in Figure 15. The wind protection effectiveness of −5~0H is slight and does not change much, and the wind protection effectiveness of 5~20H changes significantly. The wind protection effectiveness experienced a rapid increase and then a slight decrease before, between, and after the sand barriers. With the increase in wind speed, the wind protection effectiveness values decreased to different degrees. The effective protection range was calculated based on the sand barrier reducing the wind speed in the open field by 50%. Only when the angle of the sand barrier is 60° can the new sand barrier barely reach 50% wind protection. When the sand barrier angle is 30°, the average wind protection effectiveness reaches 12.78%, 10.25%, and 9.52% under the wind speed of 6 m/s, 8 m/s and 10 m/s. The average values of wind protection effectiveness reached 15.87%, 13.79%, and 13.26% for wind speeds of 6 m/s, 8 m/s, and 10 m/s, under the sand barrier angle of 45°. Since the new sand barrier has to act as a sand guide, the smaller the mean value of wind protection effectiveness, the better the sand guide effect. It can be concluded that the sand barrier has the best sand-conducting effect at an angle of 30°, the sand barrier has the second-best sand-conducting effect at an angle of 45°, and the sand barrier has the worst sand-conducting effect at an angle of 60°.
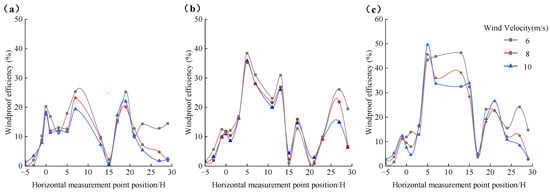
Figure 15.
Variation of wind protection effectiveness of new sand barriers with different angles (sand guiding effect): (a) 30°; (b) 45°; (c) 60°.
4.5. Sand Barrier Retention Rate
The sand barrier retention rate is the primary quantifiable evaluation parameter of the sand retention effect of sand barriers. Table 3 shows the retention rates of the new sand barriers under different design parameters. The higher the sand retention rate of the sand barrier, the better the sand barrier is as a sand deterrent, and the poorer the sand barrier is as a sand conductor. Therefore, the difference between the retention rate of the new sand barrier as a sand blocker and the retention rate of the new sand barrier as a sand conductor can be used, and the larger the difference is, the more the new sand barrier with the corresponding design parameters will meet the requirements.
Table 3.
New sand barrier retention rate.
By comparing the different values of the retention rate of the new sand barriers with different design parameters it can be found that there are four groups with differences of about 25% and above, namely: group D: wind speed of 6 m/s, angle of 60°, spacing of 8H, retention rate difference of 29.07%; group M: wind speed of 10 m/s, angle of 45°, spacing of 10H, retention rate difference of 25.01%; group C: wind speed of 6 m/s, angle of 45°, spacing of 10H, retention rate difference of 24.73%; group N: wind speed of 10 m/s, angle of 60°, spacing of 8H, retention rate difference of 20.99%. Based on the previous research on wind velocity flow field, wind velocity change curve and wind protection efficiency, group D is the best choice for the new sand barrier design parameters to meet the essential functions of the sand barrier to stop sand and to improve sand conduction effects at the same time. In this group the interception rate difference is the largest while the sand blocking effect reaches 81.28%, which is the most suitable new sand barrier design parameter compared with the other three groups.
5. Conclusions
In this paper, based on the field investigation and study of sand damage along the Hami-Lop Nor Railway, the influence of some critical parameters of the new sand barrier on the effect of sand conduction and the sand block were analysed through a combination of numerical simulation tests and wind tunnel experiments. The main conclusions obtained are as follows:
- By studying the wind velocity flow field, wind speed variation curve, wind protection efficiency and sand transport volume variation under different design parameters of the new sand barrier, the effect of sand conduction and sand interception of the new sand barrier is comprehensively evaluated. The results show that when the angle of the new sand barrier is 60° and the spacing is 8H, the effect of sand conduction and sand interception is optimal.
- A new type of sand barrier with the dual role of sand guide and sand blocking is proposed through field research on the wind and sand hazards along the Hami-Lop Nor Railway. The wind tunnel experiment and numerical simulation results show that the new sand barrier proposed in this paper is more suitable to be deployed in the wind and sand section of the Hami-Lop Nor Railway than the conventional sand barrier, as it can play the role of both sand guide and sand barrier, and its unique design can effectively increase the incoming wind speed and prevent the wind and sand from going up the road. From the research results, this design is practical and can be tried in practice, which provides a new idea for sand control on the Hami-Lop Nor Railway.
Author Contributions
Conceptualization, F.L., W.Z. and H.W.; methodology, F.L. and W.Z.; validation, Z.W.; writing—original draft preparation, F.L.; writing—review and editing, W.Z. and L.Z. All authors have read and agreed to the published version of the manuscript.
Funding
This research was funded by National Natural Science Foundation of China (52265039), Xi’an Jiao tong University State key laboratory for manufacturing systems engineering open Project Research Fund (sklms2019012), Xinjiang Uygur Autonomous Region Natural Science Foundation (2019D01C029) and Xinjiang University Doctoral Startup Fund (XJDXBS2019001).
Institutional Review Board Statement
Not applicable.
Informed Consent Statement
Not applicable.
Data Availability Statement
Not applicable.
Acknowledgments
The support from the Xinjiang Institute of Ecology and Geography, CAS, China, is gratefully acknowledged. The authors would like to thank the reviewers and editor for their valuable feedback which helped to improve the quality of this paper.
Conflicts of Interest
The authors declare no conflict of interest.
References
- Liu, L.; Bo, T. Effects of checkerboard sand barrier belt on sand transport and dune advance. Aeolian Res. 2020, 42, 100546. [Google Scholar] [CrossRef]
- Zhang, P.; Sherman, D.J.; Li, B. Aeolian creep transport: A review. Aeolian Res. 2021, 51, 100711. [Google Scholar] [CrossRef]
- Zhao, M.; Zu, R.; Wang, J.; Tan, L. Grain size characteristics of sediment along the Hami-Lop Nor Railway. J. Desert Res. 2021, 41, 19. [Google Scholar]
- Dun, H.; Xin, G.; Huang, N.; Shi, G.; Zhang, J. Wind-Tunnel Studies on Sand Sedimentation Around Wind-Break Walls of Lanxin High-Speed Railway II and Its Prevention. Appl. Sci. 2021, 11, 5989. [Google Scholar] [CrossRef]
- Huang, N.; Gong, K.; Xu, B.; Zhao, J.; Dun, H.; He, W.; Xin, G. Investigations into the law of sand particle accumulation over railway subgrade with wind-break wall. Eur. Phys. J. E 2019, 42, 145. [Google Scholar] [CrossRef]
- Bruno, L.; Horvat, M.; Raffaele, L. Windblown sand along railway infrastructures: A review of challenges and mitigation measures. J. Wind. Eng. Ind. Aerodyn. 2018, 177, 340–365. [Google Scholar] [CrossRef]
- Horvat, M.; Bruno, L.; Khris, S.; Raffaele, L. Aerodynamic shape optimization of barriers for windblown sand mitigation using CFD analysis. J. Wind. Eng. Ind. Aerodyn. 2020, 197, 104058. [Google Scholar] [CrossRef]
- Lima, I.A.; Araújo, A.D.; Parteli, E.J.; Andrade, J.S.; Herrmann, H.J. Optimal array of sand fences. Sci. Rep. 2017, 7, 45148. [Google Scholar] [CrossRef]
- Horvat, M.; Bruno, L.; Khris, S. CWE study of wind flow around railways: Effects of embankment and track system on sand sedimentation. J. Wind. Eng. Ind. Aerodyn. 2021, 208, 104476. [Google Scholar] [CrossRef]
- Song, Y.; Zhang, M.; Øiseth, O.; Rønnquist, A. Wind deflection analysis of railway catenary under crosswind based on nonlinear finite element model and wind tunnel test. Mech. Mach. Theory 2022, 168, 104608. [Google Scholar] [CrossRef]
- Sarafrazi, V.; Talaee, M.R. Simulation of wall barrier properties along a railway track during a sandstorm. Aeolian Res. 2020, 46, 100626. [Google Scholar] [CrossRef]
- Li, B.; Sherman, D.J. Aerodynamics and morphodynamics of sand fences: A review. Aeolian Res. 2015, 17, 33–48. [Google Scholar] [CrossRef]
- Xin, G.; Huang, N.; Zhang, J.; Dun, H. Investigations into the design of sand control fence for Gobi buildings. Aeolian Res. 2021, 49, 100662. [Google Scholar] [CrossRef]
- Fang, H.; Wu, X.; Zou, X.; Yang, X. An integrated simulation-assessment study for optimizing wind barrier design. Agric. For. Meteorol. 2018, 263, 198–206. [Google Scholar] [CrossRef]
- Cornelis, W.; Gabriels, D. Optimal windbreak design for wind-erosion control. J. Arid. Environ. 2005, 61, 315–332. [Google Scholar] [CrossRef]
- Papesch, A. Wind tunnel test to optimize barrier spacing and porosity to reduce wind damage in horticultural shelter systems. J. Wind. Eng. Ind. Aerodyn. 1992, 44, 2631–2642. [Google Scholar] [CrossRef]
- Wu, X.; Zou, X.; Zhang, C.; Wang, R.; Zhao, J.; Zhang, J. The effect of wind barriers on airflow in a wind tunnel. J. Arid. Environ. 2013, 97, 73–83. [Google Scholar] [CrossRef]
- Kim, R.-W.; Lee, I.-B.; Kwon, K.-S.; Yeo, U.-H.; Lee, S.-Y.; Lee, M.-H. Design of a windbreak fence to reduce fugitive dust in open areas. Comput. Electron. Agric. 2018, 149, 150–165. [Google Scholar] [CrossRef]
- Bo, T.-L.; Zheng, X.-J.; Duan, S.-Z.; Liang, Y.-R. The influence of wind velocity and sand grain diameter on the falling velocities of sand particles. Powder Technol. 2013, 241, 158–165. [Google Scholar] [CrossRef]
- Wang, T.; Qu, J.; Niu, Q.; An, Z.; Gao, Y.; Wang, H.; Niu, B. Aerodynamic Properties and Shelter Effects of a Concrete Plate-Insert Sand Fence Along the Lanzhou-Xinjiang High-Speed Railway in Gobi Regions Under Strong Winds. Front. Environ. Sci. 2022, 10, 491. [Google Scholar] [CrossRef]
- Yan, M.; Wang, H.; Zuo, H.; Li, G. Wind tunnel simulation of an opencut tunnel airflow field along the Linhe-Ceke Railway, China. Aeolian Res. 2019, 39, 66–76. [Google Scholar] [CrossRef]
- Raffaele, L.; van Beeck, J.; Bruno, L. Wind-sand tunnel testing of surface-mounted obstacles: Similarity requirements and a case study on a sand mitigation measure. J. Wind. Eng. Ind. Aerodyn. 2021, 214, 104653. [Google Scholar] [CrossRef]
- Wang, T.; Qu, J.; Niu, Q. Comparative study of the shelter efficacy of straw checkerboard barriers and rocky checkerboard barriers in a wind tunnel. Aeolian Res. 2020, 43, 100575. [Google Scholar] [CrossRef]
- Wang, T.; Qu, J.; Ling, Y.; Liu, B.; Xiao, J. Shelter effect efficacy of sand fences: A comparison of systems in a wind tunnel. Aeolian Res. 2018, 30, 32–40. [Google Scholar] [CrossRef]
- Mehdipour, R.; Baniamerian, Z. A new approach in reducing sand deposition on railway tracks to improve transportation. Aeolian Res. 2019, 41, 100537. [Google Scholar] [CrossRef]
- Jiang, Y.; Gao, Y.; Dong, Z.; Liu, B.; Zhao, L. Simulations of wind erosion along the Qinghai-Tibet Railway in north-central Tibet. Aeolian Res. 2018, 32, 192–201. [Google Scholar] [CrossRef]
- Chepil, W.; Woodruff, N. The physics of wind erosion and its control. Adv. Agron. 1963, 15, 211–302. [Google Scholar]
- Tang, Y.-L.; An, Z.-S.; Zhang, K.-C.; Tan, L.-H. Wind tunnel simulation of windbreak effect of single-row shelter belts of different structure. J. Desert Res. 2012, 32, 647–654. [Google Scholar]
- Zhao, W.; Hu, G.; Zhang, Z.; He, Z. Shielding effect of oasis-protection systems composed of various forms of wind break on sand fixation in an arid region: A case study in the Hexi Corridor, northwest China. Ecol. Eng. 2008, 33, 119–125. [Google Scholar] [CrossRef]
- Liu, H.; Hou, Z.; Chen, Z.; Wu, P.; Xuan, C.; Wang, H. Effects of standing stubble on the interception of soil erosion particles. Land Degrad. Dev. 2019, 30, 328–336. [Google Scholar] [CrossRef]
- Cheng, J.-J.; Lei, J.-Q.; Li, S.-Y.; Wang, H.-F. Disturbance of the inclined inserting-type sand fence to wind–sand flow fields and its sand control characteristics. Aeolian Res. 2016, 21, 139–150. [Google Scholar] [CrossRef]
Disclaimer/Publisher’s Note: The statements, opinions and data contained in all publications are solely those of the individual author(s) and contributor(s) and not of MDPI and/or the editor(s). MDPI and/or the editor(s) disclaim responsibility for any injury to people or property resulting from any ideas, methods, instructions or products referred to in the content. |
© 2023 by the authors. Licensee MDPI, Basel, Switzerland. This article is an open access article distributed under the terms and conditions of the Creative Commons Attribution (CC BY) license (https://creativecommons.org/licenses/by/4.0/).