Abstract
In the last few years, several mainshock–aftershock sequences have demonstrated their effects on structures; especially after the occurrence of an earthquake with high magnitude, the number of aftershocks tends to increase. For this reason, several studies have been oriented to estimate the influence of aftershocks on the structural response, most of them in terms of peak or residual displacement; however, energy plays an important role for long-duration earthquakes. In this paper, several bilinear SDOF systems with different post-yielding stiffness are subjected to long-duration seismic sequences, considering different levels of intensity of the aftershocks with the aim to compute constant-ductility spectra for input energy (EI), hysteretic energy (EH) and the ratio between them (EH/EI). The results suggest that although the energy demands tend to increase as the intensity of the aftershock increases, it is observed that the ratio of input and hysteretic energy is very similar for the selected aftershock intensity levels; hence, analytical equations to predict this ratio are proposed. The equations can be used toward earthquake-resistant energy-based design of buildings.
1. Introduction
Earthquakes are one of the most destructive natural hazards around the world; in particular, it is commonly suggested that the mainshock is responsible for the structural damage to buildings. For this reason, there are several approaches regarding the structural response or design of buildings under earthquakes. However, in recent decades, the most important and destructive earthquakes presented significant seismic sequences, consisting of a mainshock and aftershocks, where the aftershocks had higher than usual seismic intensities [1,2]. In addition to the main event, aftershocks also produced considerable damage to structures. In certain cases, the consequences were a state of irreparable damage or collapse of the buildings [3,4]; moreover, buildings that were apparently intact after the mainshock were damaged by aftershocks [5,6,7]. Aftershocks constitute one of the greatest hazards after the mainshock; for this reason, it is important that earthquake-resistant design regulations and codes take these seismic sequences into account when providing guidelines for building design. Currently, only the mainshock is considered in the structural design; hence, the number of aftershocks and their magnitude are not taken into account in the development of seismic design spectra, and in general, they are not considered in the estimation of seismic demands [8,9,10]. Recently, several researchers have discussed the importance of taking into account the seismic sequences for the structural response or seismic design of buildings [11,12,13,14,15]. In fact, the concept of survival analysis [16,17] has been used in studies related to infrastructure subjected to mainshock or to seismic sequences [18,19,20].
Due to the consequences of the aftershocks for old and new buildings, it is important that the seismic sequences in design regulations should be considered implicitly or explicitly, taking into account the cumulative damage to structures [5]. The most commonly used parameters in building regulations and codes are pseudo-acceleration and maximum relative displacements [21,22]. However, with the use of energy concepts, a more rational and adequate representation of the damage accumulated by the effect of seismic sequences on buildings could be given.
Design methodologies based on energy concepts focus on the structure having an energy dissipation capacity equal to or greater than the total energy demand [23,24,25]. One of the parameters used to measure the energy demands in a structure is the hysteretic energy (EH) since it is directly related to the accumulated damage and can be interpreted as the total area under all the hysteresis cycles that a structure suffers during a ground motion [26,27]. There are several procedures for determining the EH, one of which is through the ratio of the hysteretic energy and the inelastic input energy (EH/EIμ) based on an inelastic input energy spectrum (EIμ). The EH/EIμ ratio has been shown to be one of the most stable parameters for the determination of EH, since its values present a very low dispersion with coefficients of variation (CV) approximately equal to 0.1 [28]. Researchers over the years have proposed various expressions for the EH/EIμ ratio based on various structural parameters [28,29,30,31]; the ratio has presented a very particular characteristic in the spectral shape, which is the almost linear trend in most of all the interval periods. Although the spectral shape is almost linear, the values of the order are directly influenced by some structural parameters, among the most important are the ductility and the damping parameter.
As it is well known, several expressions have been developed to obtain the EH/EIμ ratio [32,33,34]; however, these are valid only for systems subjected to mainshocks. For this reason, the objective of this work is to obtain an expression to estimate the EH/EIμ ratio for nonlinear single-degree-of-freedom (SDOF) systems that contemplates the effect of aftershocks and different structural characteristics, which will be used to calculate the energy demands (EH), with the help of an EIμ spectrum toward future energy-based seismic design regulations. It is important to say that in the case of structures subjected to a single seismic event, the energy ratio is very uniform along all the structural vibration periods. For this reason, the basic hypothesis of this work is that there is not a strong period dependency of the energy ratio for nonlinear structures subjected to seismic sequences. Thus, simplified equations can be proposed to compute the energy ratio of structures under seismic sequences. In addition, at the end of the present work, in order to observe the energy ratio in complex structures, the EH/EIμ is assessed for a 10-story reinforced-concrete building subjected to several seismic sequences. The preliminary results indicate that the influence of the aftershock in the estimation of the energy ratio is negligible for multi-degree-of-freedom (MDOF) structures.
2. Seismic Sequences
Earthquakes are natural phenomena that come in groups; the earthquake of the greatest magnitude is called the mainshock, any earthquake before this one is called a foreshock and those that occur after the mainshock are named aftershocks, all separated by a time interval and caused by a single event or seismic fault [35,36]. There is general agreement that aftershocks are triggered by stress changes of some sort induced by rupture of the mainshock [37,38]. In general, large earthquakes are followed by an increase in seismic activity, producing several aftershock sequences, which can continue for weeks, months or even years [39,40], and, in general, with a larger mainshock, the aftershocks tend to increase and get stronger. The size, duration, and frequency regularly decay over time [41,42]. Large aftershocks have shown the existence of secondary aftershock activities, that is, the fact that aftershocks can have their own aftershocks, such as the Big Bear event with a magnitude of 6.5 Mw, which is considered an aftershock of the main event in Landers, California, in 1992, and which clearly triggered its own aftershocks [40]. In addition, in some seismic events, the location of the aftershock was closer to the site of interest than the main event, causing equal or even more severe shaking, that is, presenting seismic intensities equal to or greater than those produced by the main event [43,44].
The first formal study of aftershocks was conducted by Omori in 1894 [45,46] for the 1891 earthquake in Mino and Owari in the Nobi Plain, Japan. He found that more than 3000 aftershocks were recorded in a period of 26 months after the earthquake, and his observations led him to postulate the law called “Omori’s law”, which shows that the frequency of aftershocks disappears hyperbolically after the main earthquake. Another contribution in terms of aftershocks was the well-known law of Bath [47], proposed in the 1950s, which establishes that the largest aftershock has a magnitude that is usually approximately 1.2 times smaller than that of the main earthquake, regardless of its magnitude [47,48,49]. On the other hand, until the early 1990s, aftershocks were believed to occur within a zone of one to two lengths from the major fault to the hypocenter of the main event. In 1992, researchers found that the Landers event in California triggered seismicity over distances greater than twice the length of the fault [50]. Since then, several earthquakes of magnitudes between 2 and 9 Mw have been shown to trigger earthquakes at distances of up to tens of main shock fault lengths [51]. These observations have generated a controversy regarding whether earthquakes triggered at distances twice or greater than the length of the fault are regular aftershocks, that is, generated by the same physical process as the main events, or whether they represent a separate phenomenon [52,53].
Although there are many questions about the physics of aftershocks that remain unresolved [54,55,56], the objective of this work is focused on measuring the amount of accumulated damage that seismic sequences can cause in buildings, since in important seismic events, the aftershocks are likely to have significant seismic intensities that result in structural damage, property loss and injury or death to building occupants, as can be seen in Table 1 with past seismic events. Due to this, it is important to consider seismic sequences in seismic-resistant design, taking into account parameters that better relate the amount of accumulated damage of structures over time. Currently, the design parameters that govern the building construction codes do not take into account the cumulative damage that a structure presents when it is subjected to a set of seismic sequences, in such a way that through seismic energy concepts, a better representation could be given, as suggested by Terán and Bojórquez, among others [26,27].

Table 1.
Severe seismic events and their aftershocks.
3. Seismic Energy Concepts
One of the first researchers who began the study of energy concepts in seismic design was Housner in 1956 [57]; he proposed a design methodology based on seismic energy, which consists of providing the structure with a dissipation capacity equal to or greater than the expected energy demand. This approach was ignored for approximately a quarter of a century due to the complexity involved in quantifying both demands and seismic energy capacity. Already with the development of new tools, Zahrah in 1982 and Hall in 1984 [58,59] calculated elastic input energy (EI) and EIμ spectra for SDOF systems and for multi-degree-of-freedom (MDOF) systems, among other contributions. Later, in 1985, Akiyama increased interest in energy-based seismic design, providing new energy concepts, among which the expression to obtain EI/m and EH/EI stand out [29].
Another important contribution was proposed by Uang and Bertero in 1988 [60,61]; they introduced two new energy concepts, relative energy and absolute energy, derived from the conventional energy balance equation. This criterion has largely gained ground until today and basically consists of emphasizing the difference that exists in the amount of energy measured by the relative and absolute displacement with respect to the ground. In this approach, the damping energy (ED), the deformation energy (ES) and the EH will not change in value regardless of the energy approach that is being used (absolute or relative). Thus, the kinetic energy (EK) and the energy of total input (EI or EIμ) will take different values depending on the approach used. Although the relative energy and the absolute energy are different theoretically, the values are very similar to each other; the difference lies mainly in periods that are too short (T < 0.2 s) and too long (T > 7 s). The relative energy approach is used in this study, which is presented below.
In the study of an SDOF system under an earthquake ground motion, as shown in Figure 1, the equation of motion used in order to obtain the energy expressions is as follows:
where is the relative displacement of the system with respect to the ground, is the absolute displacement, is the relative velocity, (t) is the relative acceleration, m is the structure mass, k is the stiffness of the system, c is the viscous damping coefficient, fs(x,) is the restoring force, (t) is the ground displacement, is the ground acceleration and t represents the time.
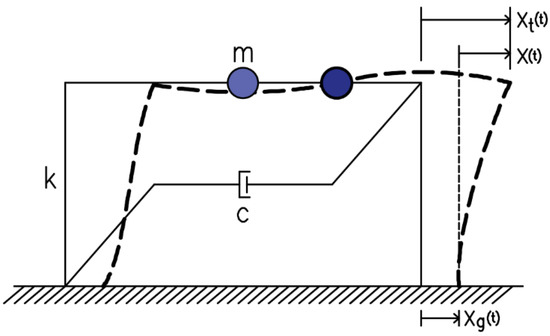
Figure 1.
Representation of a single-degree-of-freedom system.
The energy relative-balance equation is derived by directly integrating of the equation of motion with respect to the relative displacement response of the system. Integrating all elements in Equation (1), the following equation is obtained:
Then, Equation (2) can be written as follows:
Equation (3) represents the energy balance in a structure. The term is the kinetic energy, is the damping energy, are the elastic-strain energy and hysteretic energy and is the seismic input energy. A well-designed and -constructed structure must be capable of absorbing and dissipating the full input energy imparted by seismic sequences with as little damage as possible. Therefore, the design requirements of a structure in terms of energy can be defined as shown in Equation (4).
Energy Capacity ≥ Energy Demand
The implementation of the energy approach in earthquake-resistant design requires the estimation of both the demand and the capacity of seismic energy in the structures. Although experimental tests are required to obtain the energy capacity of an individual member or structure, there is still uncertainty in estimating the global capacity of buildings [28]. On the other hand, the seismic energy demand depends both on the characteristics of the earthquake and on the structural properties, that is, structures with different stiffness and resistance properties will present different seismic energy demands in the same seismic event [59]. The term directly related to accumulated plastic deformation demand and to the structural damage is EH. The dissipated hysteretic energy can be interpreted physically by considering that it is equal to the area enclosed by each of the hysteresis loops that the structure develops during a seismic excitation. Therefore, it is convenient to express the energy demand in terms of EH.
4. Ratio EH/EI
One of the ways of estimating the EH is through the EH/EIμ ratio concept with the support of an EIμ design spectrum. Due to the importance of this ratio, a large amount of the literature has been oriented toward this issue; in fact, various equations have been proposed to compute the energy ratio of nonlinear structures under mainshock events, as can be observed in Table 2.

Table 2.
Studies related with proposed equations of the EH/EI ratio.
Although the previous expressions about the EH/EIμ ratio are useful in order to compute EH demands, all of them are obtained from nonlinear dynamic analyses of seismic records that consider only mainshocks. For this reason, they do not consider the effect of aftershocks. Furthermore, even if EH is a parameter that adequately rationalizes the accumulated damage of the mainshocks, in the literature, there is no explicit consideration of the seismic sequences in the assessment of the EH/EIμ ratio that could probably lead to an underestimation of the energy demands in buildings. For this reason, the objective of this study is to propose an equation to estimate the EH/EIμ ratio considering different aftershock intensities and different resistance and damping properties for the nonlinear SDOF structures toward energy-based design of buildings under seismic sequences.
5. Selection of the Structural Models
For the present study, three hysteretic behaviors are considered for the nonlinear models based on different levels of post-yielding stiffness. The first structural model selected corresponds to the elastoplastic perfect hysteretic behavior (see Figure 2a), this model can exhibit a linear elastic behavior until a value of strength called the yielding point and then behaves in a plastic mode until a maximum displacement is obtained. In addition, two bilinear models with different post-yielding stiffness levels corresponding to 3 and 5% have been selected (see Figure 2b,c). Note that in this figure, F corresponds to the force, k to the stiffness and D indicates displacement of the system, while fy and dy are the force and displacement, respectively, at yielding. Once the structural models have been selected, the nonlinear dynamic analyses for SDOF systems are carried out. These were developed with seismic sequences selected from earthquake ground motions of Mexico City obtained from soft-soil sites.
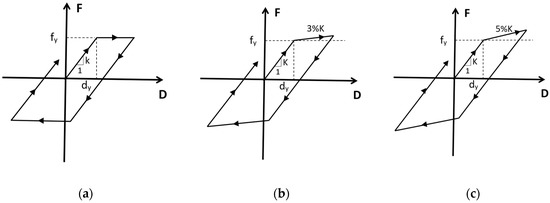
Figure 2.
Hysteretic model and cyclic responses of the three analyzed systems; the nonlinear models correspond to: (a) elastoplastic, (b) bilinear with 3% post-yielding stiffness and (c) bilinear with 5% post-yielding stiffness.
6. Seismic Sequences Used
In this study, artificial seismic sequences will be used that will be made up of real seismic records of Mexico City from the 1985 seismic event, where only one destructive aftershock was recorded on soft soil, according to the catalog of the Mexican Earthquake Database [65]. This seismic sequence was recorded at the “Central de Abastos” (CDAF) on 19 September (mainshock) and 20 September (aftershock). In the present study, the artificial sequences will be generated from simulating the characteristics of this seismic sequence, since there is no representative number of new aftershocks in soft soil. There are two criteria used for the generation of artificial seismic sequences: repeated and random. In this study, the random method has been used, since this method allows the permutation of records as mainshocks or aftershocks but never their repetition in a single combination, as occurs in the repeated method.
An important parameter in a seismic event is the maximum velocity. For this reason, the mainshock–aftershock velocity ratio is of great importance and will be the basis of the scaling method. In these sequences, there is a velocity ratio of approximately 0.35. The characteristics of the seismic sequences of the CDAF station are shown in Table 3.

Table 3.
Characteristics of the CDAF station sequences (19–20 September 1985).
For the generation of the artificial sequences, earthquakes recorded in soft soil with values similar to those of the CDAF sequence were selected from the catalog of seismic records available in the Mexican Strong Earthquake Database. Eight seismic records were selected, where four have similar periods (3 s) to the mainshock of the real sequence; these were used as mainshocks of the artificial sequences. The remaining four have periods close to 2.3 s, similar to that of the aftershock of the real sequence. The eight records were used as aftershocks. Table 4 shows the characteristics of the seismic records used. In this table, PGA and PGV represents the peak ground acceleration and velocity respectively, while Tg is the soil period.

Table 4.
Characteristics of the records used to generate the artificial sequences.
All records used in this study were scaled. The scaling criterion was based on the maximum velocity recorded in the acceleration history of the SCT station corresponding to the EW component, obtained on 19 September 1985 during the earthquake in Mexico City.
The procedure used is shown below:
- First, the eight records were integrated to obtain their velocity history, then the maximum velocity per record was obtained.
- In a similar way, the maximum velocity of the earthquake recorded at the SCT station was obtained and divided by each of the maximum velocities of the records, thus obtaining eight scale factors.
- Velocity histories were multiplied by the corresponding scale factors.
- Velocity histories were derived by the particular scale factors.
- Finally, the velocity histories were derived to obtain an acceleration history, that is, a scaled record.
In order to evaluate the influence of aftershocks, three groups of seismic sequences have been used in this study, each group consists of 28 sequences:
- The sequences of the first group (A) were constituted with mainshocks and aftershocks scaled at 100% (γ = 1.0) of the maximum velocity of the seismic record obtained at the SCT station (61,414 cm/s). Note that γ is defined as the PGVA/PGVM peak ground velocity of the mainshock and peak ground velocity of the aftershock ratio.
- The sequences of the second group (B) were formed with mainshocks scaled at 100% and aftershocks scaled at 70% (γ = 0.7) of the maximum velocity of the seismic record obtained at the SCT station (42.86 cm/s).
- The sequences of the third group (C) were formed with mainshocks scaled at 100% and aftershocks scaled at 35% (γ = 0.35) of the maximum velocity of the seismic record obtained at the SCT station (21.4 cm/s).
The combinations of the records to create the seismic sequences were carried out considering the four records with periods similar to the period of the mainshock of the real sequence as the mainshock and the total of the eight records as aftershocks. It is important to indicate that a seismic sequence will not be composed by the same record as mainshock and aftershock. Figure 3 shows an arrangement of the approach used to combine the records that produce a seismic sequence.
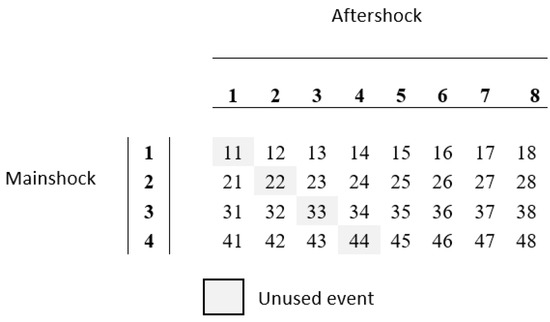
Figure 3.
Combination scheme for the generation of the artificial sequences.
The nomenclature used for the artificial sequences obtained is given by the combination of seismic records used and their scaling percentage. For example, group B seismic record MS4A5 is the seismic sequence formed by mainshock 4 (of four possible) and aftershock 5 (of eight possible); since it belongs to group B, aftershock 5 has been scaled to 70% of the maximum velocity of the original seismic record. Figure 4 shows a combination of mainshock 1 and aftershock 2 for all three escalation groups.
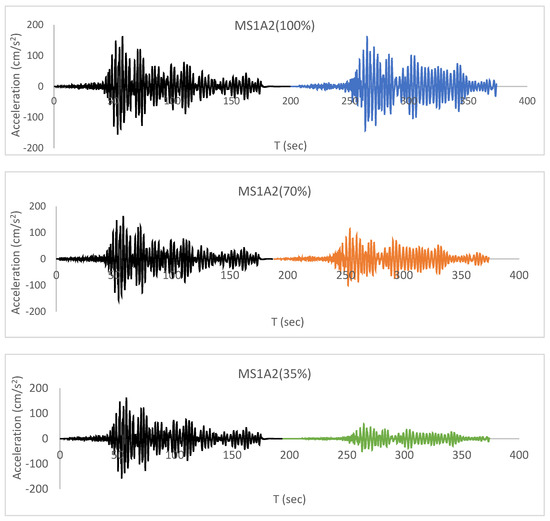
Figure 4.
MS1A2 seismic sequence for the different scaling percentages.
Finally, it is important to say that the ground motion earthquakes were selected from soft soil because, as it was observed in previous works, the energy demands in buildings located on soft soil are significantly larger in comparison with structures located on stiff soil. Nevertheless, note that different properties of the soil would affect the results of the present research. In other words, future studies will be necessary to propose equations to compute the energy ratio of nonlinear structures located on soils with different properties. In the case of Mexico City soft soil, it is interesting to observe the effect of the narrow-band motions; in particular, note that structures with a vibration period similar to the soil period could receive a large amount of energy. Figure 5 illustrates the Fourier spectrum for the well-known 1985 Mexican earthquake recorded at the SCT station. Note the narrow band of the spectrum and the large amplitude in frequency values around 0.5.
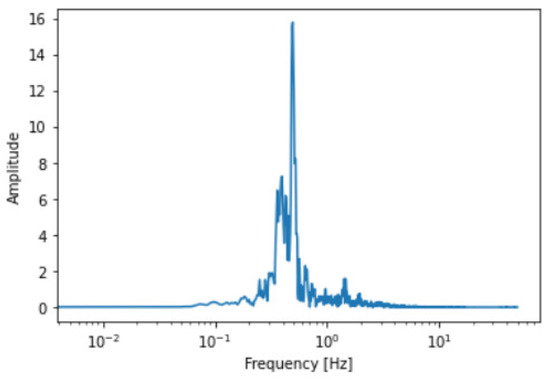
Figure 5.
Fourier spectrum for the 1985 Mexican earthquake recorded on soft soil (SCT station).
7. Numerical Results
In order to study the influence of seismic sequences on energy demands and to provide an expression that determines the EH/EIμ ratio that considers the effect of aftershocks and various structural parameters, the response and average spectra of the EI, EIμ and EH were calculated to subsequently obtain the spectra of the EH/EIμ ratio. To compute these spectra, dynamic analyses of nonlinear oscillators subjected to three groups of seismic sequences with different aftershock intensities (γ = 1.0, γ = 0.7 and γ = 0.35) and different structural characteristics were used, such as the structural model (elastoplastic, bilinear 3% and 5% post-yielding stiffness), ductility (μ = 2, μ = 4 and μ = 6) and damping coefficients as a percentage of the critical damping (ξ = 2%, ξ = 5% and ξ = 10%). Note that all the energy parameters are normalized by the mass of the system. It is important to say that the numerical method used to compute the nonlinear response (nonlinear spectra) corresponds to the Newmark approach, considering a timestep of 0.01 sec and coefficients γN = 1/2 and βN = 1/6 (linear acceleration; the N was used to indicate Newmark). Furthermore, in the case of the nonlinear spectra, an iterative procedure to get the ductility wanted was used, where the ductility is defined as the ratio of the maximum displacement divided by the yielding displacement.
7.1. Elastic Energy Spectra
Twenty-eight response spectra were calculated for each of the three groups of seismic records and the three damping coefficients previously indicated; thus, a total of 252 spectra were obtained. The average spectra of the 28 seismic sequences for each group were computed. A total of nine average spectra were obtained, which are shown in Figure 6a (spectra with ξ = 2%), Figure 6b (ξ = 5%) and Figure 6c (ξ = 10%). In each figure, there are three spectra with different aftershock intensities (γ = 1.0, γ = 0.7 and γ = 0.35) in order to show their influence on energy demands. Note that there is a lot of similarity between each spectrum, where two important characteristics are observed. The first occurs in very short periods (T < 0.5 s) and long periods (T > 5.0 s) where the EI values are low and tend to zero for all spectra regardless of the parameters used. In other words, structures with short or very long periods will present a very low energy demand regardless of the structural characteristics or the seismic intensity. The other behavior occurs in the threshold of periods from 1.0 to 4.0 s, where the spectra present a single maximum plateau with different values in the spectral ordinate that depend directly on the intensity of the aftershock or the damping coefficient. In particular, the large energy demands occur when the structural period is very similar to the soil period. This conclusion is valid for all the structural models, damping ratios and intensities of the aftershock. On the other hand, as expected, the intensity of the aftershocks increases the demand for EI. For example, for the maximum ordinate of the spectrum of the group with γ = 1.0, the value is approximately 50% higher than the ordinate of the group of γ = 0.35; however, in the period intervals from 2 to 2.5 s, the difference can grow up to three times more, regardless of the damping coefficient used. For ξ = 5% (Figure 6b) and a period of T = 2.4 s, the EI for a spectrum with records of γ = 1.0 has a value of 400,000 cm2/s2 while for records of γ = 0.35 reaches the value of 150,000 cm2/s2, thus evidencing the large amount of energy that seismic sequences can produce on buildings with certain structural characteristics. On the other hand, the damping coefficient also has great influence on the spectral ordinate. It is observed that as the damping coefficient decreases, EI increases. In Figure 6a, the value of the maximum ordinate of the spectrum for ξ = 2% and γ = 1.0 has a value of 530,000 cm2/s2, which is 1.5 times greater with respect to the ordinate of the spectrum that has ξ = 10% and γ = 1.0, with a value of 330,000 cm2/s2 that can be seen in Figure 6c. These results are very similar to those obtained in other investigations that do not consider records with seismic sequences [28,29,30,66,67,68,69]. Finally, Figure 7 shows the average and min–max plot of the input energy spectra for a damping ratio of 5% and the three level of intensities for the aftershock. Note that there is not a large uncertainty; in addition, a similar spectral shape is observed for the three curves.
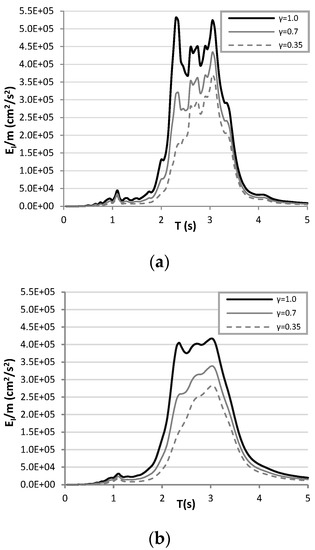
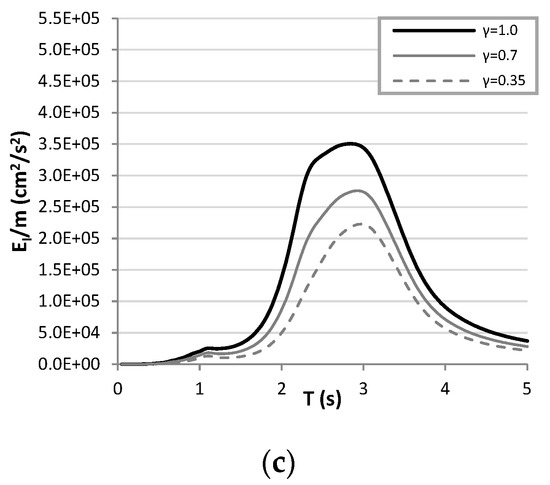
Figure 6.
Average spectra of EI for different aftershock magnitudes, γ = 1.0, γ = 0.7 and γ = 0.35, and different damping coefficients, (a) ζ = 2%, (b) ζ = 5% and (c) ζ = 10%.
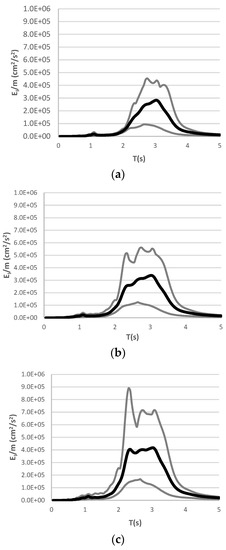
Figure 7.
Maximum, minimum and average EI spectra for different aftershock intensities, (a) γ = 0.35, (b) γ = 0.7 and (c) γ = 1.0, calculated from the twenty-eight EI spectra with a damping coefficient ζ = 5%.
7.2. Inelastic Energy Spectra
The EIμ spectra were calculated with the aim of studying the energy demands in the inelastic range. A total of 2268 response spectra and 81 average spectra were obtained with the seismic records and structural characteristics indicated above. A total of twenty-seven average spectra were plotted (Figure 8, Figure 9 and Figure 10), where it can be seen that their spectral shape is very similar to that of the EI spectra throughout the period interval, i.e., with a maximum plateau at the threshold of the ground period and with values equal to zero in very short or long periods. As in the case of EI, the aftershocks again showed a great influence on the energy demands, increasing the demand as the seismic intensity also increases. For example, the value of the EIμ for intensities of γ = 1.0 is almost two times at its maximum peak with respect to the aftershocks of γ = 0.35, as can be seen in Figure 8a–c for an elastoplastic model with a ductility value of 2 and different damping ratios, in such a way that the potential of aftershocks in the amount of inelastic energy is very important.
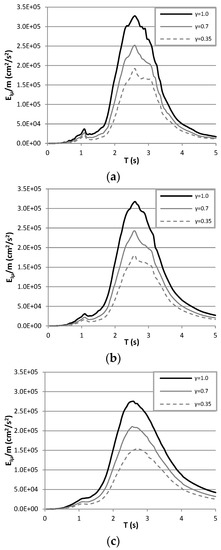
Figure 8.
Average spectra of EIμ for different aftershock intensities, γ = 1.0, γ = 0.7 and γ = 0.35, and different damping coefficients, (a) ζ = 2%, (b) ζ = 5% and (c) ζ = 10%, calculated from the twenty-eight EIμ spectra with a ductility μ = 2 and an elastoplastic model.
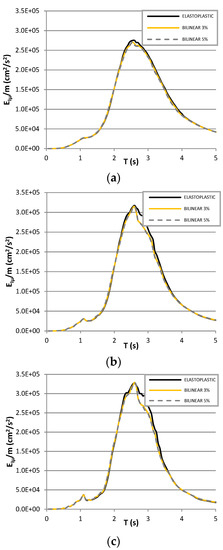
Figure 9.
Average spectra of EIμ for different damping coefficients of (a) ζ = 2%, (b) ζ = 5% and (c) ζ = 10%, with an elastoplastic hysteretic model, bilinear 3% and 5% post-yielding stiffness, calculated from the twenty-eight EIμ spectra with an aftershock magnitude of γ = 1.0 and a ductility of μ = 2.
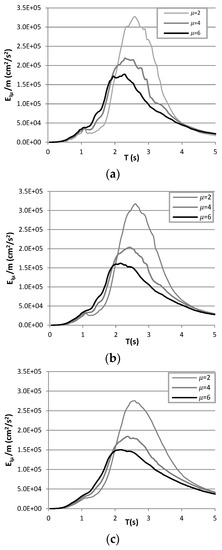
Figure 10.
Average spectra of EIμ with different ductility values μ = 2, μ = 4 and μ = 6 and different damping coefficients of (a) ζ = 2%, (b) ζ = 5% and (c) ζ = 10%, calculated from the twenty-eight EIμ spectra with an aftershock magnitude of γ = 1.0 and the elastoplastic model.
Of the structural characteristics used in the analyses, the hysteretic model does not represent a parameter that influenced the energy demands. It can be seen in more detail in the spectra of Figure 9a–c, where it is observed in each figure that the three spectra for the models—elastoplastic, bilinear 3% and 5% of post-yielding stiffness—are quite similar in their shape and spectral ordinates, concluding that post-yielding stiffness did not represent a dominant parameter in the demands of EIμ.
In Figure 10a–c, the influence of ductility is studied, where it is observed that two important trends stand out both in the shape and in the spectral ordinate. The first is in the period interval of approximately 1 to 2 s, where as the ductility increases, the EIμ will have a greater demand; the second is shown in the interval period from 2 to 4 s, where it is observed that as the ductility increases, the EIμ decreases, i.e., it will have a lower energy demand in a proportion of almost double, demonstrating that the ductility variable plays an important role in the energy demands. The other structural parameter analyzed is the damping coefficient, which showed less influence on the demand for EIμ with respect to EI; this is due to the fact that in the inelastic range, the EH has a preponderant value in the total input energy (see Equation (4)). On the other hand, in the elastic range, it is equal to zero, and the ED at the end of the seismic movement is equal to EI. Although its influence is less in EIμ, the characterization is the same as in the case of EI; the damping coefficient decreases as the EIμ value increases, as can be seen in each of Figure 8, Figure 9 and Figure 10. Finally, as in the case of the elastic input energy, peak values of the inelastic input energy are observed when the structural periods are very close to the soil period. Finally, the average values including the max–min plot are observed in Figure 11, for a ductility value of 4, damping ratio of 5% and the elastoplastic hysteretic model.
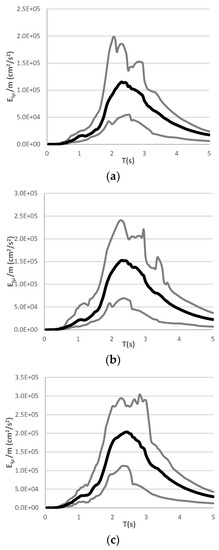
Figure 11.
Maximum, minimum and average EIμ spectra for different aftershock intensities of (a) γ = 0.35, (b) γ = 0.7 and (c) γ = 1.0, calculated from the twenty-eight EIμ spectra with a ductility value of μ = 4, the elastoplastic model and a damping coefficient of ζ = 5%.
7.3. Hysteretic Energy Spectra
In order to discuss the hysteretic energy spectra results, the same parameters selected as in the case of input energy were selected. Thus, a total of 2268 hysteretic energy response spectra and 81 average spectra were computed. From the total average spectra, only 12 were plotted, which are shown in Figure 12, Figure 13, Figure 14 and Figure 15. Studying the spectra in a general way, a similar shape is observed in comparison with the EI and EIμ spectra. In fact, the maximum values also are presented for structural periods close to the soil period. Regarding the energy demands, the effect of the aftershocks, as in the case of EI and the EIμ, once again showed a great dominance in the energy demands, increasing the amount of seismic energy as the intensity of the aftershock also increases, as can be seen in Figure 12. For example, the EH value for aftershocks with a magnitude of γ = 1.0 was almost double with respect to γ = 0.35, thus proving the large amount of energy that an important aftershock can produce in buildings and hence the importance of considering seismic sequences for earthquake-resistant design.
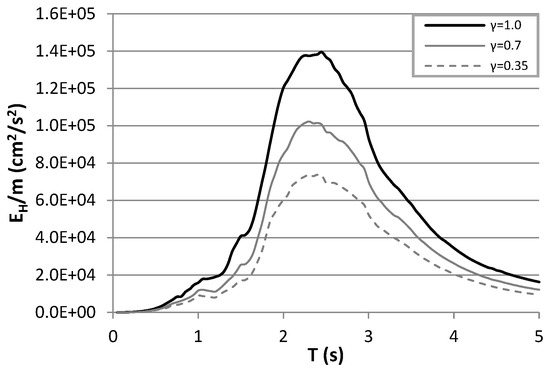
Figure 12.
Average spectra of EH for the elastoplastic hysteretic model, with a ductility of μ = 4, aftershock magnitudes of γ = 0.35, γ = 0.7 and γ = 1.0 and a damping coefficient of ζ = 5%.
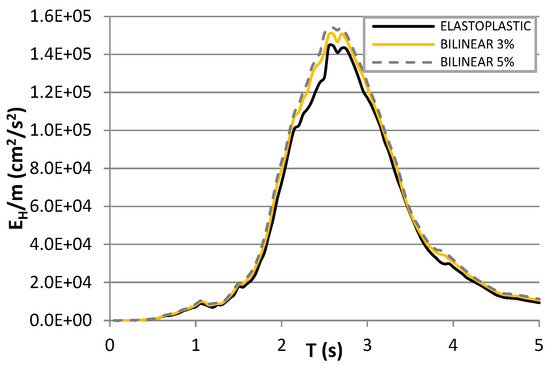
Figure 13.
Average spectra of EH for elastoplastic hysteretic, bilinear 3% and 5% post-yielding models, with a ductility of μ = 2, an aftershock magnitude of γ = 1.0 and a damping coefficient of ζ = 5%.
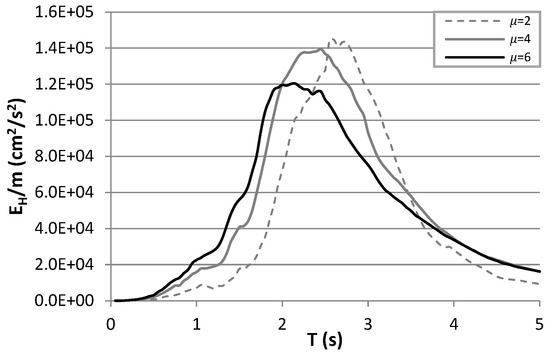
Figure 14.
Average spectra of EH for ductility values μ = 2, μ = 4 and μ = 6, with the elastoplastic hysteretic model, an aftershock magnitude of γ = 1.0 and a damping coefficient of ζ = 5%.
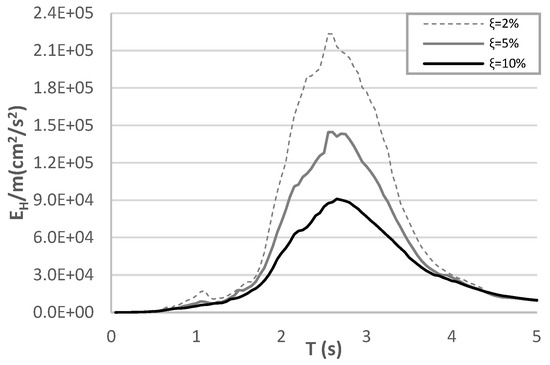
Figure 15.
Average spectra of EH for the elastoplastic hysteretic mode with a ductility equal to 2, an aftershock magnitude of γ = 1.0 and damping coefficients of ζ = 2%, ζ = 5% and ζ = 10%.
On the other hand, analyzing how the hysterical model influences the EH response, Figure 13 shows three EH spectra for the elastoplastic, bilinear 3% and 5% of post-yielding stiffness models, where it is observed that the spectra are practically the same in shape and spectral ordinate throughout the interval periods. This characterization is very similar to that of the EIμ spectra. It can be concluded in this study that the influence of the post-yielding stiffness in the assessment of EH is negligible.
Regarding ductility, Figure 14 shows three spectra with different levels of ductility (μ = 2, μ = 4 and μ = 6). It is observed that the three spectra present the same two characteristics as the EIμ spectra according to the interval periods. The first occurs in the interval from 0.5 to 2 s and now also from 3.5 to 5 s, where, as the ductility increases, the EH will have a higher energy demand. The second characteristic is shown in the interval period from 2.5 to 3.5 s; in this case, as the ductility factor is higher, the EH will have a lower energy demand. In other words, the ductility variable plays an important role in the energy demands.
Figure 15 shows three spectra with different damping coefficients (ξ = 2%, ξ = 5% and ξ = 10%), where a very similar characterization is shown in the response to the EI spectra (see Figure 5). It is observed that in the threshold of periods close to the ground (1.5 to 3.5 s), as the damping coefficient increases, the spectral ordinate decreases. For example, the energy demand for a spectrum of ξ = 2% is more than double with respect to the spectra of ξ = 10%, demonstrating the influence of the damping variable on the EH response. In addition, Figure 16 compares the average with the maximum and minimum values of the normalized hysteretic energy for a ductility equal to 4 and ξ = 5%. Note that less uncertainties are observed in comparison with the input energy results.
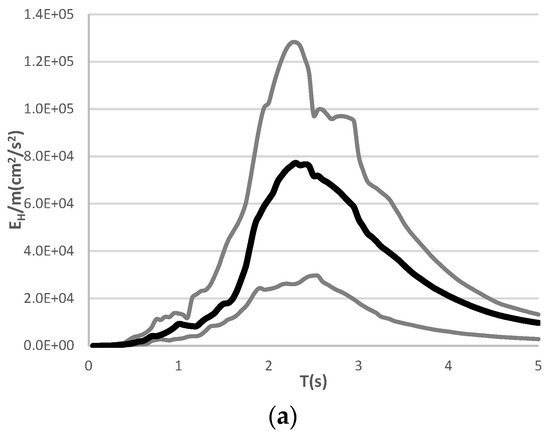
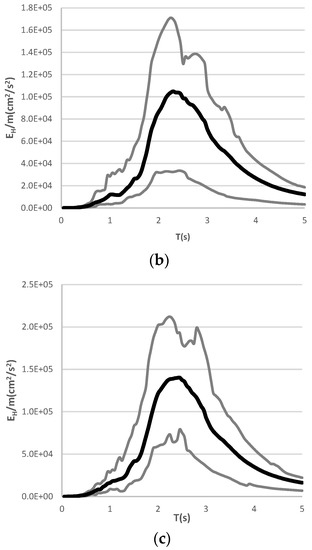
Figure 16.
Maximum, minimum and average EH spectra for different aftershock intensities, (a) γ = 0.35, (b) γ = 0.7 and (c) γ = 1.0, calculated from the twenty-eight EH spectra with a ductility value of μ = 4, the elastoplastic model and a damping coefficient of ζ = 5%.
7.4. EH/EIμ Ratio Spectra
Once the EIμ and EH spectra have been obtained, the EH/EIμ ratio spectra are calculated, which will serve as the basis for proposing a simplified expression to directly compute the EH/EIμ ratio in nonlinear structures, taking into account seismic sequences with different aftershock intensities and certain structural parameters. A total of 2268 response spectra and 81 average spectra were calculated of the total average spectra. A total of 18 spectra were plotted, which are presented in Figure 17, Figure 18, Figure 19 and Figure 20, where the units of the spectral ordinate are dimensionless, and the abscissa is the period in seconds. Analyzing the characteristics of the spectral shape, it is observed that all the spectra are very similar to each other, presenting an almost constant trend with a value less than the unit along the entire abscissa axis regardless of the aftershocks’ intensities or the structural features used. These results are very similar to those found by most authors where, in their studies, they do not consider the aftershocks’ effect [28,29,30]. A ductility of μ = 2, μ = 4 and μ = 6 was used in Figure 17a–c. In each figure, the same elasto-perfectly-plastic hysteretic model was used with ζ = 5%, and three spectra were presented for different aftershock intensities (γ = 1.0, γ = 0.7 and γ = 0.30) in order to analyze the influence of aftershock intensities on the EH/EIμ response. It is observed that both the shape and the values of the spectral ordinate are very similar throughout the interval of the abscissas, showing little or no influence of the aftershocks on the ratio of EH/EIμ. The fact that aftershock intensities do not influence the EH/EIμ response does not mean that they should not be taken into account, since as previously observed in the response of the EIμ and EH (see Figure 8 and Figure 12), their influence is quite significant. Regarding the structural characteristics, in Figure 18, three spectra are presented for the models, elastoplastic, bilinear 3% and 5% post-yielding stiffness, in order to observe how the hysteretic model (post-yielding stiffness) influences the EH/EIμ ratio. It can be seen that the same almost linear shape is kept in the three spectra, and the values of the spectral ordinate are very similar throughout the entire interval period, showing little or no influence of the post-yielding stiffness on the response of the ratio EH/EIμ.
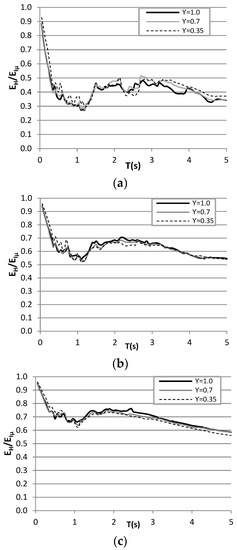
Figure 17.
Average spectra of EH/EIμ for the elastoplastic hysteretic model, with a ductility equal to 2, aftershock magnitudes of γ = 1.0, γ = 0.7 and γ = 0.35, a damping coefficient of ζ = 5% and ductility values of (a) μ = 2, (b) μ = 4 and (c) μ = 6.
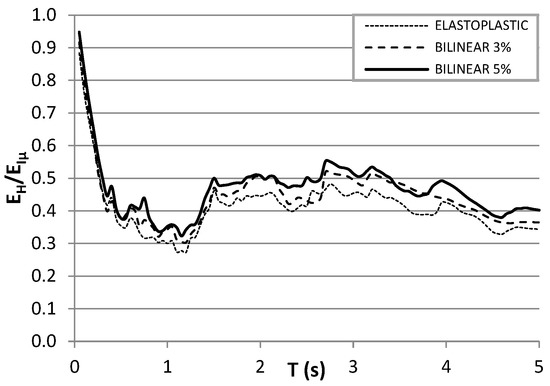
Figure 18.
Average spectra of EH/EIμ for the elastoplastic hysteretic, bilinear 3% and 5% post-yield stiffness models, an aftershock magnitude of γ = 1.0, a damping coefficient of ζ = 5% and a ductility of μ = 2.
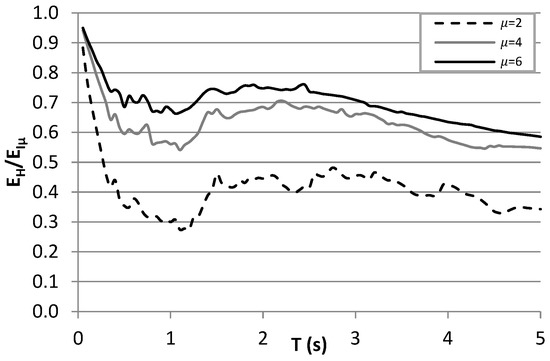
Figure 19.
Average spectra of EH/EIμ for hysteretic model = elastoplastic, with ductility factors μ = 2, μ = 4 and μ = 6, an aftershock magnitude of γ = 1.0 and a damping coefficient of ζ = 5%.
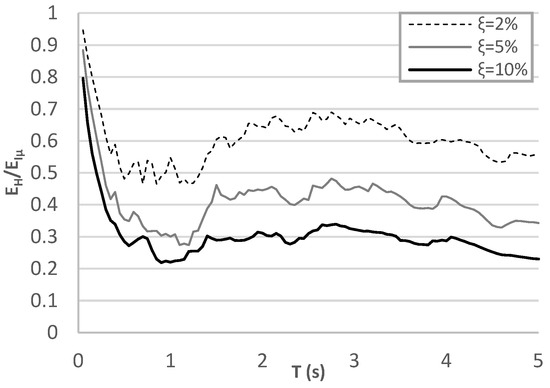
Figure 20.
Average spectra of EH/EIμ for the elastoplastic hysteretic model, with a ductility value of μ = 2, an aftershock magnitude of γ = 1.0 and damping coefficients of ζ = 2%, ζ = 5% and ζ = 10%.
The influence of ductility on the response of EH/EIμ is observed in Figure 19. As in the other cases, a linear trend is observed throughout the entire interval period. In general, the ordinates increase according to the increase of the ductility parameter used. For example, in Figure 17a, it can be seen that for a ductility of μ = 2, the values of the ratio are between 0.3 and 0.5, while for a ductility of μ = 6, the values are between 0.6 and 0.8.
The last parameter analyzed is the damping coefficient. In Figure 20, three spectra are observed for the three selected damping coefficients, ξ = 2%, ξ = 5% and ξ = 10%. These spectra are calculated for the elastoplastic hysteretic model, ductility μ = 2 and γ = 1.0. It can be seen that the trend is almost linear along the abscissa axis; however, the value of the response depends on the damping coefficient. It is observed that the spectral ordinate decreases as the coefficient increases. Furthermore, Figure 21 compares the average with the maximum and minimum values of the energy ratio for a ductility equal to 4, ξ = 5% and the elastoplastic hysteretic model. Note that less uncertainties are observed in comparison with the estimation of the energy demands.
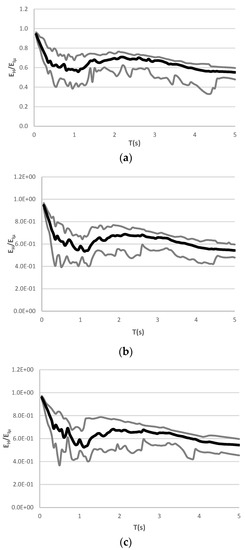
Figure 21.
Maximum, minimum and average EH/EIμ spectra for different aftershock intensities of (a) γ = 0.35, (b) γ = 0.7 and (c) γ = 1.0, calculated from the twenty-eight EH/EIμ spectra with a ductility values μ = 4, the elastoplastic model and a damping coefficient of ζ = 5%.
8. Proposed Equation
In order to propose an equation to compute the energy ratio, it was observed that the intensities of the aftershocks did not influence in the response of the EH/EIμ ratio (see Figure 17). Moreover, there is not a strong structural period dependency of the energy ratio computed for nonlinear systems subjected to seismic sequences. The same occurs with the hysteretic model (post-yielding stiffness), as can be observed in Figure 18, in such a way that the equation can be formulated for the elastoplastic hysteretic model. On the contrary to the hysteretic model and the aftershock intensity, the damping coefficient (ξ) had a significant influence on the values of the EH/EIμ ratio (see Figure 20); however, most of the structures are modeled and designed with a damping coefficient of ξ = 5%; therefore, expressing the formula in terms of a coefficient of 5% significantly reduces the number of parameters in the equation and consequently saves calculation time. On the other hand, ductility (μ), as expected, showed a great influence on the response throughout the period interval (see Figure 17 and Figure 19); hence, the expression will be directly related to the ductility value, which is one of the most important parameters for earthquake-resistant building design.
Given the characterization of the spectra obtained and the parameters that influenced the response of EH/EIμ, Expression 5 was obtained, which is in exponential and logarithmic terms. The formula has six constants (θ1, θ2,…, θ5 and θ6) for three different ductility values (μ = 2, μ = 4 and μ = 6), which are shown in Table 5, and the period (T, s). This expression is proposed for structures with an elastoplastic hysteretic model and a damping coefficient of ξ = 5%, which represents the majority of the modeled structures. In order to observe the performance of this new expression, some spectra are calculated which will be compared with the spectra obtained in the previous section that have the same structural parameters; this comparison is shown in Figure 22 and Figure 23.

Table 5.
Values of the constants θ1 to θ6 for the elastoplastic model, with an aftershock intensity of γ = 1.0 and a damping coefficient of ζ = 5%.
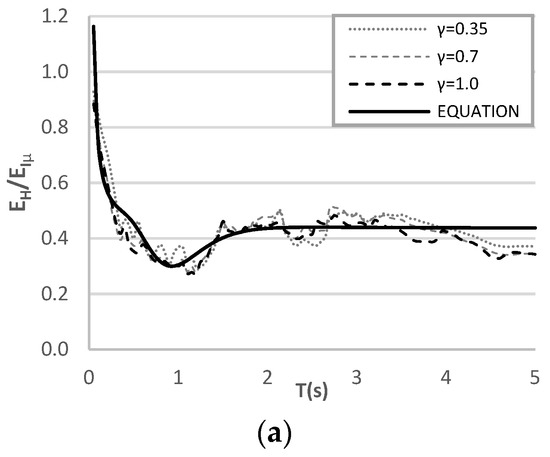
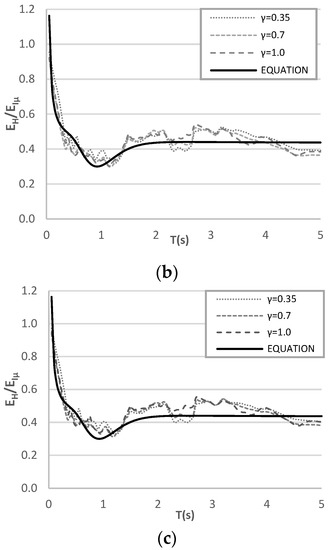
Figure 22.
Comparison of the average spectra of EH/EIμ for the aftershock magnitudes of γ = 0.35, γ = 0.7 and γ = 1.0 and spectra of EH/EIμ of the proposed Equation (5), with a ductility of μ = 2, a damping coefficient of ζ = 5% and the hysteretic models: (a) elastoplastic, (b) bilinear 3% and (c) bilinear 5%.
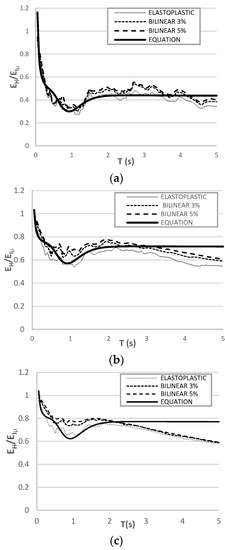
Figure 23.
Average spectra of EH/EIμ for hysteretic model = elastoplastic, bilinear 3%, bilinear 5% and spectra of EH/EIμ of Equation (5), with an aftershock magnitude of γ = 1.0, a damping coefficient of 5% (ζ = 5%) and ductility (a) μ = 2, (b) μ = 4 and (c) μ = 6.
In Figure 22, with the aim to observe that both the intensity of the aftershocks and the hysteretic model do not influence the results of the response, three figures are presented (a, b and c) that contain four energy ratio spectra. The real values obtained from nonlinear dynamic analyses (with discontinuous lines) and the continuous black line illustrate the results obtained with the proposed equation. Note that aftershock intensities (γ = 1.0, γ = 0.7 and γ = 0.35) and the hysteretic models elastoplastic, bilinear 3% and bilinear with 5% of post-yielding stiffness were used. It can be seen in the three figures that both the real spectra of EH/EIμ and the spectrum obtained by Equation (5) (continuous black line) show considerable similarity throughout the range of periods, that is say, from 0 to 5 s. It is concluded that the proposed equation provided satisfactory values of the energy ratio. It is important to say that there is not an effect of the aftershocks in the EH/EIμ ratio. Finally, note that the equation is very accurate also for different ductility values, as illustrated in Figure 23 and Table 6, which indicates the mean square error (MSE) of the equation for the elastoplastic systems and the three ductility levels under consideration. It is important to say that the MSE is estimated by means of Equation (6). In this equation, represents the energy ratio for a specific period estimated via Equation (5), is the actual energy ratio obtained from the nonlinear dynamic analysis and is the number of periods from 0.05 up to 5 s; thus, a total of 100 spectral points are used to calibrated the equation and to compute the MSE.

Table 6.
Mean square error (MSE) of the proposed equation for the elastoplastic hysteretic model.
9. Energy Ratio in a Multi-Degree-of-Freedom Reinforced-Concrete Buildings under Seismic Sequences
With the aim to observe the energy ratio EH/EI for MDOF structures, a reinforced-concrete (RC) building model is subjected to seven seismic sequences. The 10-story RC building was used previously in a study developed for some of the authors [55]. The RC designed according to the Mexico City Seismic Design Provisions (MCSDP) has three seven-meter bays in both horizontal directions and story heights of 3.5 m (see Figure 24). It was considered that the elements (beams and columns) of the structures have a hysteretic behavior similar to the modified Takeda model to represent the nonlinearity of the material. The period of vibration of the structural model is equal with 0.98 s. In the case of the seismic sequences, they were obtained with the records number one of Table 4 and the other seven records have been used as aftershocks (a total of seven seismic sequences). The well-known incremental dynamic analysis was used to obtain the energy ratio at different intensity levels. For this aim, while the mainshock was scaled from 0.1 g to 2 g of the spectral acceleration at first mode of vibration of the structure Sa(T1), at this scaling level of the mainshock, the aftershock was scaled to four different PGA levels. Thus, 0.25, 0.5, 0.75 and 1 times the PGA of the mainshock were selected for the PGA of the aftershock. The results of the average energy ratio at each intensity level are observed in Figure 25. The figure suggests as a preliminary result that the energy ratio is not influenced by the intensity level of the aftershocks as in the case of SDOF structures. Note that it corresponds to the preliminary results and more studies are required to better understanding of the effect of aftershock on hysteretic energy and energy ratio of MDOF structures.
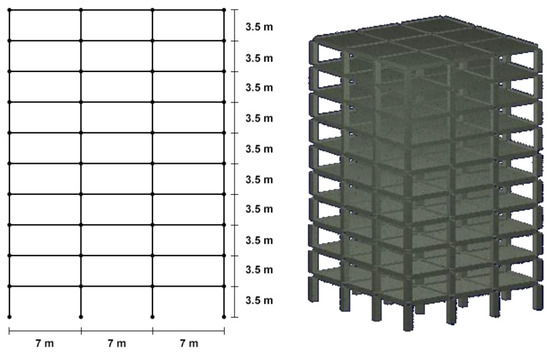
Figure 24.
Selected 10-story reinforced-concrete building model.
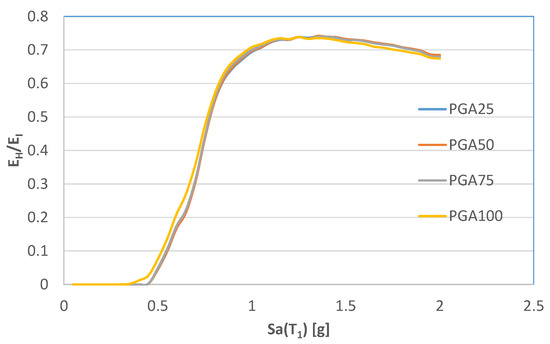
Figure 25.
Average energy ratio EH/EIμ for a reinforced-concrete building with ten stories under seven seismic sequences at different scaling intensity levels.
10. Conclusions
In order to propose an equation to compute the energy ratio EH/EI of nonlinear structures subjected to seismic sequences, several bilinear SDOF systems with different post-yielding stiffness are subjected to seismic sequences obtained from the soft-soil sites of Mexico City. First, the constant-ductility spectra for input and hysteretic energy taking into account the mainshocks and aftershocks are computed, then the energy ratio is assessed. The numerical results suggest in general that the energy demands tend to increase as the aftershocks increase, especially for structural periods close to the soil period; in fact, in this case, the energy demands for aftershock intensities similar to the mainshock intensity could be twice the energy produced by seismic sequences with low or without aftershocks intensities. For this reason, the potential of aftershocks in the amount of inelastic energy is very important. Moreover, the elasto-perfectly-plastic hysteretic model provided similar energy demands in comparison with bilinear hysteretic models with different post-yielding stiffness. On the other hand, the results indicate that the ratio of input and hysteretic energy is almost the same for the selected levels of intensity of the aftershocks. Hence, there is no influence of the aftershock intensity in the estimation of the energy ratio. Note that this is preliminarily valid in the case of RC buildings. The last issue is very important because it lets us propose analytical equations to predict the energy ratio accounting for aftershock effects. Finally, the proposed equations can be used toward new earthquake-resistant energy-based design building regulations in order to reduce the seismic risk in urban areas. For example, new energy-based regulations could provide the input energy spectra, and the expressions will be used to provide a rapid estimation of the hysteretic energy, in such a way that the control of this type of energy is crucial to reduce the structural damage. Note that the proposed equations can be used only under the circumstances for which they were proposed, in particular, for soft-soil sites with characteristics similar to those indicated in the present work.
Author Contributions
Conceptualization, E.B., J.B., A.R.-S., I.T., J.R.-G., A.F., E.F., H.L. and M.D.L.-T.; Methodology, J.A.S., E.B., J.B., I.T., J.R.-G. and E.F.; Software, J.A.S., E.B., J.B., I.T. and H.L.; Validation, E.B. and M.D.L.-T.; Formal analysis, J.A.S., E.B., I.T. and H.L.; Investigation, J.A.S., E.B., J.B., A.F. and E.F.; Resources, J.B.; Data curation, J.A.S. and E.B.; Writing—original draft, J.A.S. and E.B.; Writing—review & editing, J.B., A.R.-S., J.R.-G., A.F., E.F. and H.L.; Visualization, M.D.L.-T.; Supervision, E.B. and E.F.; Project administration, E.B. and J.B.; Funding acquisition, E.B. and J.B. All authors have read and agreed to the published version of the manuscript.
Funding
The scholarship for PhD studies given by El Consejo Nacional de Ciencia y Tecnología to the first and fifth authors and the support under grant Ciencia Básica to the second and third authors are appreciated. Financial support also was received from the Universidad Autónoma de Sinaloa under grant PROFAPI.
Conflicts of Interest
The authors declare no conflict of interest.
References
- Atzori, S.; Tolomei, C.; Antonioli, A.; Boncori, J.M.; Bannister, S.; Trasatti, E.; Pasquali, P.; Salvi, S. The 2010–2011 Canterbury, New Zealand, seismic sequence: Multiple source analysis from InSAR data and modeling. J. Geophys. Res. 2012, 117, B08305. [Google Scholar] [CrossRef]
- Kazuhiko Kasai, M.; Mita, A.; Kitamura, H.; Matsuda, K.; Morgan, T.A.; Taylor, A.W. Performance of Seismic Protection Technologies during the 2011 Tohoku-Oki Earthquake. Earthq. Spectra. 2013, 29, S265–S293. [Google Scholar] [CrossRef]
- Moon, L.; Dizhur, D.; Senaldi, I.; Derakhshan, H.; Griffith, M.; EERI, M.; Magenes, G.; Ingham, J. The Demise of the URM Building Stock in Christchurch during the 2010–2011 Canterbury Earthquake Secuence. Earthq. Spectra. 2014, 30, 253–276. [Google Scholar] [CrossRef]
- Kam, W.Y.; Pampanin, S.; Elwood, K. Seismic Performance of Reinforced Concrete Buildings in the 22 February Christchurch (Lyttelton) earthquake. N. Z. Soc. Earthq. Eng. 2011, 44, 239–278. [Google Scholar] [CrossRef]
- Li, Q.; Ellingwood, B. Performance evaluation and damage assessment of steel frame buildings under main shock-artershock earthquake sequences. Earthq. Eng. Struct. Dyn. 2007, 36, 405–427. [Google Scholar] [CrossRef]
- Singh, D.K.; Mandal, A.; Karumanchi, S.R.; Murmu, A.; Sivakumar, N. Seismic Behaviour of damaged tunnel during aftershock. Eng. Fail. Anal. 2018, 93, 44–54. [Google Scholar] [CrossRef]
- Lemnitzer, A.; Massone, L.M.; Skolnik, D.; de la Llera Martin, J.C.; Wallace, J.W. Afttershock response of RC buildings in Santiago, Chile, succeeding the magnitude 8.8 Maule earthquake. Eng. Struct. 2014, 76, 324–338. [Google Scholar] [CrossRef]
- Mexico City Building Code. Complementary Technical Norms for Earthquake Resistant Design, Mexico City (RCDF-17); Mexico City Building Code: Mexico City, Mexico, 2017. [Google Scholar]
- MOC-CFE-15; Seismic Design, Design Manual of Civil Works. Federal Commission of Electricity: Mexico City, Mexico, 2015.
- Norma Chilena Oficial. Diseño Sísmico de Edificios; Instituto Nacional de Normalización: Santiago, Chile, 2012. [Google Scholar]
- Gentile, R.; Galasso, C. Hysteretic energy-based state-dependent fragility for ground-motion sequences. Earthq. Eng. Struct. Dyn. 2020, 50, 1187–1203. [Google Scholar] [CrossRef]
- De Risi, R.; Sextos, A.; Zimmaro, P.; Simonelli, A.; Stewart, J. The 2016 Central Italy earthquakes sequence: Observations of incremental building damage. In Proceeding of the 11th U.S. National Conference on Earthquake Engineering, Los Angeles, CA, USA, 25–29 June 2018. [Google Scholar]
- Aljawhari, K.; Gentile, R.; Freddi, F.; Galasso, C. Effects of ground-motion sequences on fragility and vulnerability of case-study reinforced concrete frames. Bull. Earthq. Eng. 2021, 19, 6329–6359. [Google Scholar] [CrossRef]
- Amiri, S.; Bojórquez, E. Residual displacement ratios of structures under mainshock-aftershock sequences. Soil Dyn. Earthq. Eng. 2019, 121, 179–189. [Google Scholar] [CrossRef]
- Amiri, S.; Garakaninezhad, A.; Bojórquez, E. Normalized residual displacement spectra for post-mainshock assessment of structures subjected to aftershocks. Earthq. Eng. Eng. Vib. 2021, 20, 403–421. [Google Scholar] [CrossRef]
- Lopez-Caballero, F.; Aristizabal, C.; Sanchez-Silva, M. A model to estimate the lifetime of structures located in seismically active regions. Eng. Struct. 2020, 215, 110662. [Google Scholar] [CrossRef]
- Khalil, C.; Lopez-Caballero, F. Survival analysis of a liquefiable embankment subjected to sequential earthquakes. Soil Dyn. Earthq. Eng. 2021, 140, 106436. [Google Scholar] [CrossRef]
- Clark, T.; Bradburn, M.; Love, S.; Altman, D. Survival analysis part i: Basic concepts and first analyses. Br. J. Canc. 2003, 89, 232. [Google Scholar] [CrossRef] [PubMed]
- Schober, P.; Vetter, T.R. Survival analysis and interpretation of time-to-event data: The tortoise and the hare. Anesth. Analg. 2018, 127, 792. [Google Scholar] [CrossRef] [PubMed]
- Diamoutene, A.; Barro, D.; Somda, S.M.A.; Noureddine, F.; Kamsu-Foguem, B. Survival analysis in living and engineering sciences. JP J. Biostat. 2016, 13, 223–238. [Google Scholar]
- EC8-05 EuroCode-8; Design of Structures for Earthquake Resistance. Part 1: General Rules, Seismic Actions and Rules for Buildings. Deutsches Institut für Normung e.V.: Berlin, Germany, 2005.
- ASCE 7-16, ASCE Standard ACE/SEI 7-05; Minimum Design Loads for Buildings and Other Structures. American Society of Civil Engineers: Reston, VA, USA, 2016.
- Aliakbari, F.; Garivani, S.; Aghakouchak, A. An energy based method for seismic design of frame structures equipped with metallic yielding dampers considering uniform inter-story drift concept. Eng. Struct. 2020, 105, 110114. [Google Scholar] [CrossRef]
- Ma, C. Energy-based seismic design method for EBFs based on hysteretic energy spectra and accumulated ductility ratio spectra. Adv. Civ. Eng. 2019, 2019, 3180596. [Google Scholar] [CrossRef]
- Song, G.; Yang, T.; Zhou, Y. Energy-based seismic design for self-centering concrete frames. Bull. Earthq. Eng. 2021, 19, 5113–5137. [Google Scholar] [CrossRef]
- Bojórquez, E.; Reyes-Salazar, A.; Terán-Gilmore, A.; Ruiz, S.E. Energy-based damage index for Steel Structures. Steel Compos. Struct. 2010, 10, 343–360. [Google Scholar] [CrossRef]
- Bojórquez, E.; Ruiz, S.E.; Terán-Gilmore, A. Reliability-based evaluation of steel structures using energy concepts. Eng. Struct. 2008, 30, 1745–1759. [Google Scholar] [CrossRef]
- Fajfar, P.; Vidic, T. Consistent inelastic design spectra: Hysteretic and input energy. Earthq. Eng. Struct. Dyn. 1994, 23, 523–532. [Google Scholar] [CrossRef]
- Akiyama, H. Earthquake Resistant Limit-State Design for Buildings; University of Tokyo Press: Tokyo, Japan, 1985. [Google Scholar]
- Kuwamura, H.; Galambos, T.V. Earthquake load for structural reliability. J. Struct. Eng. ASCE 1989, 115, 1446–1462. [Google Scholar] [CrossRef]
- Krawinkler, H.; Nassar, A.A. Seismic design based on ductility and cumulative damage demands and capacities. In Nonlinear Seismic Analysis and Design of Reinforced Concrete Buildings; Krawinkler, H., Fajfar, P., Eds.; Elsevier Applied Science: London, UK, 1992; pp. 95–104. [Google Scholar]
- Fajfar, P.; Vidic, T.; Fischinger, M. On energy demand and supply in SDOF systems. In Nonlinear Seismic Analysis and Design of Reinforced Concrete Buildings; CRC Press: Boca Raton, FL, USA, 1992; pp. 48–71. [Google Scholar]
- Decanini, L.; Mollaioli, F. An energy-based methodology for the assessment of seismic demand. Soil Dyn. Earthq. Eng. 2001, 21, 113–137. [Google Scholar] [CrossRef]
- Akbas, B.; Aksar, B.; Doran, B.; Alacali, S. Hysteretic energy to energy input ratio spectrum in nonlinear systems. Deu Muhendis. Fak. Fen Ve Muhendis. 2016, 18, 239–254. [Google Scholar] [CrossRef]
- Karen, R.F.; Rachel, E.A.; Göran, E. A Common Origin for Aftershocks, and Multiplets. Bull. Seismol. Soc. Am. 2004, 94, 88–98. [Google Scholar]
- Yamashita, T.; Knopoff, L. Models of aftershock occurrence. Geophys. J. Int. 1987, 91, 13–26. [Google Scholar] [CrossRef]
- Das, S.; Henry, C. Spatiel Relation Between main earthquake slip and its aftershock distribution. Rev. Geophys. 2003, 41. [Google Scholar] [CrossRef]
- Molchan, G.M.; Dmitrieva, O.E. Aftershock identification: Methods and new approaches. Geophys. J. Int. 1992, 109, 501–516. [Google Scholar] [CrossRef]
- Karen, R.F.; Becker, T.; Abercrombie, R.; Ekstom, G.; Rice, J. Triggering of the 1999 Mw 7.1 Hector Mine earthquake by afthershocks of the 1992 Mw 7.3 Landers earthquake. Journal of Geophysical Research. Solid Earth 2002, 107, 2190. [Google Scholar] [CrossRef]
- Karen, R.F.; Abercrombie, R.; Ekstom, G. Secondary aftershocks and their importance for aftershock forecasting. Bull. Seismol. Soc. Am. 2003, 93, 1433–1448. [Google Scholar] [CrossRef]
- Ogata, Y.; Jones, L.; Toda, S. When and where the aftershock activity was depressed: Contrasting decay patterns of the proximate large earthquakes in southern California. J. Geophys. Res. Solid Earth 2003, 108, 2318. [Google Scholar] [CrossRef]
- Chiarabba, C.; De Gori, P.; Chiaraluce, L.; Bordoni, P.; Cattaneo, M. Mainshocks and Aftershocks of the 2002 Molise Seismic Sequence, Southern Italy. J. Seismol. 2005, 9, 487–494. [Google Scholar] [CrossRef]
- Song, R.; Li, Y.; Van de Lindt, J. Loss estimation of Steel buildings to earthquake mainshocks-aftershock sequences. Struct. Saf. 2016, 61, 1–11. [Google Scholar] [CrossRef]
- Felzer, K. Simulated aftershock sequences for an M 7.8 earthquake on the southern San Andreas fault. Seismol. Res. Lett. 2009, 80, 21–25. [Google Scholar] [CrossRef]
- Milne, J.; Lee, A.W. Earthquakes and Other Earth Movements; Kegan Paul, Trench, Trübner & Co: London, UK, 1939; p. 244. [Google Scholar]
- Omori, F. On the aftershocks of earthquakes. J. Coll. Sci. Imp. Univ. Tokyo 1894, 7, 111–120. [Google Scholar]
- Båth, M. Lateral inhomogeneities of the upper mantle. Tectonophysics 1965, 2, 483–514. [Google Scholar] [CrossRef]
- Helmstetter, A.; Sornette, D. Båth’s law derived from the Gutenberg-Richter law and from aftershock properties. Geophys. Res. Lett. 2003, 30, 2069. [Google Scholar] [CrossRef]
- Vere-Jones, D. A limit theorem with application to Båth’s law in seismology. Appl. Probab. Trust 2008, 40, 882–896. [Google Scholar] [CrossRef]
- Karen, R.F.; Debi, K. A Case Study of Two M ∼5 Mainshocks in Anza, California: Is the Footprint of an Aftershock Sequence Larger Than We Think? Bull. Seismol. Soc. Am. 2009, 99, 2721–2735. [Google Scholar] [CrossRef]
- Felder, K.R.; Brodsky, E.E. Decay of aftershock density with distance indicates triggering by dynamic stress. Nature 2006, 441, 735–738. [Google Scholar] [CrossRef]
- Hough, S.E. Remotely triggered earthquakes following moderate mainshocks (or why California is not falling into the ocean). Seismol. Res. Lett. 2005, 76, 58–66. [Google Scholar] [CrossRef]
- Steacy, S.; Gomberg, J.; Cocco, M. Introduction to special section: Stress transfer, earthquake triggering, and time-dependent seismic hazard. J. Geophys. Res. Solid Earth 2005, 110, B05S01. [Google Scholar] [CrossRef]
- Utsu, T. A statistical study on the occurrence of aftershocks. Geophys. Mag. 1961, 30, 521–605. [Google Scholar]
- Nur, A.; Booker, J.R. Aftershocks caused by pore fluid flow? Science 1972, 175, 885–887. [Google Scholar] [CrossRef]
- Gomberg, J. The failure of earthquake failure models. J. Geophys. Res. Solid Earth. 2001, 106, 16253–16263. [Google Scholar] [CrossRef]
- Housner, G.W. Limit design of structures to resist earthquakes. In Proceedings of the 1st WCEE, Berkeler, CA, USA, 1–13 May 1956. [Google Scholar]
- Zahrah, T.F.; Hall, W.J. Earthquake energy absorption in SDOF structures. J. Struct. Eng. 1984, 110, 1757–1772. [Google Scholar] [CrossRef]
- Zahrah, T.F.; Hall, W.J. Seismic Energy Absorption in Simple Structures; Civil Engineering Studies. Structural Research Series No 501; University of Illinois at Urbana-Champaign: Urbana, IL, USA; Champaign, IL, USA, 1982. [Google Scholar]
- Uang, C.M.; Bertero, V.V. Use of Energy as a Design Criterion in Earthquake Resistant Design; Report No. ºCB/EERC-88/18; Earthquake Engineering Research Center, University of California at Berkeley: Berkeley, CA, USA, 1988. [Google Scholar]
- Uang, C.M.; Bertero, V.V. Evaluation of Seismic Energy in Structures. Earthq. Eng. Struct. Dyn. 1990, 19, 77–90. [Google Scholar] [CrossRef]
- Manfredi, G. Evaluation of seismic energy demand. Earthq. Eng. Struct. Dyn. 2001, 30, 485–499. [Google Scholar] [CrossRef]
- Benavent-Climent, A.; Pujades, L.G.; Lopez-Almansa, F. Design energy input spectra for moderate-seismicity regions. Earthq. Eng. Struct. Dyn. 2002, 31, 1151–1172. [Google Scholar] [CrossRef]
- Zhou, Y.; Song, G.G.; Tan, P.P. Hysteretic energy demand for self-centering SDOF systems. Soil Dyn. Earthq. Eng. 2019, 125, 105703. [Google Scholar] [CrossRef]
- Mexican strong earthquake database, Sociedad Mexicana de Ingeniería Sísmica. Available online: https://www.smis.mx (accessed on 21 January 2023).
- Mezgebo, M.G. Estimation of Earthquake Input Energy, Hysteretic Energy and Its Distribution in MDOF Structures. Ph.D. Thesis, Syracuse University, New York, NY, USA, 2015. [Google Scholar]
- Alici, F.S.; Sucuoğlu, H. Elastic and Inelastic Near-Fault Input Energy Spectra. Earthq. Spectra 2018, 34, 611–637. [Google Scholar] [CrossRef]
- Merter, O. An investigation on the maximum earthquake input energy for elastic SDOF systems. Earthq. Struct. 2019, 16, 487–499. [Google Scholar]
- Torres, J.I.; Bojórquez, E.; Reyes, A.; Bojórquez, J. Vector-Valued Intensity Measures to Predict Peak and Hysteretic Energy Demands of 3D R/C Buildings. In Energy-Based Seismic Engineering; IWEBSE Lecture Notes in Civil Engineering; Benavent-Climent, A., Mollaioli, F., Eds.; Springer: Cham, Switzerland, 2021; Volume 155. [Google Scholar] [CrossRef]
Disclaimer/Publisher’s Note: The statements, opinions and data contained in all publications are solely those of the individual author(s) and contributor(s) and not of MDPI and/or the editor(s). MDPI and/or the editor(s) disclaim responsibility for any injury to people or property resulting from any ideas, methods, instructions or products referred to in the content. |
© 2023 by the authors. Licensee MDPI, Basel, Switzerland. This article is an open access article distributed under the terms and conditions of the Creative Commons Attribution (CC BY) license (https://creativecommons.org/licenses/by/4.0/).