Article

Environmental and Community Regeneration: Exploring Design Approach for Inclusive Tourism Based on Visualization Methods

1
Graduate School of Engineering, Chiba University, Yayoi-cho 1-33, Inage-ku, Chiba 263-8522, Japan
2
Faculty of Engineering, Chiba University, Yayoi-cho 1-33, Inage-ku, Chiba 263-8522, Japan
3
School of Design, China Academy of Art, Hangzhou 310002, China
*
Author to whom correspondence should be addressed.
Sustainability 2023, 15(5), 4540; https://doi.org/10.3390/su15054540
Submission received: 7 February 2023 / Accepted: 1 March 2023 / Published: 3 March 2023

Abstract

:
Studies have extensively explored inclusive tourism in rural areas in the recent past. However, several forms of inclusive tourism are associated with several limitations. Firstly, few tourists travel to rural places because they consider the developed areas unattractive. Secondly, the area is not attractive because the design and services do not match the area. Thirdly, the people living in rural areas are not content and happy. The aim of the present study is to propose a visualization method-based dynamic design strategy for exploring a new balance between tourism experience and local development. The research and application of the method were conducted in two traditional Chinese villages in western Zhejiang, China. The classification of landscape services (LS) and historical landscape elements (HLE) was used to define the design goals. The visualization method was used during the whole design and construction process of revitalizing Yuan Touli village. The results showed that the method allows for easy analysis and is an efficient tool for developing participant designs based on the different roles in village tourism. The visualization method can circumvent the limitations of ensuring inclusive tourism. The design definition, study’s limitations and future research directions are presented in the study.

1. Introduction

The term “social innovation” has been widely studied in recent years. Social innovation refers to the practice process in which the government, enterprises, the third sector, or individual citizens creatively integrate and utilize social resources individually or in cooperation to solve social problems and meet social needs through new approaches or methods [1]. Capital, urban, and rural synergy networks can be built by combining urban and rural advantages, and the value can be co-created. This process boosts service efficiency, encourages community participation in cultural production, and provides a solution to the lack of resources needed to sustain cultural services in rural areas. However, the environment and design are not effectively utilized when taken as a whole [2]. Sustainable tourism and social innovation have significantly advanced in recent years. Inclusive tourism in traditional communities has been extensively evaluated to foster mutual understanding and cooperation. However, the studies were only conducted on a small subset of fields, and the relationships among tourism, social innovation, cultural heritage, and heritage have not been explored. Landscape is a major component of the design, and visitors’ impressions are important to the success of all-inclusive vacations. The concept of landscape services (LS) is used in the present study, as defined by Bastian et al. [3]: “Landscape Services are the contributions of landscapes and landscape elements to human well-being”. “Human well-being” implies that the ecosystem’s landscape elements are the primary providers of the service. Yuan Touli Village and Gaotiankeng Village are characterized by traditional relics, sites, and historical heritage. Tveit et al. [4] reported that the Historic Landscape Element (HLE) is an essential component of collective services and is integral to the basic cultural landscape.
Design-based research was conducted using the enjoyment of landscape services (LS) [3,5] framework. The value of tourism resources is determined by humans, the environment, and culture according to the categories of historic landscape elements (HLE) [6]. These factors are closely related and determine the services to be designed.
Although people may be attracted to ecologically good landscapes, they may overlook them because of their mundane and foreign appearance [7]. For example, dilapidated traditional buildings do not have a good appearance but have great cultural value. Therefore, the ‘cue to care’ that affects recognition of these landscapes is incorporated to produce long-term ecological benefits. The concept of caring clues, which is widely used in landscape renovation, is used to explore the decreased distance between ecology and people’s perception. The objective of this study is to explore how design can be used to renew and restore lost environments, cultures, and heritage and build new relationships with visitors to promote inclusive tourism for social integration.
China has experienced significant urban migration due to the rapid advances in urbanization, thus the historical rural settlements have been converted to abandoned landscapes [8,9,10]. China’s rapid industrialization and urbanization have resulted in the migration of people from the countryside to urban areas. However, previous studies report an increase in interest from tourists in historic villages [11,12]. Therefore, domestic tourism is expanding in several traditional villages, whereas some villages are abandoned despite their unique historical and cultural value. China’s rural regeneration is a dynamic, multi-scalar, and hybrid process [13].

2. Tourist Experience Design

2.1. Research Concept

Sustainable rural development in China has markedly increased in the recent past. The latest global consensus and great practical value are currently mainly found through the United Nations’ 2030 Sustainable Development Goals (SDGs). Rural tourism plays a key role in promoting rural economic development. Previous studies on tourism have reported that quality tourism experiences are important in achieving rural economic development. Several quantitative and qualitative methods are used to evaluate tourist experiences [14]. Designing memorable experiences requires a dual approach: destination design or planning and the visitor’s point of view. Moreover, different methods are utilized to evaluate customer behavior in value-creating practices and explore customers’ feelings on the value experience [15,16,17]. The tourism experience comprises meta-concepts such as strategic value proposition and operational concepts, which mean orchestration of design elements [18]. The importance of the mastery and co-creation dimensions contributes to the tourist experience [19]. A scale was developed to test tourist experiences. Kim and Eves [20] explored tourists’ motivational effects on local food and beverage consumption in tourist destinations. Service design has a multi-dimensional intersection and is a key area in studying the tourist experience. The iterative design process [21] and holistic experience concept [22] are core design concepts for evaluating the travel experience. The aim of the current study is to explore the impact of rural evolution on regional sustainability [23,24].
The progress of the research concept is presented in Figure 1. Various landscapes have distinct properties. The intrinsic landscape potential is defined based on the possible outdoor leisure activities. Tourist willingness to undertake activities is the service landscape potential, which is markedly less than the intrinsic landscape potential. Satisfaction is an important element in the concept of the tourism experience.
Designing inclusive tourism experiences, especially in rural areas, requires viewing tourists as consumers and participating in experience building. In this study, the overall experience was explored using visualization methods based on tourism experience design theory. In addition, tourists’ dynamic perception of landscape aesthetics was evaluated. The effects of landscape services on tourists and the experience patterns affecting tourists during rural tourism are presented in this study. The findings will help designers and stakeholders apply landscape services and visualization methods to evaluate the correlation between landscape services and user experience.

2.2. Study Area of the Design Project

In this study, the study area focus on the Yuan Touli village and Gao Tiankeng village which are our team’s design projects (Figure 2).
1. Yuan Touli Village has 148 people, according to the original household registration. This village has a beautiful ecological environment and well-preserved traditional homesteads. The villagers have reclaimed land and planted various trees, but its remote location limits the economic benefits. The township government highly supports economic activities. Yuan Touli’s historical and cultural village project was started in 2019. Micro-renovation has been conducted to preserve rammed earth houses and increase good living facilities to form a “source of historical and cultural village scenic spot”. The project was launched in July 2022. Qing Shui fish, native honey, organic tea, and sorghum wine are available in high amounts in this village located on the mountain.
2. Gao Tiankeng Village has the original regional ecological landscape. The village was transformed into a cultural and creative homestay, catering, stargazing, camping, research, and other tourism designs without affecting the aboriginal villagers. It is a unique tourist village. “Embroidery” kung fu in Kaihua preserves the original texture and promotes integrated development of the cultural tourism industry through cultural heritage.

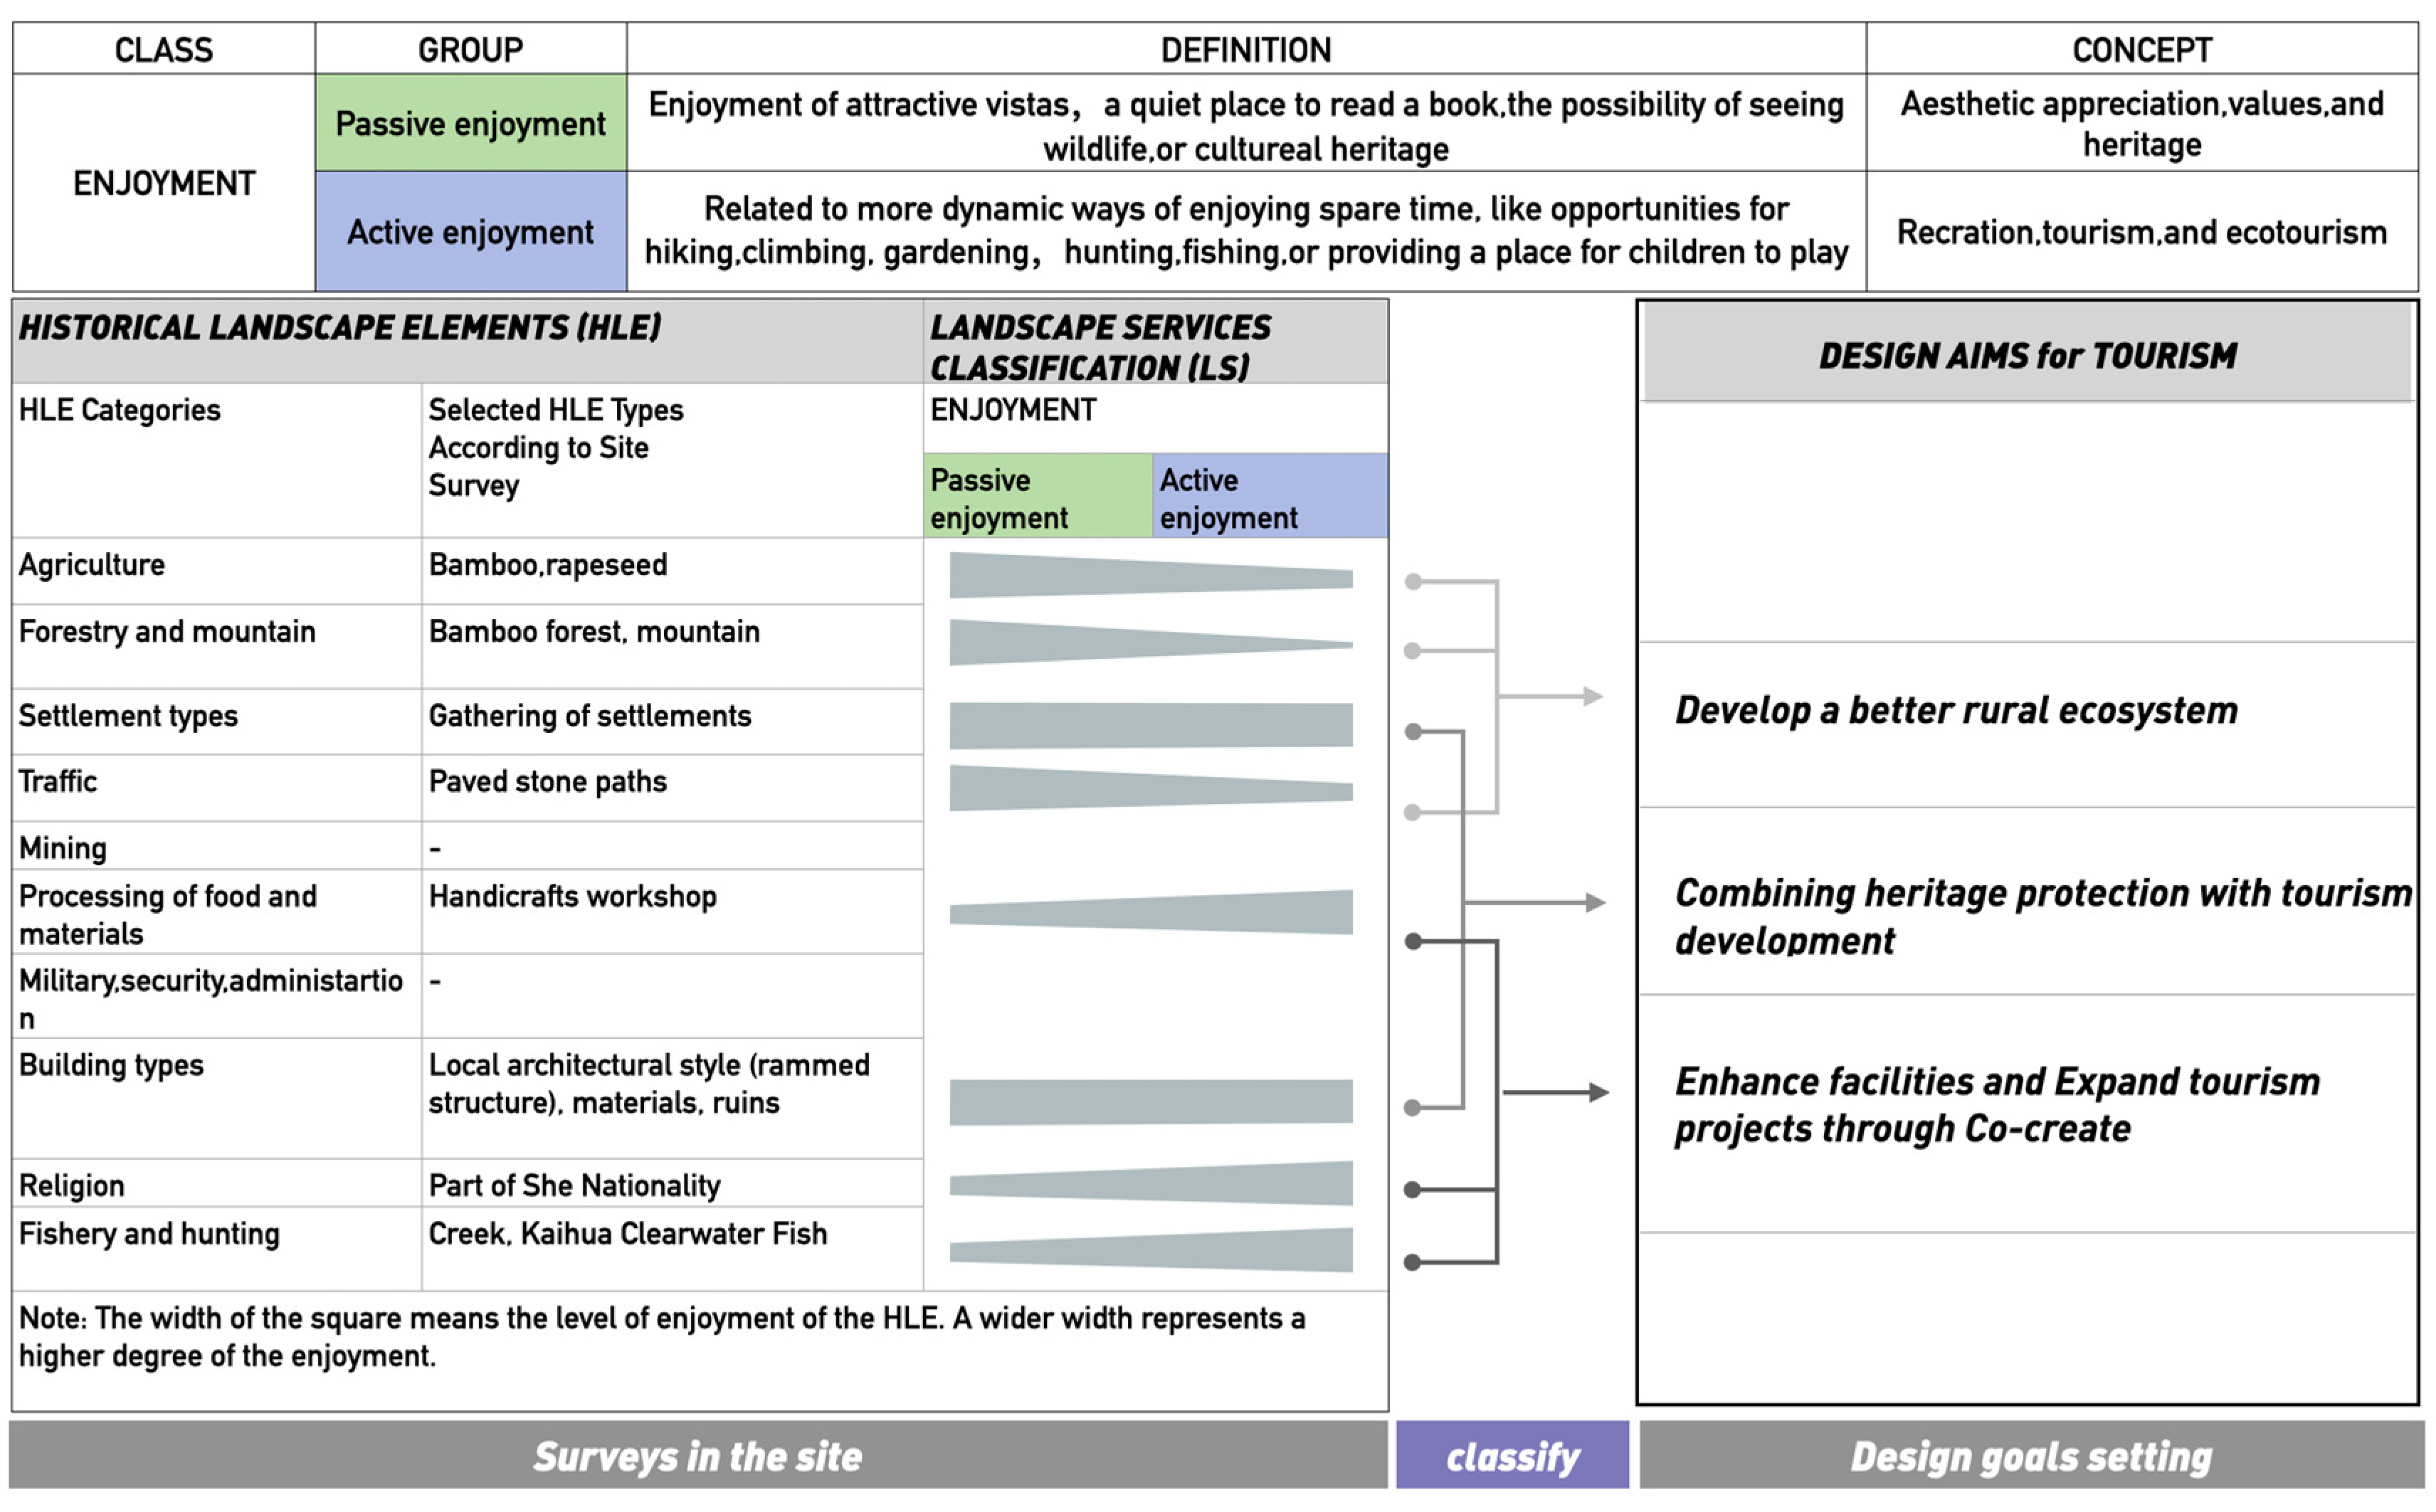
2.3. Design Goals Setting

Nassauer and Opdam [25] reported that the design contributes scientific knowledge to decision-making by scientists and practitioners. This implies that the mode-process paradigm should be applied to design practice. Hauberg [26] and Roggema [27] defined design research as “an academic field that explores the tourist experience through various designs, develops projects, and investigates different materials used to establish a design, such as sketches, maps, and others”. Hauberg [26] states that design research is used to describe the various ways for generating new knowledge about the world using design methods. The approach is used to generate desirable and unexpected urban perspectives, thereby replacing modifiable but less desirable urban development [28]. The visualization method can effectively solve the problems of rural tourism design. The research explores the feasibility of the visualization framework in the design process of exploratory, generative, and evaluative design phases to promote tourism in western Zhejiang, China.
The term landscape is frequently used in studies on ecosystem services. The terms “landscape services” and “ecosystems” are often used interchangeably [29,30]. The differentiation of landscapes and ecosystems is independent of scale factors [31]. Landscape comprises humanistic, naturalistic, and holistic perspectives. The goal of landscape design and planning should be to achieve a better ecosystem and human life. Several villages prioritize social innovation and inclusive tourism during development, which is an efficient method to connect the ecosystem and economic context.
The LS classification is an integrated and interdisciplinary approach [32]. Enjoyment is associated with user experience in the original table reported by Valles-Planells et al. [5]. The authors revised and modified the tables on historic landscape elements (HLEs) presented by Bastian et al. [3]. Tiziano Cattaneo et al. [33] added several historical elements from the Chinese context. This version provides a better understanding of the local traditional landscape element of tourism resources.
The enjoyment and HLE frameworks were combined to explore the feature of landscape elements (Figure 3). According to previous studies, enjoyment is the key component of tourism. Therefore, the two parts were combined to conduct the fundamental surveys.

3. Methods and Materials

Design research and qualitative analysis methods were applied in this study. This paper is organized as follows: The research background of the design research method is presented in the Section 1. The categories and types of historical landscape elements are introduced in Landscape Services [LS], and a case analysis of the traditional village in Yuan Touli village was conducted. The goals of the design project are presented in the Section 2. The design research was explored through entropy visualization methods for the two villages through research analysis in the Section 3. The relationship between enjoyment and landscape service is presented in the Section 4. The traditional village’s differences between the Yuan Touli and Gaotiankeng Village tourism resources are compared. The application of the visualization method to the tourism route planning in Yuan Touli Village is also presented in this section. An extensive discussion of the project outcomes is presented in the last section.

3.1. Research Process

The visualization method and entropy imaging were used to explore the tourist experience. On-site interviews, observations, and questionnaire methods were used in this study. The progress in applying the visualization method and the perspective of different main roles in rural tourism are presented.

Entropy Visualization Method

Entropy methods combine different approaches to evaluate a specific scene. Previous findings on the various urbanization classes showed an increase in visual exploration as the visual complexity of the landscape image increased. Entropy is important in environmental aesthetics applications [34]. Dupont et al. conducted a study to explore whether the differences in viewing behavior are correlated with the differences in complexity by analyzing the spectral entropy of a photograph [35]. Image entropy is highly correlated with ratings of visual diversity and complexity. In addition, entropy is highly correlated with subjective perceptions of visual complexity in landscape scenes. A previous study reported that image entropy is highly correlated with ratings of visual diversity and complexity [36]. This implies that entropy can be used to indicate subjective impressions of visual complexity in landscape scenes. This finding is relevant to our study, which is focused on the visual complexity of a landscape view as perceived and experienced by people. The findings indicate that entropy is a potential predictor of individuals’ subjective perceptions of visual complexity in landscape situations [37]. Shannon [38] established the concept of entropy, with a higher number corresponding to more detailed information. Entropy in an image refers to the matching intensities that individual pixels adapt to. The entropy value is adopted in the quantitative analysis and assessment of picture details since it ensures effective comparison of the features.
The entropy of a picture is a measure of the details in the picture. Picture entropy represents the average amount of information in the image source. It is the average number of bits per pixel in the collection of image grey levels. The formula for discrete entropy information is presented below:
m k = 1 N k   × M k j = 1 N k i = 1 M k log 2 | C k ( i , j ) |
e k = j = 1 N k i = 1 M k p [ C k ( i , j ) ] I n p [ C k ( i , j ) ]
A program was used to obtain the final entropy image. First, the image was processed using computer vision to simulate the visual focus of the tourists’ vision. Second, the grayscale was calculated and the image entropy process was conducted. The entropy progress of the image was based on a scale of 10 pixels, and a rainbow palette was used. Third, entropy image processing was conducted using the image from the first step again, and entropy calculations were performed to obtain the final entropy-image [39,40]. Image entropy processing was conducted to process the image, and the third image was obtained as shown in Figure 4. The improvement in the visualizing method was from No. 1 to No. 3. Three main features of the method were observed: (1) The color division in the picture was clear, and it had high integrity. (2) Realistically and aesthetically conveyed the user’s feelings about the landscape based on computer picture processing. (3) The user’s visual perception of the scene and the landscape category were clearly shown by superimposing the depth of field and features (as illustrated in Figure 4). The overlay entropy image was processed for subsequent studies.

3.2. Visualization Framework (CUBE)

A cube was used as the visualization framework to show the different factors that affect the tourist experience (Figure 5) [41]. The efficiency of the cube was verified in the design project. The main part is shown in Figure 5, the entropy overlay image. The entropy image result is in the range of 0–1. The whole value was split into three equal parts, which represent different ranges. Subsequently, active and passive enjoyment were mapped in the ranges.
The flexible part of this research was the emotional part. The modularity of the cube makes it possible to change different content in specific contexts. The colors for the four emotions—joy, novelty, excitement, and negative emotion—were defined to effectively identify the colors after superimposition. The RGB pallet shows a mixed degree of red, green, and blue. In this study, red was used to represent joy, green to represent novelty, and blue to represent excitement. In the RGB color pallet, red is expressed as (255,0,0), green as (0,255,0), and blue as (0,0,255). White is expressed as (255,255,255). The mixed color was whiter if the score of joy, novelty, and excitement was higher. The scores were converted into a percentage, and a calculation was conducted to determine how much of the number 255 it takes. The numbers of red, green, and blue were then separately calculated. The final GBR number, such as the color (212,189,170) was obtained.

3.3. Selection of Image Types

Selection of Image Types and Combination

(1)
Image types of perception
The entropy image visualization method shows the richness of the landscape, the openness, and the enclosure of vision, as shown in Figure 6. The landscape details and shape of colored areas that can be easily recognized are observed. The entropy image is then obtained to determine the type of the image, as shown in Figure 5. The type can help people understand the image more easily (Figure 5). The enclosure type was refined according to the image features of the entropy visualization method. The type was combined with the entropy image and subdivided into 16 types. Landscape aesthetics were grouped into open and closed categories, including physical and visual, with four types, as shown in Figure 6. Entropy reflects changes in complexity [42], thus the texture changes in the red area can be identified based on the display characteristics of entropy images, mainly the shape and texture. The changing shape represents the complexity and simplicity of the landscape. The changing texture represents complexity and a single texture. The four types were grouped into simple and complex textures and shapes. The change from left to right represents the physical and visual types, and the change from top to bottom represents texture and shape (Figure 6). The landscape complexity enhances the visual absorption capacity from the perspective of visual perception. Notably, complex shapes and textures, such as untrimmed weeds and broken roads, cause visual confusion.
(2)
Combination of passive enjoyment and active enjoyment
The cube was refined and classified according to the landscape service in the visualization cube to further explore passive enjoyment (PE) and active enjoyment (AE) of landscape service. The PE and AE of the specific village scene were mapped to their types according to the color partition. Eight different combinations were identified through permutation and combination. The format was changed from square to circle to show the red, green, and blue areas based on the entropy image (Figure 6). A dashed line was used to represent the radiation range, and a solid line was used to represent the stratification. The left side was predisposed to community service design, providing rural community services, specific facilities, and services, such as parking services, manual activity experiences, homestay services, pavilions, tea rooms, etc. (Figure 7). The right side was predisposed to landscape service design, focusing on landscape services, planning, and conservation design.

3.4. Questionnaire Survey

Questionnaires were distributed to residents of Yuan Touli village during the afternoon from 10–16 January 2022. Scenes from 12 major design nodes in the project were selected from its source. Four routes were used for further analysis (Figure 8), according to the distance. Details on the tourists’ behavioral choices and psychological motivations were obtained through observations, interviews, and questionnaires. The test was conducted using rendered photos. Editing and simulation of 12 groups of landscape pictures were performed using Adobe Photoshop CC 2020 and Adobe After Effects CC 2020. The questionnaire was divided into the following parts:
(1) The demographics of the interviewees, such as their age, level of education, and employment history; (2) the frequency of travel to rural areas; (3) the behaviors selected and the motivation chosen; and (4) the respondents’ choice of 12 landscape images. (5) The choices of respondents for various regions across 12 entropy pictures. (6) Traveling’s emotional state during the 12 points (7) Use of the entropy-based method as a tool to interview the different roles during the design and construction processes.
A Likert scale of 1–7, with 1 denoting “dislike very much” and 7 denoting “like very much”, was used to evaluate the respondents’ preference for landscape photos. The subjects were requested to report how much of the countryside they would want to see in the image before the experiment.

4. Results

4.1. Reliability of Data

The SPSS 25.0 software was used to verify the reliability and validity of the data from the 87 questionnaires that met the eligibility criteria.
Reliability test: The Cronbach value was used to explore the reliability of the questionnaire data. A value higher than 0.8 indicated that the questionnaire data had a very high reliability; and a value between 0.7 and 0.8 denoted that the reliability was high; a value between 0.6 and 0.7 implied that the reliability was acceptable; a value less than 0.6 indicated that the reliability was not good. The results showed that the reliability coefficient was 0.978, which is greater than 0.8, implying that the quality of the data was very high.
Validity test: The KMO value was used to evaluate the validity of the data. A value higher than 0.8 indicates good validity; a value between 0.7 and 0.8 indicates good validity; a value between 0.6 and 0.7 indicates average validity; a value less than 0.6 indicates poor validity. The findings indicated that the KMO value of the data was 0.828, which is greater than 0.8, implying that the data had good validity.

4.2. Sociodemographic Characteristics of Participants

The sociodemographic characteristics and recreational conditions of the respondents are presented in Table 1. The age of the interviewees ranged from 16–73 years old, and most of the participants had a junior college or bachelor’s degree. The frequency of recreation was relatively average. Interviewees who traveled to rural areas once a half year or more accounted for 31% of the total participants. This finding indicates that the interviewees did not frequently travel to rural places. Recreational activities reported by the subjects included walking, sitting, resting, photography, drinking tea and chatting, and taking in scenic views, which accounted for over 10% of the total.

4.3. Correlation Analysis of All Variables

A correlation analysis was conducted to determine the total score and the number of behaviors at the 12 nodes. The correlation between 5 items namely selection psychology, red area, green area, and the blue area was conducted in this study (Figure 8). Pearson’s correlation coefficient was used to indicate the strength of the correlation. Analysis of scenario 1 showed that all five items in scenario 1 were significantly correlated, with correlation coefficient values of 0.289, 0.511, 0.543, 0.494, and 0.357. The correlation coefficient values were greater than 0, indicating that the total score and behavior quantity, choice psychology, the red area, the green area, and the blue area were positively correlated. However, the correlation between behavior quantity, green area, and blue area was insignificant. The correlation between the items was visualized using a heat map (Figure 8). The correlation between the number of behaviors and the total score, choice psychology, red area, green area, and blue area was weak (Figure 8). The number of behaviors in scenario 1 was correlated with the green area. The correlation between the number of behaviors and the blue area was insignificant. The correlation between the number of actions and the red and cyan regions was insignificant in scenario 2. The correlation between the number of actions in scenario 3 and the red region was insignificant. The correlations between the number of actions in scenario 6 and the green and blue areas were insignificant. The standard deviation of the number of behaviors was large due to the influence of factors such as tourists’ behavioral preferences and activity preferences.
The degree of positive correlation between behavioral motivation and the total score was relatively large. It was followed by a relatively large positive correlation degree between the three regions and the total score, and the specific degree of correlation varied in each scene. Analysis of the average experience score of each scenario showed that the red area scores were lower, and the green and blue areas scores were higher. However, the three scores were lower than the overall experience score of the scenario. Therefore, the experience of the local landscape in each scene cannot represent the overall experience. These findings indicate that the overall experience was superior to the landscape experience of a single area.

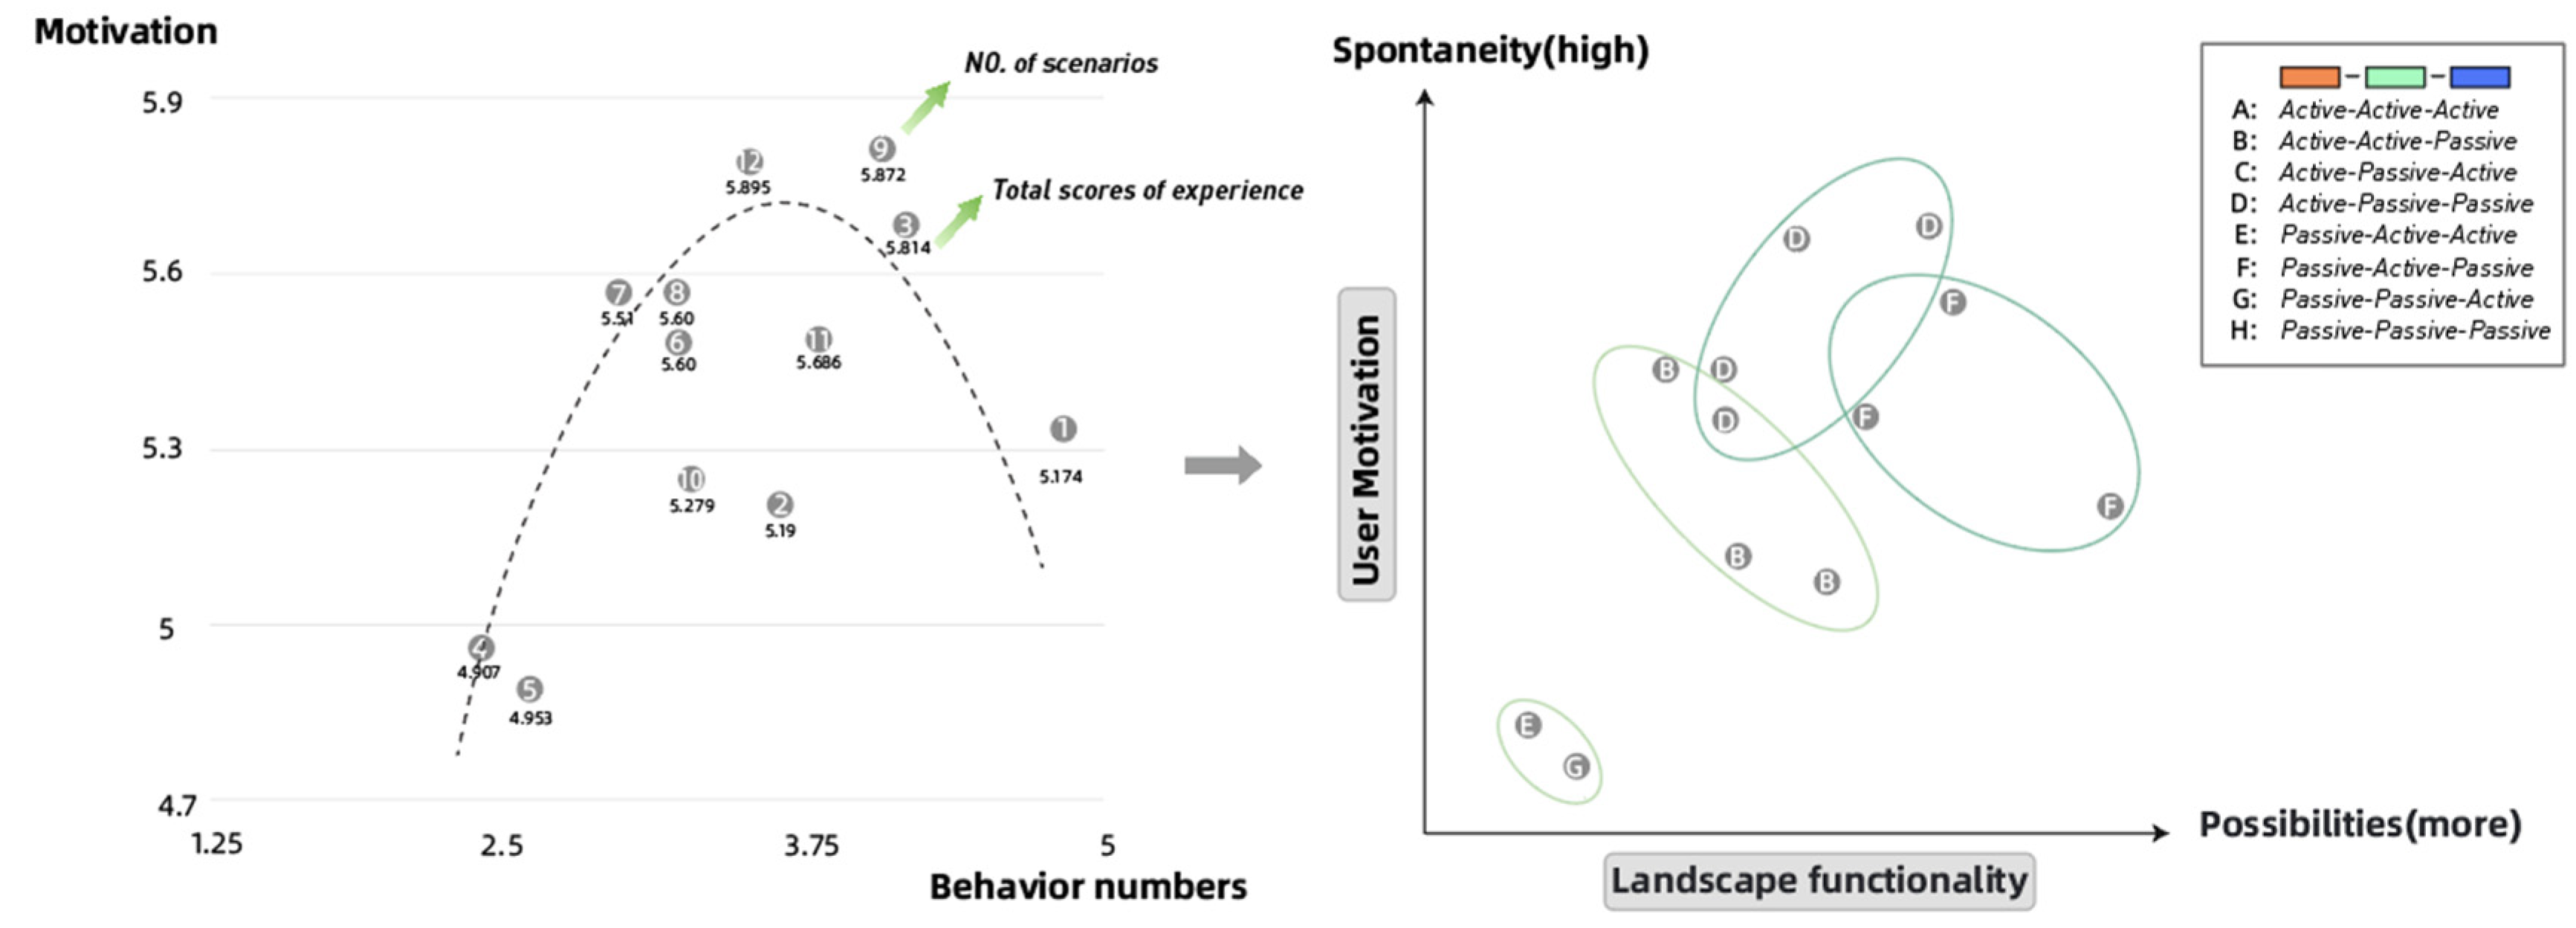
4.4. Relationship and Combination of Passive Enjoyment and Active Enjoyment

The visualization cube was to present the information of the 12 scenarios based on the results (Figure 9). Several studies have explored the relationship between passive and active enjoyment. In this study, the psychology, landscape services, behavior, and tourism were explored, as they are important components of the tourist experience. As a result, it is imperative to evaluate these components in the context of actual project practice. The number of behaviors corresponds to the landscape’s possible behaviors. The psychological feeling indicates the clarity of the user’s motivation to choose a specific behavior. Notably, the relationship between active enjoyment and passive enjoyment is correlational rather than causal. Correlation and regression analyses were conducted to further explore the relationship between active enjoyment and passive enjoyment using SPSS 25.0.

4.4.1. Correlation and Regression Analysis of Behaviors and Motivation

In this study, correlation and regression analyses were performed to evaluate the relationship between behavior variables (BV) and motivation variables (MV) and determine the optimal combination of passive and active enjoyment.
The model R2 value was 0.941, implying that the number of behaviors and psychological feelings can explain 94.1% of the cause of change in the tourists’ experience during the tour. The regression model passed the F-test (F = 71.350), indicating that at least one of the variables had an influential relationship with satisfaction (Table 2). The behaviors, motivation, and total scores—these three previously mentioned variables—were significant, thus there were no excluded variables in this analysis. The B-values of the behaviors and motivation variables in the model were −0.059 and 1.193, respectively, indicating that the number of behaviors had a significant negative influence relationship on the experience value whereas users’ motivation had a significant positive influence relationship on the experience value (Table 3). A simple multiple linear regression model was constructed based on the regression coefficients. The regression equation was: experience value = −0.811 − 0.059 × Behaviors + 1.193 × Motivation.

4.4.2. Definition and Description of the Relationship between AE and PE

The x-axis of the coordinate axis in Figure 10 shows the possibilities offered by landscape services in the scene. The y-axis of the coordinate axis indicates the degree of clarity of the tourists’ psychological motivation to choose a behavior or activity in the scene. A high score indicates high clarity and motivation to choose a specific activity. Landscape functionality is mainly reflected in a rich set of specific functions to choose from. A high degree of clarity in motivation is correlated with a strong user’s internal purpose. A low clarity of motivation is associated with a random user’s behavior choice, which is dependent on external stimuli and environmental changes.
Pearson correlation analysis showed that the motivation of visitors and the overall rating were significantly positively correlated, with a correlation coefficient of 0.965 (p < 0.01). However, the correlation between the number of behaviors and the overall rating was insignificant. These findings indicate that tourists have higher rating degrees for both modes of active-passive-passive enjoyment and passive-active-passive enjoyment. Motivation and behavior possibilities were high. Therefore, the mutual matching of active and passive was an essential factor to enhance tourists’ experiences in the red and green regions, whereas passive enjoyment was dominant in the blue region. AE-AE—PE exhibited relatively lower motivation and behavior possibilities. It is easy to exhibit active enjoyment if the choice of behavioral possibilities is relatively small, and the psychology can easily generate a vague feeling.
In summary, the two combinations of active enjoyment-passive enjoyment—passive enjoyment and passive enjoyment—active enjoyment—passive enjoyment (D and F in Figure 6) result in a better visitor experience in traditional village tourism. The behavioral and psychological motivation that users can exhibit for landscape services is positively correlated with the visitors’ experience.

4.4.3. Comparing the Combination between AE and PE in Two Village

The findings indicated that active enjoyment and passive enjoyment occur simultaneously in tourism scenarios (Figure 11). Today’s rural tourism mainly focuses on leisure tourism and does not require specific local tourist spots. However, it requires an adequate relaxing ambiance. Therefore, the definitions of AE and PE are often approximate, and their effective combination improves the experience. For example, experiencing bamboo weaving in a house in a traditional village and experiencing bamboo weaving in a bright city room will bring different experiences as the scene’s atmosphere improves the enjoyability of the activity. This experience excludes the effect of the activity. The value increases through the combination of the activities and the environment. Therefore, exploring the combination between activities and the environment in a specific scene helps in planning and designing.
The combination of designing the spaces, facilities, activities, and exhibitions improves the user experience. In this study, 12 scenes in Gaotiankeng Village were mapped and analyzed. The two villages are traditional villages, and the plan and design measures are typical for traditional village tourism. The two villages are highly rated by tourists in the tourism industry; thus, they were selected for comparison and analysis.
The results showed that Gaotiankeng Village had eight scenes on the right side and four scenes on the left side (Figure 11). Seven scenes were observed on the right area and five scenes on the left area of Yuan village. The Gao Tiankeng village was highly quaint and had more traditional houses, facilities, and landscapes used for planning compared with the Yuan Touli village. The ‘tradition’ was the key word to attract tourists, so developers just renovated some destroyed landscapes. Yuan Touli village was a completely tourism-oriented village with several facilities and landscapes designed to attract tourists. Villages depending on landscape services had more nodes leaning to the right, and villages relying on community service design had more nodes to the left. Several nodes were also observed in the middle combinations. The combination of AE and PE in the scenarios during the whole travel experience is necessary. Analysis showed that the positive emotions of Gao Tiankeng Village were deep red, indicating that the village had mainly the emotion of joy, whereas the overall color of Yuan Touli Village was deep green, indicating that it was mainly characterized by the emotion of excitement. These findings indicate that the scenic environment can increase the joy of tourists, and the addition of community services, such as camping services and hand-made activities, can increase the excitement of tourists.

4.5. Analysis of Experience Emotions

The yellow route comprises scenarios of No. 1, 2, 3, 4, 5, and 6; the red route comprises scenarios of No. 3, 5, 6, 7, and 8; the blue route comprises scenarios of No. 5, 7, 9, and 12; and the green route comprises scenarios of No. 10, 11, and 12, as shown in Figure 7.
The average experience of the fourth small line was optimal, and the average experience of the first line was poor. The overall score of the first line was lower than the overall experience score. The average scores of the second, third, and fourth lines were higher than the overall experience score. This indicates that the first line can improve the score of pleasure.
A correlation analysis was conducted to explore the correlation between scene evaluation and negative emotions, novelty, excitement, and pleasure (Table 4). The results showed a significant negative correlation between scene evaluation and negative emotions. The correlation between scene evaluation and novelty was significantly positive. The correlation between scene evaluation and excitement was significantly positive. The correlation between scene evaluation and pleasure was significantly positive.
A linear regression analysis was conducted with joy, excitement, novelty, and negative emotions as independent variables and the scene evaluation as the dependent variable. The model formula was: scene evaluation = 1.511 + 0.675 × pleasure − 0.055 × excitement + 0.160 × novelty − 0.020 × negative emotion. The model R-square value was 0.895 (Table 5). These results imply that pleasure, excitement, novelty, and negative emotion explained 89.5% of the changes in scene evaluation. The model passed the F-test (F = 113.511, p = 0.000 < 0.05), indicating that at least one parameter among pleasure, excitement, novelty, and negative emotions impacted the scenario evaluation. The regression coefficient value of pleasure was 0.675 (t = 6.502, p = 0.000 < 0.01), meaning pleasure significantly affected scene evaluation.
The regression coefficient of excitement was −0.055 (t = −0.529, p = 0.599 > 0.05). This finding indicates that excitement does not affect the scene’s evaluation.
The regression coefficient value of novelty was 0.160 (t = 2.919, p = 0.005 < 0.01), indicating that novelty had a significant positive impact on scene evaluation.
The regression coefficient value of negative emotions was −0.020 (t = −0.642, p = 0.523 > 0.05), implying that negative emotions did not affect the scene evaluation.
In summary, joy and novelty had a positive impact on tourist experiences, whereas excitement and negative emotion did not have a significant effect on them. Therefore, joy and novelty should be enhanced to improve tourists’ experiences. Excitement is often the anticipation of the next scene, and the evaluation of this scene does not have much impact. The exploration triggered by the unknown is exciting. Negative emotions have little effect on scene evaluation because positive emotions tend to cover negative emotions during the process. Therefore, the focus during the design project was on the beautiful landscape, comfortable environment, special activities, and avoiding the constructing of several unnecessary facilities, such as extreme sports facilities. The village tourist business is currently under operation. Tourists and locals report that the overall village has preserved a relatively complete traditional village appearance. The tourists reported that the overall tour experience was very good. Tourists can immerse themselves in the beautiful scenery and experience the traditional scenery. Some tourists find it fascinating to experience the events and play a role in increasing the community’s services.

5. Applications and Discussion

5.1. Mapping the Experience

Nos 1 and 2 represent the navigation bar, and 3–9 denote the operation display bar (Figure 12). The route selection area is indicated as 1. The relevant conditions of the route are observed when different routes are selected. The navigation bar of the operation display bar, including the map, emotion color, experience evaluation, simulation video, and analysis, is presented as 2. The map comprises routes and cubes. In the figure, 3 and 4 indicate the cube after selecting the node in the route.
The combination change is displayed below the cube, and the design plan can be considered according to the definition of the combination. The emotion color of the whole route is displayed in RGB mode as 7. The triangle represents the analysis of positive emotion. The experience evaluation showed three different areas (red, green, and blue) of experiential scoring in entropy. The computer graphic shows a dynamic video of the walking simulation on this route. The analysis includes 5 and 6, whereby 5 represents the image and type and 6 denotes the changing elements of type, namely physically, visually, shape, and texture. The overall operation depends on the multi-module linkage mode. For example, when the mouse is moved to the position of any keyframe in 5, the relevant data of the current keyframe is displayed in 7, 8, and 9, enhancing convenience for user operation.
In summary, the mapping was used to analyze the user experience after combining perception and emotion. The mapping is a tool that predicts the design and provides references to designers, planners, and other operators. Further research on Yuan Touli village was conducted using this method.

5.2. Application of the Visualization Method in the Design Project

Changes in the progress of the design project were mapped using the entropy method. The timeline is presented from left to right in Figure 13. The project began at the end of 2019. The village was a completely damaged and deserted traditional village at that time. Our team (as developers) conducted a survey and proposed the scheme’s design. Then developers, villagers, and tourists used the entropy-based visualization method to present their ideas and discuss them, as shown in the third stage. The previous plan was modified and implemented to form the photo presented in the fourth stage. The picture shows the interests, main operations, and opinions of developers, villagers, and tourists, from top to bottom.
The traditional design process ends after the first and second stages. Tourists and villagers are not interested in participating after viewing the renderings. They believe that the design is the designer’s responsibility, and they have no ability to present their ideas. However, the project designed by the designer is meant to serve the villagers and tourists, so the participation of all parties is necessary. The designer uses entropy images to analyze and test the design in the first and second stage, to comprehensively protect the tourism resources of traditional villages.
The three groups have their own new ideas and proposals after using this visualization method, and they effectively communicate and inspire each other. The results showed that different groups of people have different concerns, and this complementarity improves the efficiency of the plan. Several tourists visit the villages, and the villagers actively explore the various services they should provide to the tourists, such as making traditional snacks and offering a local organic tea ceremony experience. Tourists will present their feedback and own ideas. This continuously enriches the content of the data, which can be regularly updated to serve as a reference pattern for other villages.
The specific content is presented in Figure 13. The results show that the visualization method is effective and practical. The method can be used as a tool for participatory design to stimulate the imagination and creativity of various groups of people. Several tests and facts indicate that the method is highly effective. In the past, the design process of a project was believed to be the work of designers, so the villagers and tourists had a negative attitude toward the design. They just gave feedback on the rendering, as shown in steps 1 and 2 of the villagers and tourists in Figure 13. The entropy system was applied for steps 3 and 4 to the three groups. The results showed that the entropy system can be used as a participant tool to stimulate a discussion of the options of different people and effectively convey their comments.

5.3. Dynamic Design Strategy

The entropy image-based approach was used in this to explore visitor experience during a visit to traditional villages in China. The interaction of enjoyment and aesthetics in landscape service on the perception, emotion, and behavior of the visitor experience was evaluated using the entropy image approach. The method comprises a dynamic strategy for combining landscape and experience design.
Landscape service and user experience were balanced throughout the design process. The findings showed that types and combinations were correlated with the user’s experience as shown in Figure 14. In addition, type and combination should be coordinated. Type was the foundation of tourist perception, and combination was the enhancement of the tourist experience. The aim of the experience design research is to create high-quality experiences for tourists [43]. Service providers (developers and villagers) should work closely with tourists to understand their experiences.
In summary, a dynamic design strategy based on landscape services and user experience is more effective. The visualization method has a dynamic application, which emphasizes the experience during the trip. It focuses on the dynamic experience of space and time. The coherent experience of tourists in the village was simulated using the visualization cube to explore the tourist experience. The simulation provided design proposals for the landscape and community services. Visualization methods help developers, villagers, and tourists determine the problem and solutions together. Using these methods, everyone participates in rural construction and promotes the development of inclusive tourism.

6. Conclusions

The aim of this study was to improve the tourist experience by designing and establishing inclusive tourism in a traditional village. Firstly, a survey was conducted to explore the village tourism resources using the LS + HLE strategy, and the design goals were set. The combinations and types were analyzed based on the entropy image, and the visualization method and creation of a visualization system were proposed. The visualization system showed the results and analysis on the surface, indicating that it is an efficient tool for establishing the participation designs of different groups of people. Developers, villagers, and tourists can focus on different tourism points and increase discussion and participation using this method.
The combinations of passive enjoyment and active enjoyment were further analyzed. The results showed that the optimized combinations were active enjoyment-passive enjoyment—passive enjoyment and passive enjoyment—active enjoyment—passive enjoyment (D and F). These combinations can be used to achieve a better visitor experience in traditional village tourism. A scenario for tourists was simulated to evaluate these two combinations. The design outcome that suited the design concept was verified based on the combinations. Some community service designs, such as experiencing traditional pastry making activities, were added according to the tourists’ emotions. The PE and AE combinations represented the enjoyment of tourists and can be used to formulate design strategies to avoid the design homogenization phenomenon.
The study had some limitations. The sample selection may affect the results of the study. Statistical “sample bias” or “selection bias” can occur when probability sampling/random sampling is not representative of the population being studied. In this study, only the existence of service was explored, not its specific quantity and quality, which should be evaluated in further studies. In addition, this study mainly focused on the user’s perceptual experience, which is predominantly determined by vision, and the service effect part was not set as a variable. In this study, a traditional village in a mountainous area of China was the research object, and the village tourism design should be consistent regardless of how big the determined geographical span was. The methods used were generic and are effective for rural landscape, urban planning, and park design. The method assumes that rural tourism and service design are based on landscape and users.
The method proposed in this research is effective in improving rural tourism. The application of the method was proposed in three stages of experience design [44,45]. Application in the exploration stage: In the exploration stage, the method can be tested according to the state before the renovation during the pre-study. The traditional village layout, spatial scale, and material texture have a long history. Therefore, visualization can be used to deeply explore the beauty of elements such as traditional buildings. It can be used to explore the scenes that require significant repairs and those that should be slightly modified. Application in the generation stage: The visualization operations can be used to effectively identify where the type should be changed, such as enriching the vision through texture and shape or changing the route to improve the experience. In addition, it can be used to determine where the combination should be changed to improve the user experience. For example, the combination that favors PE can be used to attract tourists by adding some community services, such as setting up traditional handicraft activities. Application in the evaluation stage: The evaluation stage is similar to the generation stage. The actual evaluation and feedback of the user experience can be carried out and recorded in the system at this stage. Further studies should be conducted and the system used to build a database to record tourist preference information. The method can be used in different villages, allowing more people to participate in inclusive tourism.

Author Contributions

Conceptualization, W.W., M.W.; methodology, W.W., M.W. and K.O.; software, W.W.; validation, W.W., M.W., K.O. and D.Z.; formal analysis, W.W.; investigation, W.W.; resources, W.W. and D.Z.; data curation, W.W.; writing—original draft preparation, W.W.; writing—review and editing, W.W., M.W., D.Z. and K.O.; visualization, W.W. and D.Z.; supervision, M.W. and K.O.; project administration, M.W.; funding acquisition, W.W. All authors have read and agreed to the published version of the manuscript.

Funding

This research received no external funding.

Institutional Review Board Statement

The study did not require ethical approval.

Informed Consent Statement

Not applicable.

Data Availability Statement

The data presented in this study are available in the article.

Conflicts of Interest

The authors declare no conflict of interest.

References

  1. Hamalainen, T.J.; Heiskala, R. (Eds.) Social Innovations, Institutional Change and Economic Performance; Edward Elgar: Cheltenham, UK, 2007. [Google Scholar]
  2. Mosedale, J.; Voll, F. Social innovations in tourism: Social practices contributing to social development. In Social Entrepreneurship and Tourism; Sheldon, P.J., Daniele, R., Eds.; Springer: Cham, Switzerland, 2017; pp. 101–115. [Google Scholar]
  3. Bastian, O.; Grunewald, K.; Syrbe, R.-U.; Walz, U.; Wende, W. Landscape services: The concept and its practical relevance. Landsc. Ecol. 2014, 29, 1463–1479. [Google Scholar] [CrossRef]
  4. de Jong, T.M.; Van Der Voordt, D. Ways to Study and Research: Urban, Architectural, and Technical Design; DUP Science: Durham, NC, USA, 2002. [Google Scholar]
  5. Vallés-Planells, M.; Galiana, F.; Van Eetvelde, V. A Classification of Landscape Services to Support Local Landscape Planning. Ecol. Soc. 2014, 19, 44. [Google Scholar] [CrossRef] [Green Version]
  6. Bastian, O.; Walz, U.; Decker, A. Historical landscape elements: Part of our cultural heritage—A methodological study from Saxony. In The Carpathians: Integrating Nature and Society Towards Sustainability; Springer: Berlin/Heidelberg, Germany, 2013; pp. 441–459. [Google Scholar]
  7. Henry, J.G.; Heinke, G.W.; Burton, I. Environmental Science and Engineering; Springer: Berlin/Heidelberg, Germany, 2013. [Google Scholar]
  8. Ahlava, A.; Suominen, J.; Rossi, S. Controlling Risks Through Flexibility and Urban Integration: The Regeneration of Otaniemi Campus in Finland. In Handbook of Theory and Practice of Sustainable Development in Higher Education; Springer: Cham, Switzerland, 2017; pp. 21–35. [Google Scholar]
  9. Williams, A. China’s shift from urban development to rural reconstruction. Archit. Rev. 2018. Available online: https://www.architectural-review.com/essays/chinas-shift-from-urban-development-to-rural-reconstruction (accessed on 28 February 2023).
  10. Li, L.H.; Lin, J.; Li, X.; Wu, F. Redevelopment of urban village in China—A step towards an effective urban policy? A case study of Liede village in Guangzhou. Habitat Int. 2014, 43, 299–308. [Google Scholar] [CrossRef]
  11. Culture Trip, Eerie Landscapes: Abandoned Villages in China. 2017. Available online: https://theculturetrip.com/asia/china/articles/eerie-landscapes-7-abandoned-villages-in-china/ (accessed on 23 December 2022).
  12. Cattaneo, T.; De Lotto, R. Rural-Urban-Architecture: Design Strategies for Small Towns Development; Alinea Editrice: Florence, Italy, 2014. [Google Scholar]
  13. Long, H.; Li, Y.; Liu, Y.; Woods, M.; Zou, J. Accelerated restructuring in rural China fueled by ‘increasing vs. decreasing balance’land-use policy for dealing with hollowed villages. Land Use Policy 2012, 29, 11–22. [Google Scholar] [CrossRef]
  14. Campos, A.C.; Mendes, J.; Valle, P.O.D.; Scott, N. Co-creation of tourist experiences: A literature review. Curr. Issues Tour. 2015, 21, 369–400. [Google Scholar] [CrossRef]
  15. Helkkula, A.; Kelleher, C.; Pihlström, M. Practices and experiences: Challenges and opportunities for value research. J. Serv. Manag. 2012, 23, 554–570. [Google Scholar] [CrossRef]
  16. Trischler, J.; Zehrer, A. Service design: Suggesting a qualitative multistep approach for analyzing and examining theme park experiences. J. Vacat. Mark. 2012, 18, 57–71. [Google Scholar] [CrossRef]
  17. Lee, G.; Tussyadiah, I.P.; Zach, F. A Visitor-Focused Assessment of New Product Launch: The Case of Quilt Gardens TourSM in Northern Indiana’s Amish Country. J. Travel Tour. Mark. 2010, 27, 723–735. [Google Scholar] [CrossRef]
  18. Tussyadiah, I.P. Toward a Theoretical Foundation for Experience Design in Tourism. J. Travel Res. 2013, 53, 543–564. [Google Scholar] [CrossRef]
  19. Prebensen, N.K.; Xie, J. Efficacy of co-creation and mastering on perceived value and satisfaction in tourists’ consumption. Tour. Manag. 2017, 60, 166–176. [Google Scholar] [CrossRef] [Green Version]
  20. Kim, Y.G.; Eves, A. Construction and validation of a scale to measure tourist motivation to consume local food. Tour. Manag. 2012, 33, 1458–1467. [Google Scholar] [CrossRef]
  21. Evenson, S.; Dubberly, H. Designing for Service: Creating an Experience Advantage. In Introduction to Service Engineering; Salvendy, G., Karkowski, W., Eds.; Wiley: Hoboken, NJ, USA, 2010. [Google Scholar]
  22. Walls, A.R.; Okumus, F.; Wang, Y.R.; Kwun DJ, W. An epistemological view of consumer experiences. Int. J. Hosp. Manag. 2011, 30, 10–21. [Google Scholar] [CrossRef]
  23. Peng, J.; Chen, X.; Liu, Y.; Lü, H.; Hu, X. Spatial identification of multifunctional landscapes and associated influencing factors in the Beijing-Tianjin-Hebei region, China. Appl. Geogr. 2016, 74, 170–181. [Google Scholar] [CrossRef]
  24. Šťastná, M.; Vaishar, A. Values of rural landscape: The case study Chlum u Třeboně (Bohemia). Land Use Policy 2020, 97, 104699. [Google Scholar] [CrossRef]
  25. Nassauer, J.I.; Opdam, P. Design in science: Extending the landscape ecology paradigm. Landsc. Ecol. 2008, 23, 633–644. [Google Scholar] [CrossRef]
  26. Hauberg, J. Research by design: A research strategy. Archit. Educ. J. 2011, 5, 46–56. [Google Scholar]
  27. Roggema, R. Research by Design: Proposition for a Methodological Approach. Urban Sci. 2016, 1, 2. [Google Scholar] [CrossRef] [Green Version]
  28. Tveit, M.; Ode, Å.; Fry, G. Key concepts in a framework for analysing visual landscape character. Landsc. Res. 2006, 31, 229–255. [Google Scholar] [CrossRef]
  29. De Groot, R.S.; Alkemade, R.; Braat, L.; Hein, L.; Willemen, L. Challenges in integrating the concept of ecosystem services and values in landscape planning, management and decision making. Ecol. Complex. 2010, 7, 260–272. [Google Scholar] [CrossRef]
  30. Hermann, A.; Schleifer, S.; Wrbka, T. The Concept of Ecosystem Services Regarding Landscape Research: A Review. Living Rev. Landsc. Res. 2011, 5, 1–37. [Google Scholar] [CrossRef] [Green Version]
  31. Naveh, Z. What is holistic landscape ecology? A conceptual introduction. Landsc. Urban Plan. 2000, 50, 7–26. [Google Scholar] [CrossRef]
  32. Moore, L.F.; Normann, R. Service Management: Strategy and Leadership in Service Businesses; John Wiley & Sons: New York, NY, USA, 1991. [Google Scholar]
  33. Cattaneo, T.; Giorgi, E.; Ni, M. Landscape, Architecture and Environmental Regeneration: A Research by Design Approach for Inclusive Tourism in a Rural Village in China. Sustainability 2018, 11, 128. [Google Scholar] [CrossRef] [Green Version]
  34. Stamps, A.E., III. Entropy, visual diversity, and preference. J. Gen. Psychol. 2002, 129, 300–320. [Google Scholar] [CrossRef]
  35. Dupont, L.; Ooms, K.; Duchowski, A.T.; Antrop, M.; Van Eetvelde, V. Investigating the visual exploration of the rural-urban gradient using eye-tracking. Spat. Cogn. Comput. 2016, 17, 65–88. [Google Scholar] [CrossRef]
  36. Stamps, A.E., III. Mystery, complexity, legibility and coherence: A meta-analysis. J. Environ. Psychol. 2004, 24, 1–16. [Google Scholar] [CrossRef]
  37. Cun, X.; Pun, C.-M.; Gao, H. Applying stochastic second-order entropy images to multi-modal image registration. Signal Process. Image Commun. 2018, 65, 201–209. [Google Scholar] [CrossRef]
  38. Shannon, C.E. A Mathematical Theory of Communication. Bell Syst. Tech. J. 1948, 27, 379–423. [Google Scholar] [CrossRef] [Green Version]
  39. de Senneville, B.D.; Zachiu, C.; Ries, M.; Moonen, C. EVolution: An edge-based variational method for non-rigid multi-modal image registration. Phys. Med. Biol. 2016, 61, 7377–7396. [Google Scholar] [CrossRef]
  40. Guan, Q.; Jin, Q.; Long, H.; Li, K.; Hu, H.; Wang, X. A more precise multi-modal image registration using self-similarities. In Proceedings of the 2017 10th International Congress on Image and Signal Processing, Biomedical Engineering and Informatics (CISP-BMEI), Shanghai, China, 14–16 October 2017; pp. 1–5. [Google Scholar]
  41. Wang, W.; Watanabe, M.; Ono, K.; Zhou, D. Exploring Visualisation Methodology of Landscape Design on Rural Tourism in China. Buildings 2022, 12, 64. [Google Scholar] [CrossRef]
  42. Shostack, L. Designing services that deliver. Harv. Bus. Rev. 1984, 62, 133–139. [Google Scholar]
  43. Bitner, M.J.; Booms, B.H.; Tetreault, M.S. The Service Encounter: Diagnosing Favorable and Unfavorable Incidents. J. Mark. 1990, 54, 71. [Google Scholar] [CrossRef]
  44. Berry, L.L.; Wall, E.A.; Carbone, L.P. Service Clues and Customer Assessment of the Service Experience: Lessons from Marketing. Acad. Manag. Perspect. 2006, 20, 43–57. [Google Scholar] [CrossRef] [Green Version]
  45. Becker, L.; Jaakkola, E. Customer experience: Fundamental premises and implications for research. J. Acad. Mark. Sci. 2020, 48, 630–648. [Google Scholar] [CrossRef] [Green Version]
Figure 1. Framework of the research concept process.
Sustainability 15 04540 g001
Figure 2. Maps for Gaotiankeng Village and Yuan Touli Village.
Sustainability 15 04540 g002
Figure 3. Setting design goals for village development based on the LS and HLE framework.
Sustainability 15 04540 g003
Figure 4. A representation of the image processing method. The landscape in the picture is the village entrance sign, and the Chinese Characters in the picture indicate “Gao Tiankeng” Village.
Sustainability 15 04540 g004
Figure 5. The structure of the visualization framework cube.
Sustainability 15 04540 g005
Figure 6. Image types and combination.
Sustainability 15 04540 g006
Figure 7. Scenario graphs, entropy visualization images, and heat maps of correlations between variables. * p < 0.05, ** p < 0.01. The p value is the probability, and the p value obtained by statistics according to the significance test method is generally considered significant if p < 0.05 and very significant if p < 0.01.
Sustainability 15 04540 g007
Figure 8. A map of a random route selection and scenarios image.
Sustainability 15 04540 g008
Figure 9. Visualization cube of the 12 scenarios.
Sustainability 15 04540 g009
Figure 10. Analysis of the optimized combination of active and passive enjoyment.
Sustainability 15 04540 g010
Figure 11. Comparing of the Gaotiankeng village and Yuan Touli village.
Sustainability 15 04540 g011
Figure 12. The surface of mapping of the visualization method.
Sustainability 15 04540 g012
Figure 13. A map showing use of the visualization method for different roles.
Sustainability 15 04540 g013
Figure 14. Framework of dynamic design strategy.
Sustainability 15 04540 g014
Table 1. Sociodemographic characteristics of participants.
Sociodemographic CharacteristicsNumber of Subjects %
Age<1733.4%
18–447382%
45–59910.1%
>6044.5%
Educational backgroundHigh school and below 1314.6%
Junior college or undergraduate7179.8%
Graduate student or above 55.6%
Recreational status
Recreational frequency
Once a week or more910.1%
Once a month or more2629.2%
Once a half year or more2831.5%
Once a year or more2629.2%
Recreational activity (multiplechoice)Walking46713.1%
Running912.5%
Sitting and resting51414.4%
Photographing41311.6%
Climbing and scenic view1293.6%
Drinking tea and chatting42311.8%
Participating in handicraft activities1494.2%
Exercise and dance 982.7%
Playing chess and cards1664.6%
Reading and listening to songs2898.1%
Fishing1183.3%
Scenic view38610.8%
Drawing and practice1464.1%
Sing862.4%
Camping992.8%
Table 2. Model summary.
ANOVA a
ModelSum of squareDegrees of freedomMean squareFSignificance
1Regress1.24920.62471.3500.000 b
Residual0.07990.009
Total1.32711
a Dependent variable: Experience value; b Predictor: (constant), BV, MV.
Table 3. Results of parameter estimation.
Coefficient a
ModelUnstandardized coefficientsStandardized coefficientsTSignificance
BStandard errorBeta
1(constant)−0.8110.533 −1.5220.162
Behaviors−0.0590.048−0.117−1.2320.249
Motivation1.1930.1101.02510.8180.000
a Dependent variable: Experience value.
Table 4. Pearson correlation results for tourism experience parameters.
MeanStandard DeviationNegative EmotionNoveltyExcitementJoyScene Evaluation
Negative emotion2.4201.1131
Novelty4.8941.131−0.341 **1
Excitement5.1770.961−0.391 **0.861 **1
Joy5.4970.830−0.449 **0.791 **0.926 **1
Scene evaluation5.6680.710−0.444 **0.825 **0.887 **0.935 **1
** p < 0.01.
Table 5. Linear regression analysis.
Unstandardized CoefficientsStandardized CoefficienttpR 2Adjustment R 2F
BStandard ErrorBeta
Constant1.5110.289-5.2320.000 **0.8950.888F (4,53) =113.511, p = 0.000
Joy0.6750.1040.7896.5020.000 **
Excitement−0.0550.105−0.075−0.5290.599
Novelty0.1600.0550.2552.9190.005 **
Negative emotion−0.0200.032−0.032−0.6420.523
Dependent Variable: Scenario Evaluation. ** p < 0.01.
Disclaimer/Publisher’s Note: The statements, opinions and data contained in all publications are solely those of the individual author(s) and contributor(s) and not of MDPI and/or the editor(s). MDPI and/or the editor(s) disclaim responsibility for any injury to people or property resulting from any ideas, methods, instructions or products referred to in the content.

