Abstract
Increasing importance is being placed on sustainability worldwide to limit climate change’s effects. In New Zealand, a sizeable increase in demand for housing is driving a residential construction boom, with new dwelling consents increasing yearly for the last decade. The New Zealand Government’s commitment to sustainability has become legislation through the Climate Change Response (Zero Carbon) Amendment Act 2019. Therefore, the next stage is how the construction industry can limit and reduce its carbon emissions through one of the strategies, namely material choice. This study was intended to examine the influence of various building materials on climate change and to identify how more sustainable home construction and design in New Zealand may contribute to the government’s 2050 emissions reduction targets. A life-cycle assessment (LCA) was used in this study to investigate the global warming potential (GWP) produced by five case study houses and various material options for building envelope components. The study focused on the environmental impact of materials with high usage in industry and potential new materials that have shown an ability to conform to the New Zealand Building Code standards. It was found that case study House 1 (with timber flooring founded on senton piles with concrete footings, a timber frame, plywood wall cladding, and metal roof cladding) and House 2 (with a concrete waffle slab, a light steel frame, masonry wall cladding, and metal roof cladding) had the lowest GWP emissions compared to the other case study houses, with 631.13 and 633.16 kg CO2eq/m2, respectively. However, it should be noted that all the case study houses were not similar in size and design. In addition, the study investigated the different building envelope material options for the foundation, wall cladding, framing, and roof cladding. The study found that some new materials or materials that are not common in New Zealand could be used as an option for the housing envelope by having lower carbon emissions, such as 3D-printed concrete blocks compared with brick and concrete masonry for wall cladding systems.
1. Introduction
The earth’s average air temperature has risen rapidly since the early 1800s, with global temperature anomalies increasing from 0.4 °C in the 1980s to above 1 °C from 2010 onwards [1]. The primary drivers contributing to the changing climate of the earth are carbon emissions, deforestation, and land-use change [2], all of which have relevance to the construction industry. The industry contributes to one-third of global carbon emissions and nearly 40% of total energy use [3]. In New Zealand, the building and construction industry accounts for 20% of total national carbon emissions [4], with an increase of 26.4% between 1990 and 2019 [5]. The construction industry involves the extraction of huge amounts of materials, which necessitates the use of energy resources and the discharge of harmful pollutant emissions into the environment [6].
Carbon emissions from a building are generally split into two components: embodied and operational carbon. Embodied carbon is capital carbon produced to manufacture and maintain materials used to construct the building, while operational carbon is the carbon emitted during the building’s service life [7]. In response to the increase in carbon emissions in the country, the New Zealand government set its carbon reduction goal (net-zero carbon by 2050) in the Climate Change Response (Zero Carbon) Amendment Act 2019 [8], while also committing to the international agreement (Paris Agreement in 2016) to keep the global temperature rise to 1.5 °C by 2050 [9]. In addition, the Ministry of Business, Innovation, and Employment (MBIE) announced the Building for Climate Change program, which is responsible for leading the building and construction sector’s response to the climate crisis [10]. As part of the program, they released the Whole-Of-Life Embodied Carbon Assessment: Technical Methodology in 2022 [11] and the Whole-Of-Life Embodied Carbon Emissions Reductions for Buildings framework in 2020 [4]. This includes a systematic strategy and methodology for responding to the reduction goal in the construction sector.
Within New Zealand, there has been a lack of sufficient housing due to strong population growth. An estimated shortfall of between 28,000 and 45,000 dwellings has been reported for Auckland alone [12]. With the demand for housing only growing, the increase in new dwelling consents is expected to rise further [13]. However, construction materials for new developments are significant contributors to atmospheric emissions and solid waste. In current building practice, several building materials are utilized in the country’s new residential buildings. Figure 1 shows the market share of different building envelope materials in New Zealand. According to the Building Research Association of New Zealand (BRANZ) report [14], a survey regarding the materials used in new housing between 2010 and 2019, sheet metal had the largest market share compared with other materials (e.g., tiles, membrane, and plastic) with a 70.8% share for roof cladding, and timber framing had the largest market share compared to other materials for framing (e.g., steel and concrete) with 85.8% in 2019. Weatherboard (which is 75% timber and fiber cement (FC) and PVC) had a 43.7% market share for wall claddings, while finish brick (both clay and concrete) had a 24.7% market share, and other materials (e.g., aerated concrete, FC sheet, plywood, EIFS, stucco, sheet steel) had a 32.30% market share [14]. Additionally, for foundations in New Zealand residential buildings, concrete led the market share with a total of 96% and left only 4% for timber [15]. Looking at the material market shares in new residential buildings in New Zealand, three materials are commonly used for constructing houses, which are timber, steel, and concrete.
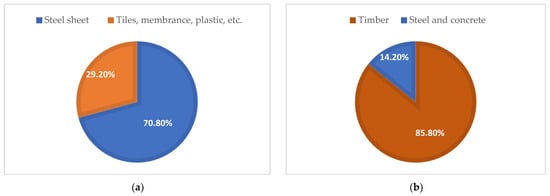
Figure 1.
Building materials’ market share in New Zealand: (a) roof cladding; (b) wall framing; (c) wall cladding; (d) foundation.
Given current building practices, timber has become the most commonly used material for home construction (mainly for framing and wall cladding) [14], and it is a preferred material in terms of sustainability [16]. However, the country is now experiencing a material shortage due to a lack of national investment in timber product production capacity and market supply and demand imbalances [17]. As a result, alternative construction materials, such as steel and concrete, are anticipated, but they must also address sustainability. Steelmaking is often noted as one of the most carbon-emission-intensive industries worldwide, with the industry responsible for approximately 8% of all GHG emissions worldwide [18]. In spite of its extensive carbon footprint during the manufacturing stage, steel has the most potential for recycling out of the three primary materials, with a reported 96% combined reuse and recycling rate in the UK [19]. In New Zealand, at the end-of-life (EOL) of a building, 75% of the steel mass, including steel sheets and structural steel, is recycled [20]. In addition, 96% of new dwellings consist of a reinforced concrete foundation, where the 30 MPa reinforced ordinary Portland cement (OPC) concrete with 100 kg/m3 steel reinforcement emits 0.29 kg CO2eq/kg [21]. Looking at the EOL of the concrete, 80% of the material mass will be sent to landfills, and only 20% of the mass will be treated in the recycling process (crushed for aggregate) [18].
Life-cycle assessment (LCA) is the most commonly used methodology for assessing the environmental impacts of a product and can be used to assess a building [22,23,24,25,26,27,28,29,30,31,32,33]. Two main focuses are typically taken into account when using LCA for buildings: analyzing the carbon emissions from the overall structures and evaluating particular building components, such as the roof and wall cladding [26,27,28]. Chastas et al. [29] conducted a review of 95 published LCA case studies on residential buildings. They found that with a 50-year building lifespan, the embodied carbon of the houses varied between 179 and 1050 kg CO2eq/m2, while the operational carbon was 156 to 4049.9 kg CO2eq/m2. Hawkins et al. [30] compared the embodied carbon of concrete, steel, and timber building structures. They discovered that when applying a fixed time horizon metric with a cradle-to-cradle system boundary, the steel materials had the lowest result (269 kg CO2eq/m2) compared to timber (no replanting) (336 kg CO2eq/m2) and concrete (348 kg CO2eq/m2). In terms of comparing the building life-cycle stages, Petrovic et al. [31] evaluated a single-family timber house using a cradle-to-grave system boundary with a 100-year lifespan. The use phase of the building was responsible for 64% of the total carbon emissions, while the production phases were responsible for 30%. Looking at the New Zealand-based LCA studies, the total carbon emissions of a house in New Zealand with a 90-year building lifespan were examined by Chandrakumar et al. [32]. According to the study, the residence emits 16 kg CO2eq/m2/year of carbon. They compared the outcome to the climate implications of residential construction in other countries, which ranged between 10 and 90 kg CO2eq/m2/year. A study compared light steel and light timber houses and found that the difference in carbon emissions between these buildings was only 12.3%; hence, there was no discernible difference [33].
Past studies have provided a background in research for the sustainability of materials in the construction industry. There is a lack of in-depth analysis into the implications of material choice within a New-Zealand-specific context. Therefore, this study aimed to analyze the impact of different building materials on climate change and determine how more sustainable construction and design of residential housing in New Zealand can contribute to the government’s 2050 emissions reduction goals.
Study’s Objectives and Scope
Two objectives were outlined to meet the aim of the study:
- (i)
- Assess and compare the current materials used for residential construction within New Zealand in terms of sustainability by utilizing LCA;
- (ii)
- Assess the feasibility of implementing different construction materials to decrease lifetime emissions.
The analysis was completed by utilizing construction drawings of traditionally built houses to understand the emissive nature of residential construction in the current environment. The focus revolved around building envelope components, including foundations, roofing, exterior cladding, and framing. An overview of different material options for components, including those with a current minority or zero market share, was compared to the existing bulk materials used in the industry. This analysis outlined which materials provide the lowest emissions for general new builds in New Zealand. Two research questions were outlined in this study to bridge the analysis to the research objectives, which are:
- (i)
- Which commonly or potentially used building materials in New Zealand’s residential buildings have the lowest carbon emissions during their production and end-of-life stages?
- (ii)
- Which commonly or potentially used building materials in New Zealand’s residential buildings have the highest carbon benefits after the recycling and reusing stages?
The importance of assessing the building materials’ carbon emissions in New Zealand is to give a brief overview of which building materials commonly used in the country have potentially lower carbon emissions. It is expected to give a basis for a further assessment, as it should be noted that different buildings are likely to have different carbon emissions. In addition, understanding the potential carbon reduction from the recycling and reuse processes of the used building materials is important. As the country has put effort into achieving the net-zero carbon goal [8], this assessment is expected to help the building industry take sustainability into consideration during the choice of building materials.
2. Methods and Materials
2.1. Method of the Study
A life-cycle assessment (LCA) was used in the study to quantify the carbon emissions from the investigated houses and to compare different types of building envelope components considered in the study (i.e., foundations, exterior cladding, wall framing, and roofing). LCA was chosen as the assessment method because it allows the study to quantify and analyze the carbon emissions from whole-of-life building life-cycle stages. Assessing the environmental impacts of each stage of the building life cycle (from production to end-of-life) is needed for a building product to check the carbon emissions thoroughly. The LCA study followed the assessment framework outlined in ISO 14040:2006 [34], which contained four steps in undertaking the LCA:
- (1)
- Goal and scope;
- (2)
- Inventory analysis;
- (3)
- Impact assessment;
- (4)
- Interpretation analysis.
The system boundary of this study was cradle-to-cradle, which takes into account the whole-of-life building life cycles (from the production to end-of-life stages), including the potential carbon offset after the end-of-life (EOL) stages (Modules A to D). Figure 2 illustrates the selected building life-cycle stages considered in this study. The Global Warming Potential (GWP) metric was selected as the environmental impact category to analyze building materials’ whole-life emissions. The choice of the selected environmental impacts is based on the main goal of the study, which is to aid the construction industry in New Zealand in meeting the country’s net-zero carbon emissions target. The functional unit of this LCA study was a kilogram of carbon emissions per meter squared gross floor area of the house (kg CO2eq/m2). This functional unit was selected to accommodate the assessment of dissimilar housing sizes. The investigated house designs will be described in Section 2.2. The case study residential buildings have different house plans and gross floor areas. Therefore, to limit the variations in the results, the study used the per square meter unit of carbon emissions. However, it should be noted that using the selected functional unit for assessing houses of different sizes might still have a limitation in that it could potentially benefit one of the investigated houses. A house with a larger GFA will have larger divided GWP values, which are likely to result in lower total carbon emissions.
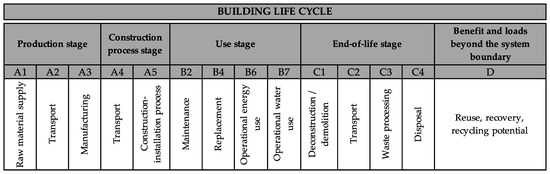
Figure 2.
Case study building life-cycle stages.
In gathering the data required for inventory analysis, several industry professionals were contacted, and building consent drawings were procured for five residential houses constructed between 2019 and 2021. Material take-offs were completed with design drawings, Bluebeam Revu software [35], and hand calculations to determine the volume of materials required for each building component. The materials carbon indicator from BRANZ [18] and Environmental Product Declarations (EPD) Australasia [36] were utilized in this study, as these datasets are region-specific and could maintain data consistency and regional significance.
The GWP calculation of the five investigated houses was performed using LCAQuick V3.4.4 [37], a NewZealand-specific LCA tool developed by BRANZ that utilizes locally sourced EPDs and construction methods. The software enabled the study to obtain the embodied and operational carbon emissions of the houses using the midpoint approach. Midpoints are recognized as linkages in the impact group’s cause-and-effect cycle (an environmental mechanism) (e.g., GWP and acidification) [38]. The results from LCAQuick were compiled into an Excel spreadsheet. Data were tabulated, and graphs were produced to visualize the difference in GWP impact caused by each house design and material chosen.
2.2. Houses Design and Operational Energy Used in the Study
Five residential buildings located in Coromandel and Cromwell, New Zealand, were collected from local building practitioners. The scope of the LCA study considered the foundation, frame, cladding, and roof. Several items were excluded from the material carbon emission calculations, including fixings and finishings such as flooring (carpet/linoleum), windows, kitchen/bathroom units, bolts, nails, and water used to wash the house’s exterior. Table 1 shows a summary of the gross floor area (GFA) and building materials for the five investigated houses. The case study residential buildings had dissimilar house plans and sizes, but they were expected to represent the typical housing type and size in New Zealand.

Table 1.
Area of the case study buildings and building materials used in the study.
Three of the investigated case study buildings, 2, 3, and 4, were founded on a concrete waffle slab—a reinforced concrete system with 1.1 × 1.1 m polystyrene pods arranged to form 100 mm wide concrete ribs. Both timber flooring systems, 1 and 2, consisted of plywood flooring underlain by joists and bearers founded on 350 × 350 mm senton piles with concrete footings in House 1 and galvanized steel micro-piles in House 5. House 2 consisted of steel framing, while the remainder was framed with timber. A range of cladding options was seen, with the majority of the market share materials utilized. All five case study houses used metal as the roof covering, in conjunction with the 70.8% market share of metal roofing reported [14]. The construction method of the five investigated residential buildings was on-site construction, where the construction products were transported to the construction site and installed on-site. In addition, the transportation distance and material waste data used in this assessment referred to the New Zealand life-cycle assessment databases, which were produced by BRANZ [20] and assigned in the LCA calculation tool (LCAQuick). The construction waste of the building materials used in this study varied between 1 and 23% of the material mass. The transportation data of this study used the transportation modeling available in the LCAQuick and BRANZ’s Construction Transport (Module A4) database [20], in which a generic transport distance and mode were determined between the last manufacturer and construction site in Auckland, New Zealand. The transport distances of the building materials used in the assessment were varied, incorporating both ship and truck transportation modes.
Furthermore, calculations were completed to determine a forecast of GWP emissions during a home’s operational life to determine the kWh of power from the grid and emissions resultant from water use. The power use per year was determined by comparison to an LCAQuick Reference Buildings [37] forecast power use, which amounts to 8150 kWh/year for a dwelling with four residents. This is slightly above the New Zealand average of around 7000 kWh/year [39]. The Ministry for the Environment frequently reports on the emissions factor for grid-purchased electricity, averaging 0.13 kg CO2eq/kWh for 2010–2018 [40]. This value was multiplied by the total electricity used over 90 years of operation to determine lifetime operational emissions. Therefore, this study used 7050 kWh/year as a basis for five buildings’ operational energy use calculations. There were two critical assumptions in the calculation: (1) there were no changes in power use patterns over the building’s life, and (2) there was no change to the New Zealand grid’s electricity emission factor over the building’s period. In addition, for operational water use, LCAQuick was used and provided a lifetime emission value from water use when water demand was input. BRANZ recommends 270.4 kL/year for a four-person dwelling [41], and this value was used for the water demand of the investigated buildings.
3. Results
3.1. Global Warming Potential (GWP) of Investigated Houses
Five residential buildings were investigated to analyze the global warming potential (GWP) of different building material types. Figure 3 shows the GWP values from the case study houses investigated in this study. The house with the highest total GWP value from the case study houses was House 4, with a total emission of 957.49 kg CO2eq/m2. The lowest total GWP value was House 1, with 631.13 kg CO2eq/m2. Houses 2, 3, and 5 had total GWP values of 633.16, 755.71, and 666.97 kg CO2eq/m2, respectively.
Figure 3.
Global warming potential results of the five case study buildings.
3.2. Global Warming Potential (GWP) of Envelope Components
Materials’ environmental performance was determined using LCAQuick to quantify the carbon emissions from various building materials for each building envelope component. To provide consistency and comparison, the material needed for the cladding, framing, and roofing envelope components was converted and stated as a 230 m2 gross floor area.
3.2.1. Foundation Options
Four foundation types were analyzed, namely traditional concrete slabs, concrete waffle slabs (RibRaft), and two timber flooring options. The first timber floor system was founded on senton piles and concrete footings, while the other utilized galvanized steel micro-pile systems seldom used in New Zealand, in which there was a concrete-free foundation (Surefoot micro-piles). Table 2 below outlines the GWP of each foundation system for a constant 230 m2 floor area. Note that the life-cycle stages B2 and B4 (maintenance and replacement) were excluded from the calculation. It was assumed that the foundation had a service life equal to that of the whole building and did not require maintenance or replacement.
Table 2.
Global warming potential (GWP) of foundation options.
3.2.2. Wall Cladding Options
Several cladding options with large market shares were considered, including concrete masonry, timber, clay brick, and fiber cement weatherboard, which comprise over 90% of the current market. Two less frequently chosen cladding options were selected: metal and 3D-printed concrete blocks. While metal is frequently seen as a roofing component, it has gained popularity in recent years as a wall cladding option, most likely due to the durability and aesthetics of the material. Table 3 shows the GWP values of the investigated cladding options.
Table 3.
Global warming potential (GWP) of wall cladding options.
3.2.3. Framing Options
The framing options considered in this study include standard timber framing and light gauge steel, the two most commonly used framing options in New Zealand; laminated veneer lumber (LVL); and a unique framing option in the form of structural insulated panels (SIPs). Table 4 shows the GWP values of the investigated framing options.
Table 4.
Global warming potential (GWP) of framing options.
3.2.4. Roofing Options
As mentioned, the roofing material market in New Zealand is primarily dominated by steel sheet roofing, with over 70% of new builds utilizing the material [14]. The emissions of asphalt shingles, clay tiles, and fiber cement slates were also analyzed, and their emissions were compared to those of steel sheet roofing. Table 5 below outlines the GWP of the roofing option for a constant 230 m2 floor area. The study found that there was a significant difference between the different roof cladding options. The clay tile roof had the highest carbon emissions compared to other roofing options, while it doubled in value with the steel roof (the most popular roofing option in New Zealand).
Table 5.
Global warming potential (GWP) of roofing options.
4. Discussion
4.1. GWP Values of the Five Investigated Houses
Five residential buildings’ GWP values were analyzed using the life-cycle assessment (LCA) approach. These investigated houses were located in Coromandel and Cromwell, New Zealand. The total GWP of houses excluded the material emissions from fixings and finishing such as flooring (e.g., carpet), windows, kitchen and bathroom units, bolts, nails, and water used to wash the house’s exterior. Therefore, the house’s GWP values were calculated based on the foundation, framing, wall cladding, and roofing materials, and the operational energy and water used throughout the building’s life span.
From the GWP results, the operational emissions were the largest contributor to the total values. Overall, the operational emissions found in this study ranged between 53% and 82% of the total GWP values from the investigated houses, or 436 and 542 kg CO2eq/m2. The embodied emissions from the five houses had varied values, which were from 124 to 445.70 kg CO2eq/m2. An energy analysis was performed in this study to understand the highest emitters’ energy end-use of the investigated buildings. The study found that plug loads and hot water were the top two emissions contributors, with approximately 85% of total emissions from the operational energy stage. However, it should be noted that the study did not include all the building materials from the house. Therefore, the operational emissions might have a larger contribution compared to the embodied emissions.
House 1′s total GWP value, by considering the cradle-to-cradle system boundary, was 631.13 kg CO2eq/m2, with embodied emissions of 216.93 kg CO2eq/m2. Production stages (A1–A3) were the most predominant embodied emitters compared to other life stages, with a 45% contribution. In Module D, the embodied carbon of House 1 was reduced by 14% to 194.99 kg CO2eq/m2 due to the reuse and recycling potential of the materials used in the building. The use of metal roofing in House 1 made a large contribution to potential carbon reduction after the life cycle of the building, with approximately 11.7 kg CO2eq/m2, or 59% of total carbon offset. The rest of the carbon offset was obtained from the accumulation of steel bars in the concrete foundation and timber in the foundation and wall systems.
For House 2, the total GWP value was 633.16 kg CO2eq/m2, and the embodied emission from the building was 235.45 kg CO2eq/m2. Production stages were responsible for 69% of the total embodied emissions of the house. The in situ reinforced concrete with a 25 MPa strength produced the most embodied emissions compared to the other materials used in House 2 during the production stages (A1–A3), with approximately 53% of the total stages’ emissions. After the EOL stages, House 2 received a carbon offset of −25.56 kg CO2eq/m2, which reduced the total embodied emissions by 11%. Three materials were found to have the most contribution in offsetting the carbon, accounting for 90% of the carbon offset, namely the metal roof sheets, steel purlins, and steel rebars.
House 3′s total GWP value was 755.71 kg CO2eq/m2, with the embodied emissions from the house being 240.17 kg CO2eq/m2. Similar to House 1 and 2, the production stages were the largest emitter stages in terms of embodied emissions, with approximately 58%. Concrete had the most prominent embodied emissions compared to other materials in the production stages, accounting for 63% of the total production stages’ carbon. In terms of Module D, House 3 received a carbon offset potential of −26.68 kg CO2eq/m2, which reduced the total house embodied emission to 213.49 kg CO2eq/m2. The use of metal roof cladding resulted in a carbon offset of −19.4 kg CO2eq/m2, which was the largest contribution to the carbon reduction after the EOL stages compared to other materials in the house.
The total GWP values from House 4 were the largest of the five investigated houses, with approximately 957.45 kg CO2eq/m2. In terms of the embodied emissions, House 4 emitted 492.82 kg CO2eq/m2 during whole life stages of the building, from production to EOL stages. The high number of embodied emissions was due to the production stages of the building, where the reinforced concrete contributed most of the material emissions. The suspended concrete slab used to form the second level of the dwelling increased the volume of reinforced concrete required; therefore, House 4 had the largest embodied emissions compared to the other case study houses.
For House 5, the total GWP value was 666.97 kg CO2eq/m2, and the embodied carbon associated with the house was 144.55 kg CO2eq/m2. The production stage was the most prominent embodied carbon emitter compared to other life stages, with a 50% contribution of total embodied carbon. When including Module D, the house’s embodied carbon was reduced by 19.81 kg CO2eq/m2, or 14% of the total embodied carbon from other life stages. The use of steel-based elements in the design, such as the corrugated metal roof and steel foundation piles, greatly contributed to decreasing the embodied carbon of the house after the EOL stages due to the ease of recycling and reuse of this material. However, if the consideration was only on the production stages, these building elements would be among the largest carbon emitters in the case study building, along with the laminated veneer lumber product in the building.
In order to check the validity of the results, a comparison was made between the study’s LCA results and previous studies from the literature. From the study’s LCA results, the embodied carbon of investigated houses ranged between 144.55 and 235.45 kg CO2eq/m2, while the findings from Chastas et al. [29] varied between 179 and 1050 kg CO2eq/m2. Most of the investigated houses’ embodied carbon was comparable with the previous study but appeared to have relatively lower GWP values. This is because the study only considered four building envelope elements (not a whole building element), namely the foundation, wall framing, exterior cladding, and roof cladding. In terms of operational carbon, the study’s results ranged between 436 and 542 kg CO2eq/m2. These values conform to the literature, which varied from 156 to 4049.9 kg CO2eq/m2 [29].
4.2. GWP Values of Different Envelope Components’ Materials Options
GWP values from different building envelope components’ material options were analyzed. The analysis was carried out to understand the embodied carbon produced by different materials in the building’s envelope.
4.2.1. Foundations
The traditional concrete slab had the highest embodied carbon compared to other foundation system options. The system emitted 18,512 kg CO2eq for a 230 m2 floor area house, of which the production stage was the most prominent stage. The concrete waffle slab had the second highest embodied carbon, with only a 1.75% difference with the traditional concrete slab. These two systems require a high volume of concrete, which results in higher carbon emissions. The production of cement in concrete products releases a vast amount of carbon. The burning of fossil fuels to heat the rotary kiln and the chemical reaction connected with the calcination process in the formation of clinker, the principal component of cement, are the two major CO2 producers in cement production [42]. The timber with the Surefoot micro-piles system had the lowest embodied carbon compared to other system options. The system received the largest carbon offset in Module D, which had a carbon offset of −4886 kg CO2eq, due to the use of steel material in the system that can be recycled or reused at the EOL stages of the building.
The timber floor founded on steel micro-piles required a considerably lower volume of materials than the other three foundation options. The 32 mm diameter micro-piles used were much smaller than the senton pile’s system, requiring less soil disturbance from excavation, and no concrete was needed to fix the supports into the soil. The time and effort required to construct a micro-pile foundation system were considerably reduced compared to a concrete slab or timber senton pile system. This leads to less potential for harm to ecosystems from the sediment and erosion caused by the earthwork’s operation.
4.2.2. Exterior Cladding
Concrete masonry cladding was the largest carbon emitter in terms of cladding options considered in the study, with a value of 28,231 kg CO2eq for a 230 m2 floor area house. The use of a high volume of concrete for this cladding option led to a large amount of embodied carbon. Other options that were found to have significant embodied carbon were metal and brick cladding systems, which produced 18,702 and 18,148 kg CO2eq, respectively. For brick and concrete masonry, most embodied carbon was produced during the production and construction life-cycle stages due to the largely emissive processes utilized to form materials from raw ingredients. Metal cladding emitted most of its embodied carbon during the B2 and B4 maintenance and replacement stages due to the projected replacement required at least once within the building’s operational life. However, as module D was considered in this study, the sizeable portion of embodied carbon of the metal roof was offset after the EOL stage due to the ease of recycling the steel when the building reaches its end of service life.
The 3D-printed concrete blocks emitted 14,735 kg of CO2eq during their whole life-cycle stages. However, this system was utilized as the cladding and structural frame, and it only required a waterproofing sealant layer as a finishing, compared to the addition of timber or steel framing, insulation, gib, and paint required for the other cladding options to form a finished whole wall element. Most of the emissions from this system were experienced in the production stage due to the emissive processes utilized to produce concrete. In addition, plywood, fiber cement, and timber weatherboards emitted much less carbon than the other cladding options analyzed. These options had low embodied carbon emissions during the production stage, which ranged between 1178 and 2646 kg CO2eq.
While all options provide some carbon offset within module D and potential environmental benefits outside the life cycle, the metal cladding option provides significantly more benefit than all other options, with the intent for steel in this life-cycle stage to be fully recycled. As the industry becomes more aware of the potential for emissions reduction through more efficient and better-considered recycling and reuse of decommissioned materials, more innovative uses for building materials at the end of their life as building components will be available in New Zealand.
4.2.3. Framing
Apart from the steel-faced SIP walls, the GWP contribution from framing components is generally small in comparison to the other building envelope elements studied in this paper. The majority of the emissions created by this frame choice occur during the A1–A3 product manufacture life-cycle stage, primarily due to the emissions required to produce the steel facing.
In New Zealand, the most common type of framing material is timber, while the use of light steel continues to grow [12]. The study found that the timber framing for the investigated 230 m3 floor area house emitted 10,338 kg CO2eq, and the light steel was 6737 kg CO2eq. Compared to the timber framing, the light steel framing had lower emissions during the construction (A4–A5) and end-of-life (C1–C4) stages, and it had a higher carbon offset due to the potential ease of the recycling process of this material after its service life. In New Zealand, 75% of the steel mass of a building is typically recycled at the end of the building’s service life [20]. By putting this into practice, the carbon offset could occur after the EOL stage as the steel material will be in a closed-loop life cycle and result in lower carbon emissions compared to other building material choices. However, it should be noted that the use of timber material in this study is characterized by unsustainable forest management practices, which result in higher carbon emissions compared to sustainable practices. Sustainable practice is defined as forestry activities in which trees are planted to replace those that have been cut for processing [20]. Therefore, if the timber is sourced from sustainable forest management practices, the carbon emissions might be lower as there is a sequestered carbon phenomenon due to the cut trees being replanted. Hence, during the material selection stage of the residential building project, the designer should consider the embodied carbon and potential carbon offsets of the selected materials for the house framing, especially the timber and steel products. Efficiency in house design could also reduce the number of materials used in the house framing, which could minimize the carbon emissions from this building component.
In addition, the MDF SIP wall framing had added benefits, including providing exterior cladding and interior finishing without the need for plasterboard and paint, and higher overall thermal performance. Therefore, this material should be further tested within the New Zealand environment to determine its feasibility as a high-use material in compliance with the Building Code.
4.2.4. Roofing
For the roofing system, the study found that clay tile shingle roofing provided the most GWP emissions of the four investigated materials, a total of 42,830 kg of CO2eq for a 230 m2 floor area house. This was due to the high GWP emissions from the production stages (A1–A3) and the need for new materials in the maintenance and replacement stages (C1–C4) of the material life cycles. When model D was considered, the material only had a low potential carbon offset after the EOL stages, which was −40 kg CO2eq, and the value could not be compared with other life stages that had massive emissions.
Asphalt shingles and fiber cement slates provided relatively low GWP emissions compared to other investigated roofing material options, which had 7790 and 6150 kg CO2eq, respectively. Much less carbon was emitted during the production stages (A1–A3) when compared to clay tiles, which led to fewer emissions when the material needed to be replaced during the maintenance and replacement stages (B2 and B4). However, it was noted that this style of roofing is more prone to damage from the surrounding environment and requires maintenance and replacement more frequently than the metal roofing used in over 90% of current new builds.
Steel roofing (metal sheet) is the most commonly used roofing option in New Zealand’s residential houses and has approximately 70% market share. In this study, it was found that this type of roof cladding had 21,280 kg of CO2eq. The production, maintenance, and replacement stages contributed the largest GWP emissions, with 6790 and 21,360 kg CO2eq, respectively. However, the GWP values of the steel roof were reduced after the EOL stages, which were found to have a potential carbon offset of −7190 kg CO2eq due to the ease of recycling process of this material. In addition, within the country, a house’s roof is exposed to much more UV radiation than in most other nations, in conjunction with relatively frequent severe winds and rain. For these reasons, a metal sheet roof is most likely the best choice for roofing in New Zealand, owing to its simplicity of installation, with less work and time needed for construction than a shingle roof alternative. The steel roof’s potential environmental advantages (carbon offset) far surpass the other choices studied. Even with improved material recycling in the future, the simplicity of reusing and repurposing steel exceeds the other choices evaluated. In addition, the roofing options, on average, were found to have the largest carbon emissions compared to other building envelope components, and it is suggested that the building practice limits the construction waste during the construction process of steel roof cladding. The selection of the steel roof cladding profile should also consider the embodied carbon of the product. Steel roofs in New Zealand are often made of thin lengths of cold-rolled steel coil folded into forms such as corrugated, trapezoidal, or standing seam. Different steel roof profiles have different carbon emissions [27,28]. Thus, limiting construction waste in the construction stage and choosing the steel cladding profile with the lowest carbon emissions in the design stage could minimize the carbon emissions from a building product.
5. Conclusions
This study analyzed the global warming potential (GWP) values of five residential buildings in New Zealand and compared the building materials for the foundation, wall cladding, wall framing, and roof cladding options. Life-cycle assessment was the methodology followed in the study in analyzing the emission values from the investigated building products. In quantifying the GWP values, a New Zealand-based LCA tool (LCAQuick) was utilized, where the local database (e.g., materials’ carbon indicators) was used.
Through analysis of building consent issue drawings for residential dwellings and calculation using the LCAQuick, a large amount of variability in the weight of carbon emitted through building materials was seen. House 1′s building envelope, consisting of timber elements for the foundation, frame, and wall cladding and steel material for the roofing, produced the lowest GWP emissions of the four traditional houses analyzed, with 631.13 kg CO2eq/m2. House 4′s envelope had the largest GWP value, which produced 957.49 kg CO2eq/m2, due primarily to reinforced concrete foundations and a second-floor suspended concrete slab. With the large quantity of concrete materials in House 4, the house required a high volume of cement, which resulted in higher carbon emissions. In addition, when analyzing different building life-cycle stages of the investigated houses, the study found that operational energy use was the most significant contributor to atmospheric emissions, ranging between 53% and 82% of the total house GWP emissions. However, there are significant potential reductions to the emission contributions during the construction, maintenance, and EOL stages depending on the materials chosen for building envelope components.
Significant building contributions from certain materials were seen within each building envelope component. For the foundation option, the traditional concrete slab and the concrete waffle slab had the largest GWP emissions, with 18,512 and 18,239 kg CO2eq, respectively. Timber with a plywood floor and Surefoot micro-piles foundation, where the system is concrete-free and installed via steel tubular micro-piles driven into the ground, had the lowest GWP emissions and less obtrusive construction and earthworks required. This system is engineered to Australian/New Zealand Standards and complies with the Building Code of New Zealand with load capacities up to 360 kN (36 tonnes).
Concrete masonry, metal, and brick were the top three GWP emitters in the investigated exterior wall cladding options. These materials were found to have emissions almost three and a half times higher than the other options. For the framing, the steel-faced SIPs had the largest GWP values among the framing options, with 22,371 kg CO2eq. Looking at the most common framing types in New Zealand, timber framing had 10,338 kg CO2eq, while the light steel frame had 6737 kg CO2eq. In terms of roofing options, the clay tile roof had the highest GWP emissions compared to other roof options, which are asphalt shingles, fiber cement slates, and steel sheets, emitting 42,830 kg CO2eq. The GWP values from clay tiles were double the emissions from the steel roof cladding. Steel roofs (metal sheets), the most commonly used material for roofing in the country, had 21,280 kg CO2eq. In addition, when considering module D, the steel-based material showed the largest potential for carbon offset after the EOL stages compared to other investigated materials. The high recovery and recyclability rates of these materials, including the ease of demolition and recycling processes, enabled the steel material to be reused and recycled, resulting in the product being kept in closed loops.
The study has several limitations that might influence the outcomes of the study and should be addressed in future studies. The limitations include:
- The use of different case study houses’ plans and gross floor areas in this assessment. In order to address this limitation, this study used a kilogram of carbon emissions per meter squared of the gross floor area of the house (kg CO2eq/m2). It was expected to limit the variations in the results and give comparable results within the case study buildings. However, having similar house plans and sizes will benefit future studies in the same direction.
- The study only considered the main materials for the foundation, frame, cladding, and roof. Some building components, such as windows, doors, flooring, and other ancillary items, were excluded from this study. However, to give a clear picture of the building’s environmental impact assessment, whole building components are suggested to be assessed through further study.
- The calculated operational energy used was based on two assumptions: steady power usage and no change to the New Zealand grid’s electricity emissions factor over the building’s service life. This is regarded as a study limitation in modeling the electricity used in case study buildings. Future studies are expected to overcome this limitation in their assessment with more precise operational carbon emissions included in the assessment outcome.
In addition, analyzing the environmental impacts of off-site prefabrication of components would give designers more options to look at possible options in designing a house, as this technique may lead to optimization of materials, which could reduce material waste and construction time. More practical considerations, such as constructability and cost, in comparing the building materials could add more benchmarks for designers in selecting materials. In the context of New Zealand, determining the relationship between building envelope thermal performance and operational energy use through heating and cooling would give a clearer picture of the importance of exceeding the New Zealand Building Code H1 Energy Efficiency [43] minimum requirements to reduce overall GWP contribution.
Author Contributions
Conceptualization, K.R., J.B.P.L., K.D.S. and M.J.; methodology, K.R. and C.T.; software, C.T. and A.A.D.; formal analysis, K.R., C.T. and A.A.D.; investigation, C.T. and A.A.D.; resources, K.R. and C.T.; writing—original draft preparation, C.T. and A.A.D.; writing—review and editing, K.R., K.D.S. and M.J.; visualization, C.T., and A.A.D.; supervision, J.B.P.L., K.D.S. and M.J.; project administration, K.R. and J.B.P.L. All authors have read and agreed to the published version of the manuscript.
Funding
This research received no external funding.
Institutional Review Board Statement
Not applicable.
Informed Consent Statement
Not applicable.
Data Availability Statement
Not applicable.
Conflicts of Interest
The authors declare no conflict of interest.
References
- Rohde, R. Global Temperature Report for 2020; Berkley Earth: Los Angeles, CA, USA, 2021. [Google Scholar]
- Nema, P.; Nema, S.; Roy, P. An Overview of Global Climate Change in the Current Scenario and Mitigation Action; Netaji Subhash Engineering College: Kolkata, India, 2012. [Google Scholar]
- UNEP. Buildings and Climate Change: Summary for Decision Makers; United Nations Environment Programme: Paris, France, 2009. [Google Scholar]
- Ministry of Business, Innovation & Employment. Whole-of-Life Embodied Carbon Emissions Reduction Framework; MBIE: Wellington, New Zealand, 2020; p. 24. Available online: https://www.mbie.govt.nz/dmsdocument/11794-whole-of-life-embodied-carbon-emissions-reduction-framework (accessed on 5 July 2022).
- Ministry for the Environment. New Zealand’s Greenhouse Gas Inventory 1990–2019; Ministry for the Environment: Wellington, New Zealand, 2021. Available online: https://environment.govt.nz/assets/Publications/New-Zealands-Greenhouse-Gas-Inventory-1990-2019-Volume-1-Chapters-1-15.pdf (accessed on 5 July 2022).
- Jones, C.; Hammond, G. Embodied energy and carbon in construction materials. Proc. Ice—Energy 2008, 161, 87–98. [Google Scholar] [CrossRef]
- Praseeda, K.I.; Reddy, B.; Mani, M. Embodied and operational energy of urban residential buildings in India. Energy Build. 2016, 110, 211–219. [Google Scholar] [CrossRef]
- Parliamentary Counsel Office. Climate Change Response (Zero Carbon) Amendment Act 2019 No 61., Public Act Contents—New Zealand Legislation; New Zealand Legislation: Wellington, New Zealand, 2019. Available online: https://www.legislation.govt.nz/act/public/2019/0061/latest/LMS183736.html (accessed on 7 July 2022).
- Ministry for the Environment. Paris Agreement. Available online: https://environment.govt.nz/what-government-is-doing/international-action/about-theparis-agreement/ (accessed on 7 July 2022).
- Ministry of Business, Innovation & Employment. Building for Climate Change: Transforming the Building and Construction Sector to Reduce Emissions and Improve Climate Resilience; MBIE: Wellington, New Zealand, 2020; p. 10. Available online: https://www.mbie.govt.nz/dmsdocument/11522-building-for-climate-change (accessed on 5 July 2022).
- Ministry of Business, Innovation & Employment. Whole-of-Life Embodied Carbon Assessment: Technical Methodology; MBIE: Wellington, New Zealand, 2022; p. 18. Available online: https://www.building.govt.nz/assets/Uploads/getting-started/building-for-climate-change/whole-of-life-embodied-carbon-assessment-technical-methodology.pdf (accessed on 6 July 2022).
- Johnson, A.; Howden-Chapman, P.; Eaqub, S. A Stocktake of New Zealand’s Housing; New Zealand Government: Wellington, New Zealand, 2018.
- Stats NZ. Building Consents Issued: September 2020. 2020. Available online: https://www.stats.govt.nz/information-releases/building-consents-issued-september-2020 (accessed on 6 July 2022).
- Lockyer, O.; Clarke, C. Physical characteristics of new houses 2019. In BRANZ Study Report SR447; BRANZ Ltd.: Judgeford, New Zealand, 2021. [Google Scholar]
- Gamage, G.; Vickers, J.; Fisher, B.; Nebel, B.; Townsend, E. Under Construction: Hidden Emissions and Untapped Potential of Buildings for New Zealand’s 2050 Zero-Carbon Goal; NZGBC: Wellington, New Zealand, 2019. [Google Scholar]
- Collins, M.; Barnard, T.; Bayne, K.; Duignan, A.; Shayer, S. Building Green in New Zealand: Wood—A sustainable Construction Choice; Forest Research: Rotorua, New Zealand, 2003. [Google Scholar]
- Leys, J. We Can’t See the Wood for the Trees: Understanding New Zealand’s Wood Supply Crisis; Stuff: Wellington, New Zealand, 2021; Available online: https://www.stuff.co.nz/business/industries/300271061/we-cant-see-the-wood-for-the-trees-understanding-new-zealands-wood-supply-crisis (accessed on 10 July 2022).
- Hoffmann, C.; Van Hoey, M.; Zeumer, B. Decarbonisation Challenge for Steel. Retrieved from McKinsey & Company. 2020. Available online: https://www.mckinsey.com/industries/metals-and-mining/our-insights/decarbonization-challenge-for-steel (accessed on 10 July 2022).
- Sansom, M.; Avery, N. Briefing: Reuse and recycling rates of UK steel demolition arisings. Proc. Inst. Civ. Eng. —Eng. Sustain. 2014, 167, 89–94. [Google Scholar] [CrossRef]
- BRANZ. Data. Available online: https://www.branz.co.nz/environment-zero-carbon-research/framework/data/ (accessed on 10 July 2022).
- BRANZ. BRANZ CO2nstruct Database; BRANZ: Porirua, New Zealand, 2019; Available online: https://www.branz.co.nz/environment-zero-carbon-research/framework/branz-co2nstruct/ (accessed on 10 July 2021).
- Ortiz-Rodríguez, O.; Castells, F.; Sonnemann, G. Life cycle assessment of two dwellings: One in Spain, a developed country, and one in Colombia, a country under development. Sci. Total Environ. 2010, 408, 2435–2443. [Google Scholar] [CrossRef] [PubMed]
- Rebitzer, G.; Ekvall, T.; Frischknecht, R.; Hunkeler, D.; Norris, G.; Rydberg, T.; Schmidt, W.-P.; Suh, S.; Weidema, B.P.; Pennington, D.W. Life cycle assessment: Part 1: Framework, goal and scope definition, inventory analysis, and applications. Environ. Int. 2004, 30, 701–720. [Google Scholar] [CrossRef] [PubMed]
- Olsen, S.I.; Christensen, F.M.; Hauschild, H.; Pedersen, F.; Larsen, H.F.; Torslov, J. Life cycle impact assessment and risk assessment of chemicals in a methodological comparison. Environ. Impact Assess. Rev. 2001, 21, 385–404. [Google Scholar] [CrossRef]
- Vilches, A.; Martinez, A.; Montanes, B. Life cycle assessment (LCA) of building refurbishment: A literature review. Energy Build. 2017, 135, 286–301. [Google Scholar] [CrossRef]
- Giordano, R.; Gallina, F.; Quaglio, B. Analysis and Assessment of the Building Life Cycle. Indicators and Tools for the Early Design Stage. Sustainability 2021, 13, 6467. [Google Scholar] [CrossRef]
- Roy, K.; Su, R.; Dani, A.A.; Fang, Z.; Liang, H.; Lim, J.B.P. Spatiotemporal Model to Quantify Stocks of Metal Cladding Products for a Prospective Circular Economy. Appl. Sci. 2022, 12, 4597. [Google Scholar] [CrossRef]
- Roy, K.; Dani, A.A.; Ichhpuni, H.; Fang, Z.; Lim, J.B.P. Improving Sustainability of Steel Roofs: Life Cycle Assessment of a Case Study Roof. Appl. Sci. 2022, 12, 5943. [Google Scholar] [CrossRef]
- Chastas, P.; Theodosiou, T.; Kontoleon, K.J.; Bikas, D. Normalising and assessing carbon emissions in the building sector: A review on the embodied CO2 emissions of residential buildings. Build. Environ. 2018, 130, 212–226. [Google Scholar] [CrossRef]
- Hawkins, W.; Cooper, S.; Allen, S.; Roynon, J.; Ibell, T. Embodied carbon assessment using a dynamic climate model: Case-study comparison of a concrete, steel and timber building structure. Structures 2021, 33, 90–98. [Google Scholar] [CrossRef]
- Petrovic, B.; Myhren, J.A.; Zhang, X.; Wallhagen, M.; Eriksson, O. Life cycle assessment of a wooden single-family house in Sweden. Appl. Energy 2019, 251, 113253. [Google Scholar] [CrossRef]
- Chandrakumar, C.; McLaren, S.J.; Dowdell, D.; Jaques, R. A science-based approach to setting climate targets for buildings: The case of a New Zealand detached house. Build. Environ. 2020, 169, 106560. [Google Scholar] [CrossRef]
- Dani, A.A.; Roy, K.; Masood, R.; Fang, Z.; Lim, J.B.P. A Comparative Study on the Life Cycle Assessment of New Zealand Residential Buildings. Buildings 2022, 12, 50. [Google Scholar] [CrossRef]
- International Organization for Standardization. ISO Standard No. 14040:2006; Environmental Management—Life Cycle Assessment—Principles and Framework. ISO: Geneva, Switzerland, 2006. Available online: https://www.iso.org/standard/37456.html (accessed on 1 July 2022).
- Bluebeam. Revu, (Version 20) [Computer Software]. 2020. Available online: https://www.bluebeam.com/uk/solutions/revu/ (accessed on 18 June 2022).
- EPD Australasia. EPD Australasia. 2021. Available online: https://epd-australasia.com/ (accessed on 28 June 2022).
- BRANZ. LCAQuick, (Version 3.4.3) [Computer Software]. 2020. Available online: https://www.branz.co.nz/environment-zero-carbon-research/framework/lcaquick/ (accessed on 29 June 2022).
- Bare, J.C.; Hofstetter, P.; Pennington, D.W.; De Haes, H.A.U. Midpoints versus endpoints: The sacrifices and benefits. Int. J. Life Cycle Assess. 2000, 5, 319. [Google Scholar] [CrossRef]
- Electricity Authority. Electricity in New Zealand. Electricity Authority. 2018. Available online: https://www.ea.govt.nz/assets/dms-assets/20/20410Electricity-in-NZ-2018.pdf (accessed on 5 July 2021).
- Ministry for the Environment. Measuring Emissions: A Guide for Organisations; New Zealand Government: Wellington, New Zealand, 2020.
- Heinrich, M. SR159—Water End Use and Efficiency Projecy; BRANZ: Wellington, New Zealand, 2007. [Google Scholar]
- Antunes, M.; Santos, R.L.; Pereira, J.; Rocha, P.; Horta, R.B.; Colaço, R. Alternative Clinker Technologies for Reducing Carbon Emissions in Cement Industry: A Critical Review. Materials 2021, 15, 209. [Google Scholar] [CrossRef] [PubMed]
- Ministry of Business, Innovation & Employment. NZ Building Code—H1 Energy efficiency. Retrieved from Building Performance NZ. 2021. Available online: https://www.building.govt.nz/building-code-compliance/h-energy-efficiency/h1-energy-efficiency/ (accessed on 17 July 2022).
Disclaimer/Publisher’s Note: The statements, opinions and data contained in all publications are solely those of the individual author(s) and contributor(s) and not of MDPI and/or the editor(s). MDPI and/or the editor(s) disclaim responsibility for any injury to people or property resulting from any ideas, methods, instructions or products referred to in the content. |
© 2023 by the authors. Licensee MDPI, Basel, Switzerland. This article is an open access article distributed under the terms and conditions of the Creative Commons Attribution (CC BY) license (https://creativecommons.org/licenses/by/4.0/).