Abstract
Green agriculture can minimize the negative impact of agriculture on the environment, and green products are usually sold at a higher price due to their green attributes. This induces farmers to produce conventional products and falsely sell them as green products. To better promote the development of the green agricultural product market, we study the effect of retailers’ audit strategies, premium policies and farmers’ punishment policy on farmers’ decisions. We develop an evolutionary game theory model to describe evolutionary behaviors of farmers and retailers. Then, we analyze the evolutionary stability strategies in different scenarios and numerically simulate the evolution of farmers’ decisions and retailers’ decisions to verify theoretical results. The results show that the static premium policy is not an ideal policy to promote the development of green agriculture, whereas the dynamic premium policy, as well as the dynamic premium and farmers’ punishment policy, could lead to an effective green market. A higher maximum premium encourages more farmers to produce true green products and may allow more retailers not to audit farmers. Moreover, if the punishment for farmers increases, more retailers will not audit farmers, leading to lower audit cost. Finally, a lower audit fee could motivate more farmers to produce true green products.
1. Introduction
Huge economic benefits motivate farmers to produce conventional products and falsely sell them as green products, which poses a threat to the development of green agriculture. This paper aims to investigate how to select a suitable audit strategy under the premium policy and punishment policy to discourage farmers from running the green fraud scheme and promote the development of the green agricultural product market.
Agriculture is vital to the survival and development of the human race. However, to improve the output of agricultural products, farmers use a significant amount of chemical fertilizers, harmful pesticides and other toxic farm chemicals. These traditional approaches of farming result in serious environmental problems such as soil degradation, water pollution, greenhouse gas emissions, climate change and biodiversity loss [1,2,3,4]. Agriculture has become a major source of pollution in many countries [5]. For example, farming is the biggest single cause of the worst air pollution in Europe [6]. Therefore, how to control pollution from agriculture has drawn increasing attention.
Green agriculture can effectively reduce the environmental pollution caused by agricultural planting. For example, organic farming produces food by using natural substances and processes instead of synthetic pesticides, herbicides and fertilizers [7]. It is an ecosystem management where all rely on natural cycles to ensure plant health and crop performance [8,9]. As a result, this green agriculture enhances soil fertility, protects water quality and maintains biodiversity [7]. On the other hand, green products are healthier and more nutritious for people [10]. Thus, people are willing to pay a premium for green products [11].
However, a transition to green agriculture is costly for farmers. For example, organic farming is more labor-intensive, and organic feed is also more expensive. The transition period in which farmers convert a conventional farm to an organic farm takes at least 3 years, and in this period farmers have no income from farms [12]. Organic agriculture production often has lower yields compared with conventional agriculture [13,14]. These disadvantages motivate farmers to cheat buyers by selling conventional products as organic products. For example, in the United States, five farmers falsely sold conventional corn and soybeans as organic products, reaping more than USD 120 million, and then they were jailed [15]. In 2018, the European Union limited imports from Ukraine, Kazakhstan, Moldova and the Russian Federation which were identified as high-risk areas for organic fraud [16]. If fraud is exposed by the media or governments, it can seriously damage retailers’ brands and reputations. To deal with fraud, a common approach for retailers is to use supplier audit as a screening mechanism. For example, GoMacro audits their suppliers every year to ensure that raw materials are organic [17].
Though auditing farmers can discourage green fraud, the audit fee increases retailers’ costs. There are two other ways to prevent green fraud. One is to set the dynamic premium of green products, where the premium is related to the number of farmers who produce green products. The other is to set the dynamic premium and punish farmers who falsely sell green products. Based on the above analysis, several questions arise. What are the conditions for retailers to audit farmers? How dose the premium policy influence farmers’ farming choices? Which premium policy is better, the static premium policy or the dynamic premium policy? If farmers will be punished for fraud, do retailers still need to audit them? Based on the above questions, the objective of this paper is to study how retailers adopt audit strategies to motivate more farmers to produce true green agricultural products and analyze how different factors affect decisions of retailers and farmers. In this study, we build evolutionary game models between retailers and farmers under three different policies and analyze retailers’ audit strategies and farmers’ production strategies under these policies. We assume that both retailers and farmers are bounded rational, and they do not influence each other at the beginning.
2. Literature Review
The sustainable operation of agricultural supply chains is widely studied. Our paper is primarily related to two streams of literature: sustainable and socially responsible governance and supplier development.
2.1. Sustainable and Socially Responsible Governance Literature
The socially responsible governance of supply chains is very important for agriculture sustainable development, and it has also attracted many scholars’ attention. Social responsibility audits, socially responsible sourcing and improving supply chain visibility are common approaches to improve the sustainability of the supply chain.
An audit is an effective tool to monitor suppliers’ social responsibility. For example, Plambeck and Taylor [18] analyzed how the buyer determines their level of effort to audit the supplier. They found that the increased audit efforts of buyers may encourage suppliers to hide information in some cases, which will backfire. Fang and Cho [19] studied joint audits and found that the cooperative approach may not be effective to resolve the problem of social responsibility violation. Kim [20] investigated the dynamic game between inspection policy and manufacturers’ noncompliance information disclosure. The results show that random inspections are not always superior to regular visits according to established schedules. Chen et al. [21] studied the relationship between social responsibility auditing and information transparency in the supply chain. They found that the unchanged length of the product line motivates the platform to share information, whether the firm audits or not. Some other works have started to focus on the audit status of simultaneous procurement by multiple buyers and study the audits’ effectiveness under joint audit [19,22,23]. For example, Ha et al. [23] discuss how sharing audit information among competitors affects purchasing decisions.
Buyers can use sourcing strategies to solve the problem of social responsibility in the supply chain. For example, Agrawal and Lee [24] studied how buyers use sourcing strategies to influence their suppliers to adopt sustainable production processes that meet certain sustainability criteria. Liu et al. [25] considered supplier selection in responsible sourcing. de Zegher et al. [26] investigated how to use supply chain contract and sourcing channels in agricultural operations to create mutual benefit and win–win solutions in the distributed value chain. Chen and Lee [27] studied sourcing under supplier responsibility risk, where the buyer designs incentive schemes (such as contingency payments) in the sourcing contract.
Buyers can also facilitate sustainable and socially responsible governance by improving supply chain visibility and information disclosure [28]. For example, Kraft et al. [29] investigated how supply chain visibility influences consumers’ assessments for social responsibility practice of its upstream, which shows that consumers are fully concerned about the visibility of their upstream enterprises’ social practices. Chen et al. [30] analyzed the impact of supply chain transparency on sustainability under NGOs supervision. Wang et al. [31] discussed the design of enterprises’ voluntary disclosure mechanisms.
Most of the studies mentioned above focus on workers’ working conditions, labor standards, environmental impact and health and safety in industry. By contrast, we focus on fraud in green agriculture, which is rarely studied. Second, many works pay attention to governments’ governance on farmers and retailers, whereas we mainly investigate the market’s effect between farmers’ and retailers’ interaction and explore retailers’ different audit decisions and farmers’ different organic production decisions.
2.2. Supplier Development Literature
Our research is also related to the literature on supplier development. Buyers often use contracts to promote supplier development. For example, Xue et al. [32] studied how buyers use order commitment and option contracts to deal with supply disruption risks. Kim and Netessine [33] explored how to incentivize buyers and suppliers to work together to reduce costs. Chao et al. [34] considered two products’ recall cost sharing contracts and analyzed how these contracts motivate suppliers to improve quality. Mendoza and Clemen [35] inspected both the scenarios of single retailer versus multisuppliers and dual retailers versus multisuppliers. They give solutions for the best investment way for suppliers in different scenarios. Kim et al. [36], Ran and Xu [37] studied how revenue-sharing contracts affect suppliers, manufacturers and retailers.
Other works study how to use noncontractual approaches to promote supplier development. For example, Chen and Delmas [38] proposed a new frontier model to better measure enterprises’ ecological inefficiency. Zhou et al. [39] built a two-stage stochastic programming model to analyze the optimal supplier development mechanism which can effectively improve supplier performance. Hwang et al. [40] compared the impact of a vendor appraisal mechanism and vendor certification mechanism on supplier development. Some scholars also pay attention to farmers’ development [41]. For example, An et al. [42] analyzed agricultural cooperatives and found that cooperatives or other organizations are not always beneficial to joined farmers.
In contrast to the above studies, to promote farmer development, we introduce different policies including static reward, dynamic reward, dynamic reward and farmer punishment policy. We study the impact of these policies on farmers’ decisions. Second, we suppose the supply chain participants are bounded rationality and use evolutionary game framework to model their socially responsible behavior, which is distinguished from most previous sustainable supply chain works.
2.3. Evolutionary Game Application Literature
Traditional game theory often assumes that all players are completely rational, which is difficult to achieve in reality [43,44]. Evolutionary game theory assumes that all players are bounded rational, which is consistent with the principle of biological evolution. It is often discussed whether players’ strategies eventually converge to an evolutionary stable strategy in evolutionary game theory [45]. This method is also very suitable for modeling economic and managerial problems and explaining social phenomena [46,47].
Zhang et al. [48] developed an evolutionary game model to study technology diffusion in alliances in the context of a complex network. They found that increasing environmental tax standards and subsidizing firms can incentivize firms to diffuse green-manufacturing technology in the alliance. However, generous innovation subsidies do not result in benefits for the diffusion of green manufacturing technology. Fan and Dong [49] examined how governments should choose subsidy strategies in low-carbon diffusion when considering heterogeneous agents’ behavior. They found that when fewer firms and consumers adopt the low-carbon strategy, only the government subsidy cannot promote low-carbon diffusion; otherwise even without government subsidies, low-carbon diffusion can be achieved successfully. Yang et al. [50], Liu et al. [51] and Hafezalkotob and Mahmoudi [52] used evolutionary game theory to examine sustainable energy development. Liu et al. [53], Fan et al. [54] and Liu et al. [55] used evolutionary game theory to investigate the impact of government’s reward–penalty policies on sustainable supply chains. Although these studies use evolutionary game theory to analyze the evolutionary stability of the effort to promote sustainability, they do not consider retailers’ premium policies and audit strategies. Our paper examines the impact of retailers’ premium policies and audit strategies on green supply chain.
3. Model
This paper focuses on how to reduce green fraud and promote the development of the green agricultural product market. In view of this research problem, we build the evolutionary game model between retailers and farmers. Farmers decide whether to produce true green products or cheat. Retailers decide whether to audit farmers or not to audit them. Figure 1 shows our research framework. We build the evolutionary models under three different policies, then carry out model analysis and numerical simulation experiments. Finally, we summarize the research and derive the managerial implications.
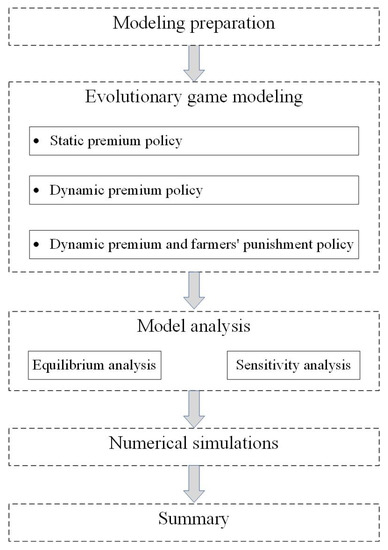
Figure 1.
Research framework.
We consider a green agricultural product market where retailers source the product from farmers and sell it to consumers. In this market, the green product is more expensive because of its health and environmental benefits [11,56]. Farmers obtain revenue by selling the product to retailers, where represents the basic revenue of the product and represents the premium from the green attribute. However, the cost of the green production is higher than the cost of the conventional production [57]. This incentivizes farmers to falsely sell the conventional product as the green product. Thus, farmers face alternative production strategies: the true green strategy, where farmers produce the true product, and the fraud strategy, where farmers produce the conventional product and sell it as the green product. Let y represent the proportion of farmers who adopt the true green strategy; then, is the proportion of farmers who adopt the fraud strategy.
Retailers obtain revenue from selling the product. However, farmers’ fraudulent activity may be discovered by the public with probability . If the public discovers fraud, retailers are subject to the penalty . Thus, retailers’ revenue drops to . Retailers can audit farmers to avoid the penalty and incur an audit fee . In this case, if farmers adopt the fraud strategy, the product is a conventional product. Thus, farmers cannot obtain the premium from retailers, and retailers’ revenue drops to . represents the premium which retailers obtain from consumers due to the green attribute. We assume , which means that retailers’ revenue suffers a more severer decline if fraud is discovered by the public. Let x represent the proportion of retailers who adopt the audit strategy; then, is the proportion of retailers who adopt the nonaudit strategy.
We assume that both farmers and retailers are bounded rational. To minimize fraud, we consider three policies in the following subsections.
3.1. Static Premium Policy Model
Under this policy, retailers offer farmers a premium revenue for the green product, where is a fixed constant. Then, the models in this section are as follows. Table 1 shows the evolutionary game payoffs matrix of the static premium policy.

Table 1.
Payoffs matrix under the static premium policy.
When retailers adopt the audit strategy, their expected payoffs are
When they adopt the nonaudit strategy, their expected payoffs are
Therefore, retailers’ replicator dynamic equation is as follows:
When farmers adopt the true green strategy, their expected payoffs are
When they adopt the fraud strategy, their expected payoffs are
Therefore, farmers’ replicator dynamic equation is as follows:
Based on Equations (4) and (8), we obtain the replicator dynamic system (1). According to , we derive the following equilibrium points:
where
(0, 0), (1, 0), (0, 1), (1, 1), (x1, y1)
To make sure that retailers’ audit strategy encourages farmers to adopt the true green strategy, we assume that , that is, . We utilize the Jacobian matrix to analyze the stability of the system’s dynamic equilibrium points. Under the static premium policy, the system’s Jacobian matrix is as follows:
When the system equilibrium points’ corresponding matrix determinant Det(J) > 0 and matrix trace Tr(J) < 0, we call it an evolutionary stable strategy (ESS). When Det(J) > 0 and Tr(J) > 0, the equilibrium point is in an unstable state. However, when Det(J) < 0, it is a saddle point. Table 2 shows the stability analysis of both players.

Table 2.
Stability analysis of both players.
3.2. Dynamic Premium Policy Model
Under this policy, the premium is related to the number of farmers who produce the green product. If there are more farmers who produce the true green product, meaning more supply, retailers can pay a lower premium [58]. Thus, under the dynamic premium policy, we assume that the premium is . Then, Table 3 shows the evolutionary game payoffs matrix of the dynamic premium policy.

Table 3.
Payoffs matrix under the dynamic premium policy.
When retailers adopt the audit strategy, their expected payoffs are
When they adopt the nonaudit strategy, their expected payoffs are
Retailers’ replicator dynamic equation is as follows:
When farmers adopt the true green strategy, their expected payoffs are
When they adopt the fraud strategy, their expected payoffs are
Farmers’ replicator dynamic equation is as follows:
Based on Equations (13) and (17), we obtain the replicator dynamic system (2). According to , we derive the following equilibrium points:
where
(0, 0), (1, 0), (0, 1), (1, 1), (x2, y2)
Likewise, to make sure that retailers’ audit strategy encourages farmers to adopt the true green strategy, we assume that under the dynamic premium policy. We utilize the Jacobian matrix to analyze the stability of the system’s dynamic equilibrium points. Under the dynamic premium policy, the system’s Jacobian matrix is as follows:
where
Table 4 shows the stability analysis of both players.

Table 4.
Stability analysis of both players.
3.3. Dynamic Premium and Farmers’ Punishment Policy Model
Under this policy, if the public discovers fraud, not only retailers but also farmers will be punished. Farmers are subject to the penalty F. Similar to the dynamic premium policy, farmers receive the premium . Table 5 shows the evolutionary game payoffs matrix under the dynamic premium and farmers’ punishment policy.

Table 5.
Payoffs matrix under the dynamic premium and farmers’ punishment policy.
When retailers adopt the audit strategy, their expected payoffs are
When they adopt the nonaudit strategy, their expected payoffs are
Therefore, retailers’ replicator dynamic equation is as follows:
When farmers adopt the true green strategy, their expected payoffs are
When they adopt the fraud strategy, their expected payoffs are
Therefore, farmers’ replicator dynamic equation is as follows:
Based on Equations (22) and (26), we obtain the replicator dynamic system (3). According to , we derive the following equilibrium points:
where
(0, 0), (1, 0), (0, 1), (1, 1), (x3, y3)
Likewise, to make sure that retailers’ audit strategy encourage farmers to adopt the true green strategy, we assume that . We utilize the Jacobian matrix to analyze stability of the system’s dynamic the equilibrium points. Under the dynamic premium and farmers’ punishment policy, system’s Jacobian matrix is as follows:
where
Based on the analysis, Table 6 shows the stability analysis of both players.

Table 6.
Stability analysis of both players.
4. Analysis
4.1. Static Premium Policy
According to models of the static premium policy, we derive the following proposition from Table 2.
Proposition 1.
Under the static premium policy, for the dynamic system :
- (i)
- If , does not satisfy the condition and , the asymptotically stable equilibrium is . The unstable point is . and are saddle points.
- (ii)
- If , satisfies the condition and , the dynamic system has no asymptotically stable equilibrium point. and are saddle points. is a central point.
Proposition 1 (i) shows that, when the premium is low, the stable equilibrium point is (0, 0). This means that all farmers adopt the fraud strategy, and no retailer audits farmers. In this case, all retailers sell the conventional product as the green product, leading to an ineffective green product market. Conversely, a high premium may incentivize farmers to produce the green product and avoid this ineffective result. However, Proposition 1 (ii) indicates that, when the premium is high, there is no asymptotically stable equilibrium point in the dynamic system (1). This implies that even if retailers raise the premium, they still cannot establish an effective green product market.
Corollary 1.
Under the static premium policy, the only possible asymptotically stable equilibrium point of the dynamic system is .
As summarized by Corollary 1, under the static premium policy, dynamic system (1) has no asymptotically stable equilibrium point. The static premium policy cannot lead to an effective green product market. Thus, we analyze the dynamic premium in the following subsection.
4.2. Dynamic Premium Policy
According to models of the dynamic premium policy, we derive the following proposition from Table 4.
Proposition 2.
Under the dynamic premium policy, when , is the asymptotically stable equilibrium point.
Proposition 2 states that there is an asymptotically stable equilibrium point , under the dynamic premium policy instead of (0, 0) under the static premium policy. When the premium is sufficiently high, the proportion of retailers audit farmers, and the proportion of farmers produce the green product. Consumers can buy the green product in the green product market. In other words, the dynamic premium policy transforms the ineffective market of the static premium policy into an effective market.
According to the asymptotically stable equilibrium point , , we analyze the impact of the production cost gap , the audit fee and the maximum premium on retailers’ and farmers’ decisions.
Proposition 3.
According to the asymptotically stable equilibrium point , , we derive:
- (i)
- , ,
- (ii)
- , ,
Proposition 3 demonstrates that the number of retailers increases in the production cost gap . This is because a higher production cost gap may encourage more farmers to adopt the fraud strategy, which makes more retailers audit farmers. As a result, the number of farmers who adopt the true green strategy becomes invariant to the production cost gap .
However, the premium and the audit fee can affect the number of farmers adopting the true green strategy. Intuitively, a higher premium motivates more farmers to produce the true green product. In this case, to reduce cost, fewer retailers audit farmers. On the other hand, a higher audit fee will reduce retailers’ willingness to audit, which means that farmers face a lower risk of being audited; thus, more farmers adopt the fraud strategy. In sum, setting a higher premium or a lower audit fee can incentivize more farmers to produce the true green product.
In the next subsection, we analyze how the dynamic premium and farmers’ punishment policy impacts the green market, where farmers will be punished when fraud is discovered.
4.3. Dynamic Premium and Farmers’ Punishment Policy
According to models of the dynamic premium policy, we derive the following proposition from Table 6.
Proposition 4.
Under the dynamic premium and farmers’ punishment policy, when , is the asymptotically stable equilibrium point.
Proposition 4 demonstrates that, when the premium is sufficiently high, there is an asymptotically stable equilibrium point . This means that the dynamic premium and farmers’ punishment policy can also lead to an effective green market.
According to asymptotically stable equilibrium point , we analyze the impact of the production cost gap , the audit fee , the maximum premium and the farmers’ penalty F on retailers’ and farmers’ decisions.
Proposition 5.
According to the asymptotically stable equilibrium point , we derive:
- (i)
- , and only if ,
- (ii)
- , , ,
Proposition 5 shows that a higher farmers’ penalty results in fewer retailers taking the audit. Therefore, punishing farmers who cheat can reduce retailers’ costs and improve the supply chain performance. When the penalty for farmers is low, the production cost gap, the audit fee and the premium have the same impact on farmers’ and retailers’ decisions as those under the dynamic premium policy.
5. Numerical Simulations
In order to further clarify and verify our model, we use Matlab R2022a for numerical simulations. We observe the trends of retailers’ and farmers’ decisions under each policy, as well as the impact of changes in parameters on both players.
First, we focus on the static premium policy. We set parameter values: , , which satisfies the condition of Proposition 1 (i). Figure 2a illustrates that, when the premium is low, the dynamic replicator system converges to (0, 0), which means that no farmer produces the green product and no retailer takes the audit. Then, we examine the conclusion of Proposition 1 (ii) in Figure 2b, where we set parameter values: , . We find that, for any initial value, the dynamic evolutionary process presents a closed loop around the central point , , which means that there is no asymptotically evolutionary stable strategy between retailers and farmers.
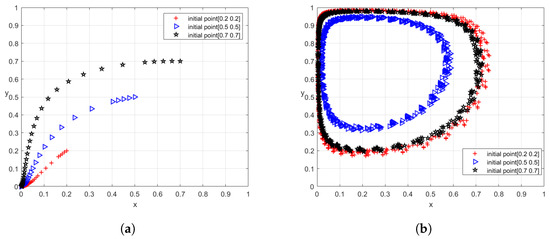
Figure 2.
Dynamic evolutionary process under the static premium policy (, ). (a) When is low (). (b) When is high ().
Then, we present the results of the dynamic premium policy. Figure 3a illustrates that when retailers offer the dynamic premium for the green product, the dynamic evolutionary process between retailers and farmers presents a spiral convergence. Figure 3b shows that the evolution of populations fluctuates greatly at first and levels off eventually. Both of these two figures indicate that , is the asymptotically stable equilibrium point of the replicator dynamic system (2), and Proposition 2 is verified.
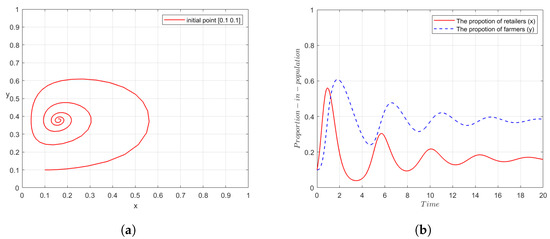
Figure 3.
Evolutionary results under the dynamic premium policy (, , ). (a) Dynamic evolutionary process. (b) Evolution of populations.
Proposition 3 indicates that raising the premium is an effective tool to promote green production under the dynamic premium policy. Figure 4a,b verifies the result. When the premium increases, more farmers produce the true green product. In this case, fewer retailers adopt the audit strategy, thus saving the audit fee, which benefits the development of green production.
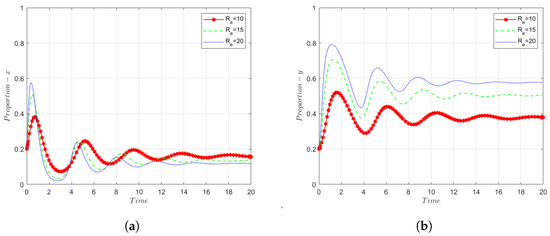
Figure 4.
Evolution of both players’ populations under different maximum premiums in the dynamic premium policy (). (a) Evolution of retailers’ populations. (b) Evolution of farmers’ populations.
Finally, we present the results of the dynamic premium and farmers’ punishment policy. Figure 5a demonstrates that the dynamic evolutionary process between retailers and farmers presents a spiral convergence, and , is the asymptotically stable equilibrium point of the replicator dynamic system (3). Figure 5b shows that the evolution of populations fluctuates greatly at first and levels off eventually. These results are consistent with the theoretical model results.
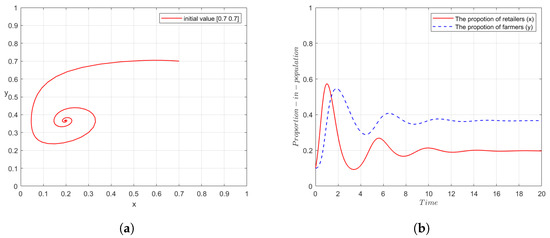
Figure 5.
Evolutionary results under the dynamic premium and farmers’ punishment policy (, ). (a) Dynamic evolutionary process. (b) Evolution of populations.
Figure 6b shows that, under the dynamic premium and farmers’ punishment policy, the higher the premium, the more farmers produce the true green product. On the other hand, when the penalty for farmers is low, the higher premium motivates fewer retailers to audit, as Figure 6a shows.
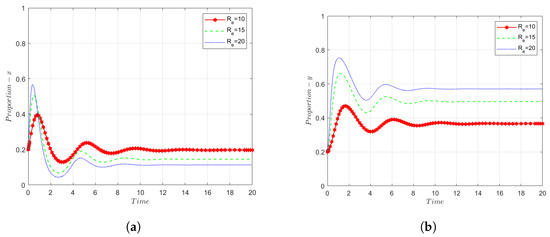
Figure 6.
Evolution of both players’ populations under different maximum premiums in the dynamic premium and farmers’ punishment policy (, ). (a) Evolution of retailers’ populations. (b) Evolution of farmers’ populations.
Figure 7 shows that, under certain conditions, increasing farmers’ penalty or the audit fee can effectively decreases the number of retailers who adopt the audit strategy. This reduces retailers’ costs.
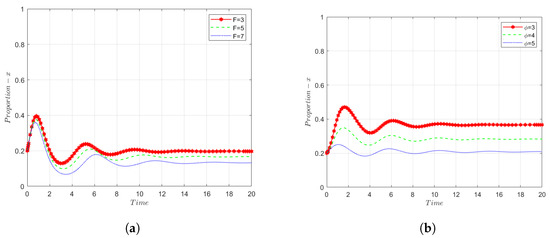
Figure 7.
Evolutionary results under the dynamic premium and farmers’ punishment policy (, ). (a) Evolution of retailers’ populations under different penalties F (). (b) Evolution of farmers’ populations under different audit fees ().
6. Conclusions
Nowadays, there is increasing attention to environmental issues caused by agriculture. Green agriculture as an effective way to reduce the environmental impact of agriculture has been supported around the world. In this paper, we develop an evolutionary game theory model to analyze how to build an effective green product market. We consider three policies: static premium policy, dynamic premium policy and dynamic premium and farmers’ punishment policy. Under these policies, farmers decide to produce the true green product or cheat, and retailers decide whether to audit farmers. Based on our study, we obtain the insights below:
- The static premium policy is not an ideal policy to promote the development of green agriculture. When the premium is low, the possible state point is in the system. Farmers and retailers are not willing to make efforts for green agriculture. When the premium is high, there is no asymptotically stable equilibrium point. The organic product market is still not effective.
- The dynamic premium policy, as well as the dynamic premium and farmers’ punishment policy, are effective ways to promote green practice. Under these policies, the systems can evolve to one asymptotically stable equilibrium point.The implication of these two results is that retailers should adopt the dynamic premium policy or the dynamic premium and farmers’ punishment policy. Economic motivations often drive green fraud. Retailers cannot reduce fraud by setting a static premium. Conversely, retailers setting a dynamic premium can reduce fraud. It incentivizes more retailers to audit farmers, and then more farmers produce true green products. Governments and the public should punish dishonest farmers. This threat can also encourage more farmers to produce true green products.
- A higher maximum premium encourages more farmers to produce true green products and may allow more retailers not to audit farmers. This can promote green practice and reduce retailers’ costs.The result shows that setting a high maximum premium can not only encourage more farmers to produce true green products but also reduce retailers’ costs. Although a high maximum premium incurs higher premium costs, it can reduce the audit cost and fraud. Thus, retailers would benefit from setting a high maximum premium in a green product market.
- When the production cost gap increases, it needs more retailers to audit farmers. When the audit fee decreases, more farmers produce the true green product. If the punishment for farmers increases, more retailers will not audit farmers.Our findings imply that more retailers should audit farmers when the production cost gap is high. Thus, retailers or governments helping farmers to improve production technology can reduce the production cost gap, leading to a lower the audit cost. On the other hand, governments should increase dishonest farmers’ penalties, which can also reduce retailers’ audit costs. This insight is observed in practice. For example, in the United States, five farmers were jailed for green fraud in 2018. Auditing farmers can discourage fraud. Thus, our findings also imply that governments should help retailers reduce the audit fee, which can motivate more farmers to produce true green products.
There are several limitations in this paper. First, we only consider the interaction between retailers and farmers. In practice, consumers’ and governments’ decisions also play an important role in the development of green agriculture. We will consider these players in future research to enrich the content of this paper. Second, this study does not consider the traditional product market, and future research will compare the green product market with the traditional product market. Finally, offering skills training for farmers is also an effective way to develop green agriculture, which will be considered in future research.
Author Contributions
Conceptualization, X.Y.; methodology, X.D.; software, X.Y.; validation, X.D.; formal analysis, X.Y.; investigation, X.D.; resources, Z.L.; writing—original draft preparation, X.Y.; writing—review and editing, Z.L.; visualization, X.D.; supervision, Z.L.; project administration, Z.L.; funding acquisition, X.D. All authors have read and agreed to the published version of the manuscript.
Funding
This research was funded by Science Research Project of Hunan Provincial Department of Education grant number 21B0039.
Institutional Review Board Statement
Not applicable.
Informed Consent Statement
Not applicable.
Data Availability Statement
Not applicable.
Conflicts of Interest
The authors declare no conflict of interest.
References
- Abbas, A.; Waseem, M.; Ahmad, R.; Khan, K.A.; Zhao, C.; Zhu, J. Sensitivity analysis of greenhouse gas emissions at farm level: Case study of grain and cash crops. Environ. Sci. Pollut. Res. 2022, 29, 82559–82573. [Google Scholar] [CrossRef]
- Abbas, A.; Zhao, C.; Waseem, M.; Ahmed khan, K.; Ahmad, R. Analysis of energy input–output of farms and assessment of greenhouse gas emissions: A case study of cotton growers. Front. Environ. Sci. 2022, 9, 826838. [Google Scholar] [CrossRef]
- Elahi, E.; Khalid, Z.; Tauni, M.Z.; Zhang, H.; Lirong, X. Extreme weather events risk to crop-production and the adaptation of innovative management strategies to mitigate the risk: A retrospective survey of rural Punjab, Pakistan. Technovation 2022, 117, 102255. [Google Scholar] [CrossRef]
- Elahi, E.; Khalid, Z. Estimating smart energy inputs packages using hybrid optimisation technique to mitigate environmental emissions of commercial fish farms. Appl. Energy 2022, 326, 119602. [Google Scholar] [CrossRef]
- Qiao, H.; Zheng, F.; Jiang, H.; Dong, K. The greenhouse effect of the agriculture-economic growth-renewable energy nexus: Evidence from G20 countries. Sci. Total. Environ. 2019, 671, 722–731. [Google Scholar] [CrossRef] [PubMed]
- Harvey, F. Farming Is ’Single Biggest Cause’ of Worst Air Pollution in Europe. 2016. Available online: https://www.theguardian.com/environment/2016/may/17/farming-is-single-biggest-cause-of-worst-air-pollution-in-europe (accessed on 15 October 2022).
- Brussels. Questions and Answers: Actions to Boost Organic Production. 2021. Available online: https://ec.europa.eu/commission/presscorner/detail/en/QANDA_21_1277 (accessed on 15 October 2022).
- FAO. What Is Organic Agriculture? 1999. Available online: https://www.fao.org/organicag/oa-faq/oa-faq1/en/ (accessed on 15 October 2022).
- SBU. Sustainable vs. Conventional Agriculture. 2014. Available online: https://you.stonybrook.edu/environment/sustainable-vs-conventional-agriculture/ (accessed on 15 October 2022).
- Brown, M.J. What Is Organic Food, and Is It More Nutritious than Non-Organic Food? 2021. Available online: https://www.healthline.com/nutrition/what-is-organic-food (accessed on 15 October 2022).
- Harrar, S. Is Organic Produce Healthier than the Conventional Kind? 2022. Available online: https://www.everydayhealth.com/diet-nutrition/is-organic-produce-healthier-than-the-conventional-kind/ (accessed on 15 October 2022).
- Cranfield, J.; Henson, S.; Holliday, J. The motives, benefits, and problems of conversion to organic production. Ann. Oper. Res. 2010, 27, 291–306. [Google Scholar] [CrossRef]
- Seufert, V.; Ramankutty, N.; Foley, J.A. Comparing the yields of organic and conventional agriculture. Nature 2012, 485, 229–232. [Google Scholar] [CrossRef]
- Reganold, J.P.; Wachter, J.M. Organic agriculture in the twenty-first century. Nat. Plants 2016, 2, 1–8. [Google Scholar] [CrossRef]
- Ryan, J.F. Head of America’s Largest Organic Food Fraud Scheme Sentenced to 10 Years. 2019. Available online: https://globalnews.ca/news/5778147/organic-food-fraud-scheme/ (accessed on 15 October 2022).
- Harriet, B. The Tragedy of Fraud. 2019. Available online: https://organicfarmersassociation.org/news/the-tragedy-of-fraud/ (accessed on 15 October 2022).
- Gomacro. Food Fraud: Is Your Food Deceiving You? 2022. Available online: https://www.gomacro.com/food-fraud-your-food-deceiving-you/ (accessed on 15 October 2022).
- Plambeck, E.L.; Taylor, T.A. Supplier evasion of a buyer’s audit: Implications for motivating supplier social and environmental responsibility. Manuf. Serv. Oper. Manag. 2016, 18, 184–197. [Google Scholar] [CrossRef]
- Fang, X.; Cho, S.H. Cooperative approaches to managing social responsibility in a market with externalities. Manuf. Serv. Oper. Manag. 2020, 22, 1215–1233. [Google Scholar] [CrossRef]
- Kim, S.H. Time to come clean? Disclosure and inspection policies for green production. Oper. Res. 2015, 63, 1–20. [Google Scholar] [CrossRef]
- Chen, Z.; Ji, X.; Li, M.; Li, J. How corporate social responsibility auditing interacts with supply chain information transparency. Ann. Oper. Res. 2022, 1–20. [Google Scholar] [CrossRef]
- Caro, F.; Chintapalli, P.; Rajaram, K.; Tang, C.S. Improving supplier compliance through joint and shared audits with collective penalty. Manuf. Serv. Oper. Manag. 2018, 20, 363–380. [Google Scholar] [CrossRef]
- Ha, A.Y.; Shang, W.; Wang, Y. Supplier audit information sharing and responsible sourcing. Manag. Sci. 2022, 69, 308–324. [Google Scholar] [CrossRef]
- Agrawal, V.; Lee, D. The effect of sourcing policies on suppliers’ sustainable practices. Prod. Oper. Manag. 2019, 28, 767–787. [Google Scholar] [CrossRef]
- Liu, X.; Mishra, A.; Goldstein, S.; Sinha, K.K. Toward improving factory working conditions in developing countries: An empirical analysis of Bangladesh ready-made garment factories. Manuf. Serv. Oper. Manag. 2019, 21, 379–397. [Google Scholar] [CrossRef]
- de Zegher, J.F.; Iancu, D.A.; Lee, H.L. Designing contracts and sourcing channels to create shared value. Manuf. Serv. Oper. Manag. 2019, 21, 271–289. [Google Scholar] [CrossRef]
- Chen, L.; Lee, H.L. Sourcing under supplier responsibility risk: The effects of certification, audit, and contingency payment. Manag. Sci. 2017, 63, 2795–2812. [Google Scholar] [CrossRef]
- Kalkanci, B.; Plambeck, E.L. Reveal the supplier list? A trade-off in capacity vs. responsibility. Manuf. Serv. Oper. Manag. 2020, 22, 1251–1267. [Google Scholar] [CrossRef]
- Kraft, T.; Valdés, L.; Zheng, Y. Supply chain visibility and social responsibility: Investigating consumers’ behaviors and motives. Manuf. Serv. Oper. Manag. 2018, 20, 617–636. [Google Scholar] [CrossRef]
- Chen, S.; Zhang, Q.; Zhou, Y.P. Impact of supply chain transparency on sustainability under NGO scrutiny. Prod. Oper. Manag. 2019, 28, 3002–3022. [Google Scholar] [CrossRef]
- Wang, S.; Sun, P.; de Véricourt, F. Inducing environmental disclosures: A dynamic mechanism design approach. Oper. Res. 2016, 64, 371–389. [Google Scholar] [CrossRef]
- Xue, K.; Li, Y.; Zhen, X.; Wang, W. Managing the supply disruption risk: Option contract or order commitment contract? Ann. Oper. Res. 2020, 291, 985–1026. [Google Scholar] [CrossRef]
- Kim, S.H.; Netessine, S. Collaborative cost reduction and component procurement under information asymmetry. Manag. Sci. 2013, 59, 189–206. [Google Scholar] [CrossRef]
- Chao, G.H.; Iravani, S.M.; Savaskan, R.C. Quality improvement incentives and product recall cost sharing contracts. Manag. Sci. 2009, 55, 1122–1138. [Google Scholar] [CrossRef]
- Mendoza, A.J.; Clemen, R.T. Outsourcing sustainability: A game-theoretic modeling approach. Environ. Syst. Decis. 2013, 33, 224–236. [Google Scholar] [CrossRef]
- Kim, S.; Shin, N.; Park, S. Closed-loop supply chain coordination under a reward–penalty and a manufacturer’s subsidy policy. Sustainability 2020, 12, 9329. [Google Scholar] [CrossRef]
- Ran, W.; Xu, T. Low-Carbon Supply Chain Coordination Based on Carbon Tax and Government Subsidy Policy. Sustainability 2023, 15, 1135. [Google Scholar] [CrossRef]
- Chen, C.M.; Delmas, M.A. Measuring eco-inefficiency: A new frontier approach. Oper. Res. 2012, 60, 1064–1079. [Google Scholar] [CrossRef]
- Zhou, R.; Bhuiyan, T.H.; Medal, H.R.; Sherwin, M.D.; Yang, D. A stochastic programming model with endogenous uncertainty for selecting supplier development programs to proactively mitigate supplier risk. Omega 2022, 107, 102542. [Google Scholar] [CrossRef]
- Hwang, I.; Radhakrishnan, S.; Su, L. Vendor certification and appraisal: Implications for supplier quality. Manag. Sci. 2006, 52, 1472–1482. [Google Scholar] [CrossRef]
- Chen, Y.J.; Shanthikumar, J.G.; Shen, Z.J.M. Incentive for peer-to-peer knowledge sharing among farmers in developing economies. Prod. Oper. Manag. 2015, 24, 1430–1440. [Google Scholar] [CrossRef]
- An, J.; Cho, S.H.; Tang, C.S. Aggregating smallholder farmers in emerging economies. Prod. Oper. Manag. 2015, 24, 1414–1429. [Google Scholar] [CrossRef]
- Kaniovski, Y.M.; Young, H.P. Learning dynamics in games with stochastic perturbations. Games Econ. Behav. 1995, 11, 330–363. [Google Scholar] [CrossRef]
- Schmidt, C. Are evolutionary games another way of thinking about game theory? J. Evol. Econ. 2004, 14, 249–262. [Google Scholar] [CrossRef]
- Friedman, D. Evolutionary games in economics. Econometrica 1991, 59, 637–666. [Google Scholar] [CrossRef]
- Friedman, D. On economic applications of evolutionary game theory. J. Evol. Econ. 1998, 8, 15–43. [Google Scholar] [CrossRef]
- Su, X.; Liu, H.; Hou, S. The trilateral evolutionary game of agri-food quality in farmer-supermarket direct purchase: A simulation approach. Complexity 2018, 2018, 5185497. [Google Scholar] [CrossRef]
- Zhang, L.; Xue, L.; Zhou, Y. How do low-carbon policies promote green diffusion among alliance-based firms in China? An evolutionary-game model of complex networks. J. Clean. Prod. 2019, 210, 518–529. [Google Scholar] [CrossRef]
- Fan, R.; Dong, L. The dynamic analysis and simulation of government subsidy strategies in low-carbon diffusion considering the behavior of heterogeneous agents. Energy Policy 2018, 117, 252–262. [Google Scholar] [CrossRef]
- Yang, Y.; Yang, W.; Chen, H.; Li, Y. China’s energy whistleblowing and energy supervision policy: An evolutionary game perspective. Energy 2020, 213, 118774. [Google Scholar] [CrossRef]
- Liu, D.; Xiao, X.; Li, H.; Wang, W. Historical evolution and benefit–cost explanation of periodical fluctuation in coal mine safety supervision: An evolutionary game analysis framework. Eur. J. Oper. Res. 2015, 243, 974–984. [Google Scholar] [CrossRef]
- Hafezalkotob, A.; Mahmoudi, R. Selection of energy source and evolutionary stable strategies for power plants under financial intervention of government. J. Ind. Eng. Int. 2017, 13, 357–367. [Google Scholar] [CrossRef]
- Liu, C.; Huang, W.; Yang, C. The evolutionary dynamics of China’s electric vehicle industry—Taxes vs. subsidies. Comput. Ind. Eng. 2017, 113, 103–122. [Google Scholar] [CrossRef]
- Fan, R.; Dong, L.; Yang, W.; Sun, J. Study on the optimal supervision strategy of government low-carbon subsidy and the corresponding efficiency and stability in the small-world network context. J. Clean. Prod. 2017, 168, 536–550. [Google Scholar] [CrossRef]
- Liu, Z.; Qian, Q.; Hu, B.; Shang, W.L.; Li, L.; Zhao, Y.; Zhao, Z.; Han, C. Government regulation to promote coordinated emission reduction among enterprises in the green supply chain based on evolutionary game analysis. Resour. Conserv. Recycl. 2022, 182, 106290. [Google Scholar] [CrossRef]
- Aschemann-Witzel, J.; Zielke, S. Can’t buy me green? A review of consumer perceptions of and behavior toward the price of organic food. J. Consum. Aff. 2017, 51, 211–251. [Google Scholar] [CrossRef]
- Bazylevych, V.; Kupalova, G.; Goncharenko, N.; Murovana, T.; Grynchuk, Y. Improvement of the effectiveness of organic farming in Ukraine. Probl. Perspect. Manag. 2017, 15, 64–75. [Google Scholar] [CrossRef]
- Jeff, S.; Emily, P. Understanding Organic Pricing and Costs of Production. 2019. Available online: https://attra.ncat.org/publication/understanding-organic-pricing-and-costs-of-production/ (accessed on 15 October 2022).
Disclaimer/Publisher’s Note: The statements, opinions and data contained in all publications are solely those of the individual author(s) and contributor(s) and not of MDPI and/or the editor(s). MDPI and/or the editor(s) disclaim responsibility for any injury to people or property resulting from any ideas, methods, instructions or products referred to in the content. |
© 2023 by the authors. Licensee MDPI, Basel, Switzerland. This article is an open access article distributed under the terms and conditions of the Creative Commons Attribution (CC BY) license (https://creativecommons.org/licenses/by/4.0/).