Article

Forecasting Waste Mobile Phone (WMP) Quantity and Evaluating the Potential Contribution to the Circular Economy: A Case Study of Turkey

Department of Industrial Engineering, Faculty of Engineering, Pamukkale University, 20160 Denizli, Turkey
*
Author to whom correspondence should be addressed.
Sustainability 2023, 15(4), 3104; https://doi.org/10.3390/su15043104
Submission received: 31 December 2022 / Revised: 29 January 2023 / Accepted: 6 February 2023 / Published: 8 February 2023
(This article belongs to the Special Issue Sustainable Development of Supply Chains and Systems)

Abstract

:
Information and communication technology (ICT)-based products have a significant effect on increasing levels of waste electrical and electronic equipment (WEEE) or electronic waste (e-waste) due to their shorter lifespan as a result of rapid technological changes. Mobile phones are the most popular ICT products, and their market share is increasing gradually. Therefore, effective management of waste mobile phones (WMP) is sought as their recovery brings enormous economic and regulatory benefits. Forecasting the quantities of WMP and their recoverable material content generates valuable data for the related stakeholders in the circular economy (CE) in the design and management of their supply chain networks. This paper presents an approach to determining the WMP quantity for Turkey considering the system from sales to end-of-life (EOL) stages and the years between 2001 and 2035. The proposed model includes two main parts: estimation and forecasting. Firstly, the generated WMP quantity is estimated based on dynamic lifespan and sales using the Distribution Delay (DD) Method considering the years from 2001 to 2020. To select the most suitable model for future projection, seven different time series methods (e.g., Simple Exponential Smoothing, Holt’s, Logistics, Gompertz, Logarithmic, Bass, and ARIMA models) are considered to estimate the generated WMP. For the given data, the Holt’s Method is determined to be the best method to forecast the WMP quantities for the years from 2021 to 2035. In addition, waste materials amount and revenue potentials are estimated for the years from 2001 to 2035. The WMP for Turkey is expected to be approximately 11.5 million units and has a 52 million US$ revenue potential in 2035. The present study contributes to the literature, as it is the first holistic forecasting study on the quantification of WMPs in Turkey. Moreover, since WMPs include remarkable recovery potential in terms of CE, the data and findings of this study may help policymakers, governments, producers, consumers, and all stakeholders to establish effective e-waste management approaches.

1. Introduction

Electrical and Electronic Equipment (EEE) is increasingly used everywhere in various parts of daily life. EEEs initially entered houses with lighting and white goods, and have become indispensable elements of home and business life with information technology products such as computers, mobile phones, and small household appliances. In addition to traditional production systems, EEEs have been used effectively in all areas of life, such as medical, transportation, toys, energy, and etc. [1,2]. The expansion of the usage of these products and the rapid progress of technological changes brings along a rapid formation of electronic waste (e-waste) or waste electrical and electronic equipment (WEEE). Globally, 44.7 Million metric tonnes (Mt) of e-waste was generated in 2014 and 53.6 Mt in 2019, and it is forecasted that the generated e-waste quantity in 2030 will reach 74.7 Mt [3]. Forecasting the amount of generated e-waste accurately is a challenging task, especially for underdeveloped and developing countries since there are shortages of data related to the number of products in the first and secondary markets, recycling activities, etc.
Due to technological changes, mobile phones, televisions, and computers are the products that generate the fastest and highest amount of waste in WEEE items. The generated e-waste quantity was 13.1 Mt in 2019 in the large equipment category, which has one of the largest e-waste volumes among all e-waste categories, while this quantity is 4.7 Mt for the Small IT and telecommunication equipment category across the world [3]. What is striking here is that the amount of e-waste generated in the large equipment category is 2.8 times the mass of the Small IT and telecommunication equipment category. However, considering that a mobile phone weighs approximately 100 g and a washing machine weighs about 65 kg, it is evident that mobile phones contribute significantly to the amount of generated e-waste. Waste Mobile Phones (WMPs) have a high potential to contribute to the circular economy (CE). CE is an economic model for sustainability [4]. According to Stahel [5], the “4R” CE strategies deviate from the dominant economic logic: reuse, recycle, repair, and remanufacture. When creating legislation and business strategies for the transition to the CE, measuring the contribution of goods and services to the CE is essential [6]. These terms directly indicate the e-waste management issues. Therefore, the CE has immense importance for the EEE market and WEEE industry. Especially, WMPs contain valuable material contents (Au, Ag, Pd, Plastic, etc.) and harmful components such as heavy metals (Hg, Cd, Pb, etc.), chemicals (chloro-fluorocarbons-CFCs, hydrochlorofluorocarbons-HCFCs), and flame retardants. Additionally, the transportation, storage, disassembly, and recovery of WMPs are risky operations under inappropriate and uncontrolled conditions, and WMPs have an adverse effect on the entire ecosystem.
With a population of over 80 million, Turkey is a developing, and the highest e-waste generating, country in the western Asia sub-region. According to the Global E-Waste Monitor Report [3], Turkey generated 847 kt of e-waste in 2019. Among Asian countries, it is the fifth country in terms of e-waste production after China, India, Japan, and Indonesia [3]. In addition, the number of mobile phone users in households in Turkey reached 98% in 2018. This ratio indicates that Turkey is a large consumer on the electronic market and, therefore, a huge e-waste producer. However, only 3% of the e-waste generated in 2017 was processed in Turkey [7,8]. These figures show that Turkey is a significant WMP producer and a gem in terms of e-waste awaiting recycling and recovery. Therefore, forecasting WMP quantity for Turkey is vital in establishing an efficient e-waste management system and designing reverse and/or closed supply chain networks.
Regarding this need, this paper addresses the following research questions: How can we determine the amount of WMP produced in Turkey in the past and future? Can alternative methods be used to increase the accuracy of the forecasting? What is the material and revenue potential of WMPs that may contribute to the CE? These questions are addressed by considering a product’s life from birth to death and designing a general forecasting model including the WMPs quantity, material, and revenue potential. This study proposes a practical and flexible approach considering different life phases of products to quantify the WMPs in Turkey. The approach first estimates WMPs based on the sales and dynamic lifespan profile of products, and then forecasts WMPs through the best forecasting method after evaluating the various methods. Finally, the material and revenue potential of WMPs are calculated, and the effects of the changes in main inputs are analysed from a CE perspective.
The remaining parts of this paper are structured as follows. In Section 2, the literature review and research gaps are presented; as well, the contributions of the study are outlined. Section 3 introduces the materials and methods used. In Section 4, computational results, sensitivity analysis, and discussions are provided in detail. Finally, the last section is dedicated to conclusions.

2. Literature Review

E-waste estimation studies started just before the 2000s [9,10,11]. There are various methods to estimate the generation of e-waste in the literature. In this study, the literature analysis is handled in three ways: Analysing e-waste-related quantification studies based on different criteria (method, region, etc.), e-waste estimation from the CE perspective, and analysing the literature on Turkey e-waste estimation.
A two-level taxonomy is used to classify the e-waste quantification studies. First, the studies are investigated using the search phrases “WEEE or e-waste or electronic waste” and “generation or quantification or estimation or forecasting.” At the second level, eight sub-categories are determined to examine the literature in depth, i.e., estimation method, product type, country/region, product life, estimation type in unit or weight, estimation period, training data if needed according to the estimation method, and data source. The e-waste estimation literature is examined as given in Table 1 within the scope of this study.
Before the discussion on sub-categories, for the following paragraph presents some notes on the literature analysis. The most frequently encountered products in studies are given in Table 1 with their UNU-KEY codes. The UNU-KEY is the e-waste classification defined by the United Nations University, which categorizes e-waste into roughly 54 homogeneous product types [12]. The personal computers included in the studies and not specified in detail are considered desktops, TVs as Cathode Ray Tube TVs, and monitors as Cathode Ray Tube Monitors. Since the product considered in the current study is WMP, the related product UNU-KEY code 0306 is shown in boldface for studies dealing with mobile phone estimation in Table 1. Data sources have a wide variety due to the many kinds of methods used in the literature, and each method requires a different type of data. Moreover, product types and data availability may differ from country to country. Therefore, data sources are generalized as statistical data from governmental sources, managerial statistics, or reports (such as European Environmental Agency-EEA, Organisation for Economic Cooperation and Development-OECD, etc.), surveys, industrial sources, and etc.
Table 1. E-waste quantification-related studies in literature.
StudyYearMethod *Product Type (UNU-KEY) **RegionProduct Life ***UnitTrain DataEstimation PeriodData Source(s)
Tasaki, et al. [13]2004DD, LM0407JapanDBkgN/A1995–2020Collected TV, Organization Statistics, and Literature
Streicher-Porte, et al. [14]2005SD0302India/DelhiFixedunitsN/A2003–2010Organization Statistics
Peralta and Fontanos [15]2006CM0104, 0108, 0111, 0403, 0407PhilippinesFixedunitsN/A1995, 2000, 2005, 2010Organization Statistics
Jain and Sareen [16]2006SD0407, 0302India/DelhiFixedunitsN/A-2010Organization Statistics and Survey
Kumar and Shrihari [17]2007SD, DD, C and U0104, 0108, 0302, 0306, 0407India/MangaloreFixed/DBkg, tonnesN/A2007–2015, 2007Organization Statistics
Oguchi, et al. [18]2008DD94 different types of productsJapanDBunitsN/A2003Industrial Sources, Literature, and Surveys
Yang and Williams [19]2009LM0302, 0303United StatesDBunits1978–20081980–2050Organization Reports, Survey Reports, and Literature
Walk [20]2009DD0308, 0407Germany/Baden-WürttembergDBtonnesN/A200–2015Recycling Centers, Industrial Sources
Robinson [21]2009C and U0302, 0305, 0306, 0308, 0403GeneralFixedkgN/A2009Organization Statistics and Literature
Dwivedy and Mittal [22]2010CM0104, 0108, 0302, 0303, 0407IndiaFixedunitsN/A2007–2011Literature and Sectoral Reports
Steubing, et al. [23]2010CM0302, 0303, 0308, 0309ChileFixedkgN/A1996–2020Organization Statistics
Dwivedy and Mittal [24]2010LM, CM0302, 0303IndiaDBunits1994–20071994–2026Organization Statistics and Industrial Sources
Chung, et al. [25]2011C and U0104, 0108, 0111, 0302, 303, 0407China/Hong KongFixedkgN/A2009Surveys
Polak and Drapalova [26]2012DD0306Czech RepublicDBunitsN/A1995–2020Organization Statistics, Recycling Centers, and Mobile Operator
Araújo, et al. [27]2012C and U, TS0108, 0104, 0302, 0303, 0403BrazilFixedtonnesN/A2000–2008 and 2008Organization Statistics and Industrial Sources
Wang, et al. [28]2013SD, DD, CM, C and U, TS0104, 0303, 0407, 0408FinlandFixed/DBkgN/A1990–2011Organization Statistics, Industrial Sources, and Surveys
Kim, et al. [29]2013LM0108, 0104, 0111, 0114, 0204, 0306, 0407, 0408South KoreaDBunits1980–20092000–2020Organization Reports and Surveys
Pant [30]2013Math. expression0308, 0104, 0111, 0114, 0302, 0303India/DehradunFixedunitsN/AEquation depends on the yearOrganization Statistics and Sales distributors
Öztürk [31]2014C and U0108,
0102, 0104, 0109, 0111, 0302, 0305, 0306, 0404, 0407
TurkeyFixedtonnesN/A2002–2012, 1999–2012 TV, 2005–2012 PCOrganization Statistics and Literature
Yazici, et al. [32]2014DD0108TurkeyDBtonnes, unitsN/A2013Industrial Sources and Literature
Li, et al. [33]2015DD, C and U, TS0306Chinese Fixed/DBunitsN/A1998–2012Organization Statistics and Surveys
Kalmykova, et al. [34]2015DD0302, 0308, 0309, 0407, 0408SwedenDBtonnes, unitsN/A2014–2040Obsolete TV and monitors
Alavi, et al. [35]2015 0108, 0109, 0102, 0104, 0111, 0302, 0303, 0306, 0305, other
0407, 0308
Iran/AhvazFixedtonnesN/A2011Surveys and Literature
Ikhlayel [36]2016SD, CM, C and U, SM, TS0108, 0407, 0104, 0302, 0303, 0306Jordan/Middle East-North AfricaFixedkgN/A2015Organization Statistics
Petridis, et al. [37]2016LM and Time Series Models0302, 0303East-West Euro, Asia/Pacific, Japan/Aust./Y. Zealand, North and South/Central AmericaDBunits1985–20122013–2030Organization Statistics and Industrial Sources
Zhao, et al. [38]2016GM0108, 0407, 0104, 0111, 0302, 0303ChineseFixedunits2001–20132014–2040Literature
Salihoğlu and Kahraman [39]2016C and U0108, 0407, 0104, 0302, 0303, 0306Turkey/BursaFixedkgN/A2015Surveys
Golev, et al. [40]2016SSL0108, 0109, 0104, 0102, 0111, 0302, 0303, 0306, 0114, 0404, 0304AustraliaDBtonnesN/A2010–2024Organization Statistics
Guo and Yan [41]2017LM0306ChineseDBkg, units1997–20151997–2025Organization Statistics and Surveys
Gusukuma and Kahhat [42]2018MFA0407Peru-unitsN/A2005–2017, 2025Organization Statistics
Tran, et al. [43]2018DD, MFA0407VietnamDBunitsN/A1966–2030Organization Statistics and Literature
Wang, et al. [44]2018DD, LM0407, 0408ChinaDBunits1992–20121992–2040Organization Statistics, Industrial Reports, and Literature
Kececi, et al. [45] (in Turkish)2018CM0104, 0108, 0204, 0308, 0309Turkey/Ankara, Cankaya DistrictFixedtonnesN/A2011–2016Surveys, Governmental data for Lifespan
Thiébaud-Müller, et al. [46]2018MFA0407, 0408, 0302, 0309
0303, 0306, 0305, Otr.
SwissFixed/DB-N/A2014Surveys
Duman, et al. [47]2019GM0302, 0303USA/Washington-units2003–20172018–2030Organization Statistics
Sajid, et al. [48]2019MFA0302, 0308, 0303PakistanFixedunitsN/A2005–2020Field Visits And Surveys
Ravindra and Mor [49]2019Average Household0104, 0111, 0302, 0308, 0309, 0303, 0306, DIndia\ChandigarhFixedkg, unitsN/A2016Surveys
Abbondanza and Souza [50]2019DD0108, 0109, 0308, 0309, 0407, 0408, 0104, 0111, 0302, 0303, 0306, 0305, 0403, OtrBrazil/Sao Jose dos CamposDBkg, unitsN/A2009–2017, 2014–2025Surveys
Golev, et al. [51]2019MFAPrinted circuit boardsAustralia-tonnesN/A2010–2024Literature and NTCRS co-regulator
Gonda, et al. [52]2019C and U, MFA0302Belgium/The Brussels Capital Region, Walloon RegionFixedtonnesN/A2013Organization Statistics and Reports
Islam and Huda [53]2019Holt’s51 typesAustraliaDBtonnes1988–20172018–2047Organization statistics (Uncomtrade), Global reports
Duman, et al. [54]2020GMGeneralUSA-tonnes2003–20152016–2023Organization statistics
Kosai, et al. [55]2020Bass0104, 0108, 0111, 0407VietnamDBunits1977–20142015–2050Organizational statistics, literature-based
Li, et al. [56]2020Sales-update0306China-units1997–20172009–2017Ministry of Industry and Information Technology
Kazancoglu, et al. [57]2020GMGeneralTurkey-tonnes2011–20182019–2021Governmental collected e-waste
Ryan-Fogarty, et al. [58]2021Analysing sites dataGeneral-scrap metalsIreland-units and kg 2019Scrap metal processing sites and EPA reports
Wang, et al. [59] 2021GMGeneralUSA-tonnes2003–20152016–2025Organization statistics
Zeng, et al. [60]2021Bass and Kuznets curve33 typesChinaDBunits and tonnes1990–20192010–2050China National Bureau of Statistics, China Customs Statistics
Zhang, et al. [61]2021DDPrinted circuit boardsChinaDBunits and tonnes1980–20181998–2035National Bureau of Statistics
of China
Koshta, et al. [62]2021DD, S-shaped Curves0306India/DelhiDBunits2008–20191995–2030Literature and Telecom Statistics India-2019
Kastanaki and Giannis [63]2022LM, DD0306GreeceDBunits, tonnes1995–20101995–2035Organization statistics
Sakthivel, et al. [64]2022MFA, DD0104, 0108, 0302, 0303IndiaDBunits1990–20192010–2030Literature, the market research firm from UN COMTRADE, the Departments of Foreign Affairs and Trade, and the Department of Fair Trading
Li, et al. [65]2022SM0306China-units, tonnes-1998–2020Authoritative and continuous official data, survey
Owusu-Sekyere, et al. [66]2022Analysing Input output materials GeneralGhana-tonnes-2021Scrapyard site data
This study DD and time series forecasting techniques0306TurkeyDBunits, tonnes2001–20202001–2035Statistical Data, Literature
* Method: Sales Method (SM), Simple Delay Method (SD), Distribution Delay Method (DD), Carnegie Mellon Method (CM), Time Step Method (TS), Consumption and Use Method (C and U), Material Flow Analysis (MFA), Grey Model (GM), Logistic Model (LM), and Sales-Stock-Lifespan (SSL). ** UNU-KEY and Description [12]: 0102—Dishwashers, 0104—Washing Machines, 0108—Fridges, 0109—Freezers, 0111—Air Conditioners, 0114—Microwaves, 0202—Food, 0204—Vacuum Cleaners, 0302—Desktop PCs, 0303—Laptops, 0304—Printers, 0305—Telecom, 0306—Mobile Phones, 0307—Professional IT, 0308—Cathode Ray Tube Monitors, 0309—Flat Display Panel Monitors, 0401—Small Consumer Electronics, 0403—Music Instruments, Radio, HiFi, 0404—Video, 0407—Cathode Ray Tube TVs, 0408—Flat Display Panel TVs, Otr—Other. *** Product Life: Fixed or Distribution Based (DB).
According to the WEEE direction, e-waste is divided into 10 general product groups [67]. As can be seen in Table 1, the most frequently-estimated groups in the literature are large household appliances and ICT equipment. It is worth emphasizing that the products (refrigerators, television, washing machine, mobile phones, and computers) belonging to these groups are frequently estimated since they are widely used and constitute a large part of the generated e-waste. The estimation unit is usually calculated in terms of weight or unit. While the weight defines the total weight of e-waste, it can define product weight per capita in some studies. For example, the unit of collection targets is determined as kg per capita for WEEEs in Turkey [7]. Furthermore, both weight and unit are considered in some studies [49,50]. In some cases, there can be constraints such as vehicle capacity, weight carrying upper limit, warehouse capacity, and facility processing capacity. Therefore, it is useful to plan and make estimations based on volume and weight. Although products such as mobile phones and computers are light, they have high economic values due to their valuable material contents. For such products, it may be a better choice to evaluate them in units rather than weights.
Lack of data is a significant problem in e-waste estimation. As it can be seen in Table 1, surveys are used in most of the studies. Surveys are generally applied to obtain information on the quantities and lifetimes of used, stored, and recycled EEEs. Product lifespan can be considered a fixed value or can be distribution-based. In some studies, the lifespan data are obtained from surveys and field studies, which are also adopted from the literature [31].
E-waste has become a widespread problem all over the world. It can be seen from the literature analysis in Table 1 that the studies are geographically spread worldwide. Moreover, e-waste estimation studies are frequently carried out in countries where the population is dense or e-waste management is dictated by laws and regulations. It is also noted that the studies are mainly considered as case studies since the dynamics of each country and even each region of a country are different.
The estimation methods given in Table 1 can be broadly divided into three groups: Input-output analysis (IOA)-based [68], time series-based, and hybrid estimation methods. Among the estimation methods based on IOA, the Distribution Delay (DD) and the Consumption and Use (C and U) methods are the most widely used estimation methods. Time series-based methods, known as general estimation methods, such as the Logistic model, Bass, Gompertz, ARIMA, and so forth, are also used for e-waste estimation. Moreover, hybrid estimation methods are a combination of IOA and time series-based methods. For example, in the study of Yang and Williams [19], a hybrid forecasting model was proposed in which the product ownership rates were determined with the logistic model based on the population, and then the amount of e-waste was estimated by the DD method based on Input-output analysis. It is necessary to point out here that training and estimation periods depend on the estimation method used. Training data refers to the years of the time series used for modelling. Input-output analysis can estimate only the years for which data can be observed. However, it is possible to forecast the future in the longer term with classical and hybrid forecasting methods. Observed data (in sample data, training data) are needed to forecast using these methods. Moreover, some studies focus on material flow; therefore, estimations can only be made for a single year [49,52,69].
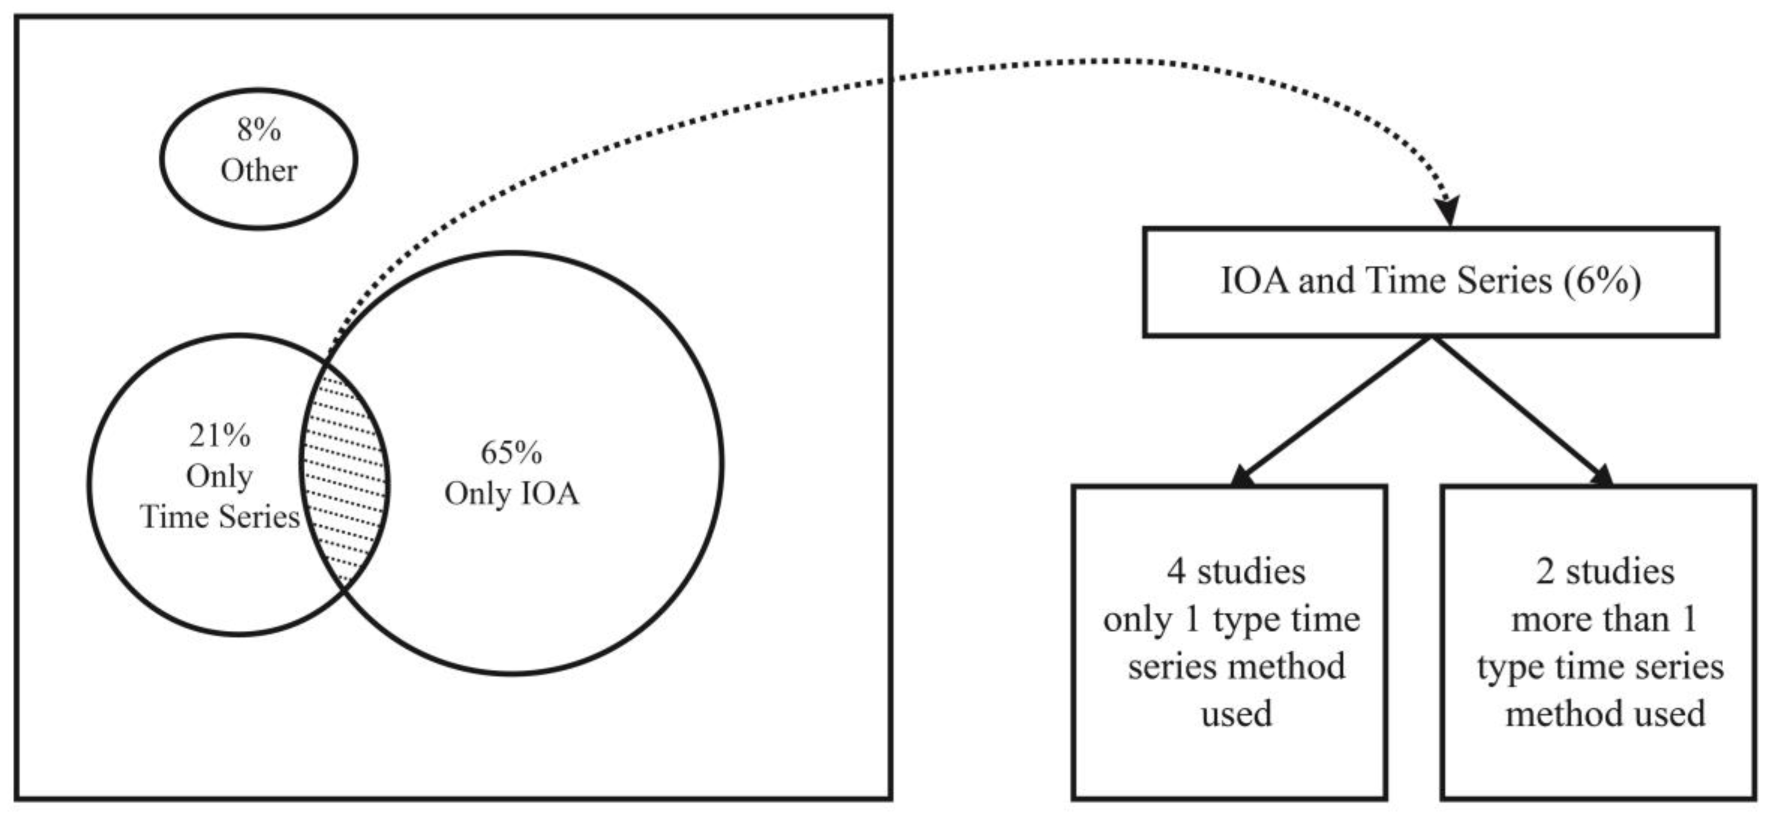
For more clarity on the methods given in Table 1, the summary of the methodology-based literature analysis is illustrated in Figure 1. It can be seen from this figure that IOA, time series, and other methods (GM, sites data analysis, etc.) are used in 65%, 21%, and 8% of studies, respectively. Hybrid models are used in only 6% of the reviewed studies. The hybrid models are analysed deeply, and it can be seen that four of these studies used a single time series and a single IOA method. The number of studies that use multiple forecasting models in hybrid models is rare. The methodological motivation of the current study comes from this gap.
Besides the e-waste estimation, another central issue of this study is the CE. The CE literature includes almost all areas where consumption exists. Two general models are commonly used in the economy: Linear economy (LE) and CE. LE is based on consumption and does not consider the after-consumption phase [70]. In contrast to make-use-dispose systems in LE, CE focuses on resource efficiency, reduced waste, and emissions in a closed-loop supply chain [71]. CE considers the 3R principles: reduce, reuse, and recycle [72]. However, these CE principles range from 3R to 10R in the literature [73]: recover, recycle, repurpose, remanufacture, refurbish, repair, re-use, reduce, rethink, and refuse [73,74]. When the e-waste forecasting literature is evaluated from the CE perspective, estimating e-waste quantity is inevitably the focus of CE. Also, the use of critical materials and resources recovered from WEEE is essential. It can offer an interesting revenue stream for industrial companies in terms of developing a CE [75]. In the literature, there are studies on e-waste that take CE into consideration. For example, while Bressanelli et al. [76] analysed the e-waste literature based on the CE 4R-strategies (reduce, reuse, remanufacture, and recycle), Pan et al. [4] searched the CE 10R-strategies which are applied in the WEEE industry to address e-waste problems. Murthy and Ramakrishna [77] presented e-waste management practices and emphasized the necessity of achieving sustainability and CE through policy implementation, technical requirements, and social awareness. Moreover, WEEE legislation and extended producer responsibility issues are considered in some of the studies [78,79,80], and critical materials and WEEE plastics are also focused on [4,81,82,83,84]. The e-waste estimation literature has been developing since the late 1990s. In recent studies, sustainability and CE concepts have been frequently used. However, it should be noted that, although these terms were not technically included in the content of earlier e-waste estimation studies, e-waste estimation is directly or indirectly related to CE.
Another pillar of the literature analysis is the e-waste estimation and CE for Turkey. There are some legislations and applications on the governmental and sectoral sides. For example, the WEEE regulation, which was put into effect in 2012 in Turkey, was updated on 26 December 2022 based on the principles of CE and resource efficiency to protect the environment sustainably [85]. At the same time, The Restriction of the Use of Certain Hazardous Substances in Electrical and Electronic Equipment Regulations were put into effect in Turkey [86]. Annual waste declarations are reported to the Ministry of Environment, Urbanization, and Climate Change by waste producers. The waste of electrical and electronic goods that were declared in 2015–2020 are 32.03, 39.4, 37.3,37.5, 46.4, and 67.2 tonnes, respectively [87]. There is not a specific system that keeps WMP records in Turkey. However, according to the research report prepared by one of Turkey’s largest GSM operators, the problems in current practices can be listed as follows [88]: Informal activities, uncertainties regarding the determination of the product released and the quantity of e-waste produced, limited public capacity and lack of legislation, limited public awareness, substandard and inadequate processing facilities, uncertainties in life cycle applications, and inadequate collection infrastructure. In addition, in Turkey, products are currently transported for recycling without any classification. For this reason, classification-based collection centers are needed for CE and product type-based analysis [57]. Although, Turkey passed the E-waste Regulation in 2012, there are only a few e-waste estimation and forecasting-related academic studies for Turkey. The E-waste estimation studies for Turkey, as given in Table 1, show that white goods, computers, and mobile phone products are studied more than others. The methods used in these studies are different. One of the studies estimated WEEE for the whole country [31], while the other is at the city level [39]. The most comprehensive study in terms of product variety was presented by Öztürk [31]. In the first study for e-waste estimation of Turkey, e-waste amounts were estimated by using the C and U method [31].
Table 2 lists the e-waste estimation studies for Turkey. From this table, it can be concluded that the biggest shortcoming is the future projection. Kazancoglu et al. [57] forecasted the total amount of e-waste “collected” for 2019–2021. By looking at this limited literature, it can be seen that there is not a holistic study covering the estimation of e-waste amount and WMP in Turkey. Furthermore, the material and revenue potential of WMP for Turkey remains unknown. Also, most of the studies do not consider the CE.
There is a gap in estimation studies for Turkey, especially for the fastest growing ICT products, i.e., mobile phones. Therefore, it is essential to develop an approach for estimating the amount of WMP since they offer a high potential for material recovery relative to their weight and volume. Another potential contribution to the literature can be achieved through developing hybrid forecasting models. To the best of our knowledge, except for the studies of [37,62], a single model was taken into account when making future projections, regardless of the performance of the models. Input-output analysis-based methods such as SD, DD, and C and U use different inputs and data structures for estimation. For this reason, it may not be fair to prove and compare the performances of these methods. However, choosing the best forecasting method among the alternatives would be a suitable approach to obtain more accurate and reliable results.
This study is motivated by methodological open ways to improve the future literature, the need for making forecasts considering CE, and gaps in Turkey’s e-waste estimation literature and applications. This study is Turkey’s first WMP forecasting study using sales-based dynamic product lifespan. It handles and evaluates the WMPs from the CE perspective, such as sales, lifespan, material quantity, and revenue. Another contribution of the study is to provide comparable results, improvement points, and reusability for future studies. Additionally, this study contributes to the literature beyond that which is solely focused on Turkey, expanding and improving the forecasting range of studies due to considering and evaluating alternative forecasting methods. The study has the ability to increase the accuracy of predictions since it uses alternative forecasting models.

3. Materials and Methods

3.1. System Boundary

The geographical boundary of the study is Turkey. The e-waste estimation product is mobile phones, and the period is limited to 2001–2035. The data collected for the years 1994–2020 are used as sales data with the appropriate calculations (see Table A1) [89,90,91]. The amount of WMP is estimated by the Distribution Delay Method for 2001–2020. Distribution-based product lifespan profile is considered. The amount of WMP is forecasted for 2021–2035. The potential material quantity and their economic revenue are also forecasted for 2001–2035. The estimation is done until the year 2020, and forecasting started from the year of 2021. Please note that the estimation period ends in the year 2020 because of data quality concerns. All of the necessary data for calculation (such as production and electronic devices in accompanied baggage) have not been published yet, and regulations were changed for the data recording systematics due to the COVID-19 pandemic [92]. The system boundary of the proposed model for WMP generation and forecasting in Turkey can be seen in Figure 2.
In this study, the time-dependent generation of WMP is estimated with a hybrid forecasting model based on sales data and dynamic product lifespan. The DD method estimates the amount of generated WMP until a specific year. Subsequently, the amount of generated WMP is calculated by using different forecasting models. Then, future projection is done using the selected forecasting method. In the last part of the study, the potential material quantities, and economic values of WMP are obtained from the estimation and forecasting results. These materials and revenue potentials have been discussed regarding the CE. The algorithm of the proposed model in the study is as given in Table 3.

3.2. Estimation of E-Waste Generation

This section presents the mathematical formulation of the e-waste generation model. The model is based on historical data of cumulative sales (put on the market) and lifespan empirical distribution. The distribution function and corresponding parameters of mobile phone lifespan are adopted based on the work of Forti et al. [93].
The WMP quantities are estimated by the DD Method. This method considers the relative obsolescence rates in the year of assessment. The amount of e-waste for a certain year “t” is the sum of the percentage of obsolete e-waste sold in year n, starting from n0, i.e., when the product enters the market. This method requires historical sales, put-on-market (POM) data, and lifespan distribution. The total amount of generated e-waste in a year O t is calculated as given in Equation (1):
O t = n = n 0 t S n f n , t
where S n is sales/POM quantity in year n, and f n , t is obsolescence probability for a product in year t, which is sold in year n. The output of this equation is the cumulative obsolete e-waste quantities for period t.
According to Forti et al. [93], if a country does not have available POM data, this data can be calculated by using imports (It), domestic production (DPt), and export (Et) data, as shown in Equation (2):
S t = I t + D P t E t
In this study, the necessity of making a specific calculation for mobile phones has emerged. Therefore, while calculating the POM data for each year, the mobile phones brought by travellers were also considered. These devices must be registered as mobile phones (electronic devices in accompanied baggage) (ABt) brought by travellers from abroad to be used without any problems. This registration must be made via the Turkey e-Government Gateway system within 120 days (extended to 365 days due to COVID-19) from the date of entry of the passenger to Turkey. Therefore, Equation (2) is rewritten as given in Equation (3):
S t = I t + D P t E t + A B t
Another assumption is that the devices brought by the travellers are newly purchased. Another input of the DD method is lifespan. Governments generally do not officially define lifespan data; however, some information can be provided from surveys, recycling centres, the literature, etc. The discarded-based lifespan profile for a product is modelled in the literature using different probability functions such as Normal, Weibull, Cauchy, Logistic, etc. [37,94,95]. The Weibull distribution function is considered the most suitable for describing discard behaviour for EEE in most studies [23,29,41,50]. The distribution of product lifespan for stable products such as mobile phones and portable computers is defined in Equation (4):
f n , t = α β α   n t α 1 e n t / β α
E = β Γ 1 + 1 / α
where α is the shape parameter that describes the gradual aging of the product and β is the scale parameter that describes the characteristic life of the product. E is the mean time which describes lifespan and Γ is the Gamma function in Equation (5). Since there are not validated lifespan data for Turkey, we use a proxy for the Weibull lifetime distribution parameter values for UNU-Key:0306. Mobile phones in this study are set to α = 1.52 and β = 5.62, as they are defined for non-European Union countries [93], and lifespan E is 5.06 years. The graphs of the probability density function (PDF) and cumulative distribution function (CDF) of the Weibull distribution associated with these values are shown in Figure 3a,b, respectively.
According to the red line (or the dashed-line) shown in CDF curves in Figure 3b, at least half of the products put on the market, cumulatively, will be e-waste in more than six years. For this reason, while POM data have been available since 1994, the results have been reported for after 2000.

3.3. Forecasting of E-Waste Generation

In this study, the forecasting strategy is structured on choosing the best model among different models. Time series analysis is the most-used quantitative method for forecasting. Various time series methods (e.g., exponential smoothing, growth, and autoregressive models) are used to forecast WMP quantity in this study. Equations are adopted for the obsolete product (e-waste).

3.3.1. Exponential Smoothing Methods

Exponential smoothing methods were originally classified by Pegels [96] taxonomy, which was later extended by Gardner and Everette [97] and modified by Hyndman et al. [98] and Taylor [99,100]. Exponential smoothing methods have been used to estimate different e-waste types [37,53,62]. In this study, the popular exponential smoothing methods such as the Simple Exponential Smoothing (SES) method and the Holt’s linear method are used for the first time to forecast WMP quantity.
The SES is one of the well-known forecasting methods and has high forecasting capability, particularly for stationary time series. The SES uses a weighted moving average with exponentially decreasing weights [101]. This method uses two simple equations, given in Equations (6) and (7), for level/smoothing and forecasting, respectively:
l t = α O t + 1 α l t 1
O ^ t + h | t = l t
where O t is the observed value of the time series in time t , l t represents the smoothed level, α is the smoothing factor, h is the forecast step, and O ^ t + h | t is the forecasted value for the period ( t + h ) .
Holt’s linear method is an extended version of the SES method in terms of the presence of a trend component. In other words, this method takes both the trend and fluctuation of time series into account. Therefore, this method uses the level, trend, and forecasting equations as given in Equations (8)–(10), respectively:
l t = α O t + 1 α l t 1 + b t 1
b t = β * l t l t 1 + 1 β * b t 1
O ^ t + h | t = l t + b t h
where β *  is trend smoothing factor and b t presents the growth. In addition, other variables are the same as those defined in the SES.
It should be noted that the observed time series, which indicates estimated WMP quantity for each year, are given by O 1 , O 2 , , O n . Moreover, a forecast of O ^ t + h is based on all data up to time t, denoted by O ^ t + h | t .

3.3.2. Growth Models

Growth models, known as trend models, are widely used for technological diffusion and e-waste estimation. In this study, besides the aforementioned exponential smoothing methods, three non-linear growth models, including Logistic, Gompertz, and Logarithmic models are used to forecast WMP quantity.
The Logistic growth model is one of the widely used growth curve models. This model attempts to obtain damped trend information for S-shaped time series. Generally, this model uses an exponential function in order to model a population. When it comes close to a specific value, the growth is realistically dampened. This model is a suitable forecasting tool for time series with constrained growth. The logistic growth model is given by Equation (11):
O ^ t = a 1 + b e k t ,   k > 0
where O ^ t represents the e-waste quantity in year t, a is the carrying capacity (WMPs) growth rate, and b is the difference between carrying capacity and initial WMPs.
The Gompertz model is another logistic growth model used to describe growth curves in a wide variety of disciplines such as biology, medical science, engineering, economics, and more. This model differs from the logistic model in that it is asymmetric. The Gompertz model attempts to closely match asymptotic and S-shaped data series to a sigmoid curve. This model can be expressed as in Equation (12):
O ^ t = m e a e b t
where O ^ t represents the e-waste quantity in year t, m is an asymptote, and two strictly non-negative coefficients relating to the time and place that diffusion occurs are called a and b.
The Logarithmic growth model is used to model and forecast univariate time series that exhibit very rapid growth initially, followed by slower growth. This growth model governed by Equation (13), which is also utilized to forecast WMP:
O ^ t = a + b ln t    
where O ^ t represents the e-waste quantity in year t, and parameters a and b control the growth rate.

3.3.3. Autoregressive Models

Autoregressive models are frequently used for modelling time series due to their ability to describe certain time-varying processes in nature. In such models, the future output depends upon the previous output(s). In this study, the Bass and Autoregressive Integrated Moving Average (ARIMA) models are also used for WMP quantification.
The Bass model [102] broadly implies that the quantity of prior purchases influences when a consumer makes their first purchase. The model’s behavioural explanation is offered in terms of innovative and imitation behaviour. The Bass model is used to investigate whether this assumption is also valid in WMP generation. The Bass model is given as follows:
O ^ t = p + q Y t m m Y t
Y t = i = 1 t 1 O ^ i
where O ^ t and Y t represent the incremental WMPs and cumulative adoptions, respectively. p and q denote the coefficients of innovation and imitation, respectively, and the maximum penetration level is donated by m.
ARIMA models, known as the Box and Jenkins models, are a combination of autoregressive and moving average models [103]. Non-seasonal ARIMA models are denoted by ARIMA (p, d, q). p indicates the autoregressive model’s degree, and q is the moving average’s order with the degree of difference d. An integrated zero-degree ARMA (p, q) model can be given in Equation (16):
O ^ t = c + i = 1 p Φ i O ^ t 1 + ε t + j = 1 q θ j ε t j
where Φ and θ are coefficients of AR(p) and MA(q) models, respectively;  ε t is the error term.

3.4. Forecasting Evaluation and Method Selection

There is not a standard method to assess how accurate forecasting and estimates are. Therefore, experts often have different views on which measure should be used [104]. In order to assess the accuracy of the employed models, three measures are utilized generally: Mean Absolute Percentage Error (MAPE), Root Mean Square Error (RMSE), and Sum of Square Error (SSE). MAPE measures the accuracy as a percentage, which is given in Equation (17):
M A P E = 1 n t = 1 n O t O ^ t O t × 100
where O ^ t and O t are the forecasted value by the model and the observed value by the DD method in the estimation period, respectively.
RMSE (Equation (18)) measures the standard deviation of the forecasting errors, while SSE (Equation (19)) measures the sum of the squared differences between the observed and modelled data, respectively. SSE is also known as the residual sum of squares.
R M S E = 1 n t = 1 n O t O ^ t 2
S S E = t = 1 n ( O t O ^ t ) 2
The steps related to this process are depicted in the Table 4.

3.5. Material Analysis

Stahel [5] said of the CE that “It replaces production with sufficiency: reuse what you can, recycle what cannot be reused, repair what is broken, remanufacture what cannot be repaired”. Due to e-waste being the fastest-growing waste category worldwide [12], it has considerable potential to contribute to the CE. The CE allows for a second chance before e-waste is disposed in landfills. For this reason, the studies that are carried out within the scope of this study should not be left in the estimation stage but should also be examined and discussed from the CE perspective.
According to the Global E-waste Monitor report in 2017, a mobile phone with an average weight of 90 g contains precious metals and polymers worth €2 [12]. Thus, the value of the raw materials is low in comparison to the cost of new or second-hand mobile phones. A total of 435 kt of WMP were produced globally in 2016, which equates to a raw material value of 9.4 billion € [12]. The potential value may be significantly larger if all phones were to have a longer lifespan and could enter a second-hand market [12].
This study makes an additional contribution to the field by calculating the quantity of materials and the potential economic revenue to be created by the recovery of mobile phones, considering the amount of materials that they contain. The inputs of the material analysis are the results of the WMPs estimation and forecasting phases. Moreover, Table 5 provides the algorithm of the material analysis.
The number of studies on mobile phone material analysis in the literature is increasing due to the scarcity of precious metals used in mobile phone manufacturing in the world and the destructive effects of harmful metals on the environment and human health. Cucchiella et al. [105] conducted material return analysis for 14 different technological products and examined the change in this return for different scenarios. Gupta et al. [106] analysed the amount of elements contained in cellular and smartphones. The only study related to the potential revenue of WMPs for Turkey was conducted by Sahan et al. [107], in which they analysed the amount of material contained in 10 mobile phones and calculated their potential economic values based on the amount of WMPs estimated in the study by Öztürk [31] for 2012.
The average value of an ounce of gold is $1160 in 2015 and $1800 at the end of 2022 [108]. The uncertainty and instability of the markets are increasing due to many different factors, such as the COVID-19 global pandemic, the spread of CE-oriented production and service processes, the climate and energy crisis, and political approaches. As a result, the prices of materials also show a rapid change. In Table 6, as of April 2022, the potential return of each material for a mobile phone has been calculated based on the availability of the 10 materials with the highest yield in the unit mobile phone and the market prices.
Although gold constitutes 0.14% of the total mass of these 10 elements, it, alone, provides 52% of the total economic return. While copper constitutes 52% of the mass, its contribution as revenue is 3.2% among all materials. The total revenue potential of these metals per unit mobile phone is approximately 4.5 US$.

4. Computational Results and Discussions

4.1. Estimation of E-Waste Generation

By using sales data and lifespan distribution in Equation (1), the estimated amounts of WMPs by the DD method for 2001–2020 are given in Figure 4. The Excel VBA is used to obtain the results for the DD method. While there were 18.3 million mobile subscribers in 2001, 62.8 million in 2009 (the year of the transition to 3G), and 82.1 million in 2020, the generated WMP is approximately 1.5 million for 2001, exceeding 9 million in 2020. The calculations show that, while the number of mobile phone subscribers increased by 30% in 2020 compared to 2009, the amount of WMP generated increased by one and a half times. In addition, considering that the number of mobile phone subscribers is much higher than the number of devices due to dual sim mobile phones, this rate is much higher than 50%. It is known that a small amount of e-waste enters the recovery and recycling process in Turkey. Even when only the WMP product is considered, it is revealed that millions of WMP are waiting to be brought into the CE in Turkey. Despite their physical sizes, customers pay high prices for IT-based products. Therefore, customers are not willing to deliver the WMPs to the recovering and recycling systems. However, the potential of WMPs is equivalent to that of a mineral deposit discovery if some incentives and practices are implemented.

4.2. Method Selection and Forecasting

The seven forecasting models mentioned before, i.e., Simple Exponential Smoothing, Holt’s, Logistic, Gompertz, Logarithmic, Bass, and ARIMA, are used to model the WMP quantities (outputs of Section 4.1) generated in the years 2001–2020. In the modelling process, data were fitted to each model curve considering model parameter boundaries according to the Sum of Square Error (SSE) criteria. In other words, the parameter values of seven models are optimized based on SSE. The calculations have been performed on the MATLAB (R2018a) platform on a computer with an Intel(R) Core (TM) i7-8700 CPU 3.20 GHz processor, 16 GB RAM, and 64-bit Windows 10 operating system.
In order to increase the accuracy of the forecasting, the method with the best performance is chosen as the forecasting method. The MAPE, RMSE, and SSE values of seven methods for the years 2001–2020 are listed in Table 7. As per the values in this table, Holt’s method obtains the best results for all error indicators, followed by the Logistic, Gompertz, Bass, and the other methods. Therefore, Holt’s method is selected as the forecasting method for the projection.
The estimated WMP quantities obtained by DD for 2001–2020 are reused as inputs of Holt’s method. Thereafter, the forecasting process is performed by this method up until 2035. The estimated and forecasted WMPs quantities for 2001–2035 are illustrated in Figure 5. The amount of WMP tends to increase in the following years. Furthermore, it is forecasted that the generated WMP quantity will exceed 10 million in 2025 and approach 12 million in 2035.
The data structure and characteristics of each region differ from one another. For this reason, many factors, such as the rural-urban population, GDP, education level, region, product, product lifespan, and interactions between all these factors affect the amount of generated e-waste. The Holt’s method emulated the studied system in this study under current conditions within the limits considered. However, this study provides flexibility for different situations, as it evaluates alternative estimation methods. It should be noted that other methods may also provide more effective results for different products or countries.

4.3. Material Analysis

In this subsection, the total amount of precious metals (gold, silver, platinum, and palladium) and the other six materials contained in WMPs, and their potential economic values, are calculated. Figure 6 shows the total values of the estimated and forecasted waste material amounts for 2001–2035. From this figure, it can be observed that the total amount of waste material currently exceeds 250 tonnes and will reach approximately 320 tonnes in 2035. In addition, Figure 7 indicates that 372 kg of gold can be recovered from WMPs in 2022.
The revenue potential depends on the amount of WMPs. Figure 8 depicts the revenue potentials for waste materials for the years between 2001 and 2035. As seen from this figure, the potential economic value is 45 million US$ in 2022. Moreover, it can be clearly stated that the revenue potential is worth millions of dollars per year.
The precious materials constitute the most remarkable portion of the potential revenue, as shown in Figure 9a. Furthermore, it can be seen from Figure 9b that gold and palladium have a considerable economic potential. However, it should be considered that a material with a lower economic potential than others can become the most valuable material when this material cannot be supplied. On the principle that “many a mickle makes a muckle,” WMPs can significantly benefit CE with the highest possible recovery of all materials.

4.4. Sensitivity Analysis

Since e-waste generation, estimation, and management entail many uncertainties and assumptions, it is difficult to give an exact value regarding the amount of e-waste generated. For this reason, there will inevitably be uncertainty when making any calculations in, or conducting modelling for, e-waste estimation. Furthermore, the uncertainties increase exponentially due to the deviation in the observed data or the failure to take into consideration any factors and the inability to adequately define the factors taken and the relationships between them [109]. In addition, the success of many models depends on the values of the parameters and initial conditions [37]. Input-output analysis-based e-waste estimation methods that use product lifespan are also based on assumptions or findings obtained from a limited segment of the society/products. Therefore, it is not easy to estimate because the relevant behaviours, such as generating e-waste and being willing to give the product to the e-waste recycling system, depend on many factors. However, it is also necessary to make general approaches to increase the robustness of the method considered within certain limits.
Within the scope of this study, sensitivity analyses were performed for three main variables affecting outputs: (1) lifespan, (2) material quantities used in mobile phones, and (3) material prices. The rate at which technological change, innovations, and high-capability new products enter the market is increasing. From the other point of view, the introduction of the concept of sustainability into our lives, the problems that arise in the world economy, inflation and high inflation expectations, and the tendency of consumers to abandon their consumption spree behaviours due to the decrease in purchasing power or the threat of falling in purchasing, are among the uncertainties that can affect the formation of WMPs. For these reasons, for WMPs and other outputs, lifespan distribution is used as ±1 year. According to the Weibull distribution used in the Based scenario, the average product lifespan is 5.04 years, and the material quantities and prices are available in Table 6. Also, the effect of material composition and prices on the generated waste material quantity and revenue are analysed by changing the existing values by 1%.
The change in product lifespan affects the amount of WMPs, and it also affects the total amount of waste material and revenue indirectly. The expected product life, which is 5.06 years and calculated according to Equation (5), has been reduced and increased to 4.06 and 6.06, considering β = 4.50 and β= 6.72, respectively, while keeping the α parameter constant. The PDF functions were recalculated based on these parameter values, and the re-application of the DD method based on these function values to the sales data set, and the generated WMP in the years 2001–2020 is given in Figure 10. While the most distant point of the generated WMP was in 2010, the closest results were obtained in 2020. This convergence is due to the stagnation of mobile phone sales in recent years and the fact that the rate of becoming obsolete for CDF has reached 50% in the last six–seven years.
The cumulative effect of the one-year increase in lifespan in 2020 is that the amount of WMP decreased by 2.12%. Similarly, the one-year decrease in the useful life led to an increase of 0.8% in WMP (Table 8). Therefore, using the products for one more year means that 200,000 fewer WMPs will be generated for 2020, more than five tonnes of waste material will not be generated, and there will be no need to procure and use these materials. As a result, material savings of approximately 0.75 million USD will be achieved.
The effect of the change in product lifespan on the amount of generated WMP in upcoming years was also analysed. Holt’s method, determined as the forecasting method with the minimum error for the base scenario, was not used directly for other scenarios. Instead, the amounts of WMP in Figure 10 for 2001–2020 were calculated again to minimize the error with the seven estimation models given in Section 3.4. Among the methods, Holt’s method had the minimum error, and the performance values of the methods are shown in Table A2 and Table A3. The WMP amounts forecasted by Holt’s method for the years 2021–2035 are given in Figure 11. In addition, the of waste material quantities and revenues for these scenarios are shown in detail (see Figure A1, Figure A2, Figure A3, Figure A4, Figure A5, Figure A6, Figure A7 and Figure A8). An interesting conclusion can be drawn from Figure 11, that the amounts of WMP converge with each other for three scenarios in 2027. This convergence is because the mobile subscriber penetration rate reached a high saturation of 98.2% in 2020 [110]. Therefore, it is not surprising that the scenarios converge. The increase in the amount of WMP that will occur in the short and medium term will continue over the next 15 years; however, there will be no jump.
The effect of the amount of material in the unit mobile phone and the material prices on the outputs considered, the second and third variables in the sensitivity analysis, are given in Tables 10 and 11, respectively. As seen in Table 9, if there is a 1% change in the amount of gold used in a mobile phone, the effect of this on the amount of waste gold generated in 2020 will be 3.53 kg. When this change is considered for each material, when a 1% change occurs, the total effect for 2020 causes a difference of about 2.5 tonnes. Likewise, the impact of a 1% change in the price of each material exceeds 0.4 million USD only for 2020 (Table 10). There will be changes in material quantity and prices. However, the primary purpose of this analysis is to reveal what even a 1% change can cause in terms of gain and loss in production, recycling, and recovery. These amounts are calculated only for WMPs formed in Turkey in 2020 in this study, and these values can be considered a significant loss/gain. Suppose this calculation were made for all WEEE types in Turkey and around the world besides mobile phones. In that case, the total effects of a 1% change in the amount of material used/recovered would be much higher.

4.5. Discussion of the Results

This subsection introduces a summary of the computational results and a discussion of additional topics.
This study proposes a general e-waste forecasting model and focuses on a WMP application for the case of Turkey. The proposed model uses a two-stage e-waste quantification process. In the first stage, the generated WMPs are estimated for 2001–2020 by the DD method. The estimated values of WMPs have been increasing since 2001 and the generated WMP reached over 9 million in 2020. It is worth mentioning here that one of the biggest challenges is the lack of data in the e-waste estimation literature. Actual WMP data are not recorded for Turkey, as mentioned before. Therefore, similar to most of the studies in the literature, this stage is used to overcome this challenge. In other words, a methodology must be adopted to transition from sales to e-waste. In the second stage, WMPs are forecasted for 2021–2035. In order to increase the forecasting accuracy, a rigorous comparative modelling process is performed with different forecasting methods using different performance metrics, and then Holt’s method, having superior performance, is selected as the forecasting method for future projections. The forecasting results demonstrate that WMPs increase from 9 million in 2021 to 11.5 million in 2035. The population of Turkey reached 84.7 million in 2022 and the forecasted quantity of WMPs is 9.5 million units. Considering the rate of technology change, it is not surprising that 11 out of every 100 people have their phones become e-waste. It should also be noted that, although the increase in WMPs appears to be linear in Figure 5, it is non-linear, as the growth rate decreases with time. In other words, the growth rate for the forecasting period exhibits exponential decay behaviour from 1.016 to 1.013. Moreover, the mobile penetration rate and population growth rate exhibit similar behaviour for Turkey.
Furthermore, the potential WMP material quantities and revenues are calculated for 2001–2035. The results reveal that hundreds of waste materials are produced each year. It is forecasted that 261 tonnes of waste material will be generated in 2023. The economic equivalent of this amount is 43.8 million dollars with the present value of money. In terms of the environment and human health, the quantity of hazardous materials is also increasing in parallel with this trend. A sensitivity analysis is also performed for the main inputs of the problem: changes in lifespan, material price, and material quantities.
There are also additional discussion questions which were answered in the study: Is there any difference between cellular phones and smartphones when calculating the quantities of waste materials? How does the time value of money affect material revenues?
Unfortunately, there is no record in Turkey of WMPs to know how much of the waste material arises from cellular and how much of it arises from smartphones. However, it is possible to make an inference based on the number of mobile subscribers. Considering the years 2001–2020, the number of 2G and over-2G (3G and 4.5G) mobile subscribers belonging to this period can be seen in Figure 12a. In can be observed from this figure that the number of subscribers has been increasing. Generally, cellular phones are 2G-compatible, while smartphones are 3G- and 4.5G-compatible, mobile devices. 3G came into use in Turkey in the second half of 2009. In the light of this technological change, there has been a significant increase in smartphone users. Regarding this, the subscriber types have changed proportionally, as shown in Figure 12b.
Assuming that the amount of WMPs generated each year is the same as the type of mobile device used by the subscribers, it is possible to calculate how much of the waste material arises from cellular phones and how much from smartphones. This assumption has been made because mobile phone sales and the collected WMPs are not classified. However, it should be considered that the material densities of cellular phones and smartphones are different. Singh et al. [111] and Singh et al. [112] made a material analysis of 10 cellular phones and 10 smartphones in their studies. The coefficients of the average amount of material contained in these devices are calculated in Table A4. For example, the amount of Cu and Co in a cellular phone is less than a smartphone; however, the amount of Pb contained in smartphones is about 4 times the amount in cellular phones, and the amount of Ni is 2.2 times. Necessary calculations are made based on these material rates and mobile subscriber type rates for each year. The type-based results are listed in Table A5. For example, the rate of waste cellular phones in 2013 was 29.28% of the total WMPs generated. However, 28.64% of the waste material arises from cellular phones. This difference may be because of the different material densities of cellular phones and smartphones. The generated waste material amount of Zn for smartphones is three times that of cellular phones. However, a smartphone contains 1.2 times the Zn that a cellular phone does. The reason for this difference is that the number of 3G and 4.5G subscribers were 70% of the total subscribers in 2013.
It is worth mentioning that material analysis has some constraints and limitations. The material contents are generally not reported by mobile phone manufacturers. Therefore, a chemical analysis is required to determine the material concentrations. Examining and analysing the time-dependent variation in material concentrations is a challenging task since brands, models, production dates, analytical methods for chemical characterisation, and the instruments employed may lead to variations in analysing the results [107].
Figure 8 illustrates the total revenue potential for waste materials in US$ for each year, considering the constant value of money in 2022. However, another topic of discussion is how the material revenue will change over time. For this discussion, the past values of material revenue potential are calculated using the inflation values realized in dollars for 2001–2021. In addition, the future values are calculated with the time value of money approach for scenarios where the interest rate is 1% and 5%. Figure 13 provides the values of material revenue potential for 2001–2035. It can be observed that the future values of material potential from WMPs equal 59 and 98 million US$ for interest rates of 1% and 5%, respectively. It can be concluded that the revenue from WMP material can provide a benefit to Turkey’s economy.
The e-waste literature suffers from the lack of statistical data and the obtained results are not comparable due to differences in approaches such as lifespan and driven methods in the studies; this is similarly emphasised by Polak and Drapalova [26]. Table 11 depicts a general framework for WMPs for both Turkey and other countries based on the literature. The total amount of WMPs per capita for the year 2020, the last recorded data year in this study, has been compiled from the results in the literature.
Finally, we compared our results with the amount of generated WMP by Öztürk [31]. They calculated 22.57 million units in 2012 and the current study estimated 7.6 million units for the same year. As aforementioned, it is possible for results to differ due to the estimation methods and product lifespan. In Öztürk [31]‘s study, estimation is realized by the C and U method using a fixed product lifespan and the amount of products in use. The product life was assumed to be three years. If the product life was set to 5.06 years, as in this study, the amount of estimated WMPs would have been 13.46 million units instead of 22.57 million units for 2012. It can be clearly stated that there is no mechanism to evaluate the accuracy of the results. This issue points to the direction of research in the e-waste forecasting literature that needs to be designed and improved.

5. Conclusions

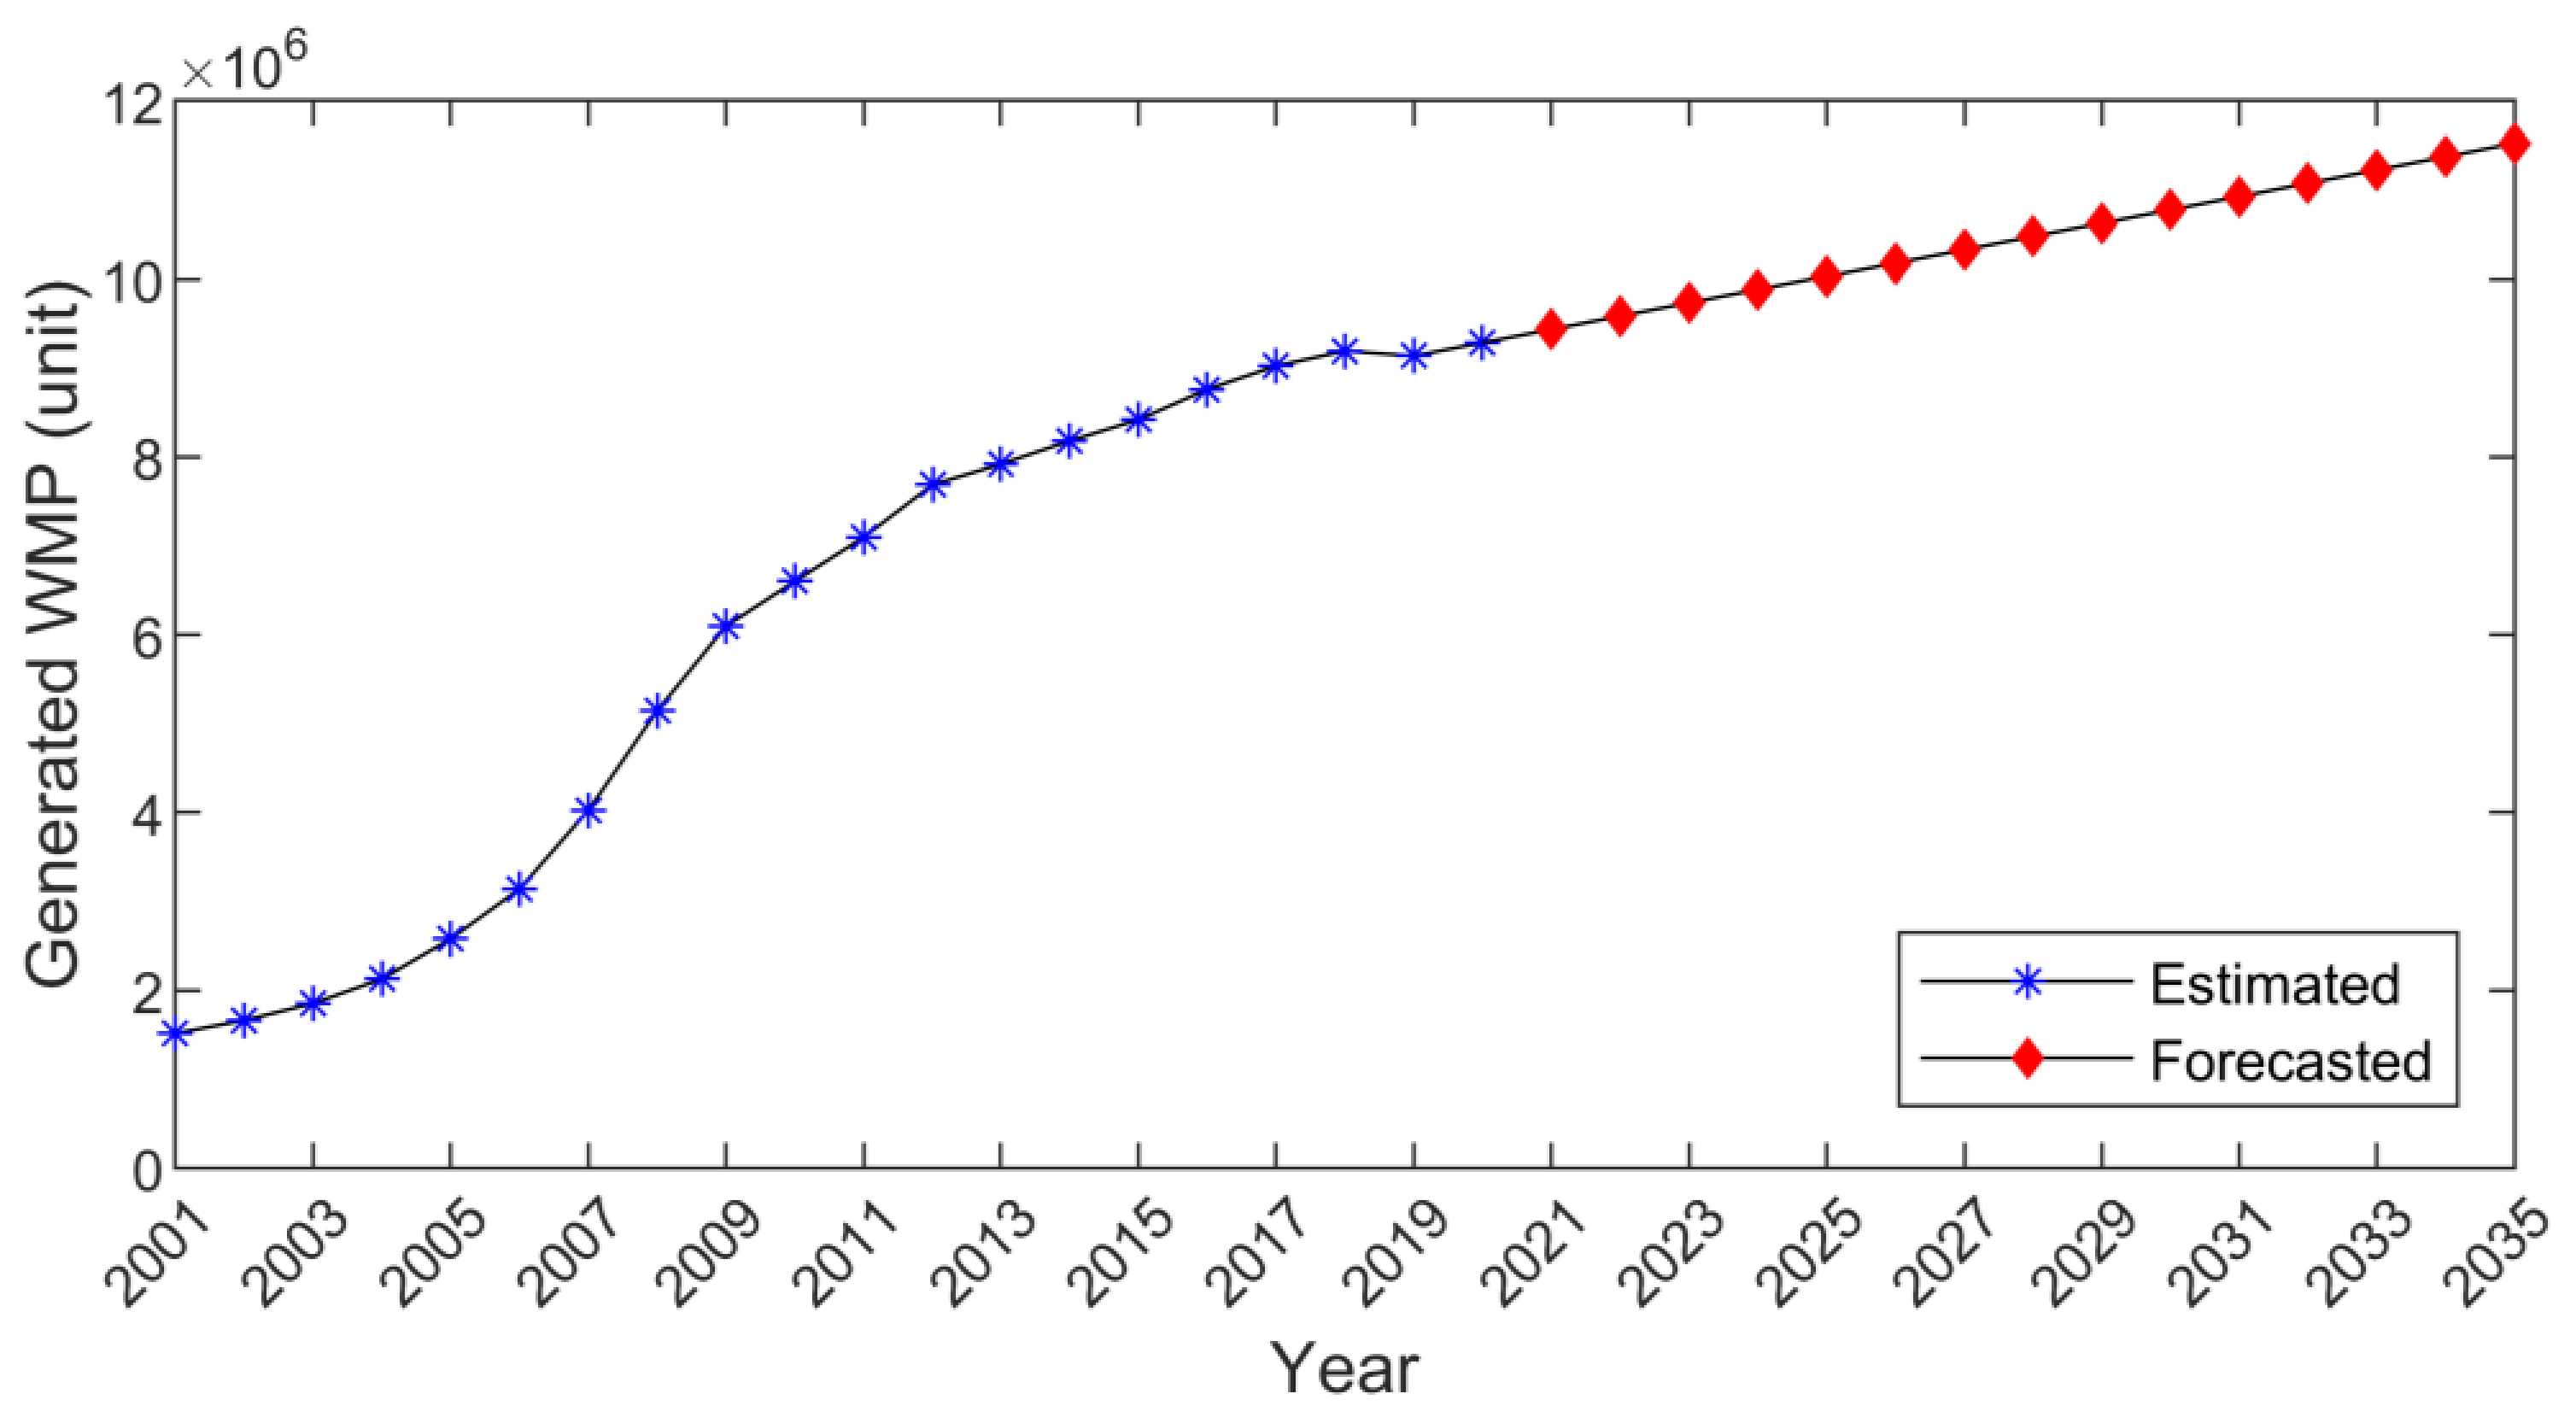
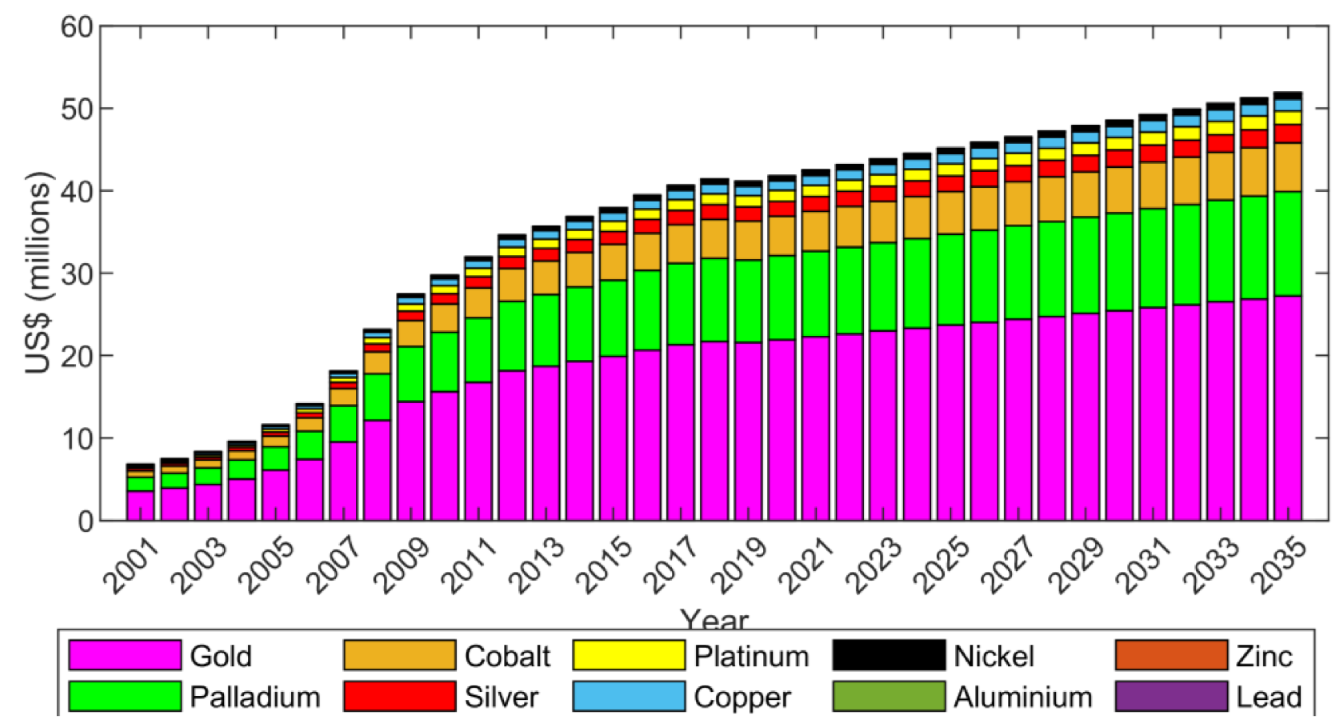
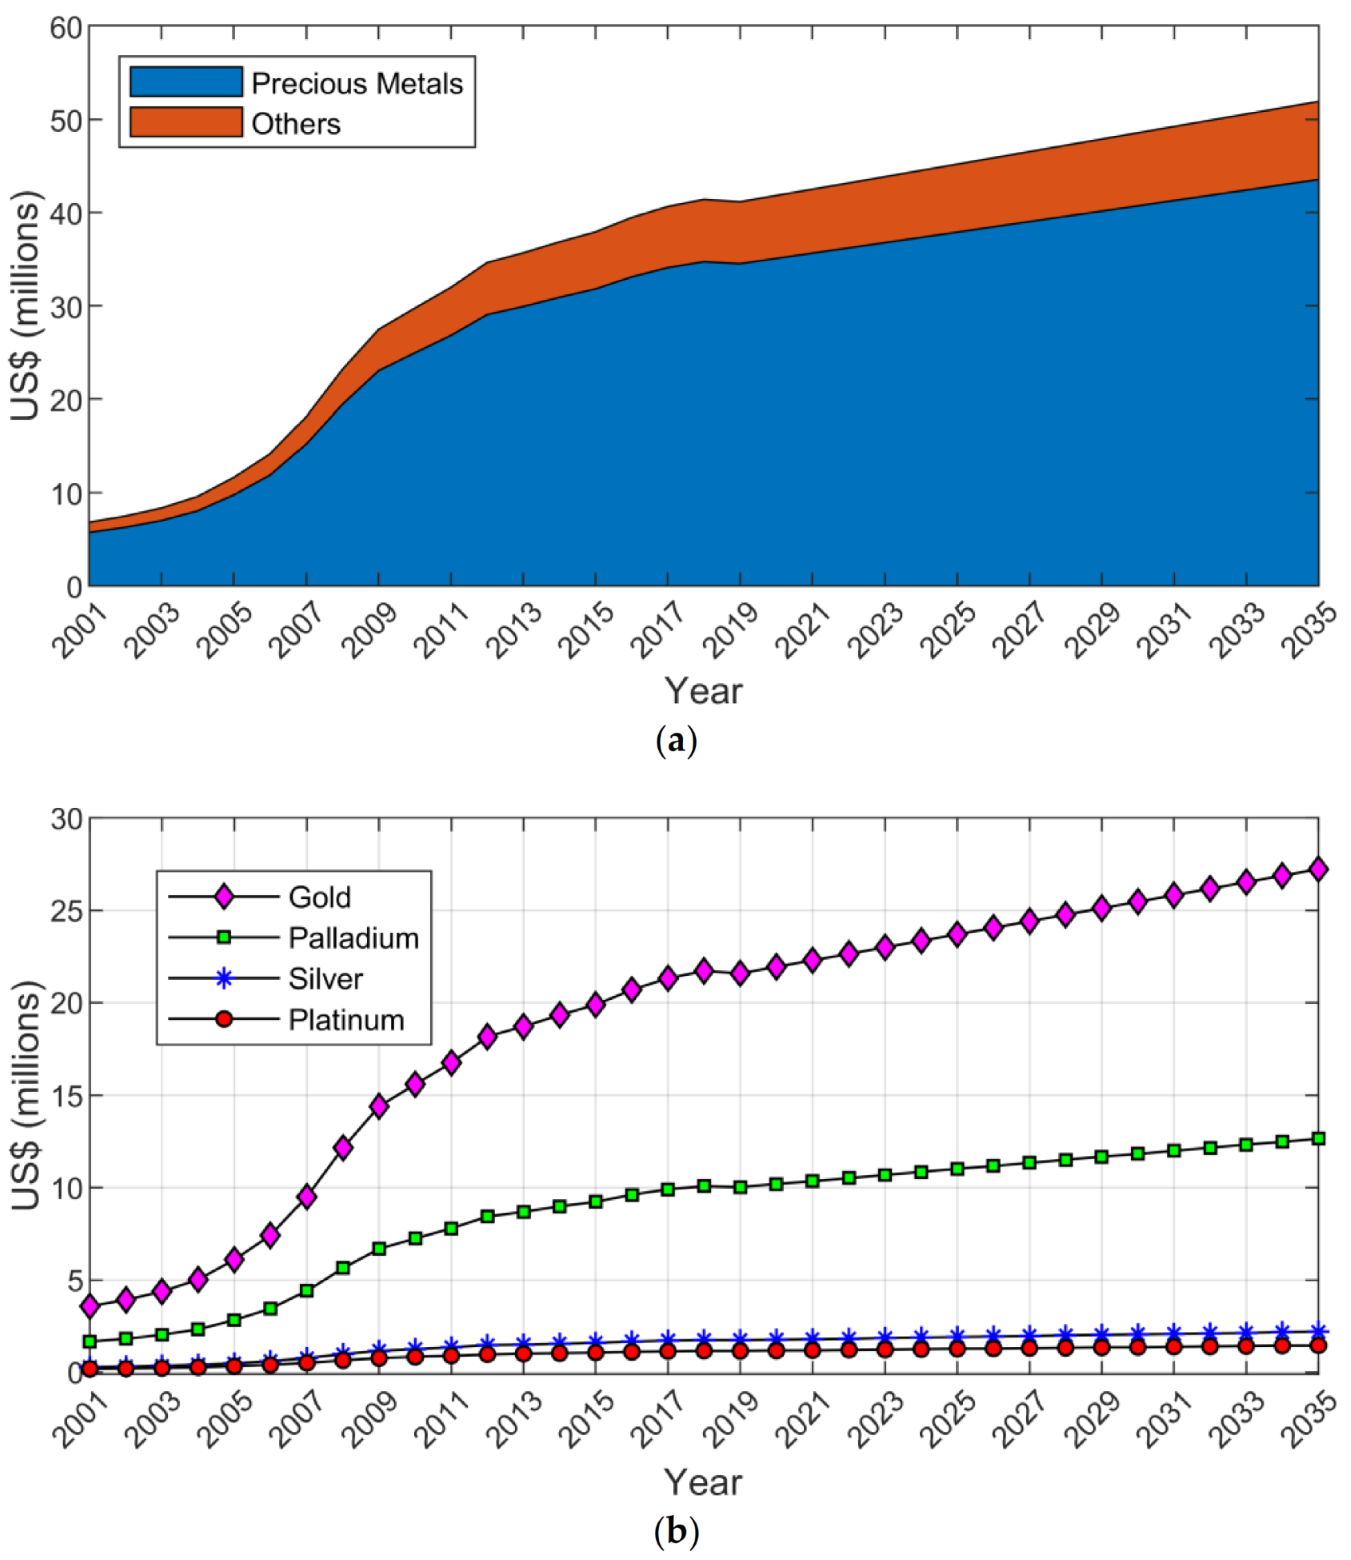
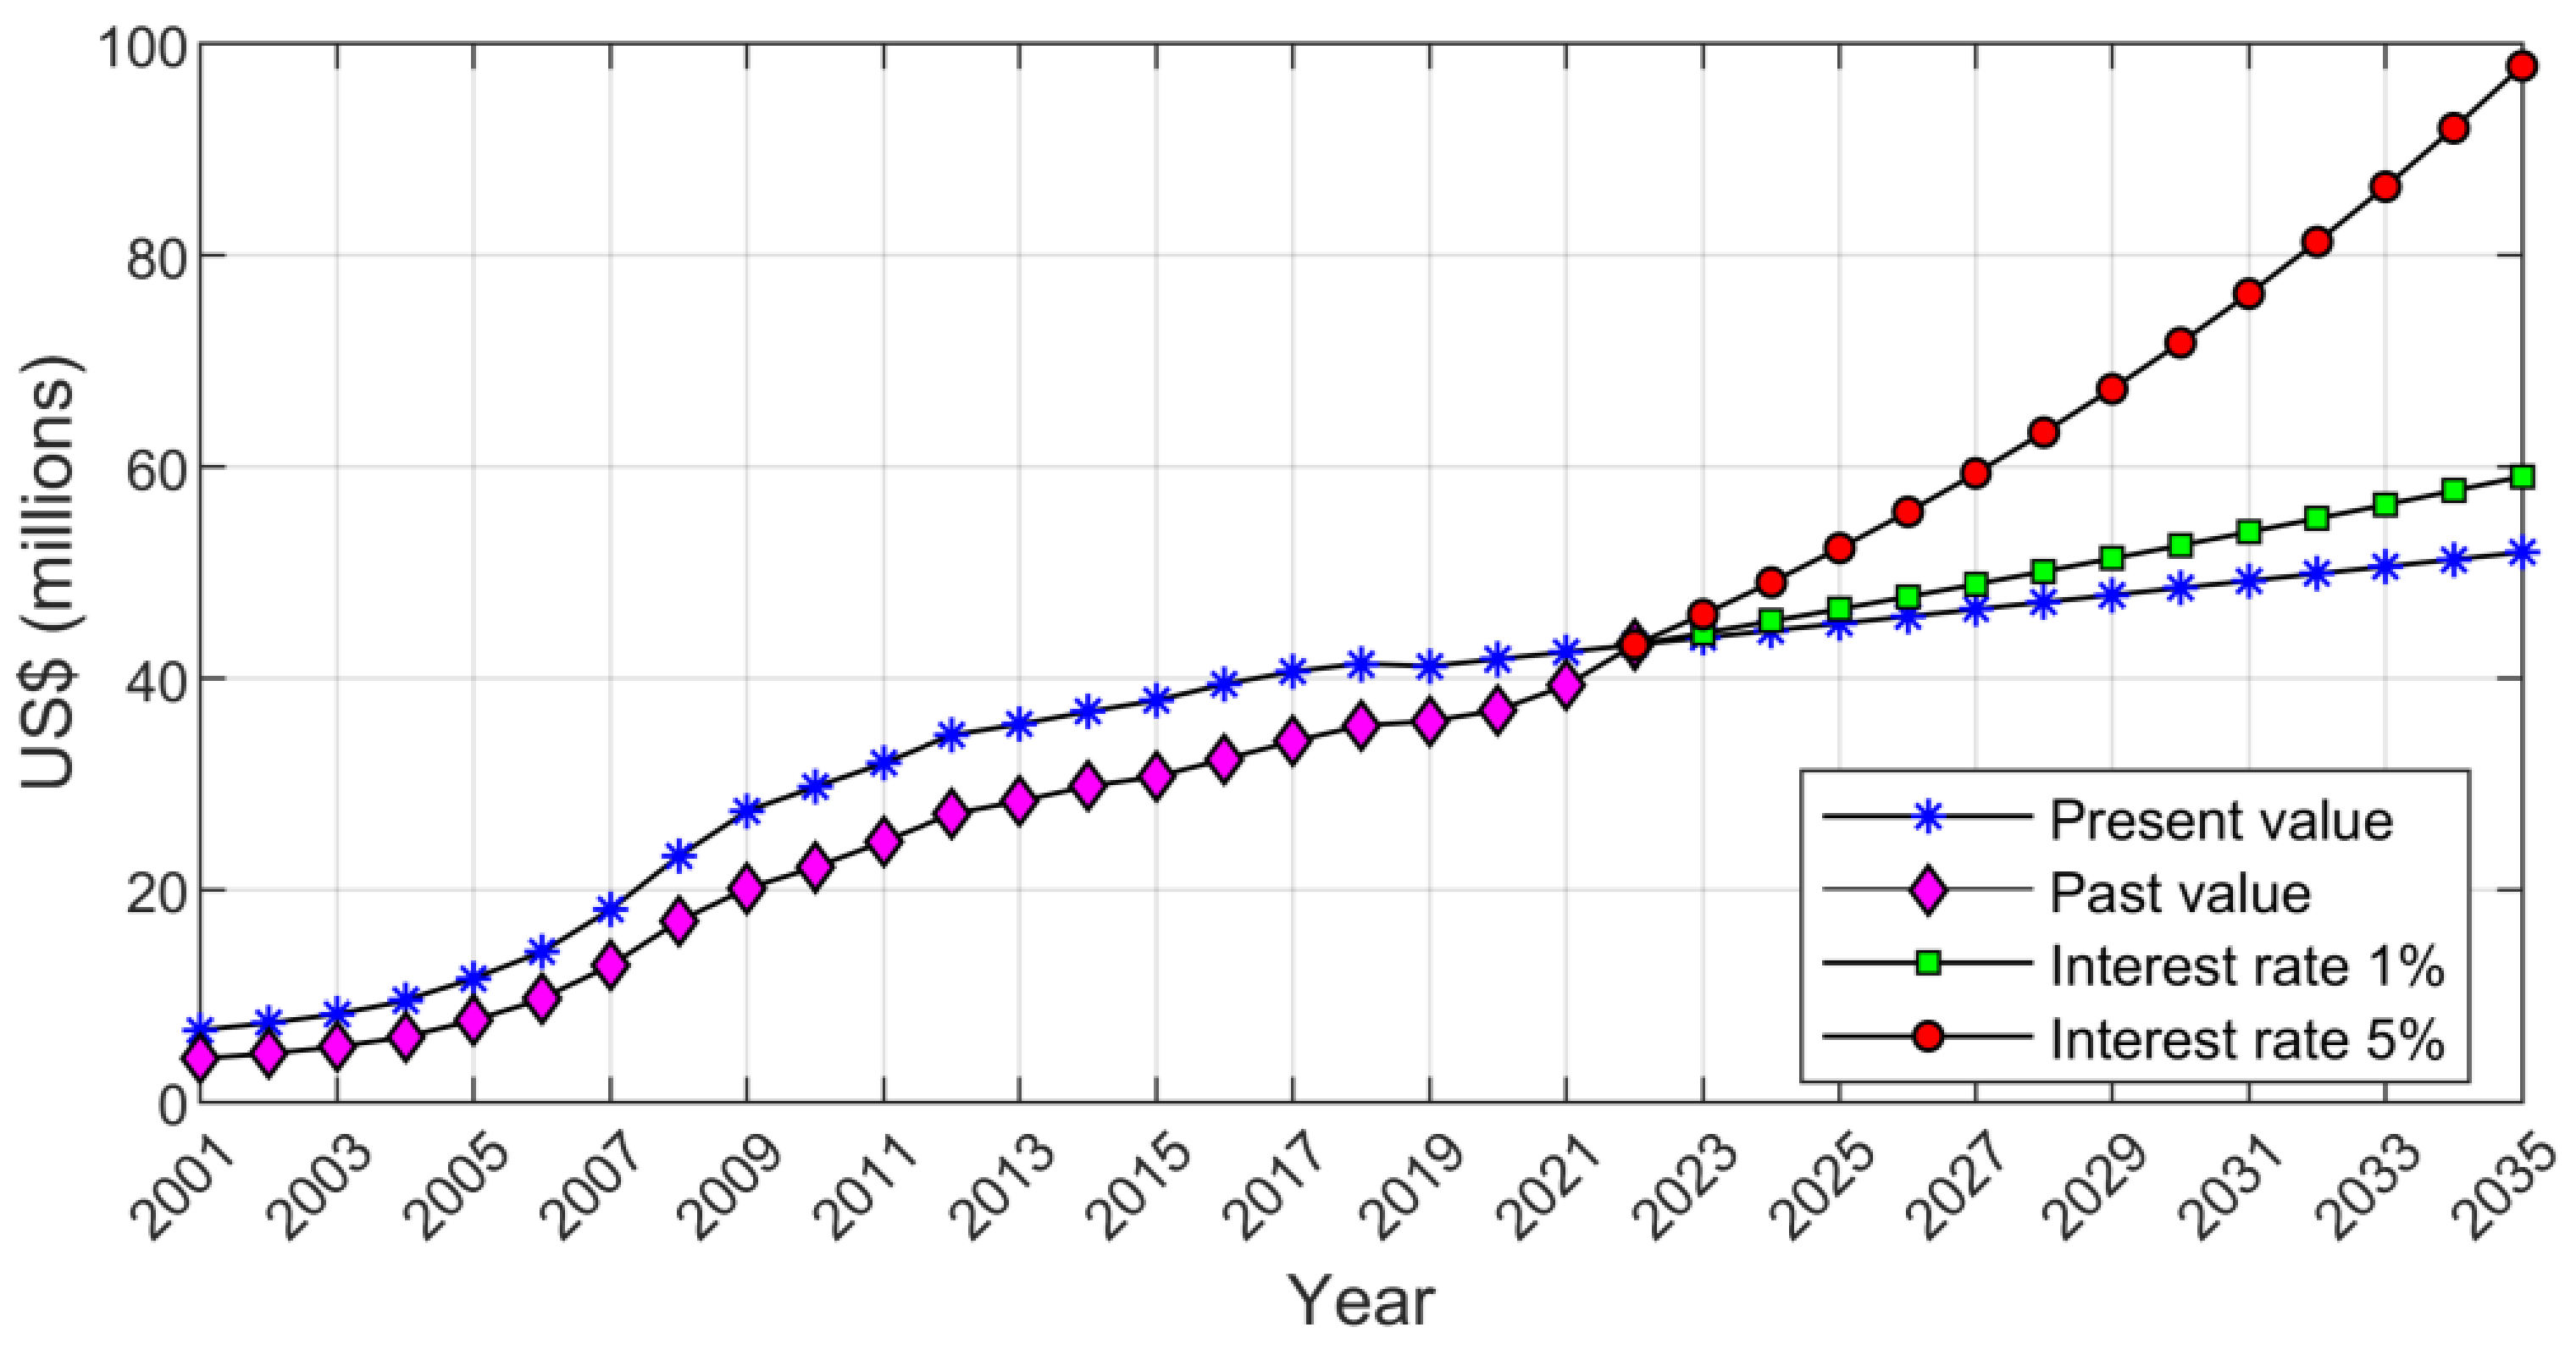
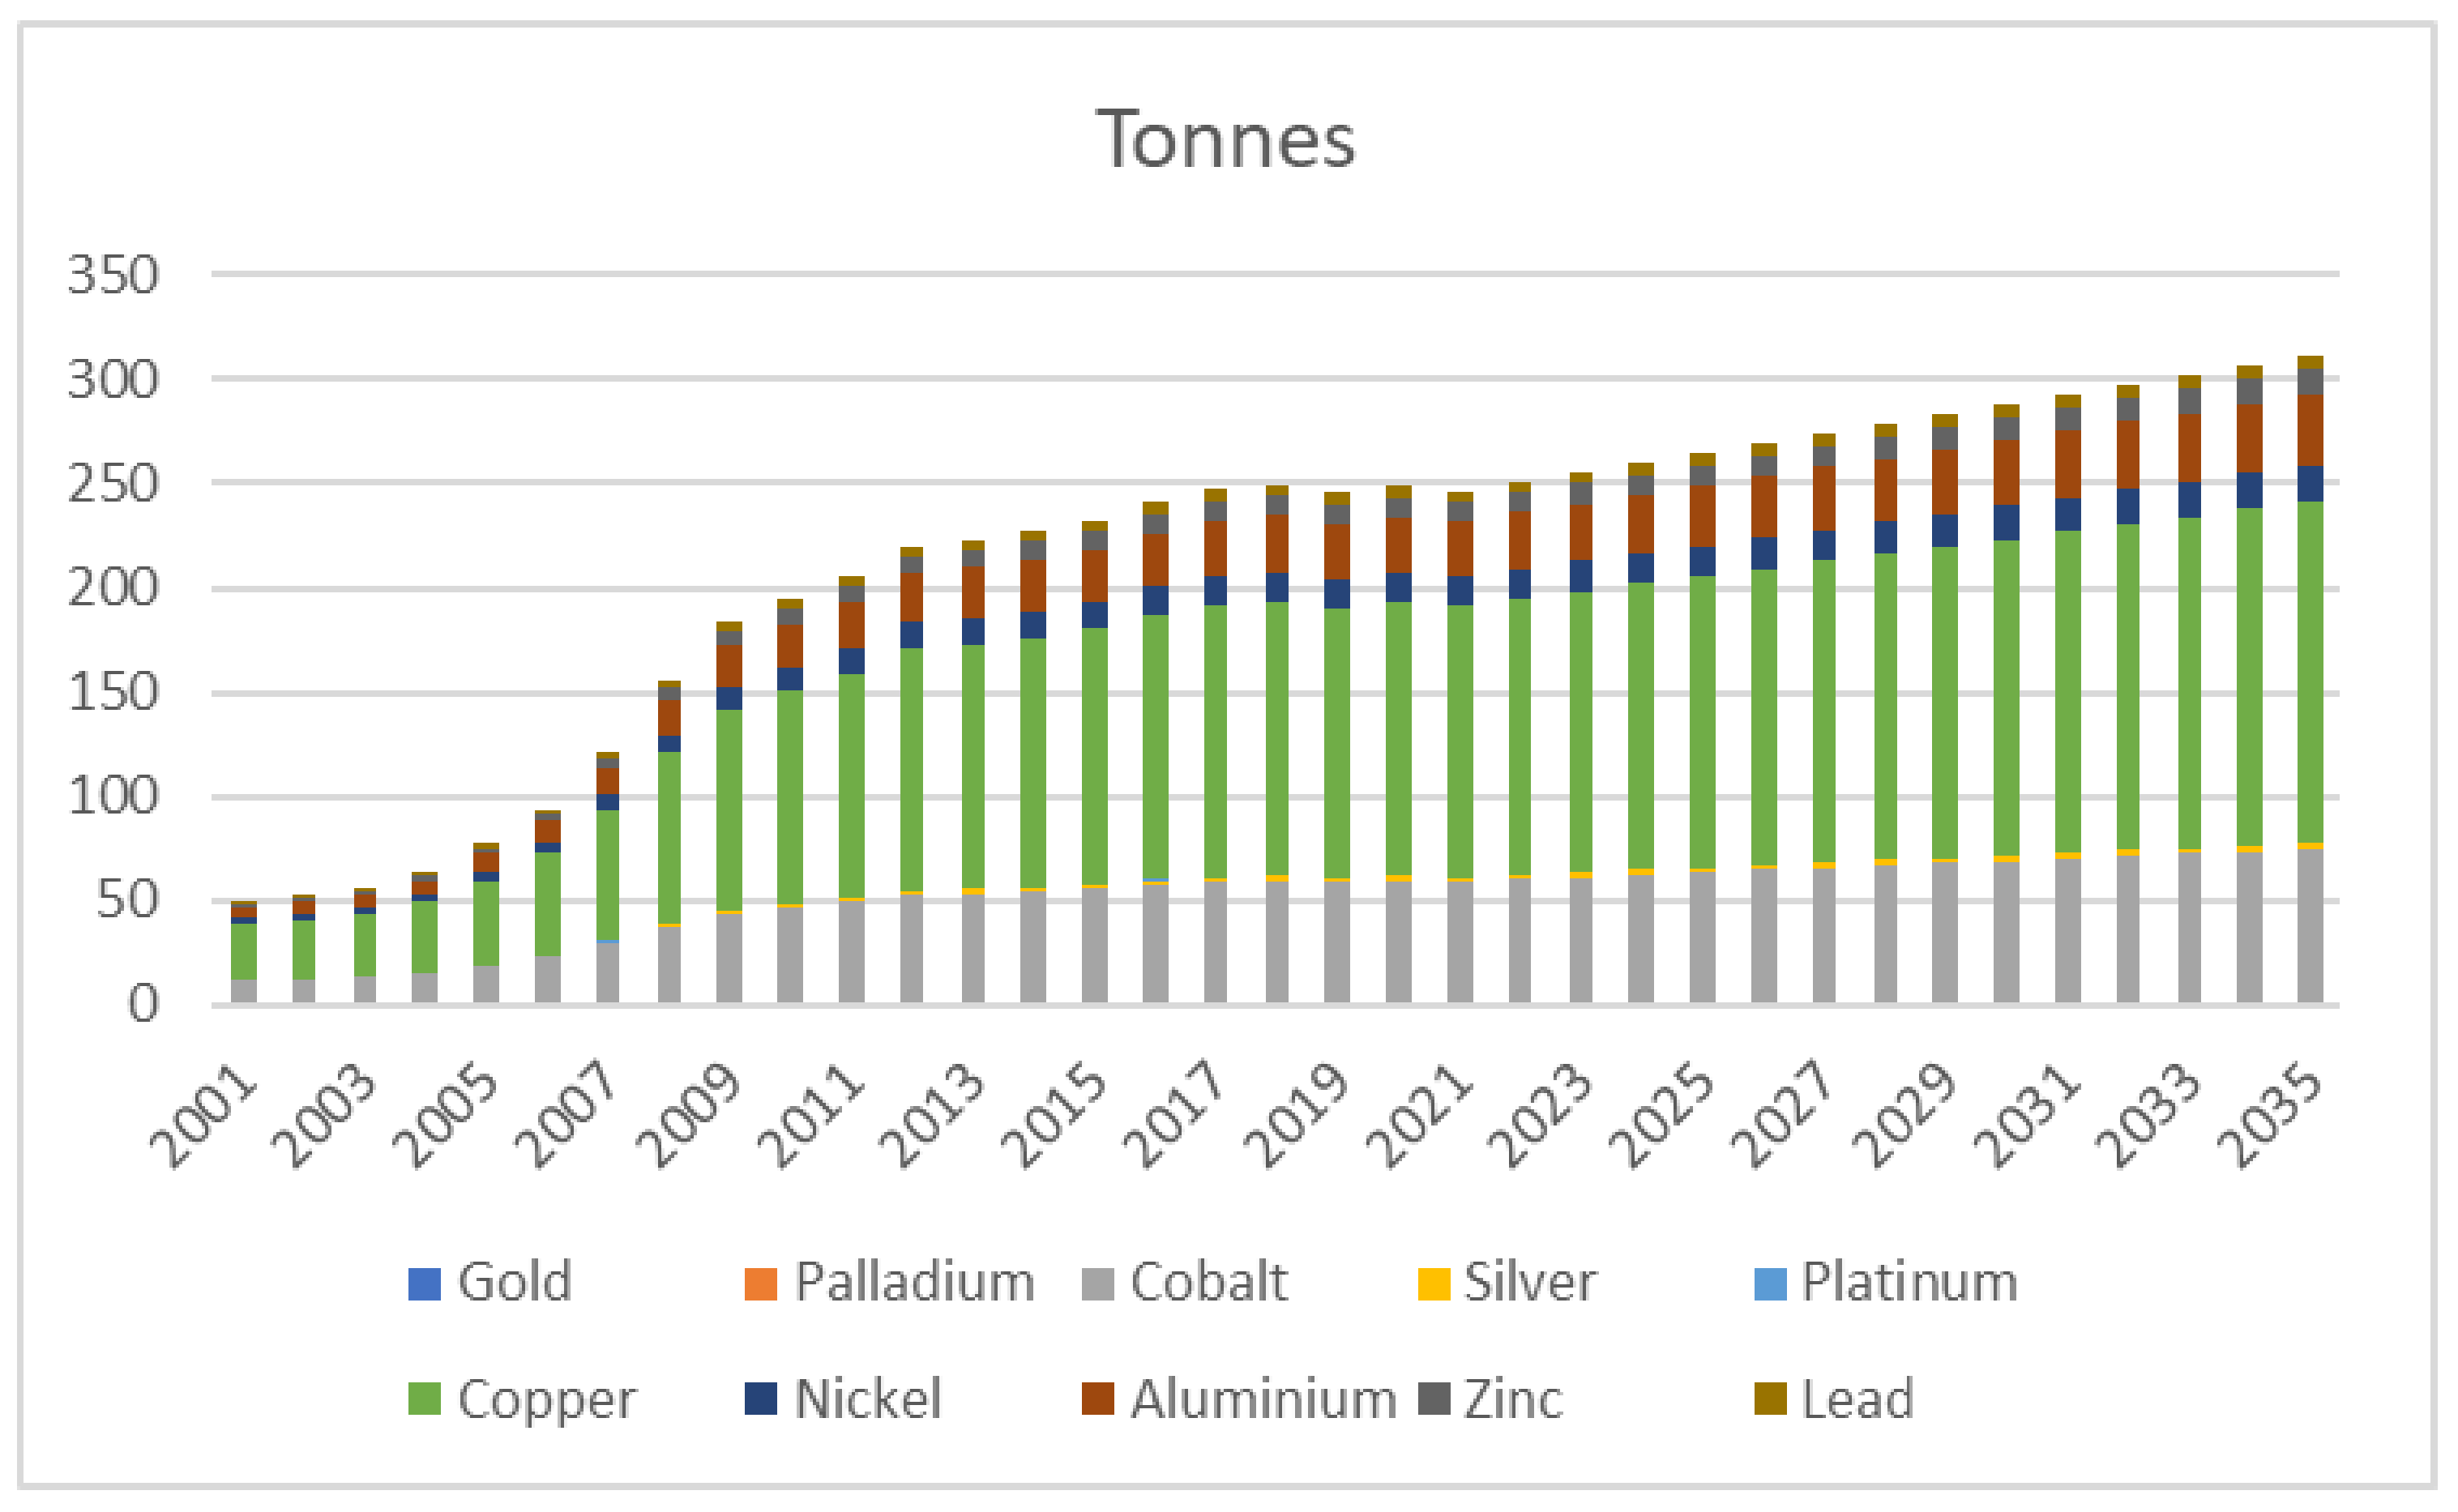
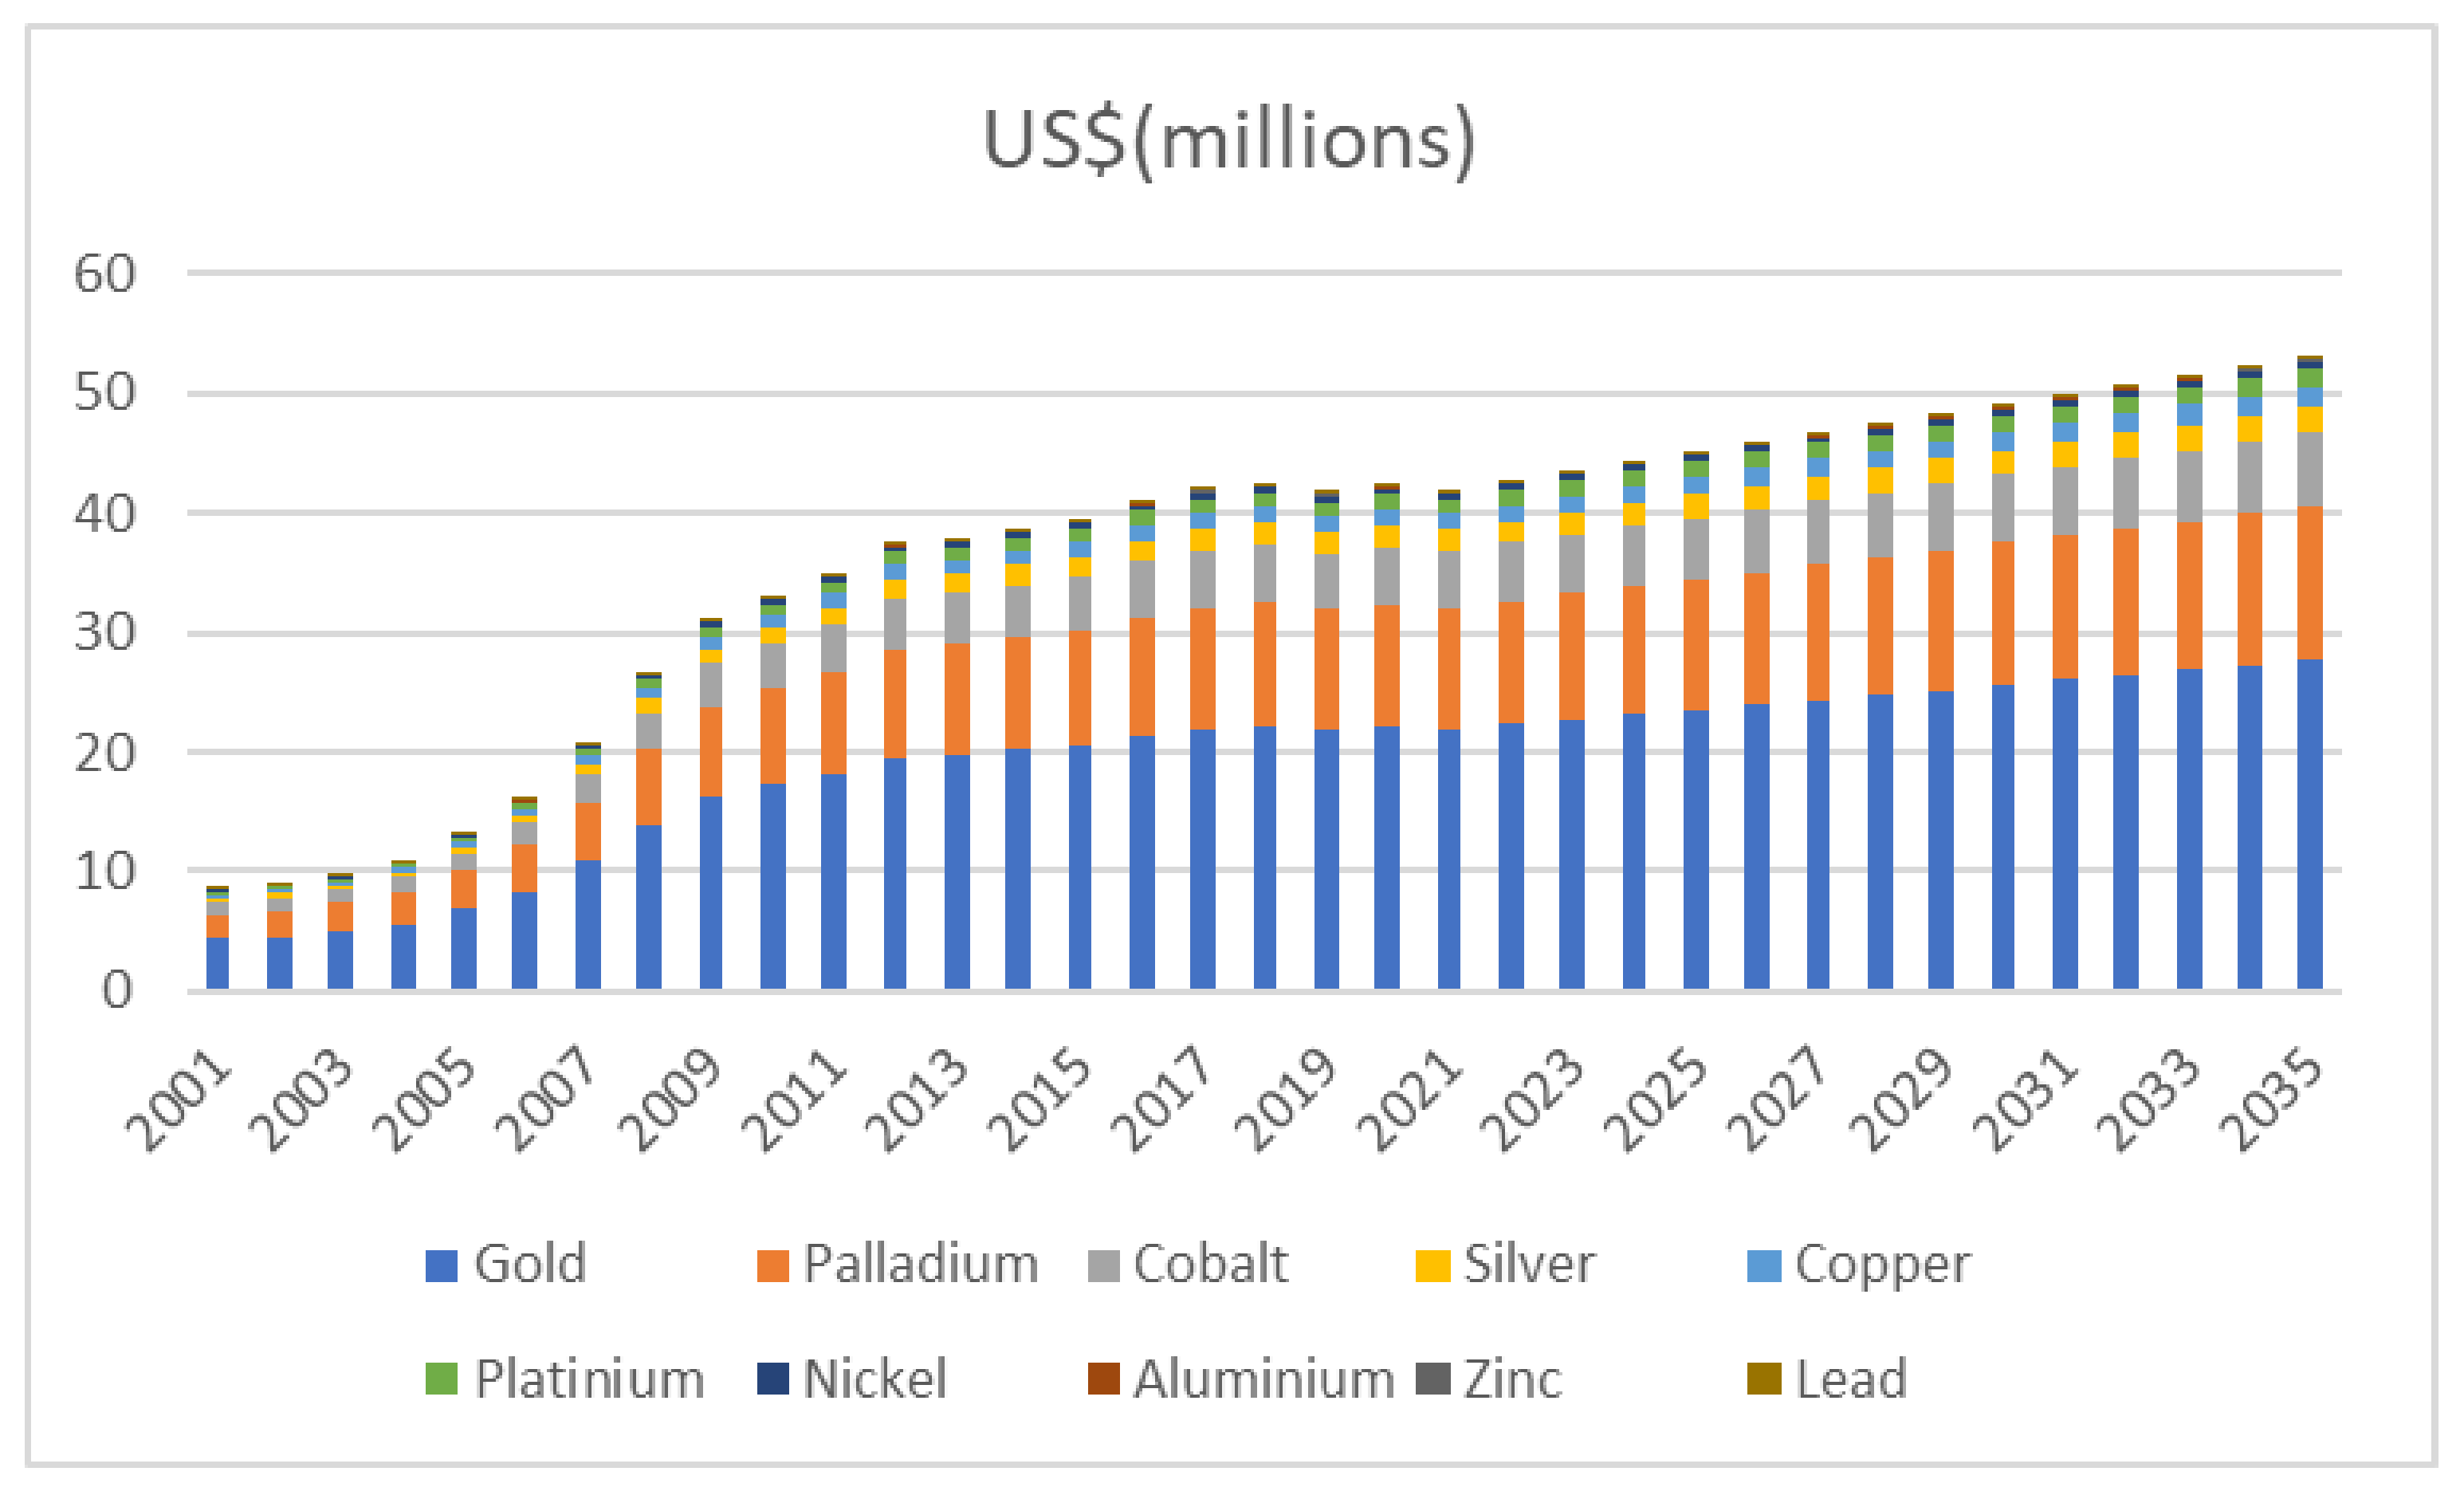
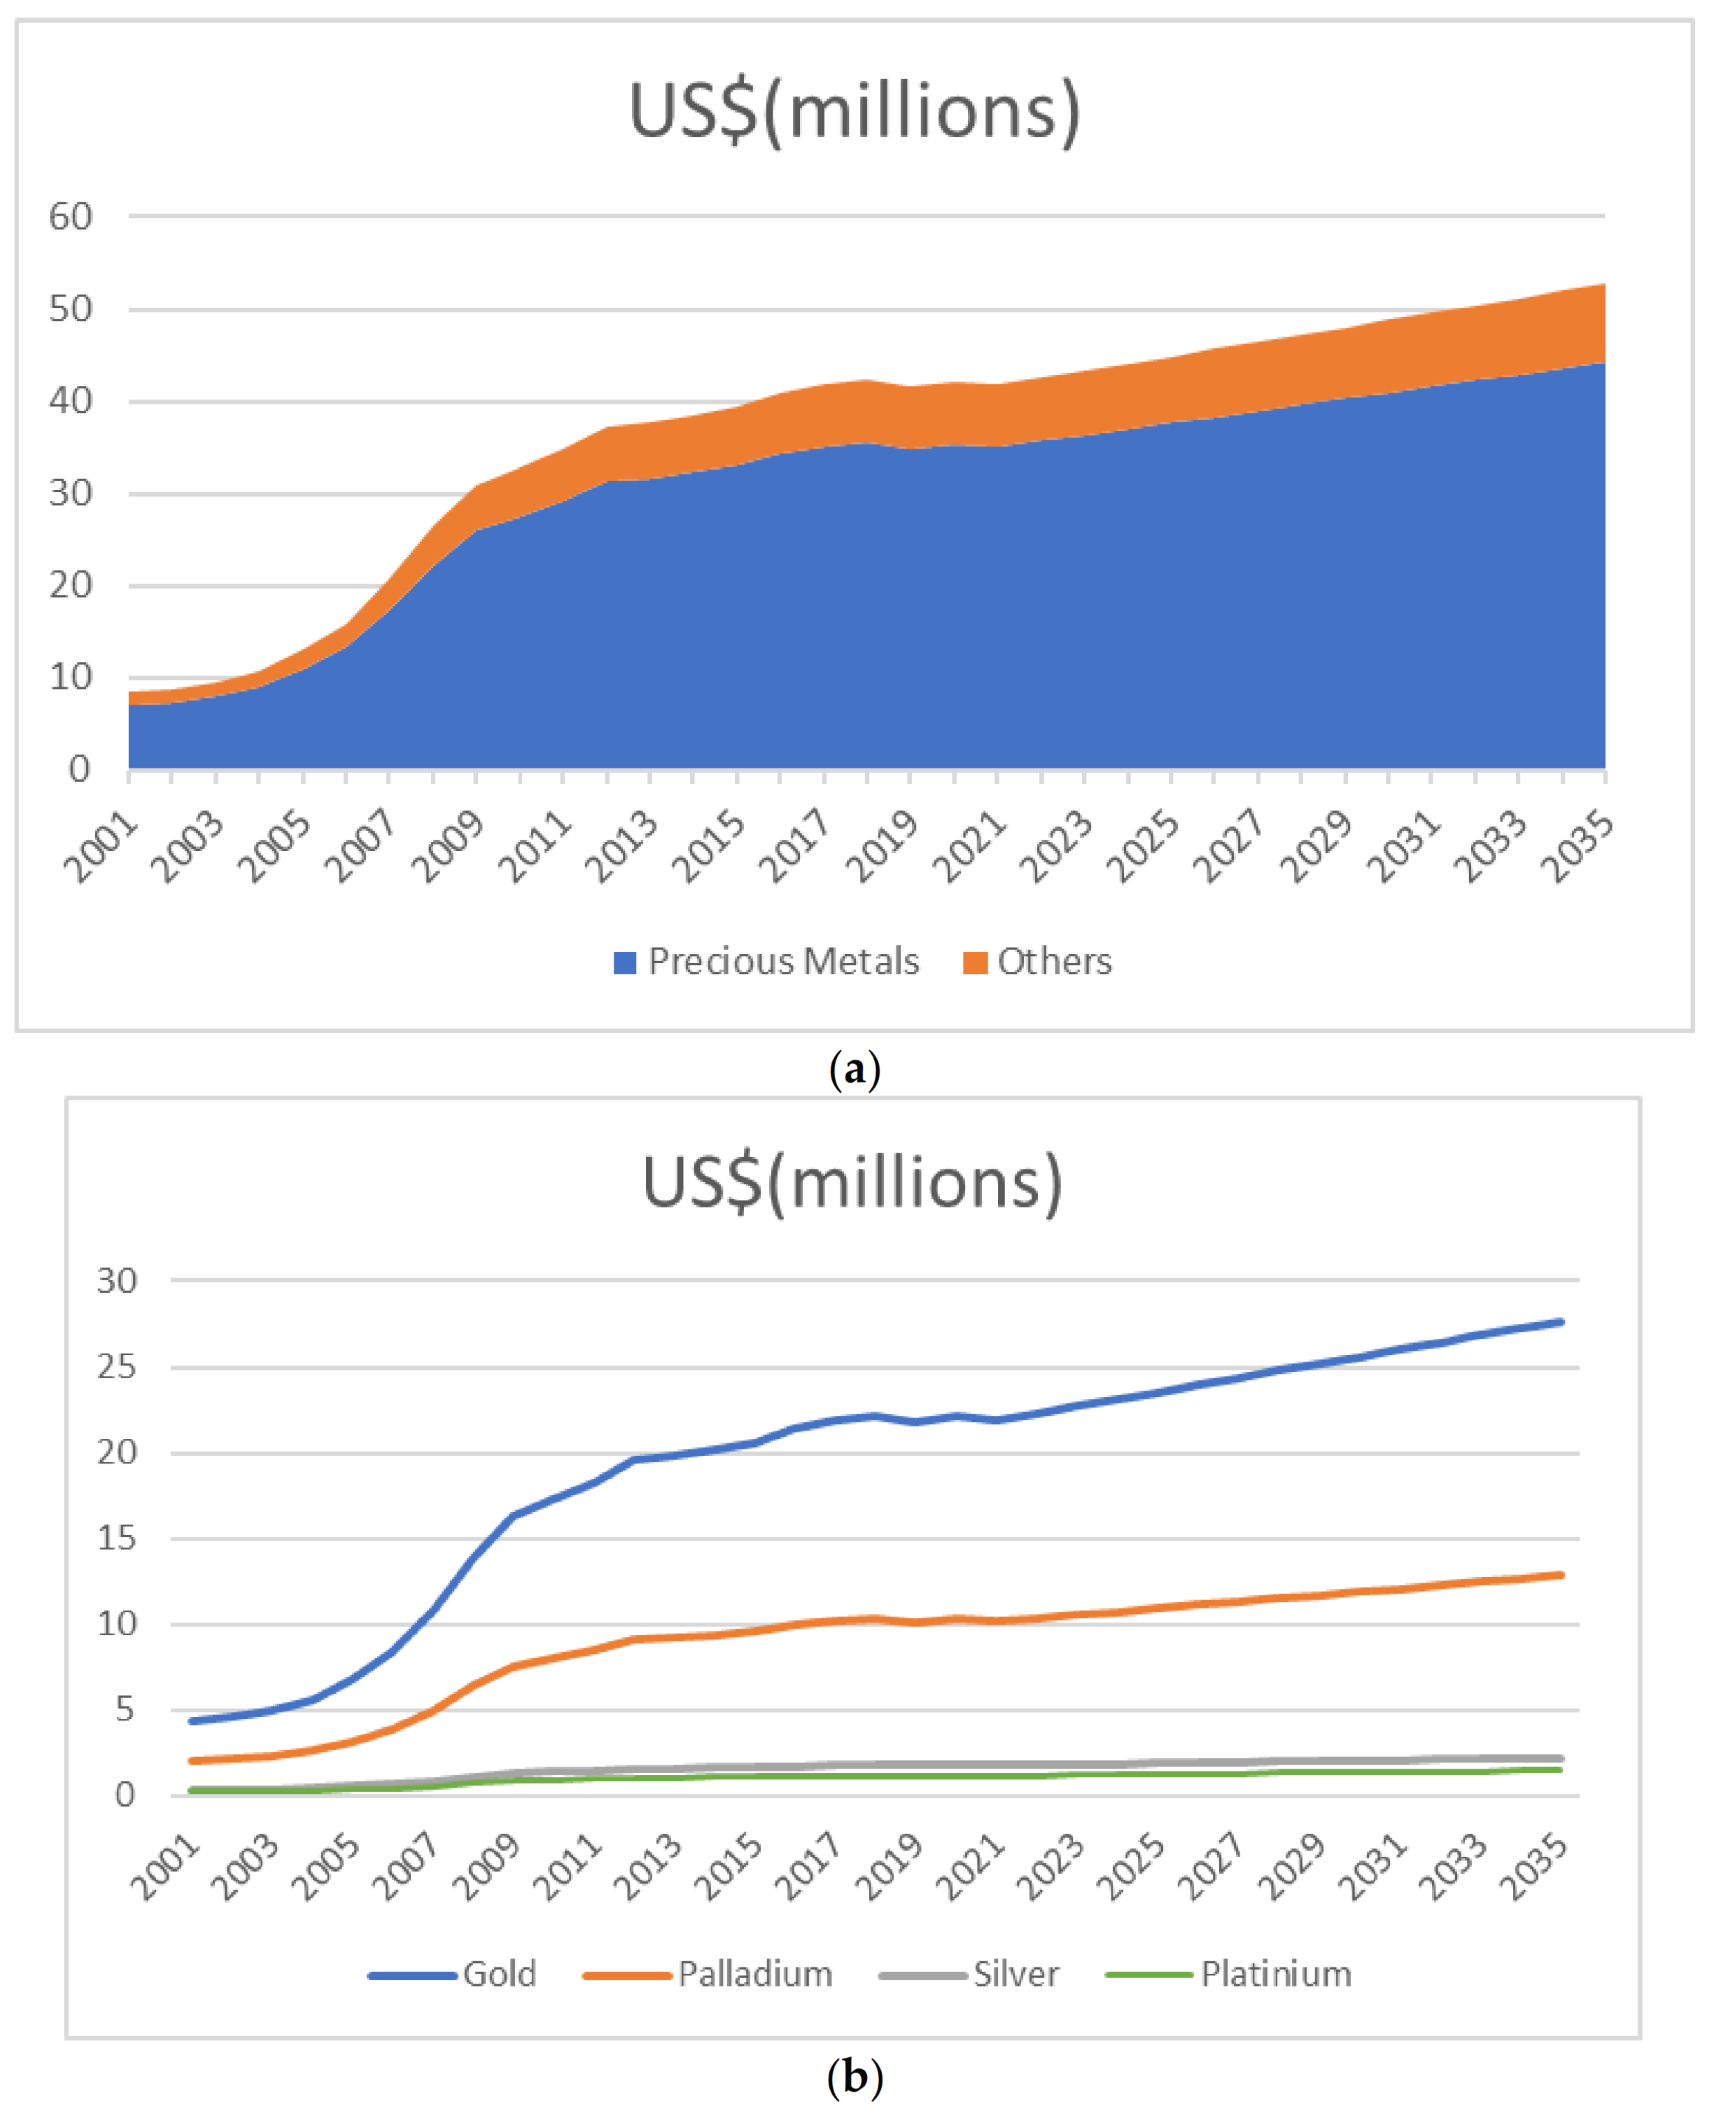
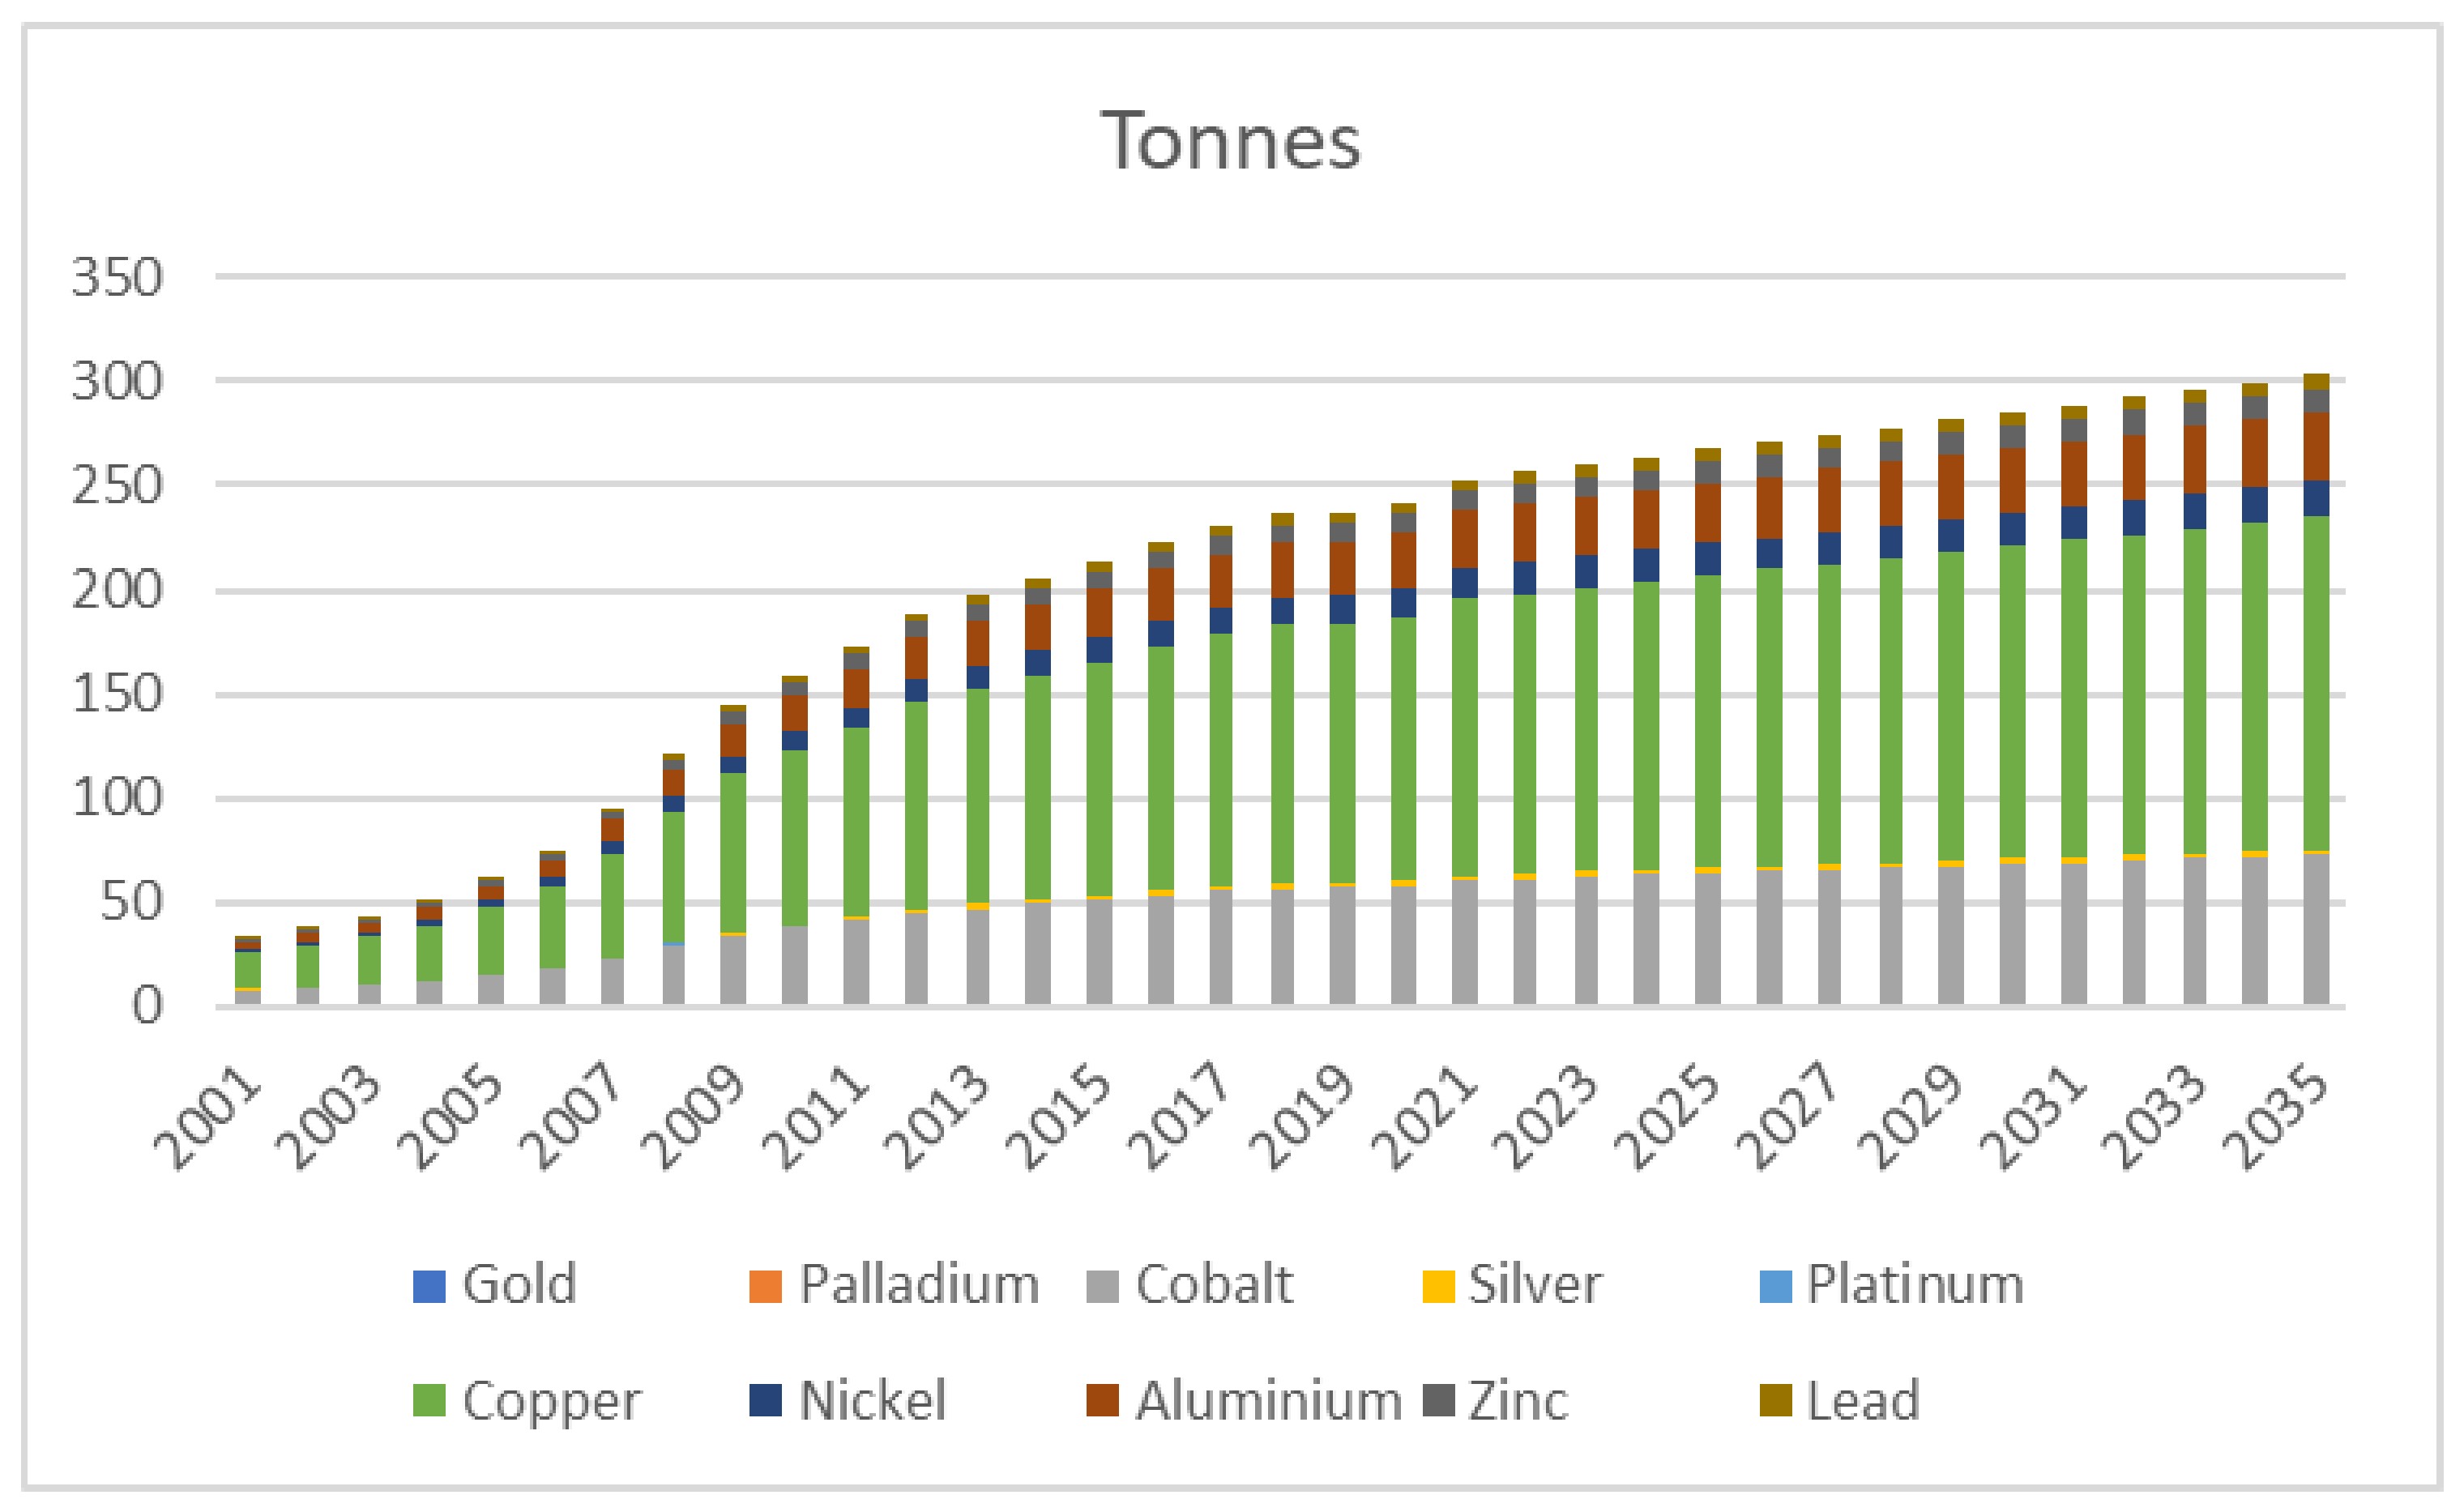
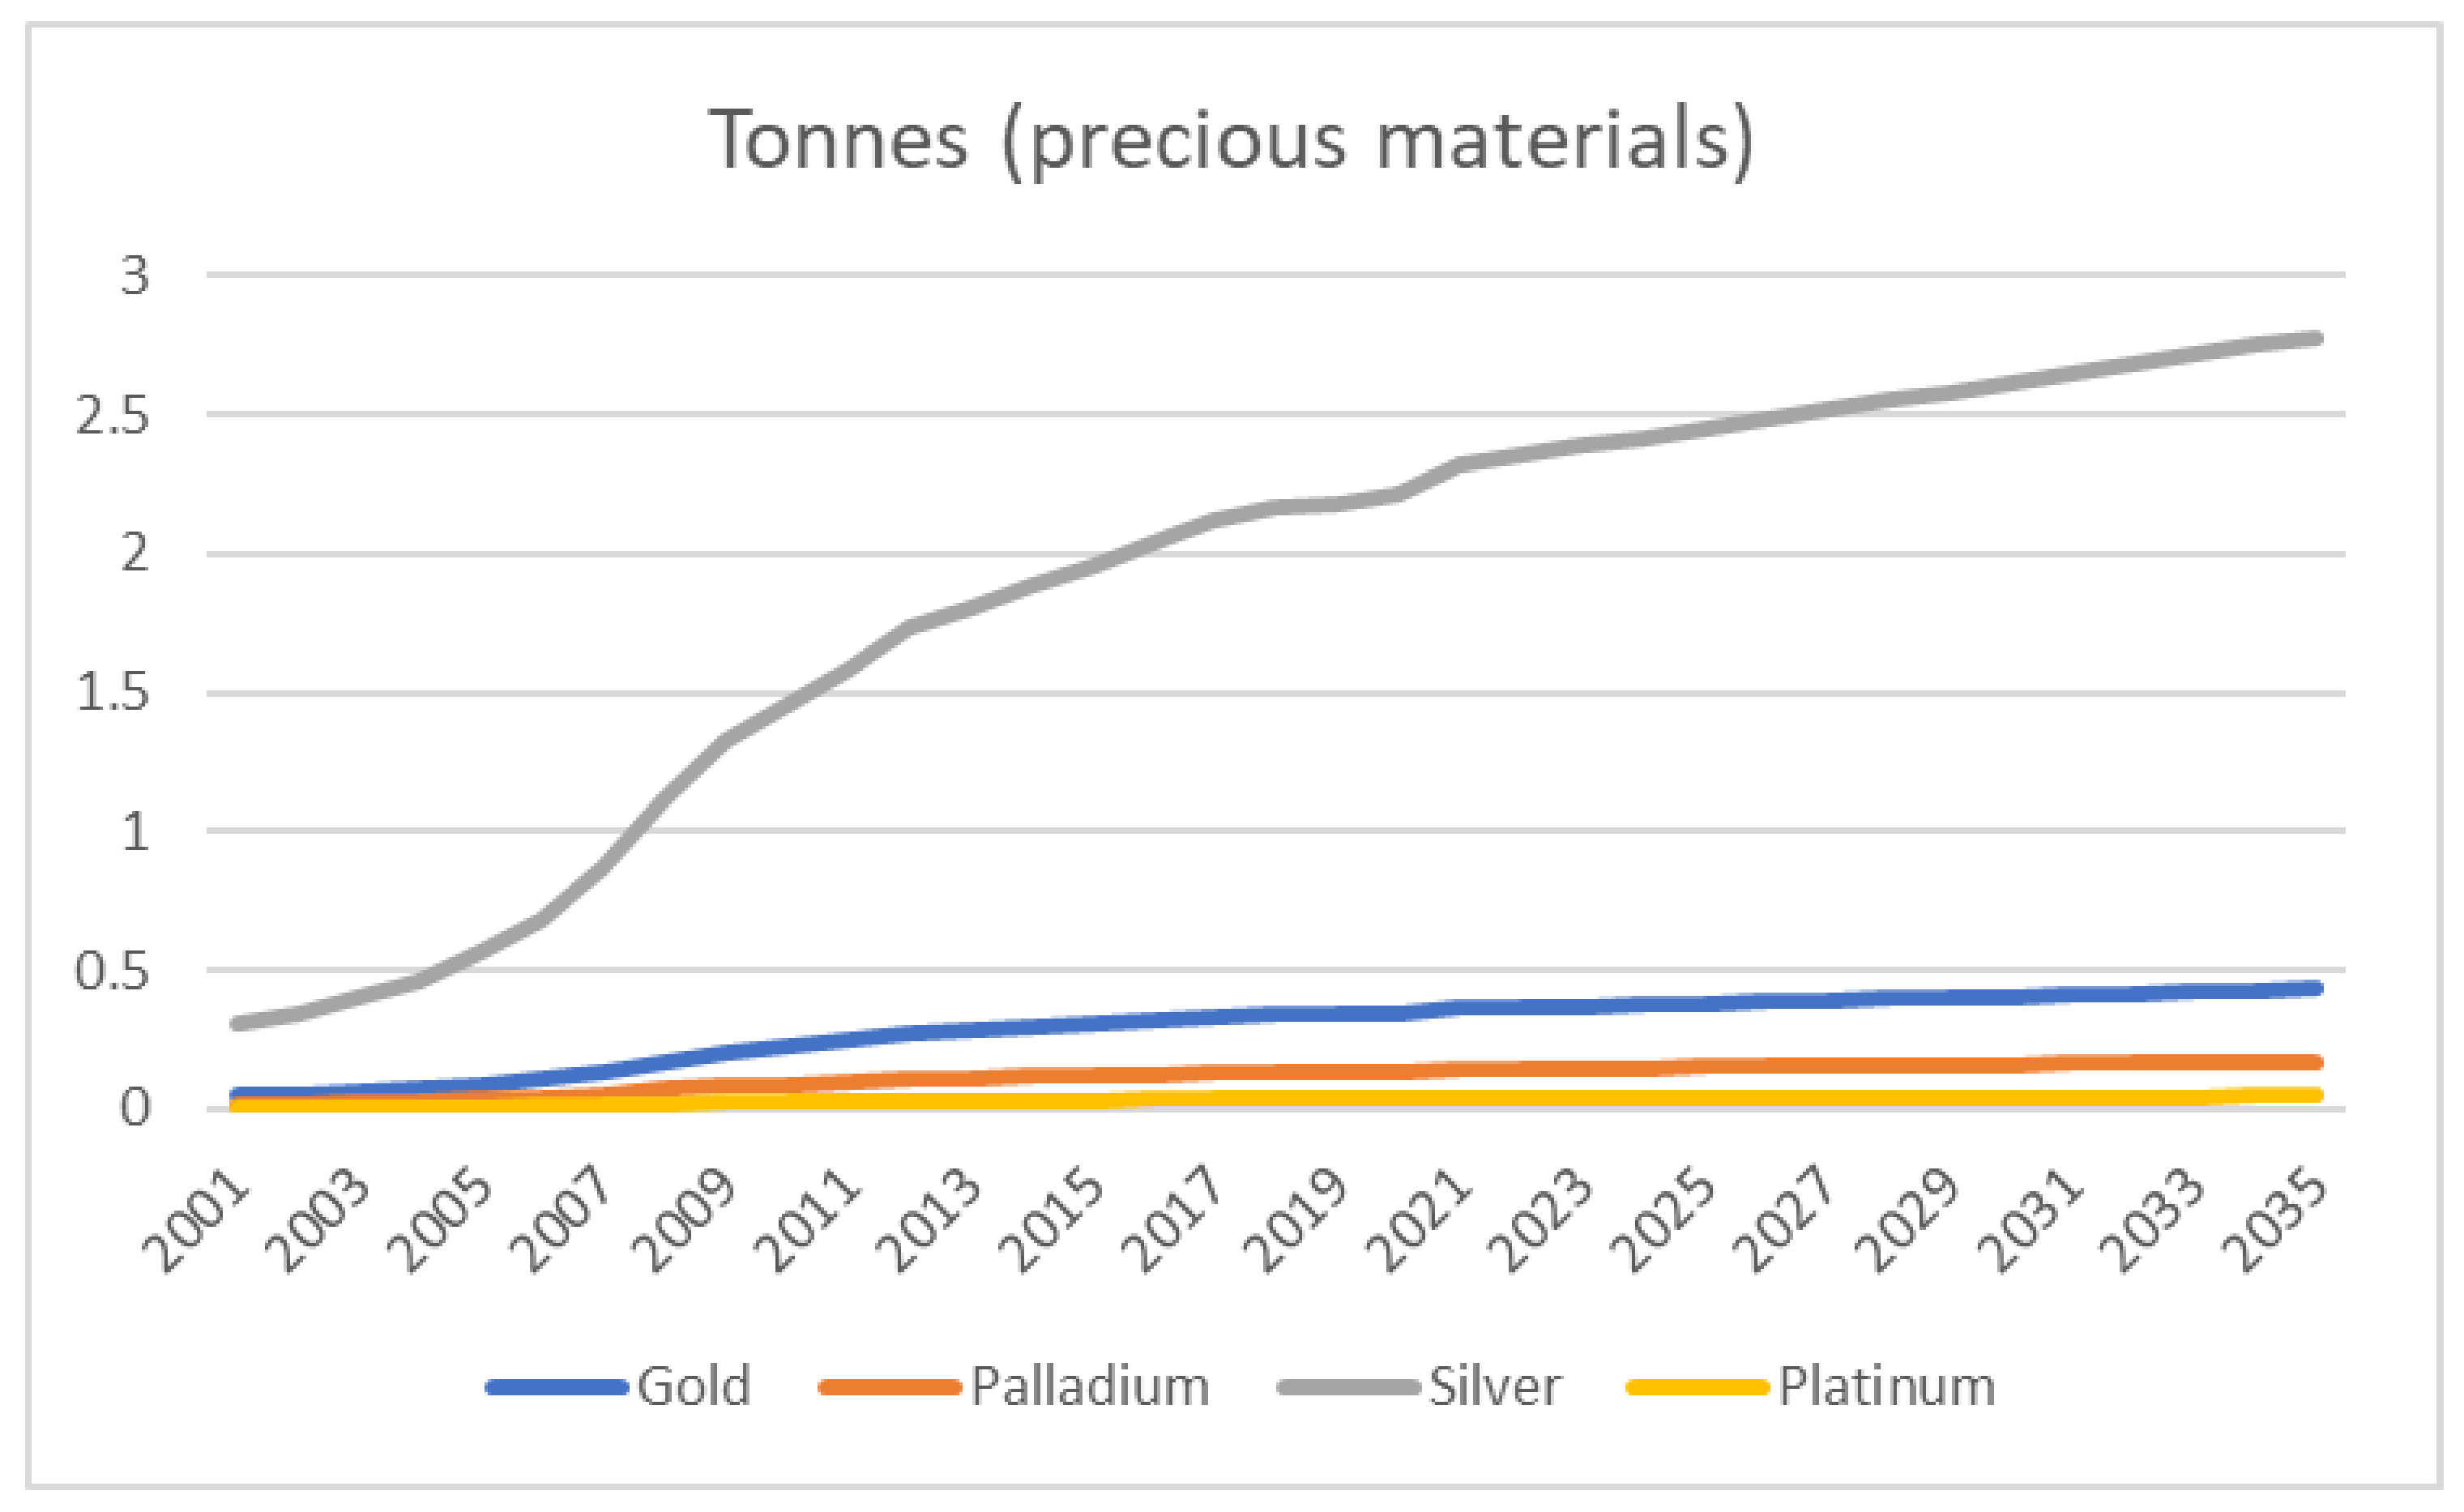
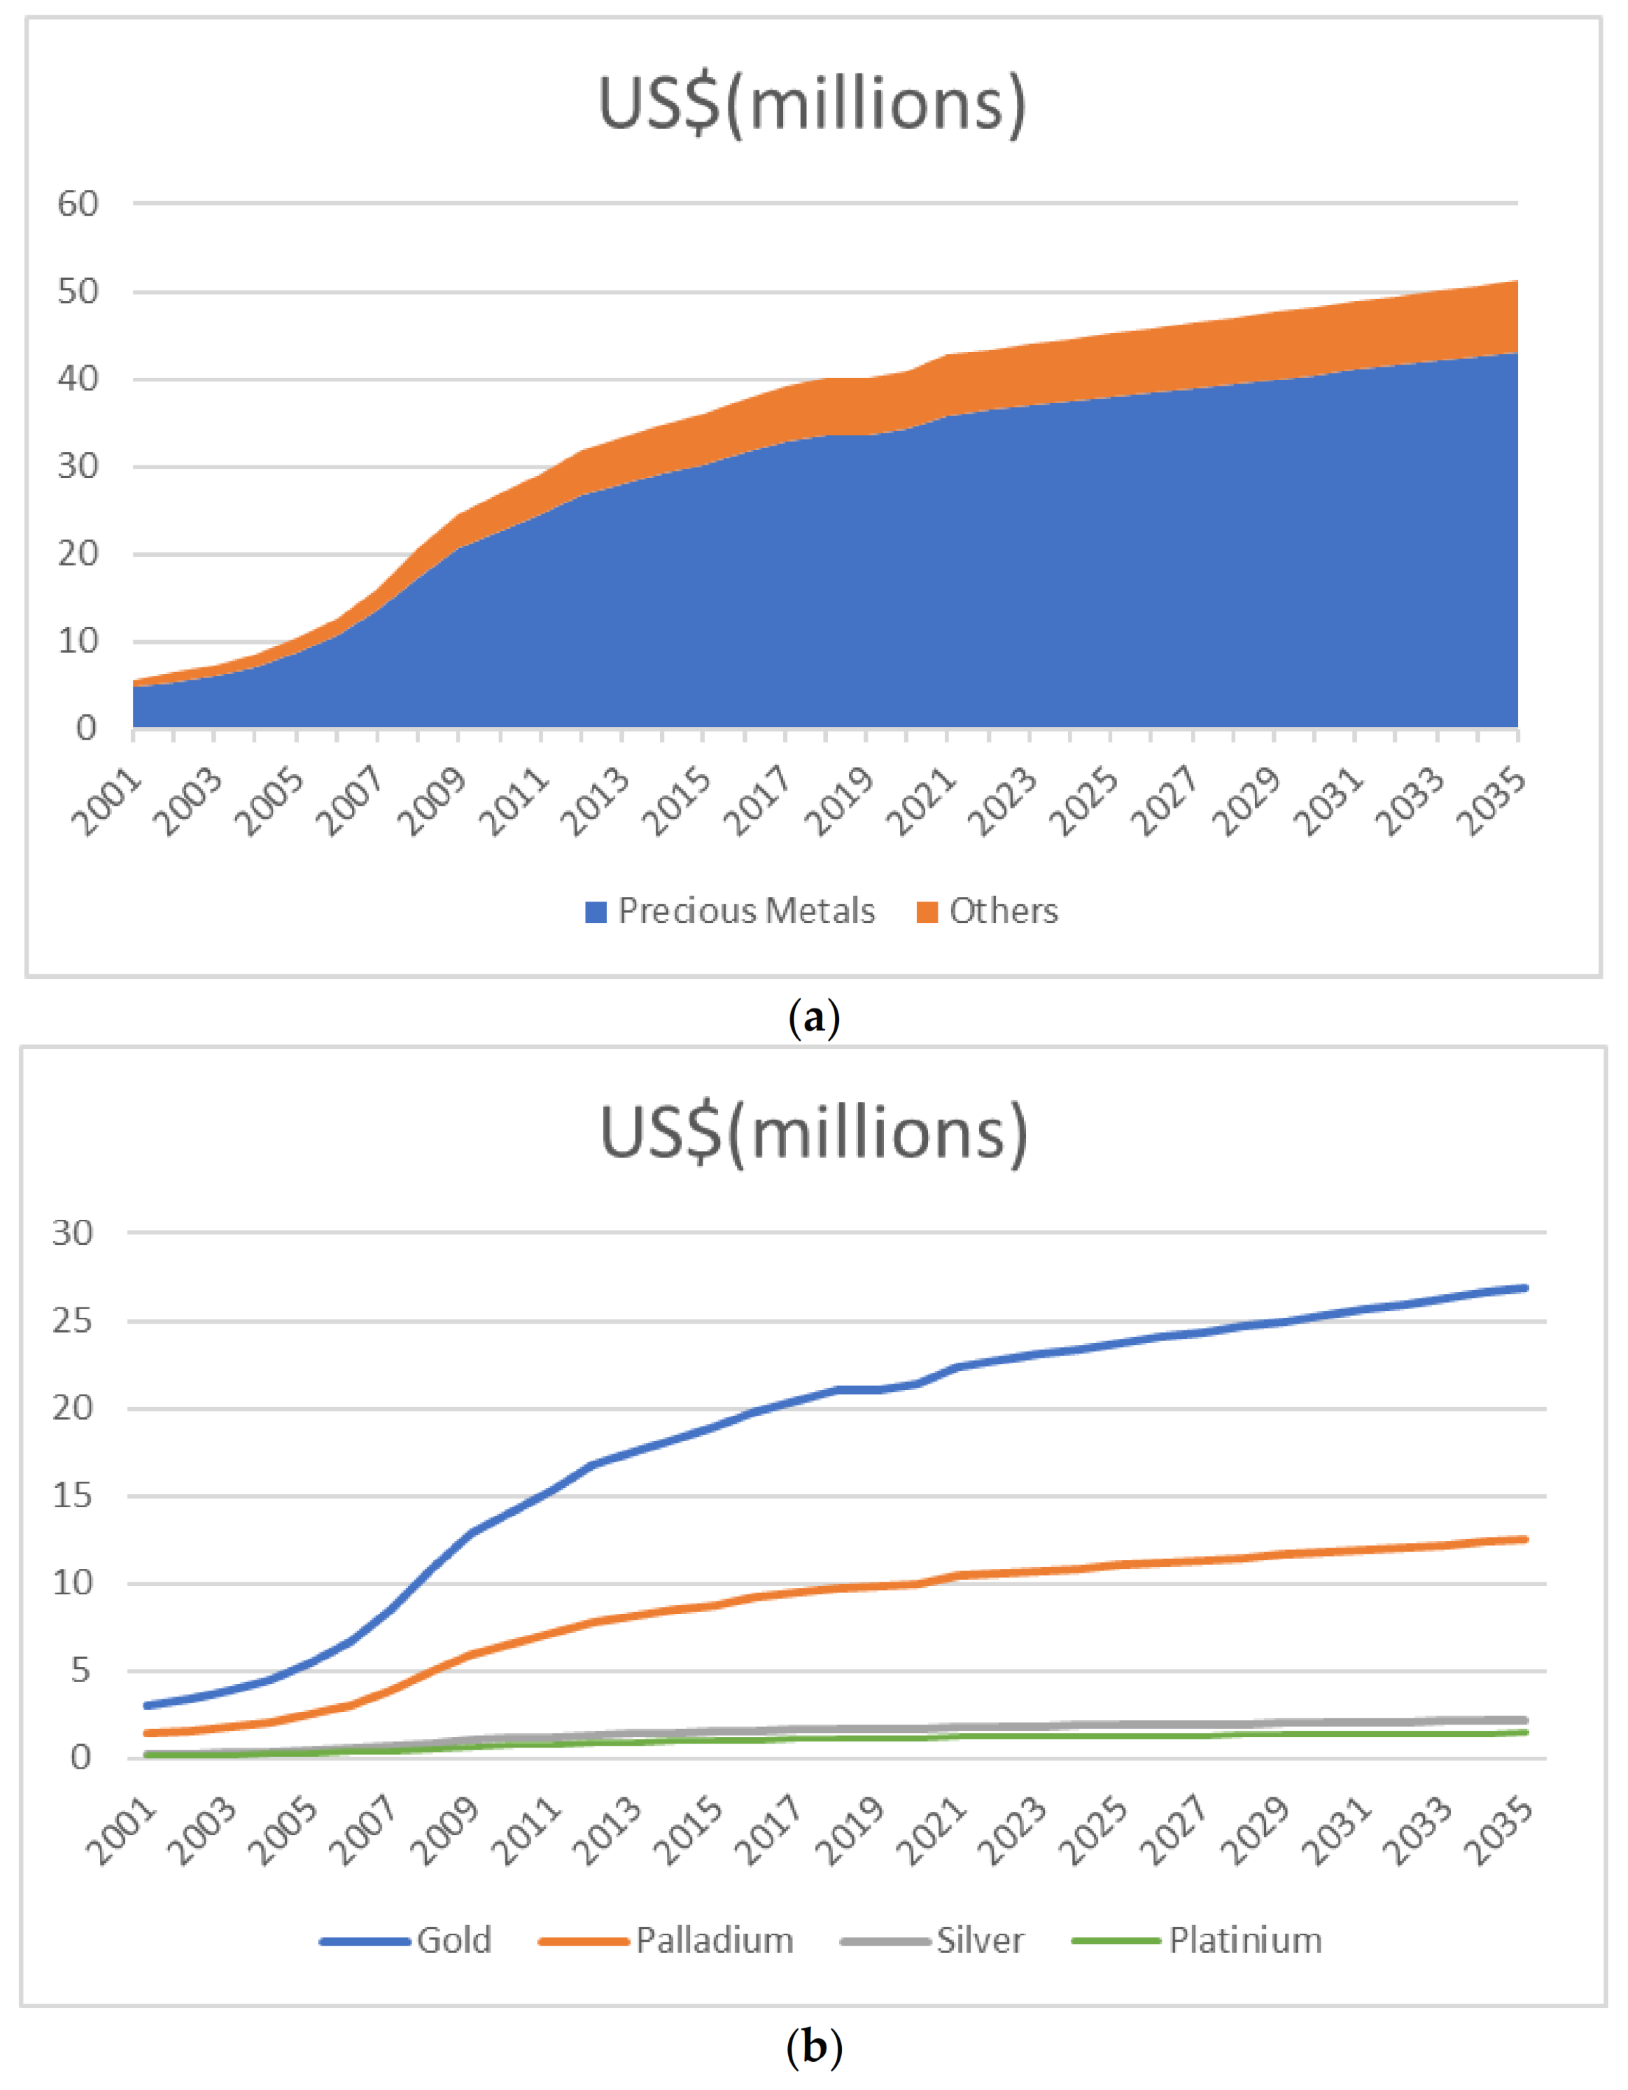
In this study, a generalized e-waste forecasting approach is proposed. The model estimates the generated WMP quantity for Turkey. Based on the generated dynamic lifespan profile and sales data, the DD method estimates the WMP quantity for 2001–2020. Before projecting the future, the most suitable forecasting method is determined out of seven considered models. For the case of Turkey’s WMP generation, Holt’s method gives the minimum estimation error. While forecasting the WMPs for 2021–2035, material quantity and revenue potential from WMPs are estimated for all periods from 2001 to 2035. While 1.5 million WMPs were generated in 2001, this number has reached six times that in 2020. In 2035, it is predicted that it will be approximately 12 million units. According to the present value of money, the material revenue of WMPs is expected to exceed 50 million US$ in 2035. Also, changes in critical inputs—lifespan distribution, material quantity, and material price—are also analysed for these periods. The effect of changes seems small; however, the cumulative value of the changes is notable. Extension of the lifespan for a year saves about a million dollars in material revenue due to fewer WMPs being produced yearly. Also, recovering and recycling processes have a critical contribution to saving materials.
The study is the first e-waste quantification study for Turkey, which uses sales data and dynamic lifespan in its estimation and makes future projections. The proposed method is suitable for application to various products and data structures. Based on the results of this study, we can draw the following conclusions and discussions, as well as the following challenges:
Methodologically, country cases are frequently studied, with IT-based products leading the way in e-waste estimation and forecasting. However, since it is impossible to record and follow up on e-waste formation in a systematic way today, it is impossible to assess the accuracy of the results and compare them with other countries/regions/methods, including the WMP amounts estimated in this study. The forecasting step can be improved in addition to sensitivity analysis to alleviate this disadvantage. Therefore, it is only possible to compare Turkey and other countries for generated WMP. In addition, it, for e-waste estimation, it can be said that the best of the methods used in the studies is any method. Because e-waste generation does not have a structure that can be measured and recorded by objective methods such as weather conditions and electricity consumption, to eliminate the uncertainties of the e-waste generation process, it is necessary to follow the electronic devices put on the market from their production to the recycling process and know the following information: How long was each product used? How often has it been used (second use, third use, etc.)? How many times has the product been repaired? Which parts have changed? Therefore, although we cannot model the uncertainties within the scope of this study, different forecasting methods were considered in the best modelling of the system, and sensitivity analyses were conducted for the main factors affecting the outputs. Thus, to support the e-waste management process, this study aimed to produce results for the decision-makers regarding the effect of changing certain conditions on the results. The primary motivation for discussing the necessity of using different forecasting methods is to use the best one among other methods instead of a single solid method (only logistics, only Holt’s, only ARMA, etc.) for forecasting according to changing products, markets, sales, and regional structures. Choosing the appropriate method according to the country, product, or regional situation will provide reliable and effective results by making robust estimations within certain limits on e-waste estimation due to e-waste entailing uncertainties and difficulties. Therefore, the results obtained from estimation and forecasting studies are vital to the construction of a reliable and sustainable e-waste management system for Turkey and all other countries. Also, e-waste has remarkable material and economic value; therefore these results will help in meeting the demand for materials for new productions.
The amount of WMP materials and the revenue results for Turkey also show that 10s of tonnes of waste materials are not being recycled or recovered every year. As a result, they end up in landfills, and the potential economic return of precious metals and materials worth millions of dollars cannot be utilized. Considering the potential revenue of only WMPs and other waste electronic products for Turkey, it is evident that e-waste will provide valuable economic revenue and constitute an excellent input source for the CE. At the same time, when these amounts are considered globally, the recovery of e-waste will meaningfully contribute to the world’s CE because resources are scarce and rapidly depleting, and will be a ready source of minerals for production processes. It should be noted that these calculations assume that 100% of the materials are recovered. Turkey collected only 3% of the product amount put on the market in 2017, falling far behind EU countries and national targets [115]. This situation will also produce some new needs: Recycling and recovering technologies will be needed in the coming years to achieve the highest performance with appropriate methods, including the design and production process of the products.
Another dimension of material analysis is the increased demand for electric vehicles and the jumps in material prices in recent years. It is difficult to predict the fluctuations in material prices depending on electrical devices and technological developments that we cannot foresee. Although there have been jumps in the prices of certain materials in recent years, the direction of the changes may change with developments and innovations in battery technologies. In addition, different issues such as climate crisis, energy crisis, interest rate decisions of central banks, epidemics, and tensions between countries affect the market conditions. In summary, even the dust particles of each material are valuable. Since our world cannot reproduce, it is imperative to recover these scarce resources as effectively as possible.
Moreover, the data considered and analyses carried out in this study support the CE strategies. For example, “rethinking, reduce, and refurbishment” affect the sales quantities, “re-use and repair” are directly related to lifespan, and “recover, recycle, and remanufacture” have an impact on generated e-waste materials.
The findings of this study will assist all stakeholders and practitioners, such as policymakers, electronic goods dealers, consumers, investors, entrepreneurs, and researchers from different disciplines, to improve the management of e-waste. For example, the analysed WMP quantities can be used in decision making processes related to the location selection of recovery centers and their capacities; determining collection targets; development of incentive plans; etc.
For the success of WMP and other e-waste forecasting, there is a need for further improvement in the effective monitoring of electronic devices, systematization of data records, increasing awareness of recycling and recovery of societies, and control, support, and follow-up of this process with laws and regulations.

Author Contributions

Conceptualization, A.G. and Z.O.B.; methodology, A.G. and Z.O.B.; software, Z.O.B.; validation, A.G. and Z.O.B.; formal analysis, Z.O.B.; data curation, Z.O.B.; writing—original draft preparation, Z.O.B.; writing—review and editing, A.G.; supervision, A.G. All authors have read and agreed to the published version of the manuscript.

Funding

This research received no external funding.

Institutional Review Board Statement

Not applicable.

Informed Consent Statement

Not applicable.

Data Availability Statement

Not applicable.

Conflicts of Interest

The authors declare no conflict of interest.

Appendix A

Table A1. Sales (put on market) data (unit).
YearImportExportProductionPassenger POM
1994175,000 175,000
1995300,000 300,000
1996425,000 425,000
1997900,000 900,000
19982,200,000 2,200,000
19996,300,000 6,300,000
20007,631,990218,512 7,413,478
20012,436,000518,544 1,917,456
20024,044,800258,205 3,786,595
20035,238,51249,847 5,188,665
20047,547,09111,906 7,535,185
20059,005,56034,605 8,970,955
200613,143,06129,023 158,12813,272,166
200715,811,93676,356 670,08416,405,664
200814,522,515154,519 807,36515,175,361
200910,990,34791,482 566,61411,465,479
201012,145,459185,223453,336828,49113,242,063
201114,308,793130,33987,4081,098,78415,364,646
201210,627,991148,343192,7811,119,95211,792,381
201312,199,623195,195347,6491,031,13613,383,213
201412,546,529421,298896,608610,04413,631,883
201513,581,718518,5441,526,326723,53215,313,032
201613,464,546873,7571,281,320773,94014,646,049
201712,189,655579,3931,600,655842,93214,053,849
20189,820,192504,0221,717,902878,08911,912,161
201914,124,114188,000653,095323,05214,912,261
20209,733,22969,464795,98372,41710,532,165
Data are collected from [88,89,90].
Table A2. Modelling errors for each method (−1 year lifespan).
Method/ErrorMAPE (%) RMSE   ( × 10 6 ) SSE   ( × 10 12 )
Simple Exponential Smoothing9.14120.46854.3906
Holt’s Method2.33560.14830.4401
Logistic4.82060.16710.5583
Gompertz7.53830.24761.2261
Logarithmic30.68821.019720.7977
Bass8.36550.38582.9771
ARIMA6.44300.23341.0896
Figure A1. Waste material quantities in tonnes (−1 year lifespan).
Sustainability 15 03104 g0a1
Figure A2. Precious materials quantities in tonnes (−1 year lifespan).
Sustainability 15 03104 g0a2
Figure A3. Revenue potential for waste materials in US$ (106) (−1 year lifespan).
Sustainability 15 03104 g0a3
Figure A4. (a) Total revenue potential for precious and other materials (b) revenue potential for precious materials in US$ (−1 year lifespan).
Sustainability 15 03104 g0a4
Table A3. Modelling errors for each method (+1 year lifespan).
Method/ErrorMAPE (%) RMSE   ( × 10 6 ) SSE   ( × 10 12 )
Simple Exponential Smoothing7.60220.52495.5107
Holt’s Method3.21920.24751.2256
Logistic6.77150.29761.7712
Gompertz9.13780.40923.3483
Logarithmic22.95510.996119.8435
Bass8.77780.52525.5167
ARIMA10.92830.53365.6942
Figure A5. Waste material quantities in tonnes (+1 year lifaspan).
Sustainability 15 03104 g0a5
Figure A6. Precious materials quantities in tonnes (+1 year lifespan).
Sustainability 15 03104 g0a6
Figure A7. Revenue potential for waste materials in US$ (106) (+1 year lifespan).
Sustainability 15 03104 g0a7
Figure A8. (a) Total revenue potential for precious and other materials (b) revenue potential for precious materials in US$ (+1 year lifespan).
Sustainability 15 03104 g0a8
Table A4. Average weight coefficients of each materials in unit mobile phones [111,112].
ElementsCoefficient of Cell PhonesCoefficient of Smart Phones
Ag11.208
Al11.117
Au11.024
Co10.934
Cu10.945
Ni12.158
Pb13.977
Pd11.087
Pt11.000
Zn11.199
Table A5. Rate of subscribers and generated waste material quantities (tonnes) from cell phone (CP) and smart phone (SP).
YearRate of 2G Subscribers Rate of 3G + 4.5G Subscribers Total Waste CP RateTotal Waste SP Rate PtAgCoPdAu
CPSPCPSPCPSPCPSPCPSP
2001100010000.010.000.370.009.640.000.020.000.060.00
2002100010000.010.000.410.0010.570.000.030.000.060.00
2003100010000.010.000.460.0011.780.000.030.000.070.00
2004100010000.010.000.520.0013.530.000.030.000.080.00
2005100010000.010.000.640.0016.420.000.040.000.100.00
2006100010000.010.000.770.0019.980.000.050.000.120.00
2007100010000.020.000.990.0025.620.000.060.000.150.00
2008100010000.020.001.270.0032.750.000.080.000.200.00
2009100010000.020.001.500.0038.800.000.090.000.230.00
201068.5731.4367.3232.680.020.011.050.5829.4212.600.070.030.170.08
201151.9748.0350.8749.130.010.020.830.9224.2420.930.050.050.140.13
201238.2461.7637.4062.600.010.020.641.2519.5029.420.040.070.110.18
201329.2870.7228.6471.360.010.020.501.4515.4734.920.030.090.090.22
201418.8681.1418.4681.540.010.030.331.6910.3741.680.020.100.060.26
201512.7487.2612.4887.520.000.030.221.857.2446.330.020.110.040.28
20165.9794.035.8594.150.000.030.112.053.5552.200.010.130.020.32
20173.9796.033.9096.100.000.040.072.152.4454.990.010.130.010.33
20182.6697.342.6097.400.000.040.052.221.6656.830.000.140.010.34
20192.2497.762.2097.800.000.040.042.211.3956.750.000.140.010.34
20202.3697.642.3197.690.000.040.042.241.4957.600.000.140.010.35

References

  1. Clarke, C.; Williams, I.D.; Turner, D.A. Evaluating the carbon footprint of WEEE management in the UK. Resour. Conserv. Recycl. 2019, 141, 465–473. [Google Scholar] [CrossRef]
  2. Zhang, S.; Ding, Y.; Liu, B.; Chang, C.-c. Supply and demand of some critical metals and present status of their recycling in WEEE. Waste Manag. 2017, 65, 113–127. [Google Scholar] [CrossRef]
  3. Forti, V.; Balde, C.P.; Kuehr, R.; Bel, G. The Global E-Waste Monitor 2020: Quantities, Flows and The Circular Economy Potential; United Nations University (UNU)/United Nations Institute for Training and Research (UNITAR): Bonn, Germany; International Telecommunication Union (ITU): Geneva, Switzerland; International Solid Waste Association (ISWA): Rotterdam, The Netherlands, 2020. [Google Scholar]
  4. Pan, X.; Wong, C.W.; Li, C. Circular economy practices in the waste electrical and electronic equipment (WEEE) industry: A systematic review and future research agendas. J. Clean. Prod. 2022, 365, 132671. [Google Scholar] [CrossRef]
  5. Stahel, W.R. The circular economy. Nature 2016, 531, 435–438. [Google Scholar] [CrossRef] [PubMed]
  6. Corona, B.; Shen, L.; Reike, D.; Carreón, J.R.; Worrell, E. Towards sustainable development through the circular economy—A review and critical assessment on current circularity metrics. Resour. Conserv. Recycl. 2019, 151, 104498. [Google Scholar] [CrossRef]
  7. T. C. Ministry of Environment and Urbanization. Waste Electrical and Electronic Equipment Control Regulation; (2012); T. C. Ministry of Environment and Urbanization: Ankara, Turkey, 2012. (In Turkish)
  8. T. C. Ministry of Industry and Technology. Ankara Province Waste Electrical and Electronic Equipment Recycling Facility Pre-Feasibility Report; T. C. Ministry of Environment and Urbanization: Ankara, Turkey, 2021. (In Turkish)
  9. Matthews, H.S.; McMichael, F.C.; Hendrickson, C.T.; Hart, D.J. Disposition and End-of-Life Options for Personal Computers; Carnegie Mellon University: Pittsburgh, PA, USA, 1997. [Google Scholar]
  10. Lohse, J.; Winteler, S.; Wulf-Schnabel, J. Collection targets for waste from electrical and electronic equipment (WEEE) the directorate general (DG XI) environment. In Nuclear Safety and Civil Protection of the Commission of the European Communities; Okopol Institute fur Okologie und Politik: Hamburg, Germany, 1998. [Google Scholar]
  11. Nathani, C.; Arnsberg, W. Materialfluß spezifischer Abfallarten und Abfallkennziffern bedeutender Bereiche–Endbericht Teil I. In Herausgegeben von Fraunhofer-Institut für Systemtechnik und Innovationsforschung (ISI). Karlsruhe; Peter Lang: Berna, Switzerland, 1998. [Google Scholar]
  12. Baldé, C.P.; Forti, V.; Gray, V.; Kuehr, R.; Stegmann, P. The Global E-Waste Monitor 2017: Quantities, Flows and Resources; United Nations University (UNU): Bonn, Germany; International Telecommunication Union (ITU): Geneva, Switzerland; International Solid Waste Association (ISWA): Vienna, Austria, 2017. [Google Scholar]
  13. Tasaki, T.; Takasuga, T.; Osako, M.; Sakai, S. Substance flow analysis of brominated flame retardants and related compounds in waste TV sets in Japan. Waste Manag. 2004, 24, 571–580. [Google Scholar] [CrossRef]
  14. Streicher-Porte, M.; Widmer, R.; Jain, A.; Bader, H.-P.; Scheidegger, R.; Kytzia, S. Key drivers of the e-waste recycling system: Assessing and modelling e-waste processing in the informal sector in Delhi. Environ. Impact Assess. Rev. 2005, 25, 472–491. [Google Scholar] [CrossRef]
  15. Peralta, G.L.; Fontanos, P.M. E-waste issues and measures in the Philippines. J. Mater. Cycles Waste Manag. 2006, 8, 34–39. [Google Scholar] [CrossRef]
  16. Jain, A.; Sareen, R. E-waste assessment methodology and validation in India. J. Mater. Cycles Waste Manag. 2006, 8, 40–45. [Google Scholar] [CrossRef]
  17. Kumar, P.; Shrihari, S. Estimation and material flow analysis of waste electrical and electronic equipment (WEEE)–a case study of Mangalore City, Karnataka, India. In Proceedings of the International Conference on Sustainable Solid Waste Management, Chennai, India, 5–7 September 2007; pp. 5–7. [Google Scholar]
  18. Oguchi, M.; Kameya, T.; Yagi, S.; Urano, K. Product flow analysis of various consumer durables in Japan. Resour. Conserv. Recycl. 2008, 52, 463–480. [Google Scholar] [CrossRef]
  19. Yang, Y.; Williams, E. Logistic model-based forecast of sales and generation of obsolete computers in the U.S. Technol. Forecast. Soc. Change 2009, 76, 1105–1114. [Google Scholar] [CrossRef]
  20. Walk, W. Forecasting quantities of disused household CRT appliances--a regional case study approach and its application to Baden-Wurttemberg. Waste Manag. 2009, 29, 945–951. [Google Scholar] [CrossRef] [PubMed]
  21. Robinson, B.H. E-waste: An assessment of global production and environmental impacts. Sci. Total Environ. 2009, 408, 183–191. [Google Scholar] [CrossRef] [PubMed]
  22. Dwivedy, M.; Mittal, R.K. Estimation of future outflows of e-waste in India. Waste Manag. 2010, 30, 483–491. [Google Scholar] [CrossRef] [PubMed]
  23. Steubing, B.; Boni, H.; Schluep, M.; Silva, U.; Ludwig, C. Assessing computer waste generation in Chile using material flow analysis. Waste Manag. 2010, 30, 473–482. [Google Scholar] [CrossRef]
  24. Dwivedy, M.; Mittal, R.K. Future trends in computer waste generation in India. Waste Manag. 2010, 30, 2265–2277. [Google Scholar] [CrossRef]
  25. Chung, S.S.; Lau, K.Y.; Zhang, C. Generation of and control measures for, e-waste in Hong Kong. Waste Manag. 2011, 31, 544–554. [Google Scholar] [CrossRef]
  26. Polak, M.; Drapalova, L. Estimation of end of life mobile phones generation: The case study of the Czech Republic. Waste Manag. 2012, 32, 1583–1591. [Google Scholar] [CrossRef]
  27. Araújo, M.G.; Magrini, A.; Mahler, C.F.; Bilitewski, B. A model for estimation of potential generation of waste electrical and electronic equipment in Brazil. Waste Manag. 2012, 32, 335–342. [Google Scholar] [CrossRef]
  28. Wang, F.; Huisman, J.; Stevels, A.; Balde, C.P. Enhancing e-waste estimates: Improving data quality by multivariate Input-Output Analysis. Waste Manag. 2013, 33, 2397–2407. [Google Scholar] [CrossRef]
  29. Kim, S.; Oguchi, M.; Yoshida, A.; Terazono, A. Estimating the amount of WEEE generated in South Korea by using the population balance model. Waste Manag. 2013, 33, 474–483. [Google Scholar] [CrossRef] [PubMed]
  30. Pant, D. E-waste projection using life-span and population statistics. Int. J. Life Cycle Assess. 2013, 18, 1465–1469. [Google Scholar] [CrossRef]
  31. Öztürk, T. Generation and management of electrical–electronic waste (e-waste) in Turkey. J. Mater. Cycles Waste Manag. 2014, 17, 411–421. [Google Scholar] [CrossRef]
  32. Yazici, B.; Can, Z.S.; Calli, B. Prediction of future disposal of end-of-life refrigerators containing CFC-11. Waste Manag. 2014, 34, 162–166. [Google Scholar] [CrossRef]
  33. Li, B.; Yang, J.; Lu, B.; Song, X. Estimation of retired mobile phones generation in China: A comparative study on methodology. Waste Manag. 2015, 35, 247–254. [Google Scholar] [CrossRef]
  34. Kalmykova, Y.; Patricio, J.; Rosado, L.; Berg, P.E. Out with the old, out with the new--The effect of transitions in TVs and monitors technology on consumption and WEEE generation in Sweden 1996–2014. Waste Manag. 2015, 46, 511–522. [Google Scholar] [CrossRef]
  35. Alavi, N.; Shirmardi, M.; Babaei, A.; Takdastan, A.; Bagheri, N. Waste electrical and electronic equipment (WEEE) estimation: A case study of Ahvaz City, Iran. J. Air Waste Manag. Assoc. 2015, 65, 298–305. [Google Scholar] [CrossRef]
  36. Ikhlayel, M. Differences of methods to estimate generation of waste electrical and electronic equipment for developing countries: Jordan as a case study. Resour. Conserv. Recycl. 2016, 108, 134–139. [Google Scholar] [CrossRef]
  37. Petridis, N.E.; Stiakakis, E.; Petridis, K.; Dey, P. Estimation of computer waste quantities using forecasting techniques. J. Clean. Prod. 2016, 112, 3072–3085. [Google Scholar] [CrossRef]
  38. Zhao, M.; Zhao, C.; Yu, L.; Li, G.; Huang, J.; Zhu, H.; He, W. Prediction and Analysis of WEEE in China Based on the Gray Model. Procedia Environ. Sci. 2016, 31, 925–934. [Google Scholar] [CrossRef] [Green Version]
  39. Salihoğlu, G.; Kahraman, A.E. Electrical and Electronical Waste Generation in Turkey: Bursa Case Study. Uludağ Univ. J. Fac. Eng. 2016, 21, 95. [Google Scholar] [CrossRef]
  40. Golev, A.; Schmeda-Lopez, D.R.; Smart, S.K.; Corder, G.D.; McFarland, E.W. Where next on e-waste in Australia? Waste Manag. 2016, 58, 348–358. [Google Scholar] [CrossRef]
  41. Guo, X.; Yan, K. Estimation of obsolete cellular phones generation: A case study of China. Sci. Total Environ. 2017, 575, 321–329. [Google Scholar] [CrossRef]
  42. Gusukuma, M.; Kahhat, R. Electronic waste after a digital TV transition: Material flows and stocks. Resour. Conserv. Recycl. 2018, 138, 142–150. [Google Scholar] [CrossRef]
  43. Tran, H.P.; Schaubroeck, T.; Nguyen, D.Q.; Ha, V.H.; Huynh, T.H.; Dewulf, J. Material flow analysis for management of waste TVs from households in urban areas of Vietnam. Resour. Conserv. Recycl. 2018, 139, 78–89. [Google Scholar] [CrossRef]
  44. Wang, M.; You, X.; Li, X.; Liu, G. Watch more, waste more? A stock-driven dynamic material flow analysis of metals and plastics in TV sets in China. J. Clean. Prod. 2018, 187, 730–739. [Google Scholar] [CrossRef]
  45. Kececi, B.; Dengiz, O.; Dengiz, B.; Sumer, E.; Kilic, A.; Ceki, E.; Inan, B.; Cicek, S. WEEE estimation and determination of collection points: A case for the Municipality of Cankaya. Pamukkale Univ. J. Eng. Sci. 2018, 24, 692–704. [Google Scholar] [CrossRef]
  46. Thiébaud-Müller, E.; Hilty, L.M.; Schluep, M.; Widmer, R.; Faulstich, M. Service Lifetime, Storage Time, and Disposal Pathways of Electronic Equipment: A Swiss Case Study. J. Ind. Ecol. 2018, 22, 196–208. [Google Scholar] [CrossRef]
  47. Duman, G.M.; Kongar, E.; Gupta, S.M. Estimation of electronic waste using optimized multivariate grey models. Waste Manag. Res. 2019, 95, 241–249. [Google Scholar] [CrossRef]
  48. Sajid, M.; Syed, J.H.; Iqbal, M.; Abbas, Z.; Hussain, I.; Baig, M.A. Assessing the generation, recycling and disposal practices of electronic/electrical-waste (E-Waste) from major cities in Pakistan. Waste Manag. 2019, 84, 394–401. [Google Scholar] [CrossRef]
  49. Ravindra, K.; Mor, S. E-waste generation and management practices in Chandigarh, India and economic evaluation for sustainable recycling. J. Clean. Prod. 2019, 221, 286–294. [Google Scholar] [CrossRef]
  50. Abbondanza, M.N.M.; Souza, R.G. Estimating the generation of household e-waste in municipalities using primary data from surveys: A case study of Sao Jose dos Campos, Brazil. Waste Manag. 2019, 85, 374–384. [Google Scholar] [CrossRef]
  51. Golev, A.; Corder, G.D.; Rhamdhani, M.A. Estimating flows and metal recovery values of waste printed circuit boards in Australian e-waste. Miner. Eng. 2019, 137, 171–176. [Google Scholar] [CrossRef]
  52. Gonda, L.; D’Ans, P.; Degrez, M. A comparative assessment of WEEE collection in an urban and rural context: Case study on desktop computers in Belgium. Resour. Conserv. Recycl. 2019, 142, 131–142. [Google Scholar] [CrossRef]
  53. Islam, M.T.; Huda, N. E-waste in Australia: Generation estimation and untapped material recovery and revenue potential. J. Clean. Prod. 2019, 237, 117787. [Google Scholar] [CrossRef]
  54. Duman, G.M.; Kongar, E.; Gupta, S.M. Predictive analysis of electronic waste for reverse logistics operations: A comparison of improved univariate grey models. Soft Comput. 2020, 24, 15747–15762. [Google Scholar] [CrossRef]
  55. Kosai, S.; Kishita, Y.; Yamasue, E. Estimation of the metal flow of WEEE in Vietnam considering lifespan transition. Resour. Conserv. Recycl. 2020, 154, 104621. [Google Scholar] [CrossRef]
  56. Li, J.; Song, X.; Yang, D.; Li, B.; Lu, B. Simulating the interprovincial movements of waste mobile phones in China based on the current disassembly capacity. J. Clean. Prod. 2020, 244, 118776. [Google Scholar] [CrossRef]
  57. Kazancoglu, Y.; Ozbiltekin, M.; Ozen, Y.D.O.; Sagnak, M. A proposed sustainable and digital collection and classification center model to manage e-waste in emerging economies. J. Enterp. Inf. Manag. 2020, 34, 267–291. [Google Scholar] [CrossRef]
  58. Ryan-Fogarty, Y.; Coughlan, D.; Fitzpatrick, C. Quantifying WEEE arising in scrap metal collections: Method development and application in Ireland. J. Ind. Ecol. 2021, 25, 1021–1033. [Google Scholar] [CrossRef]
  59. Wang, F.; Yu, L.; Wu, A. Forecasting the electronic waste quantity with a decomposition-ensemble approach. Waste Manag. 2021, 120, 828–838. [Google Scholar] [CrossRef]
  60. Zeng, X.; Ali, S.H.; Li, J. Estimation of waste outflows for multiple product types in China from 2010–2050. Sci. Data 2021, 8, 15. [Google Scholar] [CrossRef]
  61. Zhang, S.; Gu, Y.; Tang, A.; Li, B.; Li, B.; Pan, D.; Wu, Y. Forecast of future yield for printed circuit board resin waste generated from major household electrical and electronic equipment in China. J. Clean. Prod. 2021, 283, 124575. [Google Scholar] [CrossRef]
  62. Koshta, N.; Patra, S.; Singh, S.P. Estimation of E-waste at micro level for reverse logistics: A case of Delhi. J. Clean. Prod. 2021, 314, 128063. [Google Scholar] [CrossRef]
  63. Kastanaki, E.; Giannis, A. Forecasting quantities of critical raw materials in obsolete feature and smart phones in Greece: A path to circular economy. J. Environ. Manag. 2022, 114566. [Google Scholar] [CrossRef]
  64. Sakthivel, U.; Swaminathan, G.; Anis, J. Strategies for Quantifying Metal Recovery from Waste Electrical and Electronic Equipment (WEEE/E-waste) Using Mathematical Approach. Process Integr. Optim. Sustain. 2022, 6, 781–790. [Google Scholar] [CrossRef]
  65. Li, A.; Li, B.; Lu, B.; Yang, D.; Hou, S.; Song, X. Generation estimation and material flow analysis of retired mobile phones in China. Environ. Sci. Pollut. Res. 2022, 29, 75626–75635. [Google Scholar] [CrossRef]
  66. Owusu-Sekyere, K.; Batteiger, A.; Afoblikame, R.; Hafner, G.; Kranert, M. Assessing data in the informal e-waste sector: The Agbogbloshie Scrapyard. Waste Manag. 2022, 139, 158–167. [Google Scholar] [CrossRef]
  67. European Parliament, European Council. Directive 2012/19/EU of the European Parliament and of the Council of 4 July 2012 on waste electrical and electronic equipment, WEEE. Off. J. Eur. Union L 2012, 197, 38–71. [Google Scholar]
  68. Bogar, Z.O.; Capraz, O.; Güngör, A. An Overview of Methods Used for Estimating E-waste Amount. In Electronic Waste Management and Treatment Technology; Elsevier: Amsterdam, The Netherlands, 2019; pp. 53–75. [Google Scholar] [CrossRef]
  69. Thiebaud, E.; Hilty, L.M.; Schluep, M.; Faulstich, M. Use, Storage, and Disposal of Electronic Equipment in Switzerland. Environ. Sci. Technol. 2017, 51, 4494–4502. [Google Scholar] [CrossRef]
  70. Çimen, Ö. Construction and built environment in circular economy: A comprehensive literature review. J. Clean. Prod. 2021, 305, 127180. [Google Scholar] [CrossRef]
  71. Sohal, A.; De Vass, T. Australian SME’s experience in transitioning to circular economy. J. Bus. Res. 2022, 142, 594–604. [Google Scholar] [CrossRef]
  72. Heshmati, A. A Review of the Circular Economy and its Implementation. Int. J. Green Econ. 2017, 11, 251–288. [Google Scholar] [CrossRef]
  73. Reike, D.; Vermeulen, W.J.; Witjes, S. The circular economy: New or refurbished as CE 3.0?—Exploring controversies in the conceptualization of the circular economy through a focus on history and resource value retention options. Resour. Conserv. Recycl. 2018, 135, 246–264. [Google Scholar] [CrossRef]
  74. Shevchenko, T.; Saidani, M.; Ranjbari, M.; Kronenberg, J.; Danko, Y.; Laitala, K. Consumer behavior in the circular economy: Developing a product-centric framework. J. Clean. Prod. 2023, 384, 135568. [Google Scholar] [CrossRef]
  75. D’Adamo, I.; Rosa, P.; Terzi, S. Challenges in waste electrical and electronic equipment management: A profitability assessment in three European countries. Sustainability 2016, 8, 633. [Google Scholar] [CrossRef]
  76. Bressanelli, G.; Saccani, N.; Pigosso, D.C.; Perona, M. Circular Economy in the WEEE industry: A systematic literature review and a research agenda. Sustain. Prod. Consum. 2020, 23, 174–188. [Google Scholar] [CrossRef]
  77. Murthy, V.; Ramakrishna, S. A review on global E-waste management: Urban mining towards a sustainable future and circular economy. Sustainability 2022, 14, 647. [Google Scholar] [CrossRef]
  78. Islam, M.T.; Huda, N. Reverse logistics and closed-loop supply chain of Waste Electrical and Electronic Equipment (WEEE)/E-waste: A comprehensive literature review. Resour. Conserv. Recycl. 2018, 137, 48–75. [Google Scholar] [CrossRef]
  79. Li, J.; Liu, L.; Zhao, N.; Yu, K.; Zheng, L. Regional or global WEEE recycling. Where to go? Waste Manag. 2013, 33, 923–934. [Google Scholar] [CrossRef]
  80. Sepúlveda, A.; Schluep, M.; Renaud, F.G.; Streicher, M.; Kuehr, R.; Hagelüken, C.; Gerecke, A.C. A review of the environmental fate and effects of hazardous substances released from electrical and electronic equipments during recycling: Examples from China and India. Environ. Impact Assess. Rev. 2010, 30, 28–41. [Google Scholar] [CrossRef]
  81. He, W.; Li, G.; Ma, X.; Wang, H.; Huang, J.; Xu, M.; Huang, C. WEEE recovery strategies and the WEEE treatment status in China. J. Hazard. Mater. 2006, 136, 502–512. [Google Scholar] [CrossRef]
  82. Ongondo, F.O.; Williams, I.D.; Cherrett, T.J. How are WEEE doing? A global review of the management of electrical and electronic wastes. Waste Manag. 2011, 31, 714–730. [Google Scholar] [CrossRef]
  83. Pérez-Belis, V.; Bovea, M.D.; Ibáñez-Forés, V. An in-depth literature review of the waste electrical and electronic equipment context: Trends and evolution. Waste Manag. Res. 2015, 33, 3–29. [Google Scholar] [CrossRef]
  84. Widmer, R.; Oswald-Krapf, H.; Sinha-Khetriwal, D.; Schnellmann, M.; Böni, H. Global perspectives on e-waste. Environ. Impact Assess. Rev. 2005, 25, 436–458. [Google Scholar] [CrossRef]
  85. Waste Electrical and Electronic Equipment Control Regulation. 2022; (In Turkish). Available online: https://www.resmigazete.gov.tr/eskiler/2022/12/20221226-1.htm (accessed on 20 January 2023).
  86. Restriction of the Use of Certain Hazardous Substances in Electrical and Electronic Equipment Regulations. 2022; (In Turkish). Available online: https://webdosya.csb.gov.tr/db/cygm/icerikler/yon-32055eee-20230102204403.pdf (accessed on 20 January 2023).
  87. T. C. Ministry of Environment and Urbanization Waste Statistics Bulletin. 2020; (In Turkish). Available online: https://webdosya.csb.gov.tr/db/ced/icerikler/2020-yili-atik-istat-st-kler--bulten--rev-ze12012023-20230112135036.pdf (accessed on 25 January 2023).
  88. Akpulat, O. Beyond Waste: Current Situation of Electronic Waste in the World and Turkey. Vodafone, S360, REC Türkiye. 2020. (In Turkish). Available online: https://rec.org.tr/wp-content/uploads/2020/06/AtiginOtesinde2020.pdf (accessed on 25 January 2023).
  89. Information Technology and Communication Agency, Activity Reports (2001–2021). (In Turkish). Available online: https://www.btk.gov.tr/faaliyet-raporlari (accessed on 13 November 2022).
  90. Statistics on Devices with Electronic Identity Information (2007–2015). (In Turkish). Available online: https://www.btk.gov.tr/elektronik-kimlik-bilgisini-haiz-cihazlara-dair-istatistikler (accessed on 13 November 2022).
  91. T. C. Ministry of Development. 11th Development Plan; T. C. Ministry of Development: Ankara, Turkey, 2018. (In Turkish)
  92. Regulation Amending the Regulation on Registration of Devices Carrying Electronic Identity Information. 2021; (In Turkish). Available online: https://www.resmigazete.gov.tr/eskiler/2021/02/20210220-16.htm (accessed on 30 November 2022).
  93. Forti, V.; Baldé, K.; Kuehr, R. E-Waste Statistics: Guidelines on Classifications, Reporting and Indicators; United Nations University: Bonn, Germany, 2018. [Google Scholar]
  94. Park, J.-a.; Hong, S.-j.; Kim, I.; Lee, J.-y.; Hur, T. Dynamic material flow analysis of steel resources in Korea. Resour. Conserv. Recycl. 2011, 55, 456–462. [Google Scholar] [CrossRef]
  95. Yan, L.; Wang, A.; Chen, Q.; Li, J. Dynamic material flow analysis of zinc resources in China. Resour. Conserv. Recycl. 2013, 75, 23–31. [Google Scholar] [CrossRef]
  96. Pegels, C.C. Exponential forecasting: Some new variations. Manag. Sci. 1969, 311–315. [Google Scholar]
  97. Gardner, J.; Everette, S. Exponential smoothing: The state of the art. J. Forecast. 1985, 4, 1–28. [Google Scholar] [CrossRef]
  98. Hyndman, R.J.; Koehler, A.B.; Snyder, R.D.; Grose, S. A state space framework for automatic forecasting using exponential smoothing methods. Int. J. Forecast. 2002, 18, 439–454. [Google Scholar] [CrossRef]
  99. Taylor, J.W. Exponential smoothing with a damped multiplicative trend. Int. J. Forecast. 2003, 19, 715–725. [Google Scholar] [CrossRef] [Green Version]
  100. Hyndman, R.J.; Khandakar, Y. Automatic time series forecasting: The forecast package for R. J. Stat. Softw. 2008, 27, 1–22. [Google Scholar] [CrossRef]
  101. Yasar, H.; Kilimci, Z.H. US Dollar/Turkish lira exchange rate forecasting model based on deep learning Methodologies and Time Series Analysis. Symmetry 2020, 12, 1553. [Google Scholar] [CrossRef]
  102. Bass, F.M. A new product growth for model consumer durables. Manag. Sci. 1969, 15, 215–227. [Google Scholar] [CrossRef]
  103. Chatfield, C. Time-Series Forecasting; Chapman and Hall/CRC: Boca Raton, FL, USA, 2000. [Google Scholar] [CrossRef]
  104. Christodoulos, C.; Michalakelis, C.; Varoutas, D. Forecasting with limited data: Combining ARIMA and diffusion models. Technol. Forecast. Soc. Change 2010, 77, 558–565. [Google Scholar] [CrossRef]
  105. Cucchiella, F.; D’Adamo, I.; Koh, S.L.; Rosa, P. Recycling of WEEEs: An economic assessment of present and future e-waste streams. Renew. Sustain. Energy Rev. 2015, 51, 263–272. [Google Scholar] [CrossRef]
  106. Gupta, N.; Trivedi, A.; Hait, S. Material composition and associated toxicological impact assessment of mobile phones. J. Environ. Chem. Eng. 2020, 9, 104603. [Google Scholar] [CrossRef]
  107. Sahan, M.; Kucuker, M.A.; Demirel, B.; Kuchta, K.; Hursthouse, A. Determination of Metal Content of Waste Mobile Phones and Estimation of Their Recovery Potential in Turkey. Int. J. Environ. Res. Public Health 2019, 16, 887. [Google Scholar] [CrossRef]
  108. Daily Metal Price, Metal Spot Prices by Date. Available online: https://www.dailymetalprice.com/metaltables.php?d=2022-04-0 (accessed on 1 April 2022).
  109. Magalini, F.; Wang, F.; Huisman, J.; Kuehr, R.; Baldé, K.; van Straalen, V.; Hestin, M.; Lecerf, L.; Sayman, U.; Akpulat, O. Study on Collection Rates of Waste Electrical and Electronic Equipment (WEEE); European Commission: Brussels, Belgium, 2014. [Google Scholar]
  110. Information Technologies and Communications Authority, Sectoral Report, Annual Statistical Bulletin on the Electronic Communications Sector by Province. (In Turkish). Available online: https://www.btk.gov.tr/uploads/pages/yillik-il-istatistikleri/elektronik-haberlesme-sektorune-iliskin-il-bazinda-yillik-istatistik-bulteni.pdf (accessed on 23 December 2022).
  111. Singh, N.; Duan, H.; Yin, F.; Song, Q.; Li, J. Characterizing the materials composition and recovery potential from waste mobile phones: A comparative evaluation of cellular and smart phones. ACS Sustain. Chem. Eng. 2018, 6, 13016–13024. [Google Scholar] [CrossRef]
  112. Singh, N.; Duan, H.; Ogunseitan, O.A.; Li, J.; Tang, Y. Toxicity trends in E-Waste: A comparative analysis of metals in discarded mobile phones. J. Hazard. Mater. 2019, 380, 120898. [Google Scholar] [CrossRef] [Green Version]
  113. He, P.; Hu, G.; Wang, C.; Hewage, K.; Sadiq, R.; Feng, H. Analyzing present and future availability of critical high-tech minerals in waste cellphones: A case study of India. Waste Manag. 2021, 119, 275–284. [Google Scholar] [CrossRef]
  114. Rahmani, M.; Nabizadeh, R.; Yaghmaeian, K.; Mahvi, A.H.; Yunesian, M. Estimation of waste from computers and mobile phones in Iran. Resour. Conserv. Recycl. 2014, 87, 21–29. [Google Scholar] [CrossRef]
  115. Akpulat, O. Recyclable Waste. Marmara Municipalities Unions, Journal of City and Society. 2020, p. 16. (In Turkish). Available online: https://mbbkulturyayinlari.com/dergiler/sehir-toplum-sayi-16/ (accessed on 30 December 2022).
Figure 1. Summary of the methodology-based literature analysis.
Sustainability 15 03104 g001
Figure 2. The system boundary of the proposed study (*sensitivity analysis applied).
Sustainability 15 03104 g002
Figure 3. Curves for α = 1.52 and β = 5.62; (a) PDF curve, (b) CDF curve.
Sustainability 15 03104 g003
Figure 4. Estimated WMPs quantity for 2001–2020 using the DD method.
Sustainability 15 03104 g004
Figure 5. Estimated and forecasted WMP quantities for 2001–2035 (unit).
Sustainability 15 03104 g005
Figure 6. Waste materials quantities in tonnes.
Sustainability 15 03104 g006
Figure 7. Precious materials quantities in tonnes.
Sustainability 15 03104 g007
Figure 8. Revenue potential for waste materials.
Sustainability 15 03104 g008
Figure 9. (a) Total revenue potential for precious and other materials; (b) revenue potential for precious materials in US$.
Sustainability 15 03104 g009
Figure 10. Generated WMP quantity in different lifespans for 2001–2020.
Sustainability 15 03104 g010
Figure 11. Generated WMP in different lifespans.
Sustainability 15 03104 g011
Figure 12. (a) Number of subscribers; (b) percentage distribution of subscribers.
Sustainability 15 03104 g012
Figure 13. Potential material revenues based on the time value of money (million US$).
Sustainability 15 03104 g013
Table 2. E-waste estimation and forecasting literature analysis for Turkey.
Criteria/Study[31][32][39][45][57]This Study
Quantification
Mobile Phone
Lifespan Distribution
Sales Data
Considering CE
Material Analysis
All Turkey (not local)
Future Projection
Table 3. Algorithm of the proposed model.
Step No.Explanation
1:Input: Put on market data, lifespan profile
2:Estimate e-wastet quantity/by DD method, ∀ t/
3:Select a convenient forecasting method/ by minimizing error in the estimation period/
4:Forecast e-wastet quantity for future/ by using selected forecasting technique, ∀ t/
5:Calculate material potential/∀ t/
6:Calculate revenue potential/∀ t/
7:Output: Generated e-waste quantity/in units, ∀ t/,
Material and revenue potential of generated e-waste quantity/*in tonnes and million USD
Table 4. Algorithm of the forecasting evaluation and method selection for projection.
Step No.Explanation
1:Input: Estimated e-waste quantity (outputs of e-waste estimation by DD method)/in units, ∀ t/
2:Modelling of estimated e-waste quantity by minimizing SSE/by using SES, Holt’s, Logistic, Gompertz, Logarithmic, Bass, ARIMA, ∀ t/
3:Calculate MAPE, RMSE, and SSE values
4:Select the forecasting model which gives minimum error
5:Output: Selected forecasting model for future e-waste projection
Table 5. Algorithm of the material analysis.
Step No.Explanation
1:Input: Generated e-waste quantities, the quantity of each material in a product, price of each material/∀ t/
2:Calculate the total material quantity for each selected material/∀ t/
3:Calculate revenue for each selected material for the unit product/∀ t/
4:Calculate the total revenue for each selected material/∀ t/
5:Calculate revenue potential/∀ t/
Table 6. Amount of materials and economic values of mobile phones.
MaterialsQuantity
(g/Unit) [105]
Price (US$/Tonne) (April 2022) [108] Revenue (US$/Unit)
Gold0.03862,160,0002.36208
Palladium0.01573,190,0001.09785
Cobalt6.382,0000.5166
Silver0.24793,801.930.19051246
Copper1410,323.150.1445241
Platinum0.00431,680,0000.12672
Nickel1.533,2170.0498255
Aluminium2.934500.010005
Zinc143390.004339
Lead0.62450.090.00147005
Table 7. Modelling errors for each method.
Method/ErrorMAPE (%) RMSE   ( × 10 6 ) SSE   ( × 10 12 )
SES8.44440.49324.8647
Holt’s Method2.65700.18690.6987
Logistic5.64260.21590.9320
Gompertz8.23050.31411.9727
Logarithmic26.59071.006620.2645
Bass8.48230.44363.9352
ARIMA12.29420.51575.3196
Table 8. Effects of lifespan change on the outputs.
OutputsBased+1 Year−1 Year
Generated WMPs ( × 10 6 )9.2869.0899.3614
Waste material (tonnes)247.02241.79249.02
Waste precious material (tonnes)2.7952.7362.818
Material revenue (US$  ×   10 6 )41.82440.93842.163
Precious material revenue (US$  ×   10 6 )35.07534.33235.360
Table 9. Effect of changing each material quantity in a mobile phone by 1%.
ChangeUnitAuPdCoAuPtCuNiAlZnPbTotal
Material Quantitykg3.531.39585.0322.660.371300139.29269.3092.8655.722470.14
Table 10. Effect of changing each material price for a mobile phone by 1%.
ChangeUnitAuPdCoAuPtCuNiAlZnPbTotal
Revenue US$219,346101,94847,97217,69111,76713,4214627929403137418,240
Table 11. Generated WMP for different countries for 2020.
CountryEstimated WMP
(Million Units)
Amount of WMP
(per Capita)
Amount of WMP
15–64 Ages (per Capita)
References
Czech Republic~3.50.3270.510[26]
China8770.6090.884[41]
Australia11.140.4340.673[53]
Greece~2.250.2100.328[63]
India~1800.1300.194[113]
Iran~750.8931.300[114]
Turkey9.290.1100.164This study
Disclaimer/Publisher’s Note: The statements, opinions and data contained in all publications are solely those of the individual author(s) and contributor(s) and not of MDPI and/or the editor(s). MDPI and/or the editor(s) disclaim responsibility for any injury to people or property resulting from any ideas, methods, instructions or products referred to in the content.

