Article

A Hierarchical Coordinated Control Strategy for Power Quality Improvement in Energy Router Integrated Active Distribution Networks

1
College of Electrical Engineering and Automation, Fuzhou University, Fuzhou 350108, China
2
Fujian Province University Engineering Research Center of Smart Distribution Grid Equipment, Fuzhou 350108, China
3
Electrical Engineering Department, Faculty of Engineering, Minia University, Minia 61519, Egypt
*
Authors to whom correspondence should be addressed.
Sustainability 2023, 15(3), 2655; https://doi.org/10.3390/su15032655
Submission received: 22 December 2022 / Revised: 26 January 2023 / Accepted: 28 January 2023 / Published: 1 February 2023
(This article belongs to the Special Issue Smart Grid Technologies and Renewable Energy Applications)

Abstract

:
The energy router (ER) is a current power electronic device which can integrate distributed energy, provide power for different types of loads, and simultaneously realize the free flow of energy. In traditional active distribution networks, power quality is affected due to the access of photovoltaics (PV) and various loads. Hence, this problem can be improved by accessing the ER. This paper shows the power quality improvement of the grid when the ER is used to integrate PV, energy storage, and AC/DC loads. At the same time, an energy coordination strategy for ER is proposed. The IEEE 13 node model is developed to analyze power quality fluctuations when distributed energy and AC/DC loads are directly connected to the grid. For the power quality analysis, five indicators were selected and the hierarchical analysis method was used to obtain the indicators of power quality. After the use of ER under the coordinated control of ER, the energy is distributed twice and the power quality of the grid improves. The feasibility of ER topology and the control strategy have been verified through an established active distribution networks model with ER. It is verified that when the ER is connected to active distribution networks, the power quality improves accordingly, and it can effectively deal with the characteristics of distributed energy fluctuations and improve the flexibility of the power grid.

1. Introduction

Due to energy scarcity and increasing environmental pollution problems, distributed energy sources have gradually emerged. In this context, traditional centralized systems have gradually transitioned to energy internet (EI) systems, which include distributed renewable energy sources (e.g., photovoltaics) and distributed energy storage devices (e.g., batteries) [1]. The generation from distributed energy sources is commonly unpredictable and its capacity depends on weather conditions [2]. The concept of EI, which allows users to interact with each other to optimize resource allocation, has been proposed because of the high cost of balancing supply and demand through large-scale transmission networks [3,4]. When various distributed energy sources are connected to the grid, they can have negative impacts on the distribution network [5,6], such as increased harmonics, lower power factor, voltage flicker, and voltage transients. The equipment to realize power conversion and power transmission in the traditional distribution network is the power transformer. However, with the development of EI and the diversification of power supply forms, the traditional power transformer can no longer meet the requirements of the future power market, let alone optimize the power quality of the distribution network [7,8]. The use of an energy router (ER) can improve power quality and reduce the harm caused by distributed energy grid connection. In the context of EI, the widespread use of ER is an inevitable requirement.
Many approaches have been proposed in the literature to improve power quality. For example, the voltage can be increased by compensating the reactive power through shunt capacitors. However, this approach is inflexible and occupies a great deal of space [9]. For power electronic solutions, power quality improvement can be achieved by a distribution static compensator (DSTATCOM) [10], dynamic voltage restorer (DVR) [11], and unified power quality conditioner (UPQC) [12]. A comprehensive description of the various techniques for power quality improvement is provided in [13]. In fact, no matter how the power quality is compensated, it is compensated after the occurrence of the disturbance. The use of ER, which is completely different, reduces the generation of disturbance at the root. When the ER is in some specific operating modes, the effect of distributed energy sources and loads on the distribution grid can be completely eliminated. At present, the research on ER is divided into two levels: the study of ER monolithic structure, control strategy, and application [14], and the study of ER in distribution networks for energy allocation and trend analysis [15]. When connected to ER, the improvement in power quality is noticeable; however, few researchers have investigated this feature.
In terms of the structure and control strategy of ER, Zhen Li et al. proposed an AC/DC hybrid ER coordination control strategy based on energy storage and voltage stabilization, which uses multiple sets of converters to provide rich AC/DC ports [16]. The authors in [17] proposed an energy management strategy based on Lyapunov optimization for optimal control of energy distribution management. Researching from the combination of ER and grid, literature [18] proposes a two-level modular ER structure that can be applied to DC microgrid clusters to achieve a flexible interconnection of microgrids. The implementation of ER is varied and contains different energy. Jordehi et al. [19] combined wind turbines, batteries, and charging stations to establish a reasonable microgrid model. Based on this model, they focused on the impact of flexible resources such as the start and stop of wind turbines, and carried out power market scheduling. In [20], M. Nasir established a new Energy Hub (EH), which also incorporates biomass energy into the energy system to further reduce operating costs. A. Ahmarinejad [21] proposed a long-term perspective, considering the loss of the system. They used the fuzzy maximum value method to model, optimizing the three goals of total cost, emission, and hub losses. This greatly reduced consumption and provided guidance and advice on the operation of carrier energy systems.
Regarding the functionality of ER, the port design and control strategy design are required. Eventually, in combination with distributed energy, a new model of active distribution networks incorporating ER is developed. Compared with the traditional structure, the power quality of the active distribution networks can be effectively improved.
There are various dimensions and metrics for evaluating the power quality of active distribution networks. Regarding the selection and design of indicators, Ref. [22] proposed a regional grid power quality method considering the characteristics. Ref. [23] relies on the establishment of an active distribution network system for PV, wind power, and loads, and establishes an effective power quality classification through the division of different operating modes. Ghada S. Elbasuony et al. proposed a hierarchical analysis method [24], and through the establishment of weight coefficients, the indicators of the hybrid optical storage system offer a comprehensive evaluation of power quality. Yanchun Xu et al. proposed a distributed networks power quality detection method based on variational mode decomposition (VMD) and detrended fluctuation analysis (DFA) cooperation [25]. This paper starts from the classification of power quality disturbances and addresses the power quality evaluation system. However, there are numerous classification indexes, and the classification accuracy is reduced. Ref. [26] proposes a control scheme adapted to large power systems with input and output constraints, modeled using fuzzy systems, which verifies the feasibility of the control strategy under load fluctuations. S. A. Mansouri [27] considered the information interconnection and sharing of decentralized microgrid structures to design hierarchical models that reduce their complexity, improve the resilience index, and provide a solution for the complex system of the dispatch configuration.
Under the existing research system, for the active distribution networks with integrated source-grid-load-storage, energy dispatching generally must be performed according to the current power flow. Alternatively, extra compensation devices can be added, but none of these methods can eliminate the impact from load fluctuation or energy fluctuation at the root. The difference is that ER takes an entirely different perspective by accommodating source storage and load into a different system. ER carries out energy transfer through the internal DC bus and eventually connects to the distribution grid through the grid-connected port. Under the improved active distribution networks constructed through the ER, the fluctuation of load and new energy can be entirely isolated from the distribution network under some working conditions. Finally, the power quality of the distribution networks can eventually improve.
In response to the development status of active distribution networks with integrated source-network storage and load, a five-port ER topology is proposed. The five ports are respectively connected to the grid, energy storage, AC load, DC load, and PV. At the same time, the corresponding port coordination strategy is designed. In addition, an analytical hierarchy process is used to analyze power quality. It is verified that under the application of ER, the power quality has improved.
The main innovation points of this paper are summarized as follows:
  • A five-port ER with PV, energy storage, grid-connected, AC load, and DC load ports is set up for the current development of active distribution networks. Based on the topology of the ER and the energy flow, a hierarchical control strategy is designed to conform to this structure and achieve a coordinated operation of the five ports and free energy flow.
  • The ER system is integrated into the active distribution network to build an active distribution network system with energy routers. All ports are connected through the DC busbar. At the same time, a port control strategy matching the structure and energy scheduling strategy are designed. The power quality is analyzed using hierarchical analysis, and the feasibility of the ER system and the power quality improvement are verified.
The rest of this paper is organized as follows: Section 2 introduces the system establishment and control realization. Section 3 presents the establishment of the power quality evaluation system. Section 4 shows the simulation analysis and results. Finally, the conclusion of this paper is introduced in Section 5.

2. System Establishment and Control Realization

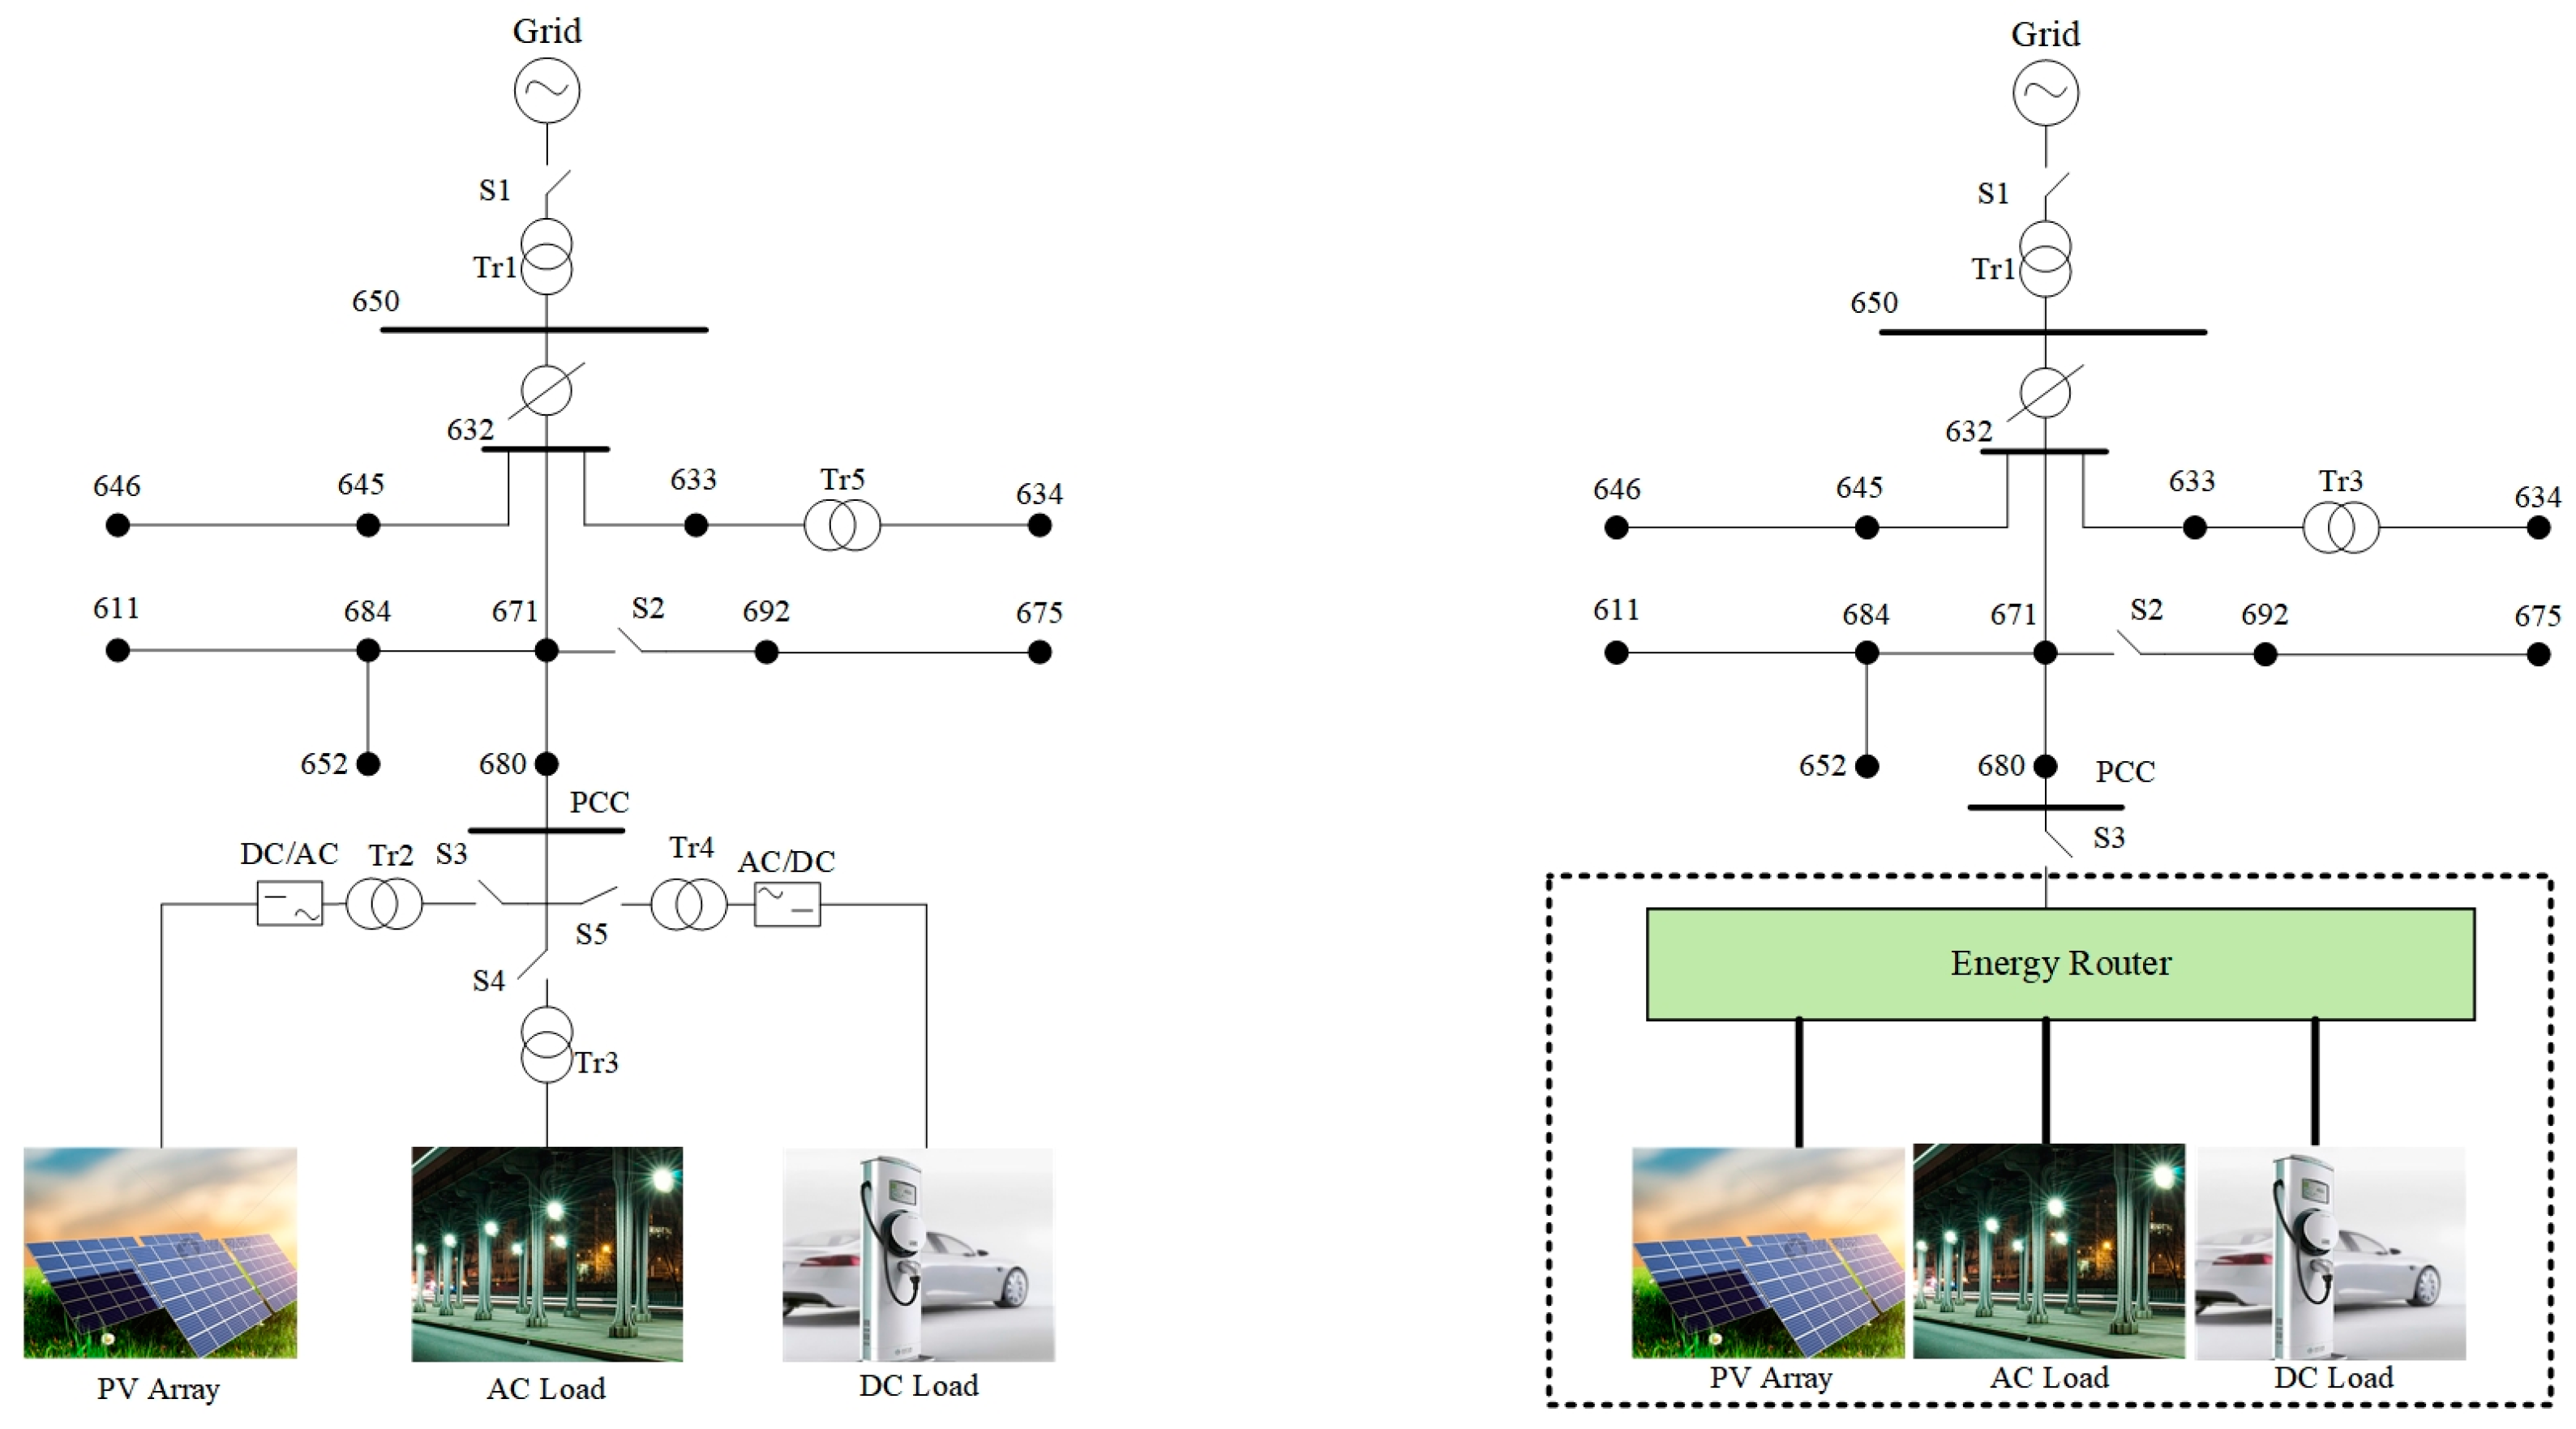
2.1. Power System Structure Establishment

Figure 1 shows the traditional distribution network model and the distribution network model including ER, respectively. The IEEE13 node model is used, which includes PV and AC/DC loads [28,29]. Unlike the traditional distribution network model, a new active distribution networks model containing ER is proposed. In the new system, the PV, AC loads, and DC loads are connected to the distribution network through ER. Due to the use of ER, the traditional power system structure has changed and the power quality will improve.
As shown in Figure 1, there are two different systems. The following sections start from the structure of ER to analyze the changes to the system.

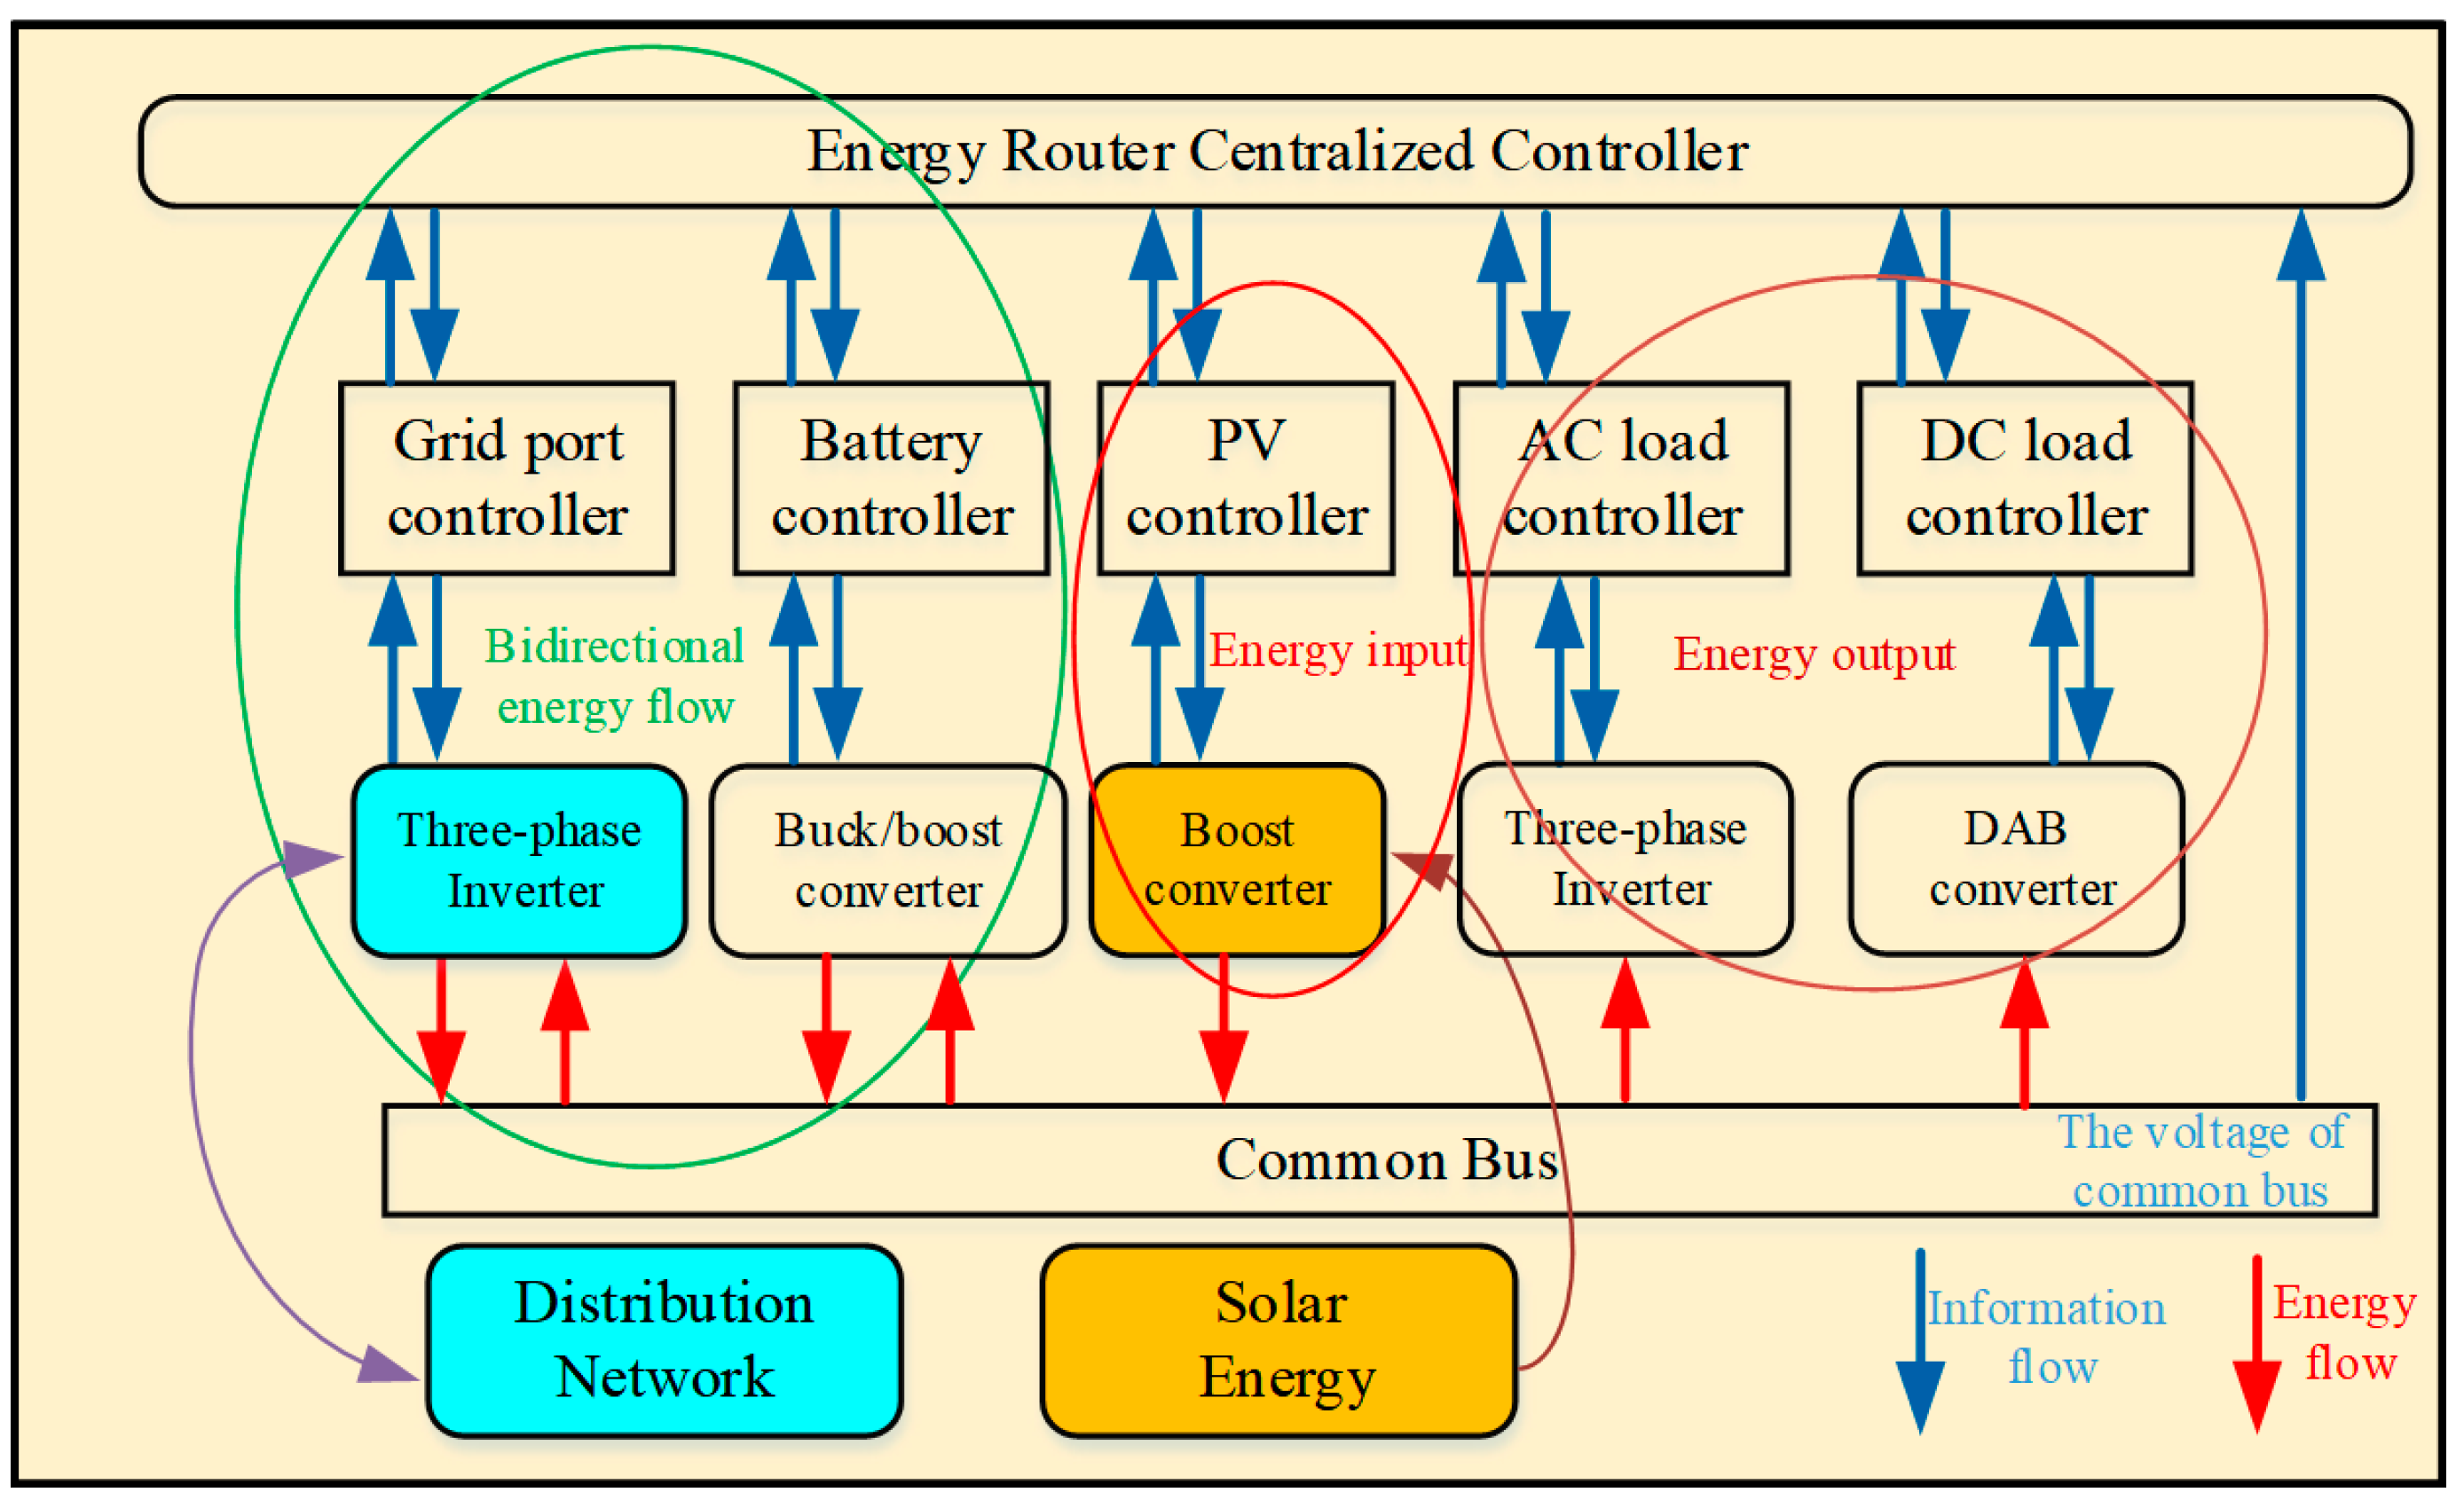
2.2. ER topology Establishment

Aiming at the PV characteristics and the use of AC/DC load, a five-port ER is proposed in this paper. The architecture of a five-port ER is shown in Figure 2. The five ports are a grid-connected port, PV port, energy storage port, DC load port, and AC load port. The grid-connected port is connected to the distribution network. All ports of the ER converge into a DC common bus (CB). All ports of the ER converge into a DC common bus. All devices interact with each other via DC buses.
Combining the characteristics of the distribution network and the actual load conditions, the ER has five external ports, which are connected to the utility grid, PV, AC load, energy storage, and DC load.
The first is the grid-connected port, which adopts the structure of a three-phase inverter. This is the core port in the ER system that enables a bidirectional flow of energy. The second port is the PV port. The function of the PV port is to incorporate solar energy into the ER system, and the criterion of its work is the full utilization of light energy without considering additional factors such as energy flow and system stability. The design and control of the PV port starts from the efficient acquisition of energy without involving other factors. Considering the characteristics of a low PV voltage level, multiple parallel PV cells, and a high DC bus voltage level, a boost converter is used as the port. Considering the expandability and the current stress of the IGBT, an interleaved parallel boost circuit is adopted. When the power is the same, interleaved parallel booster structure switch current stress is smaller compared with the ordinary booster circuit, and current ripple is also smaller. This configuration has advantages in terms of the stability of the common bus voltage and control of the current.
The next is the energy storage port. This port connects the energy storage battery to the DC bus through a bidirectional buck-boost circuit. It plays the role of energy buffer. This port needs to realize the bidirectional flow of energy, and it also requires rapid control to quickly sense the fluctuation of the common bus voltage, so adjustments are made in the control. The bidirectional buck-boost structure is chosen for the structure, and the model predictive control is used for the control.
Finally, the design of the AC and DC load ports also plays an important role in ER. Considering the controllability of the system and the difficulty of the overall control, these two ports do not participate in the control of the voltage stability of the common bus, but only serve as functional ports for the load. Both ports use the conventional control strategy matched with the structure to ensure output stability and achieve basic external functions.
The energy interactions of all ports need to pass through the DC common bus. The stability of DC common buses is fundamental to the stable operation of the ER system. The energy interaction per unit time has the following formula:
U C B i 1 Δ t + U C B i 2 Δ t + U C B i 3 Δ t + U C B i 3 Δ t + U C B i 4 Δ t + U C B i 5 Δ t + 1 2 C C B U C B 2 Δ t = 0
j = 1 5 P j Δ t + 1 2 C C B U C B 2 Δ t = 0
The control of energy flow is realized through Equation (2), when the system loss is not considered and the common bus voltage is stable, which means that the energy flow control is stable.
For the ER, the focus is on the flow of energy. Since the analysis is the impact on the power grid, the grid-connected port is the most important port that needs to be considered. Figure 3 shows the power electronic structure of the net-connected port of the ER.
The grid-connected port is connected to the grid at one end and to the common bus CB at the other end, as shown in Figure 3, while the other ports are also connected by the CB. For the grid-connected ports, there are the following energy relations. First, the power loss of the port can be equivalently represented by the derivative g H + j b H . The reactive power loss of the joint can be equated by j b C H .
The energy obtained from the grid-connected ports is absorbed by the rectifier in the reactive part after the conductance and the electronation, and the active part of energy is then transferred to the DC bus to supply the other ports and participate in the overall energy balance. The overall energy balance equations are expressed as follows:
P H = g H U 2 ( g H cos δ 1 + b H sin δ 1 ) U U D
Q H = ( b C H + b H ) U 2 + ( b H cos δ 1 g H sin δ 1 ) U U D
Assuming there is no energy loss in the rectifier section, the energy interacting with the common bus is
P D = E l I = g H ( U D ) 2 + ( g H cos δ 1 b H sin δ 1 ) U U D
E l = w U D
where w is the converter equivalent control coefficient, which is related to the converter topology and the control strategy. Our task is to control the converter to achieve energy interaction.
Figure 4 shows the energy flow and the information flow between an ER Centralized Controller (ERCC), the five ports, and the common bus.
Figure 4 shows that the control of ER is divided into two levels: module-level control and system-level control. Figure 4 demonstrates that the energy storage and grid-connected ports are bidirectional ports, which play a role in coordinating energy and stabilizing the common bus voltage, and have a higher position in the overall control. The AC load port, DC load port, and PV port are directly connected to the common bus. These three ports are only responsible for a one-way energy transmission. For the control of these ports, only the external functions need to be realized. The influence on the common bus of the ER is stabilized by the bus capacitor and balanced by the bidirectional port. Thus, the control of the grid connection and the energy storage port is based on the stability of the bus voltage.

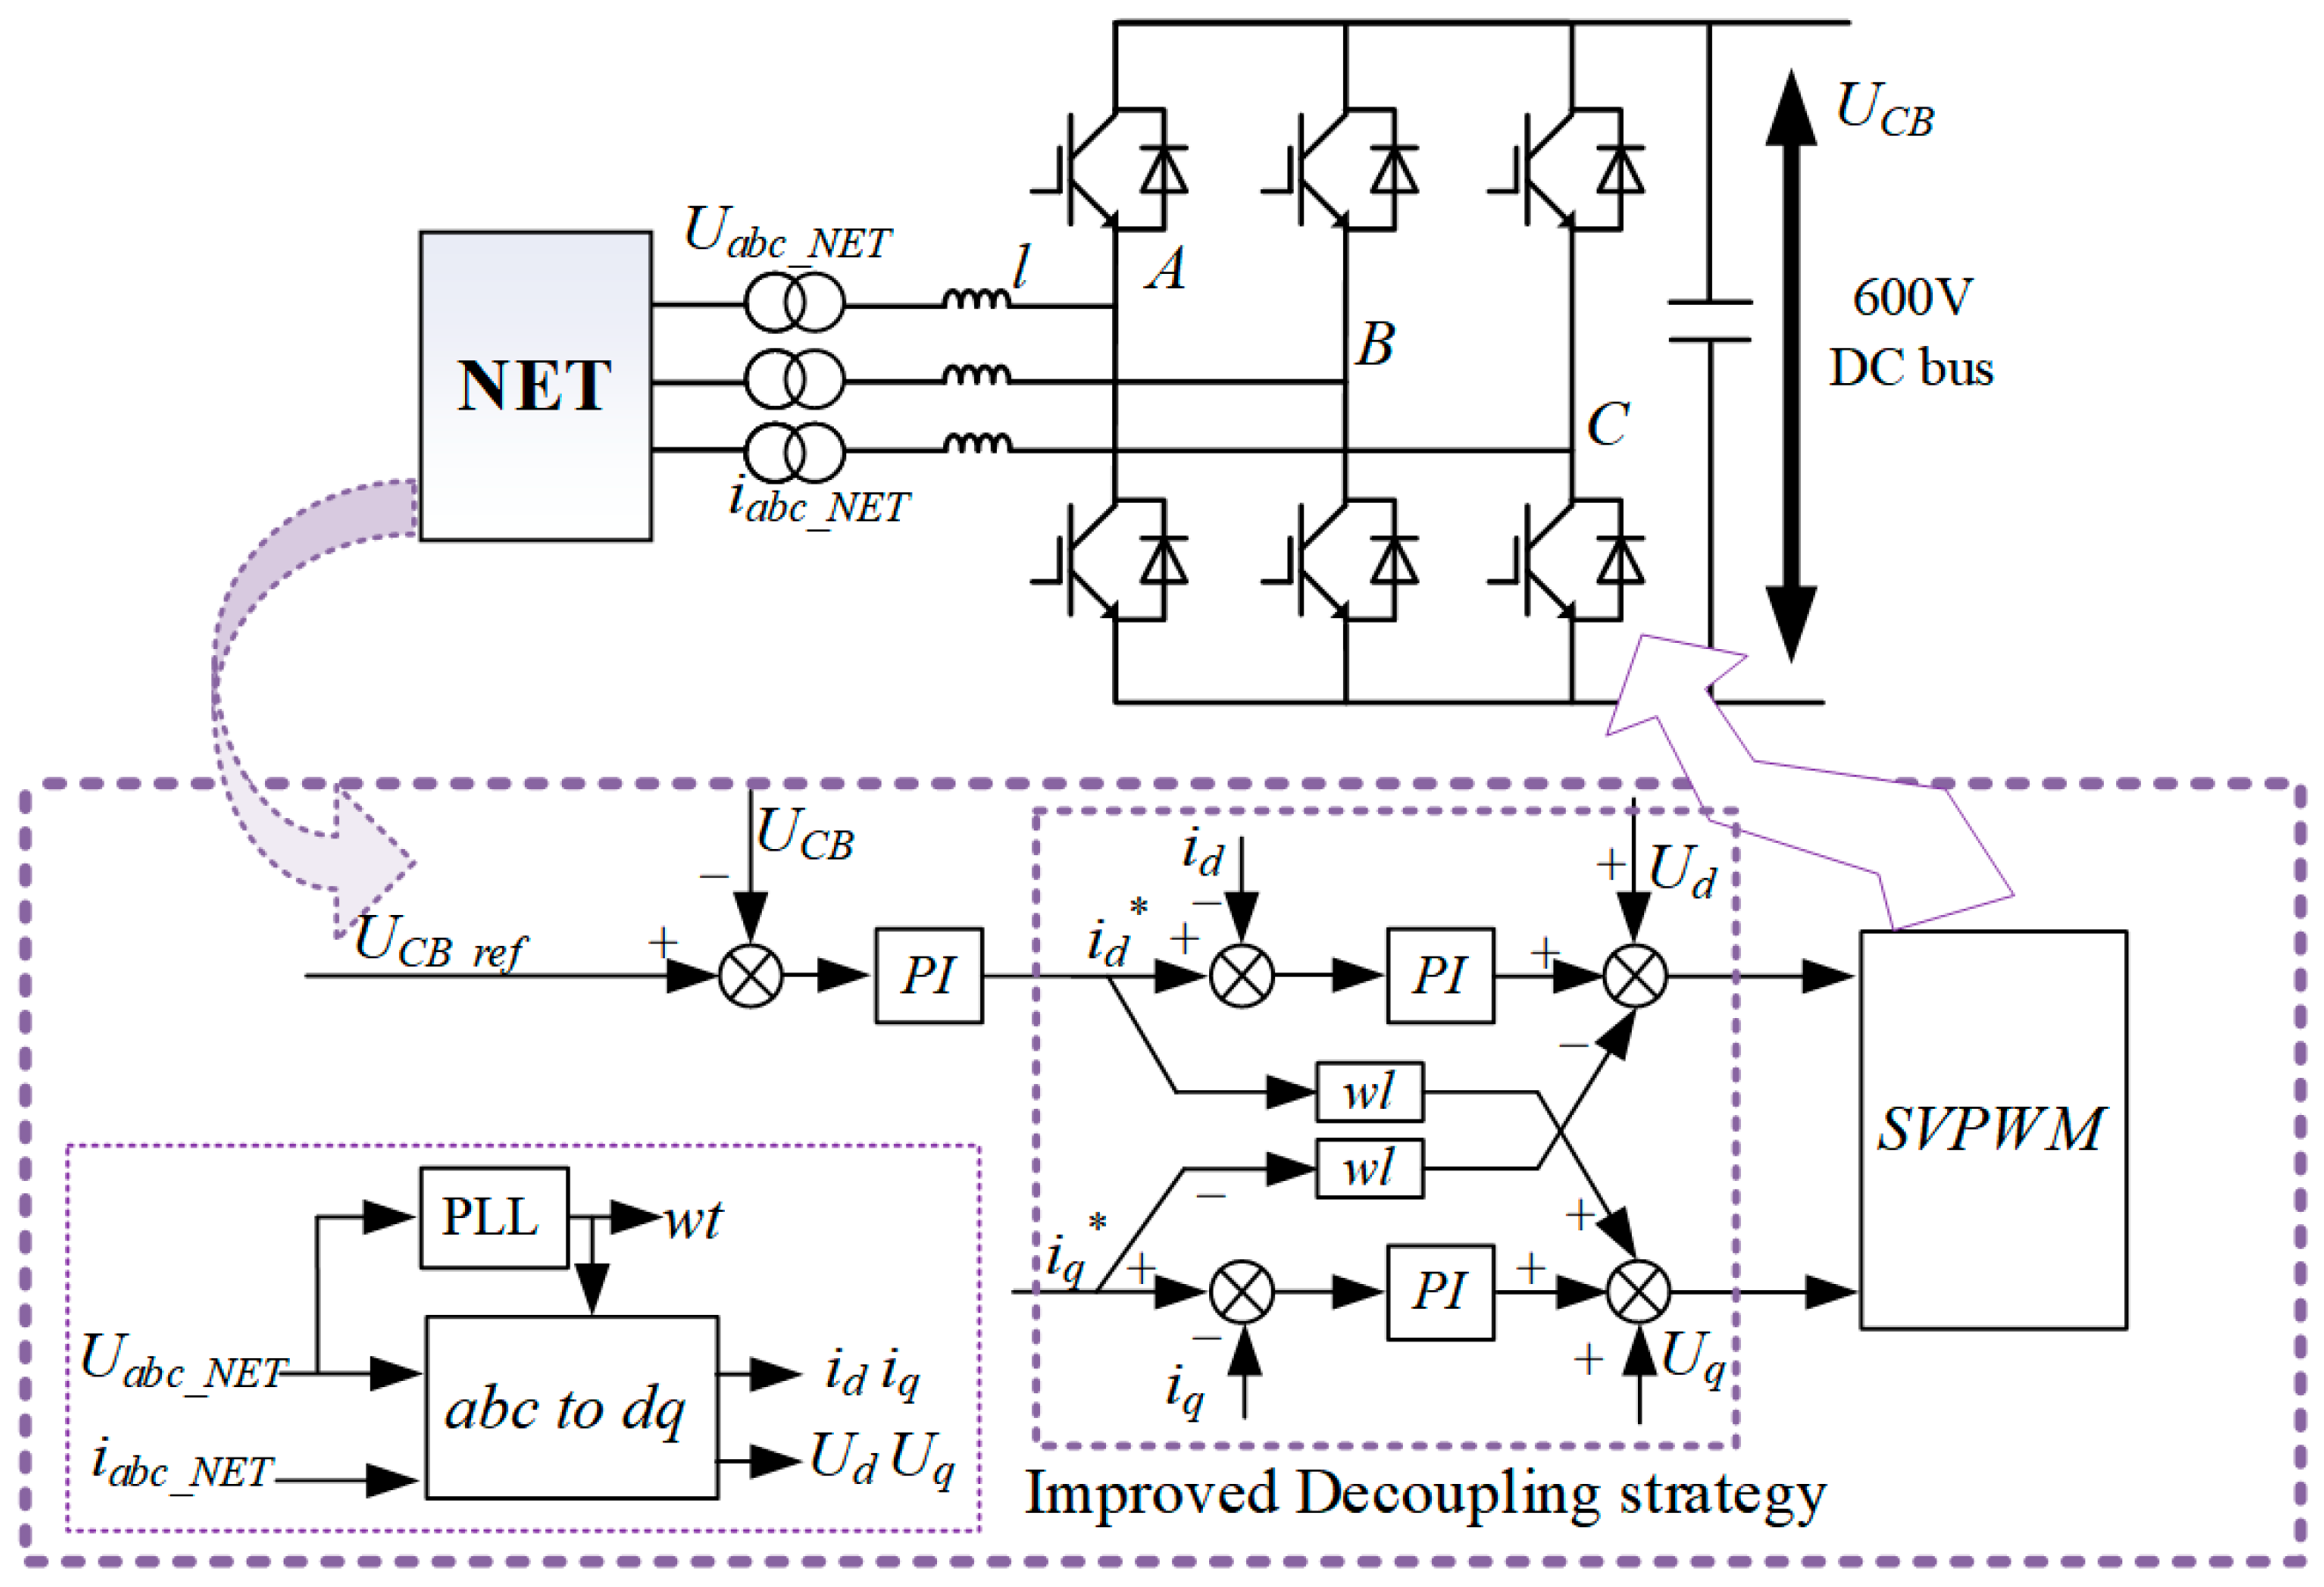
2.3. Port Modeling and System Coordination Control

For the grid-connected port control, as shown in Figure 5, the structure of a three-phase full bridge converter is adopted. For this topology, a double closed-loop PI control strategy is used.
The three-phase full-bridge inverter circuit adopts the voltage and current double closed-loop control strategy.
Firstly, the phase-lock loop (PLL) is used to collect the phase of grid voltage by the voltage sensor, and the abc to dq converter is carried out to get id, iq, ud, and uq [30]. The measured common bus voltage Ucb is compared with the reference voltage of the common bus, and the result is sent to the PI module to obtain a reference value for the active current. The obtained value and the reference value of the reactive current enter the decoupling link together, send the final value to the SVPWM module, and then obtain the modulation signal [31]. In Figure 5, a new decoupling control strategy is adopted, which has the following advantages compared with the previous control methods.
In the improved decoupling strategy, the id* and iq* is used to replace the id, iq, where
{ U d = Δ U d + U d w l i q U q = Δ U q + U q + w l i d
The traditional decoupling control strategy, when the grid current fluctuates Δid and Δid, brings about the fluctuation of reference voltage Δud* = −wlΔiq and Δuq* = wlΔid. Obviously, Δid and Δiq, in the decoupled components will bring about the interaction between id, iq. It will reduce the quality of the grid current. However, with this improved method, there is no such fluctuating Δid and Δiq. Since the ER needs to be connected to the power grid and is sensitive to the fluctuation of the power grid current, this control strategy is helpful to better realize the stability of the grid-connected port.
For the energy storage port control, as shown in Figure 6, the structure of a buck-boost converter is adopted. For this topology, a control strategy combining PI and model predictive control (MPC) is used [32,33].
From the structure diagram of energy storage port
U Q = L B di b dt + U b
We can discrete Formula (4) and then we can get
i L ( k + 1 ) = ( U Q U b ) T s L B + i L ( k )
The inductance current at k time can be obtained by sampling, and the inductance current at k + 1 time can be predicted. The battery terminal voltage is lower than the common bus voltage, and the converter operates in Buck mode, with UQ = DUCB. After substituting Formula (9):
i L ( k + 1 ) = ( DU CB U B ) T s L B + i L ( k )
Considering that the digital control system has a beat delay, it is necessary to use the sampling value at time k to predict the inductance current value at time k + 1, and use this value to predict the reference current value at the next beat. The delay expression of one beat is as follows:
i L ( k + 1 ) = ( D o l d U CB U B ) T s L + i L ( k )
where Dold is the duty cycle of the previous time. Generally, the sampling time is short, so the DC bus voltage UCB and the battery voltage UB remain unchanged at k and k + 1. Therefore, the duty cycle at the next time can be calculated by the following expression:
D = ( i L _ r e f i L ( k + 1 ) ) L T s U CB + U B U CB
Finally, the control block diagram of the energy storage converter in Figure 6 is obtained. First, the DC bus side voltage UCB and the given reference voltage UCB_ref are sent to the proportional integral PI for comparison. At this time, a reference current is output to compare with the actual inductance current, and is sent to the model predictive controller to generate the duty cycle. The output is compared with the carrier to generate the control signal of the switch. When the bus voltage fluctuates, the model predictive control strategy can be used to adjust.
In the ER system, the grid-connected port and energy storage port are bidirectional ports, and the coordination control of the ER comes from the control of these two ports. When an energy imbalance occurs, the energy storage port and the grid-connected port are fed, respectively, according to their respective states to replenish the unbalanced energy. According to Formula (2), the voltage stability of a common bus is equal to the balance of the overall energy. Thus, port control starts from the voltage stab.
A set of nine working models have been established of ER operation by dividing the working modes of the ports and the current state of energy storage. This working mode corresponds to the work of the energy storage port as well as the grid-connected port above, and since these two ports are bidirectional ports, we define the direction of energy flow, with energy flowing out from the common bus as + and energy flowing into the common bus as −.
As can be seen in Table 1, the operating models of the ER are divided into nine groups, starting with BEH, which is the ideal state of three groups, in which the energy router is considered an island, the PV supplies energy directly to the load, and there are no other energy interactions. Models A and G indicate that the PV is sufficient, the battery port is working, and the ER stores energy. FI indicates that the storage is sufficient and the battery provides energy to the load for consumption. Finally, Models C and D indicate that the energy router has no way to handle the energy gap by itself and needs the participation of the grid-connected port, which will have an impact on the power quality.

3. Establishment of Power Quality Evaluation System

3.1. Selection of Power Quality Evaluation Indicators

The harmonic distortion is caused by various types of harmonic generation equipment. In most cases, when the distributed generation unit is connected to the nonlinear load, the harmonic distortion of the distribution system will increase. According to IEEE 519, THDv and THDi are taken as PQI indicators of harmonic distortion, and the harmonic times at point of common coupling (PCC) are generally calculated to 40, as shown in Formulas (13) and (14).
T H D v = h > 1 h = 40 | V h | 2 / V 1
T H D i = h > 1 h = 40 | I h | 2 / I 1
In Formulas (9) and (10), Vh and Ih are, respectively, the effective values of the hth-degree harmonic current and voltage measured at PCC. V1 and I1 are the effective values of their fundamental waves. According to IEEE 519, THDv and THDi values do not exceed 5% for the system.
IEEE Std. 1159 defines voltage sag and rise as the phenomenon that the effective value of voltage shifts within 0.5 cycle to 1 min. Based on this, this paper calculates the voltage offset score (ADS) from the effective value of three-phase (Va, Vb, Vc) voltage. The expression is given in Equation (15).
A D S = | 1 V a | + | 1 V b | + | 1 V c | 3 × 100
The standard definition of a frequency shift is an increase or decrease in the power system’s power frequency, which can last from a few cycles to several hours. According to EN 50160, within 95% of a cycle, the frequency range fluctuation shall be within a % of the rated frequency (50 or 60 Hz). During an entire cycle, the frequency range fluctuations shall be within −6%/−4% of the rated frequency. The definition of frequency offset ratio (FDR) is shown in Equation (16).
F D R = | f m f 1 | f 1 × 100
where fm is the measured voltage fundamental frequency, which changes over time, and f1 is the rated frequency of the system.
Power factor (PF) is the ratio of active power to apparent power. Low PF values are derived from inductive loads such as induction motors, transformers, etc. The real power factor measured in PCC shall be kept within the acceptable range (>90%) to improve the energy transfer efficiency of the system, as shown in Equation (17).
P F = ( P 1 + h > 1 40 P h ) / ( S 1 + h > 1 40 S h )
where P1 and S1 are the active power and apparent power of fundamental wave signal transmission at the monitoring point, respectively. Ph and Sh are the active and reactive power of the hth-degree harmonic.

3.2. Power System Quality Evaluation Index Based on Analytic Hierarchy Process

The analytic hierarchy process (AHP) is a systematic and hierarchical decision-making analysis method that combines quantitative and qualitative analysis. It forms a judgment matrix based on the comparison between two different attributes and uses the largest eigenvalue of the judgment matrix to compute the weight of each attribute. The steps of AHP are as follows:
(1)
Build a hierarchical model and a judgment matrix.
(2)
Calculate the maximum eigenvalue of the judgment matrix λmax and the corresponding eigenvector. The element of the feature vector corresponds to the weight of each attribute.
(3)
Calculate the consistency index (CI) and consistency ratio (CR), and check whether the results meet, as shown in Equation (18).
{ C I = ( λ max N f ) / ( N f 1 ) C R = C I / R I
Here, Nf is the dimension of the judgment matrix and RI is the average random consistency index related to the dimension of the judgment matrix. There are five indexes for power quality evaluation in this paper, and the order is five, and RI is taken as 1.26. The basic scale of comparison is 1–9, as shown in Table 2.
In the system of this study, five indicators are proposed in this section to evaluate the power quality: THDv, THDi, ADS, FDR, and 1/PF. The inverse of power factor is considered here, so that the smaller the value of all six indicators, the better the power quality and the higher the evaluation.
In different systems, different indicators have different weight coefficients. This study focuses on the power quality at PCC bus. Usually PCC bus is a new energy grid point, so THDv, and FDR are more important. Based on experience, this paper considers two modes of PCC, sets different weight coefficients, and obtains the power quality evaluation values of PCC, respectively.
The two used settings are as follows: THDi is assumed to be the most important indicator affecting power quality; it is assumed that ADS is the most important element affecting power quality, and its judgment matrix is shown in Table 3. The evaluation of the comparison matrix is confirmed to be consistent by the calculation of the consistency ratio. Synthesizing the three weight vectors of the three assumptions, the average reliable weight vector of this type of bus is Wpcc= [0.1281, 0.2884, 0.2622, 0.2612, 0.0602]T.
The PQI can be calculated on PCC in two cases through the average weight vector, and we can get the final point energy quality evaluation index from Equation (19).
P Q I = p = 1 N f w p F p   , p = 1 N f w p = 1
In the Formula (19), Nf is the number of selected indicators that affect power quality, and Fp and wp are the measured values and corresponding weights of indicator p. Therefore, in this paper, the PQI calculation formula can be rewritten as
P Q I = w 1 ( T H D v ) + w 2 ( T H D i ) + w 3 ( A D S ) + w 4 ( P D R ) + w 5 ( 1 / P F )

4. Simulation Analysis and Results

The first step is to verify the feasibility of the ER topology and control strategy.
The basic parameters of the system are set according to Table 4.
Based on the parameters listed in the table above, simulations of the energy router were performed to verify the feasibility of the control.
The total simulation time is 2 s. The working state of the system is shown in Figure 7. It consists of four parts and the second graph represents the state of the external environment. At the beginning, the PV and AC ports work.
B1: DC port starts to work.
B3: PV port power gradually decreases to 0.
B4: DC port power decreases to 0.
B5: AC port power increases.
B6: AC port power increases.
The first graph shows the voltage and current at phase A of the grid-connected port, the third graph shows the energy storage SOC, and the fourth graph shows the common bus voltage values. These three graphs reflect the ER’s response to changes in the external environment.
t0t1: During this time, the PV power is elevated, the AC load is working, and the energy storage is insufficient. We can see the SOC increase gradually.
t1t2: During this time, the DC port starts working, the PV power is still greater than the load power (PACload + PDCload), the SOC still rises, but the slope of the C1 to C2 segment is lower.
t2t3: During this time, the energy storage is full, C2 to C3 is a straight line and the grid-connected port starts working to transfer the excess energy to the grid side. From A2 to A3, it can be seen that the voltage and current direction are the same, and the power is positive.
t3t4: During this time, the power of the PV port gradually decreases to 0 and the energy storage port supplies energy to the AC and DC ports, at which point the SOC decreases.
t4t5: During this time, DC port power is reduced to 0 and only the AC port consumes energy. Correspondingly, the battery discharges slower and the SOC decreases slower.
t5t6: During this time, the AC port power increases further, the battery discharges faster, and the SOC decreases faster.
t6t7: During this time, the battery is depleted and the grid-connected port reengages, but the energy transfer is in the opposite direction from t2t3.
The fourth graph shows the fluctuation of the common bus voltage, which fluctuates during modal switching, but quickly returns to stability. The ER can work stably under the proposed control strategy and the free flow of energy is successfully achieved.
According to the mode division of ER and the state of lighting and energy storage, two experiments were carried out to verify the correctness of the theory.
Experiment 1 was implemented in this way:
The PV module is added to the IEEE13 node model with ER and the IEEE13 node model without ER, respectively, both using MPPT for maximum power tracking and varying the light intensity to obtain the metrics proposed above.
For conventional systems (the structure on the left of Figure 1), we can obtain the conclusion of Figure 8, Figure 9, Figure 10 and Figure 11.
The first graph in Figure 8 shows the PCC bus voltage, the second graph represents the PV power fluctuation, and the third graph shows the amplitude-frequency-time contours of the voltage measured at the PCC bus of the distribution system drawn after S-transformation. The vertical axis is the signal frequency, the horizontal axis is time, and the color represents the amplitude magnitude.
The first is the incorporation of PV and the power fluctuation situation, which is an important factor causing the generation of system harmonics.
The system starts with the PV power set to 0.37 MW, and in 0.2 s the PV power starts to rise and eventually reaches 1 MW. Considering the realistic situation, the Rate Limiter module is used in Simulink, so the PV power is slowly increased in 0.1 s. The PV power then drops at 0.5 s and ends up at 0.77 MW.
Fluctuations in the PV power lead to fluctuations in the voltage, but this is not particularly pronounced, as we can see from the amplitude-frequency-time conversion plot. There is a magnitude fluctuation at 0.2–0.3 s and a magnitude fluctuation at 0.5–0.6 s, which corresponds to the shift of PV power. When the PV power does not change, the amplitude-frequency-time conversion fluctuates slightly, but not significantly.
For systems with ER (the structure on the right of Figure 1), we can obtain the conclusion of Figure 9, Figure 10 and Figure 11.
The first graph in Figure 9 shows the PCC bus voltage, the second graph represents the SOC of battery, and the third graph shows the amplitude-frequency-time contours of the voltage measured at the PCC bus.
Due to the access of the ER, the injection of PV energy is buffered; ER first dissipates the energy generated by PV without injecting it directly into the grid. When the battery used for energy storage is full, the energy goes only to the grid side. The SOC reflects the process of gradually filling the energy storage, with the SOC gradually rising before 0.3 s and rising at a faster rate after 0.3 s, corresponding to an increase in the PV energy intensity. At 0.7 s, the SOC reaches the maximum, which means the energy storage is full, and then the charging is stopped and the excess energy is injected into the grid. In the third figure, the difference between the system with ER and the normal system can be seen. Due to the use of ER, the optical conversion is completed without any impact on the back-end grid when the energy storage is used, and after the energy storage is full, control strategies can be used to reduce the impact on the grid ports.
Figure 10 and Figure 11 show the images of FDR and ADS with time for the system with ER and the system without ER, respectively. Since the FDR acquisition uses a phase-locked loop, it takes time for the system to stabilize, so the data are acquired from 0.2 s. In both images, the solid line indicates the system with ER and the dashed line indicates the conventional system (without ER). It is obvious that the conventional system is affected by the external environment, which brings about the deterioration of the steady state, while the system with ER is considered an isolated system in some modes, so it does not have any effect on the nodes.
Experiment 2 was implemented in this way:
In the absence of PV access, the DC load is increased in the form of observing the voltage fluctuations at the nodes while obtaining the relevant parameters. At the very beginning, the load power is 0.35 MW, and at 0.4 s, the load power is increased to 0.5 MW and maintained at 0.5 MW until the end.
As shown in Figure 12, the load power is 0.35 MW before 0.35 s. In the third figure, there is not too high harmonics present in the system, and at 0.35 s the load increases and a voltage transient occurs, accompanied by an increase in harmonics, which eventually stabilizes.
Figure 13 shows the ER voltage, energy storage SOCs, and amplitude-frequency-time. The external environmental changes are consistent with those in Figure 11. The second figure represents the SOC of the energy storage. At the beginning, the energy storage is sufficient and the ER operates in mode I, which means that all the consumption of the load is provided by the energy storage. We know that when the ER is working in Model I, the grid-connected ports do not work, so the change in external load does not affect the power quality at the PCC bus at all. Therefore, the PCC voltage does not fluctuate at all during the first half of the simulation and the system is extremely stable.
At about 0.63 s, the energy storage is depleted and no PV energy or other energy is replenished. The system needs to consume energy to supply the load for use, at which point the system enters Model C. Under Model C, the energy storage port of the ER system does not work, and all the energy consumed by the load is supplied by the grid-connected port. The switching of the system modes causes the voltage to fluctuate, but it soon stabilizes.
Figure 14 indicates the FDR at the PCC bus with and without the ER system. For the FDR, the results were not significantly different between the two groups. However, the system using the ER is obviously more stable in the first half.
All the possible conditions are classified into ten types according to the mode of operation of the ER, and nine simulation experiments are carried out to obtain the PCC bus parameters with and without the ER. Nine typical cases are selected for analysis as follows:
For ordinary systems without ER and without energy storage SOC, the PV and load are connected to the PCC port simultaneously with the same power described below. Table 5 shows the experimental results and power quality parameters.
Situation 1: Pload = 0.45 MW, PPV = 0.85 MW, SOC = 5;
Situation 2: Pload = 0.75 MW, PPV = 0.4 MW, SOC = 5;
Situation 3: Pload = 0.55 MW, PPV = 1 MW, SOC = 95;
Situation 4: Pload = 0.75 MW, PPV = 0.4 MW, SOC = 95;
Situation 5: Pload = 0 MW, PPV = 0.5 MW, SOC = 65;
Situation 6: Pload = 0.5 MW, PPV = 0 MW, SOC = 65;
Based on the formula of the hierarchical analysis method proposed above, we can conclude that when the hierarchical analysis method is used, the power quality indicators fluctuate in the above six cases. It is worth noting that the power quality indicators of the system with the presence of ER are the same in the four cases 1, 4, 5, and 6, and their indicators are much smaller than those of the system without the presence of ER.
Figure 15 is the radar chart of the power quality index; the system using ER uses warm thread and the system without ER uses cool thread. In this picture, the lines of cool colors are seen in the outer circle and the lines of warm colors are seen in the inner circle. Figure 15 thus indicates that the use of ER has greatly improved the power quality index.
Under several specific experimental conditions, the ER does not interact with the grid at all. All the energy has been consumed under the regulation of ER, and does not need to be transmitted to the grid through the grid-connected port. If there is no energy interaction, there will be no power quality problems.
In cases 2 and 3, the ER acts as a primary distribution of energy structure, first routing the energy internally before interacting with the distribution grid. The resulting “energy gap” is filled by the distribution grid. Therefore, in this case, the energy that interacted with the distribution grid is the “missing energy”, which is obviously smaller than the total energy, and the energy interaction type changes from two (Ppv + Pload) to one (PpvPload), which improves the power quality.

5. Conclusions

In this paper, a five-port ER model is first established, and the corresponding control strategy and energy scheduling method are designed for this topology. The feasibility of the topology and the control strategy is verified by simulation experiments.
In the second step, an IEEE13 node active distribution grid model is built. It connects PV, energy storage, and AC/DC loads to this system. In the traditional active distribution network model, all structures are connected to PCC nodes. For this structure, a power quality assessment system based on hierarchical analysis is designed to evaluate the strengths and weaknesses of power quality. When the load fluctuates, the power quality will fluctuate.
When we connect ER to the active distribution network, ER acts as a transit station and can well coordinate the flow of energy while regulating the power quality. We verified two points through our quantitative experiments. First, we verified the feasibility of the five-port ER topology and the control strategy, and second, we verified how ER access can enhance the power system.

Author Contributions

Conceptualization, X.C., Y.L., D.Y., T.J. and M.A.M.; methodology, X.C., Y.L., D.Y., T.J. and M.A.M.; validation, X.C., Y.L., D.Y., T.J. and M.A.M.; formal analysis, X.C., Y.L., D.Y., T.J. and M.A.M.; investigation, X.C., Y.L., D.Y., T.J. and M.A.M.; writing—original draft preparation, X.C., Y.L., D.Y., T.J. and M.A.M.; writing—review and editing, X.C., Y.L., D.Y., T.J. and M.A.M.; supervision, T.J. and M.A.M. All authors have read and agreed to the published version of the manuscript.

Funding

This work was supported by the Chinese National Natural Science Foundation (grant number 51977039) and the central government guiding local science and technology development project under grant number 2021L3005.

Institutional Review Board Statement

Not applicable.

Informed Consent Statement

Not applicable.

Data Availability Statement

Not applicable.

Conflicts of Interest

The authors declare no conflict of interest.

Nomenclature

EREnergy router
PVPhotovoltaic
EIEnergy Internet
CBCommon bus
UcbCommon bus voltage
IdThree-phase grid current active component
IqThree-phase grid current reactive component
Id*Three-phase grid current active component reference value
Iq*Three-phase grid current reactive component reference value
UdThree-phase grid voltage active component
UqThree-phase grid voltage reactive component
Ud*Three-phase grid voltage active component reference value
Uq*Three-phase grid voltage reactive component reference value
MPCModel pretend control
il(k) Energy storage port k moment inductor current
il(k + 1)Energy storage port k + 1 moment inductor current (Predicted value)
TsSystem sampling period
PloadLoad power, including the sum of DC and AC load power
PpvPhotovoltaic power
SOCBattery state of charge
AHPAnalytic hierarchy process
CIConsistency index of AHP
CRConsistency ratio of AHP
NfDimension of the judgment matrix
RIAverage random consistency index related to the dimension of the judgment matrix.
PQIPower quality index
PCCCommon coupling point
WpccAverage reliable weight vector of PCC bus

References

  1. Hebal, S.; Harous, S.; Mechta, D. Energy Routing Challenges and Protocols in Energy Internet: A Survey. J. Electr. Eng. Technol. 2021, 16, 3197–3212. [Google Scholar] [CrossRef]
  2. Abdella, J.; Shuaib, K. Peer to Peer Distributed Energy Trading in Smart Grids: A Survey. Energies 2018, 11, 1560. [Google Scholar] [CrossRef]
  3. Chen, D.; Hu, X.; Li, Y.; Abbas, Z.; Wang, R.; Li, D. Nodal conservation principle of potential energy flow analysis for energy flow calculation in energy internet. Energy 2023, 263, 125562. [Google Scholar] [CrossRef]
  4. Feng, C.; Liao, X. An overview of “Energy + Internet” in China. J. Clean. Prod. 2020, 258, 120630. [Google Scholar] [CrossRef]
  5. Jiao, W.; Chen, J.; Wu, Q.; Li, C.; Zhou, B.; Huang, S. Distributed Coordinated Voltage Control for Distribution Networks With DG and OLTC Based on MPC and Gradient Projection. IEEE Trans. Power Syst. 2022, 37, 680–690. [Google Scholar] [CrossRef]
  6. Liu, Y.; Jin, T.; Mohamed, M.A.; Wang, Q. A Novel Three-Step Classification Approach Based on Time-Dependent Spectral Features for Complex Power Quality Disturbances. IEEE Trans. Instrum. Meas. 2021, 70, 1–14. [Google Scholar] [CrossRef]
  7. Syed, I.; Khadkikar, V.; Zeineldin, H.H. Loss Reduction in Radial Distribution Networks Using a Solid-State Transformer. IEEE Trans. Ind. Applicat. 2018, 54, 5474–5482. [Google Scholar] [CrossRef]
  8. Liu, Y.; Yuan, D.; Gong, Z.; Jin, T.; Mohamed, M.A. Adaptive spectral trend based optimized EWT for monitoring the parameters of multiple power quality disturbances. Int. J. Electr. Power Energy Syst. 2023, 146, 108797. [Google Scholar] [CrossRef]
  9. Cardiel-Alvarez, M.A.; Rodriguez-Amenedo, J.L.; Arnaltes, S.; Montilla-DJesus, M.E. Modeling and Control of LCC Rectifiers for Offshore Wind Farms Connected by HVDC Links. IEEE Trans. Energy Convers. 2017, 32, 1284–1296. [Google Scholar] [CrossRef]
  10. Mahela, O.P.; Shaik, A.G. Power quality improvement in distribution network using DSTATCOM with battery energy storage system. Int. J. Electr. Power Energy Syst. 2016, 83, 229–240. [Google Scholar] [CrossRef]
  11. Du, W.; Schneider, K.P.; Wiegand, G.P.; Tuffner, F.K.; Xie, J.; Dent, O.L. A Supplemental Control for Dynamic Voltage Restorers to Improve the Primary Frequency Response of Microgrids. IEEE Trans. Smart Grid 2022, 1. [Google Scholar] [CrossRef]
  12. Jia, W.; Guo, Q.; Tu, C.; Jiang, F.; Wang, L.; Hou, Y. Improved Single-phase UPQC with Integrating Auxiliary Capacitor for Power Rating Reduction. IEEE Trans. Ind. Electron. 2022, 1–11. [Google Scholar] [CrossRef]
  13. Prakash Mahela, O.; Gafoor Shaik, A. Topological aspects of power quality improvement techniques: A comprehensive overview. Renew. Sustain. Energy Rev. 2016, 58, 1129–1142. [Google Scholar] [CrossRef]
  14. Chen, R.; Yang, Y.; Jin, T. A hierarchical coordinated control strategy based on multi-port ER of urban rail transit. Prot. Control Mod. Power Syst. 2022, 7, 2205. [Google Scholar] [CrossRef]
  15. Zhu, L.; Rong, X.; Zhao, J.; Zhang, H.; Zhang, H.; Jia, C.; Ma, G. Topology optimization of AC/DC hybrid distribution network with ER based on power flow calculation. Energy Rep. 2022, 8, 1622–1638. [Google Scholar] [CrossRef]
  16. Abdallah, W.J.; Hashmi, K.; Faiz, M.T.; Flah, A.; Channumsin, S.; Mohamed, M.A.; Ustinov, D.A. A Novel Control Method for Active Power Sharing in Renewable-Energy-Based Micro Distribution Networks. Sustainability 2023, 15, 1579. [Google Scholar] [CrossRef]
  17. Li, P.; Sheng, W.; Duan, Q.; Li, Z.; Zhu, C.; Zhang, X. A Lyapunov Optimization-Based Energy Management Strategy for Energy Hub With ER. IEEE Trans. Smart Grid 2020, 11, 4860–4870. [Google Scholar] [CrossRef]
  18. Tu, C.; Xiao, F.; Lan, Z.; Guo, Q.; Shuai, Z. Analysis and Control of a Novel Modular-Based ER for DC Microgrid Cluster. IEEE J. Emerg. Sel. Top. Power Electron. 2019, 7, 331–342. [Google Scholar] [CrossRef]
  19. Jordehi, A.R.; Tabar, V.S.; Mansouri, S.A.; Sheidaei, F.; Ahmarinejad, A.; Pirouzi, S. Two-stage stochastic programming for scheduling microgrids with high wind penetration including fast demand response providers and fast-start generators. Sustain. Energy Grids Netw. 2022, 31, 100694. [Google Scholar] [CrossRef]
  20. Nasir, M.; Jordehi, A.R.; Tostado-Véliz, M.; Tabar, V.S.; Mansouri, S.A.; Jurado, F. Operation of energy hubs with storage systems, solar, wind and biomass units connected to demand response aggregators. Sustain. Cities Soc. 2022, 83, 103974. [Google Scholar] [CrossRef]
  21. Khalid, H.M.; Muyeen, S.M.; Kamwa, I. An improved decentralized finite-time approach for excitation control of multi-area power systems. Sustain. Energy Grids Netw. 2022, 31, 100692. [Google Scholar] [CrossRef]
  22. Mahela, O.P.; Khan, B.; Alhelou, H.H.; Siano, P. Power Quality Assessment and Event Detection in Distribution Network With Wind Energy Penetration Using Stockwell Transform and Fuzzy Clustering. IEEE Trans. Ind. Inf. 2020, 16, 6922–6932. [Google Scholar] [CrossRef]
  23. Xu, Y.; Fan, S.; Xie, S.; Lu, M. Power quality detection and classification in high permeability active distribution network based on IEWT-MFDE. CSEE JPES 2022, 8, 1646–1658. [Google Scholar]
  24. Elbasuony, G.S.; Abdel Aleem, S.H.E.; Ibrahim, A.M.; Sharaf, A.M. A unified index for power quality evaluation in distributed generation systems. Energy 2018, 149, 607–622. [Google Scholar] [CrossRef]
  25. Xu, Y.; Gao, Y.; Li, Z.; Lu, M. Detection and classification of power quality disturbances in distribution networks based on VMD and DFA. CSEE JPES 2020, 6, 122–130. [Google Scholar]
  26. Ahmarinejad, A. A Multi-objective Optimization Framework for Dynamic Planning of Energy Hub Considering Integrated Demand Response Program. Sustain. Cities Soc. 2021, 74, 103136. [Google Scholar] [CrossRef]
  27. Mansouri, S.A.; Nematbakhsh, E.; Ahmarinejad, A.; Jordehi, A.R.; Javadi, M.S.; Marzband, M. A hierarchical scheduling framework for resilience enhancement of decentralized renewable-based microgrids considering proactive actions and mobile units. Renew. Sustain. Energy Rev. 2022, 168, 112854. [Google Scholar] [CrossRef]
  28. Nascimento, R.; Ramos, F.; Pinheiro, A.; Junior, W.D.A.S.; Arcanjo, A.M.; Filho, R.F.D.; Mohamed, M.A.; Marinho, M.H. Case Study of Backup Application with Energy Storage in Microgrids. Energies 2022, 15, 9514. [Google Scholar] [CrossRef]
  29. Alsokhiry, F.; Siano, P.; Annuk, A.; Mohamed, M.A. A Novel Time-of-Use Pricing Based Energy Management System for Smart Home Appliances: Cost-Effective Method. Sustainability 2022, 14, 14556. [Google Scholar] [CrossRef]
  30. Ali, A.I.M.; Alaas, Z.M.; Sayed, M.A.; Almalaq, A.; Farah, A.; Mohamed, M.A. An Efficient MPPT Technique-Based Single-Stage Incremental Conductance for Integrated PV Systems Considering Flyback Central-Type PV Inverter. Sustainability 2022, 14, 12105. [Google Scholar] [CrossRef]
  31. Chen, W.; Liu, B.; Nazir, M.S.; Abdalla, A.N.; Mohamed, M.A.; Ding, Z.; Bhutta, M.S.; Gul, M. An energy storage assessment: Using frequency modulation approach to capture optimal coordination. Sustainability 2022, 14, 8510. [Google Scholar] [CrossRef]
  32. Mohamed, M.A.; Diab, A.A.Z.; Rezk, H.; Jin, T. A novel adaptive model predictive controller for load frequency control of power systems integrated with DFIG wind turbines. Neural Comput. Appl. 2020, 32, 7171–7181. [Google Scholar] [CrossRef]
  33. Jin, T.; Guo, J.; Mohamed, M.A.; Wang, M. A novel model predictive control via optimized vector selection method for common-mode voltage reduction of three-phase inverters. IEEE Access 2019, 7, 95351–95363. [Google Scholar] [CrossRef]
Figure 1. Traditional distribution network model and distribution network model with ER.
Sustainability 15 02655 g001
Figure 2. Structure of five-port ER system.
Sustainability 15 02655 g002
Figure 3. Power electronic structure of the net-connected port of the ER.
Sustainability 15 02655 g003
Figure 4. The information and energy flow of ER.
Sustainability 15 02655 g004
Figure 5. Grid connection port control strategy diagram.
Sustainability 15 02655 g005
Figure 6. Energy storage port control strategy diagram.
Sustainability 15 02655 g006
Figure 7. ER port power and internal state diagram.
Sustainability 15 02655 g007
Figure 8. Ex1.PCC voltage, power of PV, amplitude-frequency-time contours-without ER.
Sustainability 15 02655 g008
Figure 9. Ex1.PCC voltage, energy storage soc, amplitude-frequency-time contours-with ER.
Sustainability 15 02655 g009
Figure 10. Ex1.FDR—TIME.
Sustainability 15 02655 g010
Figure 11. Ex1.ADS—TIME.
Sustainability 15 02655 g011
Figure 12. Ex2.PCC voltage, power of load, amplitude-frequency-time contours–without ER.
Sustainability 15 02655 g012
Figure 13. Ex2.PCC voltage, energy storage soc, amplitude-frequency-time contours–with ER.
Sustainability 15 02655 g013
Figure 14. Ex2.FDR—TIME.
Sustainability 15 02655 g014
Figure 15. Power quality radar chart.
Sustainability 15 02655 g015
Table 1. Working mode of ER.
ModelEnergy Value ComparisonBattery
SOC
Energy Storage PortGrid Connected Port
Model APload < PPVSOC < 10%+0
Model BPload = PPVSOC < 10%00
Model CPload > PPVSOC < 10%0+
Model DPload < PPVSOC > 90%0-
Model EPload = PPVSOC > 90%00
Model FPload > PPVSOC > 90%-0
Model GPload < PPV10% < SOC < 90%+0
Model HPload = PPV10% < SOC < 90%00
Model IPload > PPV10% < SOC < 90%-0
Table 2. Scale table of AHP.
Quantization Scale
(i Relative to j)
Meaning
1 i is as important as j
3i is slightly more important than j
5 i is generally more important than j
7i is significantly more important than j
9i is extremely important compared with j PCC
2, 4, 6, 8 The median value of the above two adjacent judgments
Table 3. Judgment matrices and the resultant weight vectors of the two scenarios of PCC bus.
Scenario1THDvTHDiADSPDR1/PF
THDv11/321/23
THDi31425
ADS1/21/411/32
PDR21/2314
1/PF1/31/51/21/41
λmax = 5.0681, CI = 0.0255, CR = 0.0170 < 0.1 (Accept)
Weight vector [0.1599, 0.4186, 0.0973, 0.2625, 0.0618]T
Scenario2THDvTHDiADSPDR1/PF
THDv11/21/41/32
THDi211/31/23
ADS43126
PDR321/214
1/PF1/21/31/61/41
λmax = 5.0490, CI = 0.0123, CR = 0.009 < 0.1 (Accept)
Weight vector [0.0962, 0.1581, 0.4272, 0.2599, 0.0585]T
Table 4. System parameters.
ModularParameterValue
Common busCommon bus voltage600 V
PV portParallel strings600
Series-connected modules per string6
Voltage at maximum power point43 V
Current at maximum power point8.13 A
Maximum power1.25 MW
Battery portRated capacity500 Ah
Normal voltage500 V
Fully charge voltage581 V
AC load portFull load power1 MW
Rated voltageAC 380 V
DC load portFull load power1 MW
Rated voltageDC 200 V
Grid portStandard voltage(single-phase)1650 V
Standard frequency60 Hz
Table 5. Experimental results and power quality parameters.
SituationTHDvTHDiADSFDR1/PFPQI
1EREX1-10.010.010.000.021.400.094
without EREX1-22.520.740.690.201.950.823
2EREX2-12.040.400.950.102.040.769
without EREX2-23.041.200.201.002.101.170
3EREX3-12.480.580.010.101.300.583
without EREX3-22.650.601.400.503.001.184
4EREX4-10.010.010.000.021.400.094
without EREX4-22.000.751.440.021.760.961
5EREX5-10.010.010.000.021.400.094
without EREX5-22.500.600.000.101.400.604
6EREX6-10.010.010.000.021.400.094
without EREX6-22.530.502.001.002.001.370
Disclaimer/Publisher’s Note: The statements, opinions and data contained in all publications are solely those of the individual author(s) and contributor(s) and not of MDPI and/or the editor(s). MDPI and/or the editor(s) disclaim responsibility for any injury to people or property resulting from any ideas, methods, instructions or products referred to in the content.

