Abstract
Vehicle electrification is considered a pathway for on-road transportation decarbonization in China. Different from the conventional gasoline vehicles whose emissions are mainly released from vehicle tailpipes, emissions of battery electric vehicles (BEVs) are from the upstream processes of electricity generation and vehicle manufacturing, thus a comprehensive lifecycle analysis and comparison of BEVs with gasoline vehicles is required to quantify the emission mitigation benefit of vehicle electrification and determine the path to a carbon-neutral future. In the study, we compare the cradle-to-grave (C2G) lifecycle greenhouse gas emissions of gasoline and electric vehicles in China and analyze the greenhouse gas emission reduction of vehicle electrification in different provinces. Results show that under the current technologies, the national average C2G GHG emissions for battery electric vehicles (BEVs) of 100 miles (i.e., 160 km) and 300 miles (i.e., 480 km) all-electric range (AER) are 231 and 279 g CO2eq/km, respectively, 22% and 5% lower than those for gasoline internal combustion engine vehicles (ICEVs). Improving vehicle fuel efficiency by hybridizing gasoline ICEVs can effectively reduce C2G emissions to 212 g CO2eq/km. At the provincial level, C2G GHG emissions of BEVs vary according to the provincial electricity mix. In eight provinces, C2G GHG emissions of BEVs with 300 miles AER (BEV300s) are higher than those of gasoline ICEVs due to the GHG-intensive coal-based electricity mix. In the future scenario, with low carbon fuels (such as high-level bioethanol blending gasoline) and electricity decarbonization, the national average C2G emissions of hybrid electric vehicles (HEVs) and BEV300s can be reduced to 55 and 73 g CO2eq/km, respectively. Further decrease of C2G GHG emissions relies on reducing vehicle-cycle emissions from material processing and vehicle component manufacturing.
1. Introduction
As the largest greenhouse gas (GHG) emitter in the world, China has committed to significantly reducing its carbon emissions and achieving carbon neutrality by 2060 [1,2,3,4,5,6]. To achieve this ambitious goal, energy-saving and GHG emission-reducing practices should be adopted in all sectors [7,8,9]. With a long supply chain and numerous related upstream and downstream industries, the automobile sector is the economic engine and one of the major sources of GHG emissions in China, and thus it is of great significance to achieve decarbonization of the automobile sector [10]. Vehicle electrification is considered the pathway for on-road transportation decarbonization in China [11]. Under policy promotion and financial incentives [12,13], the market share of plug-in electric vehicles in China has continued to grow in recent years, exceeding 15% of new light-duty vehicle sales in 2021, making the country the global leader in electric vehicle production and sales [14].
Vehicle electrification reduces GHG emissions at the tailpipe because battery electric vehicles (BEVs) produce almost no tailpipe emissions [15]. However, after accounting for upstream emissions from electricity generation, BEVs’ GHG benefit depends greatly on the energy source mix of electricity [16,17,18]. Many researchers have conducted life cycle analysis (LCA) to account for the upstream emissions of electricity generation for BEVs and compared BEVs with conventional gasoline internal combustion engine vehicles (ICEVs) from well to wheel (WTW) [19,20,21]. Some scholars further expanded the system boundary of their life cycle analyses to cradle-to-grave (C2G) to include emissions associated with vehicle manufacturing and disposal [22,23]. The reason for C2G analysis is that vehicle electrification not only changes emissions related to fuel usage of vehicle operation, but also changes the materials/components for vehicle production and their associated upstream production processes. For instance, the internal combustion engine is replaced by the electric motor, generator, and batteries, thus leading to changes in emissions associated with vehicle manufacturing [24,25,26,27]. Previous C2G life cycle analysis revealed that BEVs generally produce higher GHG emissions in the vehicle cycle for raw material production and vehicle manufacturing compared to conventional ICEVs [24,25,26]. Thus, there are trade-offs between increased vehicle-cycle emissions and decreased tailpipe emissions of vehicle electrification. The net emission reduction depends on energy efficiencies of vehicle and production processes, and energy sources for manufacturing and electricity generation, which vary across countries and regions [24,25,26].
Most of the China LCA studies of vehicle technologies are conducted based on the modification on the U.S. Greenhouse Gases, Regulated Emissions, and Energy Use in Technologies (GREET®) Model [28,29,30,31,32,33,34,35,36], however, many modifications might be incomplete and inappropriate for study in China due to the lack of data and comprehensive understanding of the GREET model. For instance, 72% of oil and 45% of natural gas used in China is imported, while some studies only used energy statistics data for production in China to estimate upstream emissions of these relevant fuels [32]. In addition, there is limited modification on material flow and energy consumption at the process level for vehicle manufacturing in China [28,29,30,32,33,34,35,36,37,38,39]. Last but not least, most of these studies only provided intermediate or final LCA results instead of detailed raw data for model development, making it difficult for fellow researchers to replicate these studies and apply the modified model for future China-specific studies and comparison with LCA of other countries. To address the limitations of previous studies, we will modify the GREET model based on the latest researches on China’s domestic production and international supply data [40,41,42], estimate the material flow and energy efficiency for each process of vehicle manufacturing, and provide data source and value of parameters used for the present China-specific modification of GREET. Thus, future studies can benefit from the model development and standardized results of this study.
Based on the development of the China GREET model, we analyze and compare C2G lifecycle GHG emissions of four light-duty passenger vehicle technologies in China, including BEV100 with all-electric ranges (AER) of 100 miles (i.e., 160 km) and BEV300 with AER of 300 miles (i.e., 480 km), conventional gasoline ICEVs, and high-efficient gasoline hybrid electric vehicles (HEVs). Furthermore, considering the large internal heterogeneity of China in electricity mixes and vehicle travel mileage which thus would lead to varied GHG emission reduction effects across provinces, we will present results and discussion by province, aiming to provide insights into province-differentiated carbon emission reduction strategies. Finally, we will develop future scenarios of electricity decarbonization and fuel economy improvement to evaluate the emission reduction potentials of vehicle technologies and seek pathways to achieve the decarbonization goal in China.
2. Methods
In the study, a Chinese version of the greenhouse gases, regulated emissions, and energy use in technologies (GREET®) model was developed and used to estimate the cradle-to-grave (C2G) life cycle GHG emissions intensity of different vehicle technologies (i.e., ICEV, HEV, BEV100, and BEV300) in China. The China-GREET model was configured by applying China-specific data to modify the default GREET model, which is a well-established tool for life cycle analysis (LCA) of transportation technologies in the United States (US) [1]. We made changes based on the 2019 version of the GREET.Net model, meaning that except for the China-specific modification, parameters in the default GREET.Net 2019 model are kept the same in the modeling. Technical details about the default GREET model are reported on the website (https://greet.es.anl.gov/, accessed on 10 September 2022).
The GREET model includes the fuel cycle model GREET1, which is used to estimate emissions in the fuel cycle including emissions associated with feedstock extraction, production, and use of transportation fuels, and the vehicle cycle model GREET2, which is used to estimate emissions in the vehicle cycle including emissions from raw material mining and smelting, vehicle manufacturing, use, and disposal [43]. The present study applies GREET1 and GREET2 to account for the cradle-to-grave emissions from both the fuel cycle and vehicle cycle. Table 1 shows the system boundary of the study, presenting components/stages include in the C2G analysis.

Table 1.
Components/stages in cradle-to-grave vehicle life for analysis.
As shown in Table 1, the fuel cycle emissions can be broken down into two parts, i.e., well-to-pump emissions (WTP) of fuel production and pump-to-wheel emissions (PTW) of fuel used in vehicle operation. Thus, the fuel cycle emissions are also referred to as WTW emissions. In the WTP stage, GREET first calculates the energy use and emissions of each upstream processes for fuel production, transportation, storage, and distribution, and then combines emissions from all upstream process to estimate the total upstream emissions embedded in fuel usage. GHG emissions from a particular process include those from the combustion of processing fuels and non-combustion emissions; for instance, chemical reactions, leakage, and evaporation. GREET uses the parameters of energy efficiency and processing fuel share to calculate the fuel consumption for each upstream process, and then applies fuel specifications (including the carbon content and low heating values) to estimate the corresponding fuel combustion emissions. The GREET model also includes assumptions in the venting and flaring GHG emission rate for each process for the estimation of non-combustion emissions. In this work, based on China-specific data reported in recent studies and statistics [12,29,40,41,44,45,46,47,48,49,50], we changed GREET’s default values of the following parameters/pathways: (1) energy efficiencies and processing fuel shares of crude oil recovery, gasoline refinery, diesel refinery, coal mining, natural gas (NG) recovery, NG processing, NG liquefaction, LNG regasification; (2) electricity mixes, transmission loss rates, and efficiencies of thermal power plants; (3) CO2 emissions from fuel combustion and stem methane reforming of gasoline and diesel refinery; (4) venting and flaring CH4 and CO2 emissions of crude oil recovery, NG recovery, NG processing, NG liquefaction, LNG regasification, coal mining; (5) shipping mode and distance of coal, crude oil, NG, LNG, and gasoline transportation; (6) fuel specifications. Table S1 in Supplementary Materials presents detailed values and data sources of these parameters. In the PTW stage, fuel/electricity consumption rates (FCR/ECRs) are used to estimate emissions from gasoline combustion (for ICEV and HEV), and convert upstream emission embedded in the fuel/electricity usage to WTW emission per km of vehicle travel. For a fair comparison between different technologies, this present LCA study is conducted based on the same vehicle size (i.e., mid-size car) with the same vehicle performance. Table S2 in Supplementary Materials presents FCR/ECRs and other technical parameters for mid-size cars of different technologies in this study. More details about the configuration of the China-GREET1 model are referred to by Gan et al. [15].
For the vehicle cycle analysis, we account for emissions released from vehicle material/component production, vehicle assembly, disposable, and recycling. We used China-specific vehicle curb weight (shown in Table S2) and material percentage composition (by weight) assumption in the default GREET model to estimate the material composition inventories for different vehicle technologies [51,52], as shown in Table S3 in Supplementary Materials. Similar to the modeling method mentioned above for fuel-cycle emission calculations, GREET includes parameters of energy efficiency (or energy intensity), processing fuel and non-combustion emission rate for each process of vehicle material production to calculate emissions for producing per kg of each vehicle material. The upstream emissions for vehicle materials production, together with vehicles’ material composition inventories, are then used to estimate the total embodied emissions of vehicles. Energy and emissions associated with vehicle assembly, disposal, and recycling, as well as vehicle component (e.g., batteries, tires, and various vehicle fluids) replacement during the vehicle lifetime are also counted in the model. According to the China-specific data reported in recent studies and statistics [46,53,54,55,56,57,58,59,60], we modified the GREET modeling parameters of energy intensity, processing fuel share, and raw material consumption rate to estimate emissions released from the following material production processes: (1) open-pit/underground iron mining, iron beneficiation, hot rolling and skin mill, cold rolling, galvanizing, and stamping for steel production; (2) copper (Cu) ore mining, Cu smelting and refinery, and Cu processing; (3) zinc ore mining and zinc production, (4) bauxite mining, bauxite refinery, anode baking for aluminum (Al) electrolysis, Al electrolysis, primary Al ingot casting, Al scrapes transportation and preparation, secondary Al ingot casting, and Al forging; (5) lead ore mining and lead production; (6) glass production; (7) rubber production; (8) rare earth ore mining and rare earth metal production. We also made adjustments in the energy intensity and processing fuel for vehicle assembling in China [61]. Detailed values and data sources of these parameters for China-GREET2 model configuration are reported in Gan et al. [62]. The vehicle cycle emissions are then divided by the lifetime vehicle kilometers traveled (VKT) to calculate the emissions intensity per km of vehicle travel. Here, the vehicle lifetime VKT was assumed as 200,000 km [63]. The base year of the current study is 2017, thus the data presented in Tables S1–S4 are for the year 2017.
3. Results and Discussion
3.1. Cradle-to-Grave GHG Emissions of Gasoline and Electric Vehicles
Figure 1A shows the C2G GHG emission intensities of four different vehicle technologies in 2017. Among the four vehicle technologies, ICEV has the highest C2G GHG emissions intensity of 295 g CO2eq/km. C2G GHG emission intensity of HEV, BEV100, and BEV300 is, respectively, 83 (28%), 64 (22%), and 15 (5%) g CO2eq/km lower than that of ICEV. This implies that under the current vehicle technologies and electricity generation mix in China, replacing conventional ICEV with energy-efficient gasoline HEV or the short-AER BEV100 can significantly reduce C2G GHG emissions, while the reduction effect of BEV300 with long-AER is relatively small.
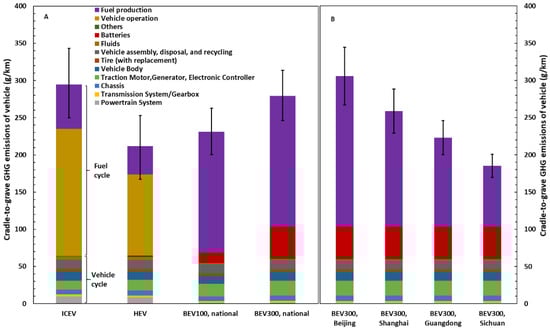
Figure 1.
Cradle-to-grave life-cycle greenhouse gas (GHG) emission intensities of different vehicle technologies in China in 2017: (A). national average level for ICEV, HEV, BEV100 and BEV300; (B). provincial level emission intensities of BEV300 in four selected provinces/metropolitans: Beijing, Shanghai, Guangdong, and Sichuan.
Vehicle C2G GHG emissions include vehicle-cycle emissions associated with automobile manufacturing, treatment, and disposal, and fuel-cycle emissions related to fuel production and combustion. Figure 1 presents the breakdown components of vehicular C2G emissions.
The vehicle-cycle emissions of ICEV, HEV, BEV100, and BEV300 are 64, 65, 69, and 104 g CO2eq/km, respectively, accounting for 22%, 31%, 30%, and 37% of the corresponding C2G GHG emissions. As shown in Figure 1, vehicle-cycle emissions are divided into emissions related to the production of automotive components, including powertrain systems, transmission systems, chassis, traction motor/generator/electronic controllers, vehicle bodies, tires, fluids, and batteries, as well as emissions associated with vehicle assembly, disposal, and recycling (ADR). Among the four vehicle technologies, ICEV has the lowest vehicle-cycle emissions. The vehicle-cycle emissions of HEVs are slightly higher than that of ICEVs. Compared to ICEV, HEV has additional electric components, including an electric motor, a traction battery pack, regenerative brakes which convert the vehicle’s kinetic energy to electric energy, and so forth, providing supplementary electric propulsion besides the main gasoline-powered engine. The usage of the auxiliary electric propulsion system improves the vehicle energy efficiency, leading to a smaller internal combustion engine (ICE) applied in HEV and decreased GHG emissions associated with ICE manufacturing, and, on the other hand, cause additional GHG emissions from the production processes of extra electric components. After all, compared to ICEV, the vehicle-cycle emissions of HEV are increased by less than 1%.
Vehicle-cycle GHG emissions of BEV100 and BEV300 are, respectively, 5% and 40% higher than ICEV. For BEVs, the ICE system is replaced by the electric propulsion system, thus avoiding emissions associated with the manufacturing and assembly of ICE and increasing emissions associated with electric components, including the electric motor, traction batteries, and so forth. GHG emissions derived from traction battery production and relevant upstream processes account for a significant portion of vehicle-cycle emissions for BEVs. Battery-associated emissions account for 21% and 42% of vehicle cycle emissions for BEV100 and BEV300, respectively. BEVs with longer AERs require a larger capacity of traction battery pack and thus lead to increased material consumed and higher GHG emissions of battery manufacturing. Battery-associated emissions of BEV300 are ~3 times those of BEV100, leading to 51% higher vehicle-cycle GHG emissions of BEV300 compared to BEV100. Thus, decreasing battery-associated emissions is the key to the further reduction of vehicle-cycle emissions of BEVs.
From the perspective of materials, steel accounts for the highest proportion of vehicle materials, accounting for ~60% by weight, followed by aluminum (Al), plastics, and rubber (see Table S3 in Supplementary Materials for detailed material composition of vehicles). Steel-derived GHG emissions account for more than 50% of vehicle-cycle emissions for all four vehicle technologies. Compared to ICEV, BEV has a higher Al content (in both absolute weight and relative percentage), because additional Al materials are used in the cathode current collectors of lithium-ion batteries, electric generators, electronic controllers, and traction motors of BEVs. This reveals that the increased market penetration of BEVs would increase GHG emissions from Al production and its associated upstream processes, implying additional requirements of GHG emission reduction in Al production for further decarbonization on the path to vehicle electrification.
Fuel-cycle (including stages of fuel production and vehicle operation) GHG emissions represent the largest part of the C2G GHG emissions. The fuel-cycle GHG emissions of ICEV, HEV, BEV100, and BEV300 are 231, 147, 162, and 176 g CO2eq/km, respectively, accounting for 78%, 69%, 70%, and 63% of C2G GHG emissions, respectively. For gasoline ICEV and HEV, 74% of the fuel-cycle GHG emissions are tailpipe emissions from gasoline combustion during vehicle operation. The remaining 26% of emissions arise from fuel production, including processes of oil recovery, gasoline refinery, and relevant transportation processes. Because BEVs are propelled by electricity with zero tailpipe emissions during vehicle operation, 100% of fuel-cycle emissions occur in electricity generation and its associated upstream processes. Compared with the United States and the European Union, relatively higher GHG emission intensity is estimated for BEVs in China because of the higher embedded emissions intensity for electricity generated in China. The GHG-intensive coal power has been the primary source of power generation for decades, representing more than 60% of the electricity generation mix of the year 2020, due to the scarcity of domestic oil and gas resources and relatively abundant coal resources in China. The share of coal power can be up to ~90% in some provinces with coal mines and industry, e.g., Shanxi and Inner Mongolia, making the embedded GHG emissions of electricity and BEVs in those provinces significantly higher than the national average level.
With a vast territory, China has a large internal heterogeneity in energy sources and local climate conditions for BEV operation, and thus huge regional variation in the embedded emissions of electricity and BVEs. Coal power dominates in the northern part of China, while hydroelectricity is the major source of power for southern provinces, leading to the GHG emission intensity of electricity consumed in different provinces varying from 89 to 1139 g CO2eq/kWh. Furthermore, the temperature change across provinces can cause a 7% decrease in BEV fuel-cycle emissions in the Yunnan province and a 20% increase in the Xinjiang province compared to the baseline level. In total, the fuel cycle GHG emissions for BEV300 in different provinces of China vary from 24 to 324 g CO2eq/km, corresponding to 86% lower and 84% higher than the national average level of 176 g CO2eq/km. Figure 1B shows the variation in the fuel cycle and C2G emissions for BEV300 in Beijing, Shanghai, Sichuan, and Guangdong, four major cities/provinces in China. According to the figure, BEV300 in Beijing has slightly higher C2G emissions than ICEVs, implying that replacing ICEV with BEV300 in Beijing might increase lifecycle GHG emissions rather than decrease emissions.
To sum up, the national average C2G GHG emissions of BEVs are higher than ICEVs, but for some provinces and cities, especially regions with cold winters and a dependence on coal power, replacing ICEVs with BEVs might even increase GHG emissions. The GHG emission reduction effect of replacing ICEVs with BEV300s of long electric ranges is insignificant (5% reduction of GHGs on national average), while BEV100s of short electric range can reduce C2G GHG emissions by 22% compared to the conventional ICEV. However, BEVs with longer electric ranges are preferred by consumers for reducing range anxiety. In 2018, 64% of BEVs sold in China had electric ranges greater than 300 km [62]. Under the market trend of increasing electric ranges of BEVs, further improvement of battery technology and measures to clean the electricity grid are required to achieve the GHG emissions reduction goal by vehicle electrification in China.
3.2. Decarbonizing Potentials of Vehicle Electrification by Provinces
In addition to variations in electricity mix and temperature effects, the annual vehicle travel mileage varies across provinces. owing to regional differences in geography, population density, and culture, affecting the emission reduction potential of vehicle electrification for different provinces. Figure 2 shows the GHG emission reduction effect of replacing an incumbent gasoline car with a BEV300 in each province. According to Figure 2, in 22 out of 30 provinces, replacing a gasoline vehicle with a BEV300 would reduce GHG emissions. Among them, the Sichuan province has the highest GHG emission reduction effect per year, which is a 4000 kg CO2 equivalent of GHG emission reduction. On the other hand, under the current provincial electricity grid mix, vehicle electrification would cause increased GHG emissions of vehicles in eight provinces. Among them, the annual emission increase effect in Inner Mongolia is most significant, owing to the GHG-intensive coal-based electricity mix and large annual average vehicle travel mileage of the province. Figure 2 reveals that provinces with a potentially increased rather than decreased GHG emissions of vehicle electrification are generally located in the north of China with a high share of coal power for electricity generation, relatively low population density, and high vehicle travel mileage. Thus, decarbonizing the electricity grid and improving charging infrastructure to reduce the range anxiety of long-distance travel are prerequisites for vehicle electrification in these provinces. The province-level analysis demonstrates that the policy promotion and implementation of vehicle electrification should be differentiated by province. Figure 3 shows the BEV share of the light-duty passenger vehicle stock by province in the baseline year 2017. According to Figure 3, BEV share is relatively high in the Beijing, Tianjin, Shanghai, and Chongqing metropolitans, and in the Shandong and Zhejiang provinces. These areas are not matched with areas of highest GHG emission reduction of vehicle electrification (colored in dark blue in Figure 2), and some are even favorable to gasoline vehicles in the perspective of GHG emission reduction, revealing that the current provincial EV promotion policy does not lead to maximized GHG emission reduction. The analysis and updates of the information in Figure 2 and Figure 3 would provide utility for province-level policy decisions on vehicle electrification.
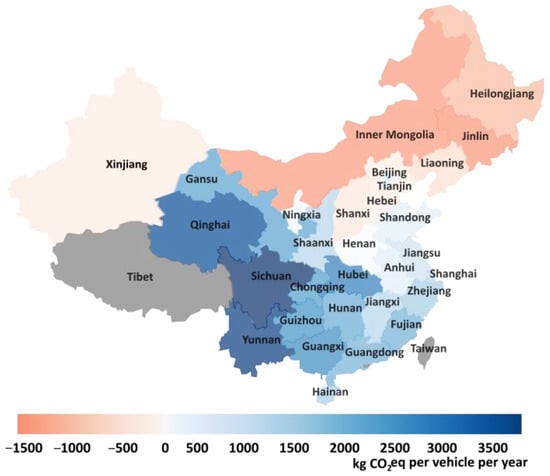
Figure 2.
Annual GHG emission reduction of replacing a ICEV with a BEV300 in each province.
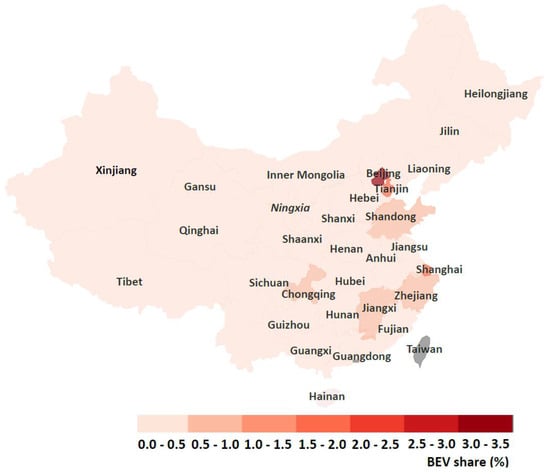
Figure 3.
BEV share of light-duty passenger vehicle stock by province in baseline year 2017. Data source of light-duty passenger vehicle stock by province: [12,15].
3.3. Future Scenario Analysis
In this study, we analyzed the potential changes in C2G emissions of gasoline and electric vehicles due to vehicle efficiency improvement and electricity decarbonization by 2050 (see Figure 4 for scenario analysis results). According to the result of the future scenario analysis, the vehicle efficiency improvement will decrease the per km fuel consumption rate of gasoline ICEV by 23%, and the electricity consumption rate of BEV100 and BEV300 by 34% and 26%, leading to 19%, 25%, 17% reduction in C2G GHG emissions of ICEV, BEV100, and BEV300, respectively.
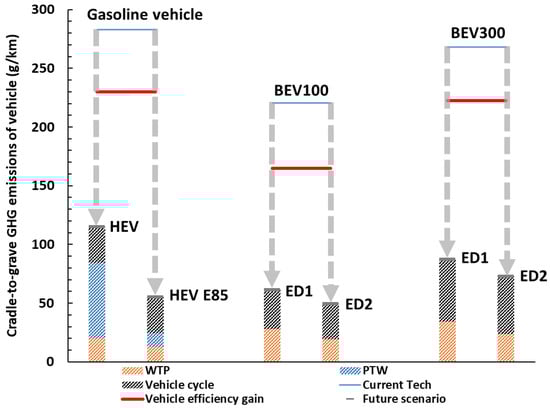
Figure 4.
Changes in cradle-to-grave lifecycle GHG emission intensities in future scenarios of 2050.
As mentioned above, the combined ICE and electric propulsion system of HEV technology can further improve the fuel economy of gasoline vehicles and reduce C2G GHG emissions. In the study, the HEV technology reduces the fuel consumption rate by 52%, and thus decreases the C2G GHG emissions by 39% compared to the conventional ICEV of 2050. Blending biomass-derived fuels of ethanol, methanol, etc., with gasoline to reduce fossil fuel-associated emissions is a key decarbonization pathway for ICEVs. Biofuel combustions are considered carbon-neutral because combustion CO2 emissions can be offset by the carbon sequestered from the atmosphere during the plant growth, and thus significantly reduce the GHG emissions intensity of the biofuel-blended gasoline. China planned to achieve the nationwide blending level of 10% bioethanol in the gasoline pool by 2020 to reduce vehicular oil consumption and GHG emissions [64]. Although the plan was suspended because of the plunging corn stock and limited ethanol production capacity in China, the bio-ethanol consumption for gasoline blending is expected to grow in the future to reduce the GHG emissions intensity of ICEVs. According to the analysis, 85% ethanol (E85) blending in gasoline would reduce the C2G emissions of gasoline HEV by 52%. With increasing biofuel blending in gasoline and adopting hybrid electric technology together, the C2G GHG emissions of HEV E85 of 2050 are estimated to be 81% lower than ICEV of 2017, indicating the GHG emissions reduction potential for current ICEVs.
Compared to gasoline ICEVs, BEVs are powered by electricity and require additional electricity in vehicle manufacturing to produce batteries and other electric components, thus the C2G emission level of BEVs is significantly affected by the embedded emissions intensity of electricity. Replacing GHG-intensive fossil fuels, such as coal, with renewable energy, such as solar and wind, for power generation is the pathway for electricity decarbonization and reducing C2G emissions of BEVs. In the study, we analyzed the potential changes in C2G GHG emissions of BEVs under two scenarios of electricity decarbonization (ED). In ED1, 91% of the electricity is generated from renewable and nuclear energy, 3% from natural gas, and 6% from coal power with carbon capture and storage (CCS) equipment installed [1,2]. In ED2, 96% of the electricity is sourced from renewable and nuclear energy, and the rest is derived from natural gas [65]. Both ED1 and ED2 scenarios are considered to meet the mitigation target of 1.5 °C temperature control [1,2,65]. On the basis of vehicle efficiency improvement, the ED1 scenario leads to a 63% and 61% decrease in C2G emissions for BEV100 and BEV300, respectively, and 70% and 67% reduction in C2G emissions for BEV100 and BEV300 are expected in ED2 scenario, respectively. See Tables S5 and S6 in Supplementary Materials for details about the assumptions of future scenarios.
As discussed above, vehicle efficiency improvement and electricity decarbonization would significantly reduce the C2G emissions of vehicles, especially emissions from the fuel cycle (i.e., emissions associated with fuel production and combustion), while the reduction in vehicle cycle emissions is limited. According to the analysis, under the ED1 scenario, the fuel-cycle emissions of BEV300 are expected to reduce by 82%, while the vehicle-cycle emissions decrease by only 47%, leading to an increase in the share of vehicle-cycle emissions in total C2G emissions for BEVs. As China gradually achieves carbon-neutral electricity, further decreasing vehicle-cycle emissions from material manufacturing will become the focus of decarbonization in the future. The coal-dominated energy structure for material manufacturing in China contributes greatly to the high vehicle-cycle emissions. For instance, iron and steelmaking in China primarily uses coking coal as fuel and the reducing agent, and the electricity for Al refinery plants is sourced from captive coal-fired power generation. Thus, the key pathway to further decrease vehicle-cycle GHG emissions would be to replace fossil fuels with renewable fuels such as electro-fuel, biofuel, green hydrogen, etc., or apply CCS to reduce GHG emissions from material processing and vehicle manufacturing. For instance, using green hydrogen to produce direct reduced iron (DRI), which is then combined with scrap in an electric arc furnace (EAF) to make steel, is a near-emission-free pathway.
4. Conclusions
Vehicle gasoline consumption is one of the main forces driving the demand for fossil fuels, leading to the environmental problems of air pollution and GHG emission. Adopting high-efficiency ICE technologies and vehicle hybridization can significantly reduce fuel consumption, cutting C2G GHG emissions by 28%. In the long term, GHGs of ICE-powered vehicles can be further reduced by using low-carbon fuels, such as electro-fuel, biofuel, blue and green hydrogen, etc.
The ongoing vehicle electrification to replace conventional gasoline vehicles with BEVs avoids vehicle tailpipe emissions, but might increase the upstream emissions of fuel production, shifting emissions from the vehicle tailpipe to the thermal power plant chimney. Results of this study show that vehicle electrification in China might increase life-cycle emissions for vehicle operation in provinces with coal-power-dominated electricity grid mix. The analysis demonstrates that the analysis of vehicular emissions should not be limited to tailpipe emissions but should cover the entire life cycle to achieve holistic emission reductions.
In addition to shifting emissions from tailpipe to upstream processes of electricity generation, vehicle electrification also leads to changes in vehicle manufacturing and associated material processing; for instance, substituting the conventional ICE with electric motors, electric generators, battery packs, etc., leading to potential changes in the embodied emissions of vehicles. According to our analysis, the vehicle-cycle GHG emissions of BEV100 and BEV300 in China are, respectively, 5% and 40% higher than ICEVs. The vehicle cycle emissions of the BEV300 with a long electric range are higher, mainly because long-range electric vehicles require larger batteries for electricity storage, thus leading to increased emissions from battery material production and battery pack manufacturing. Although the C2G emission of the short-electric-range BEV100 is estimated to be 18% lower than BEV300 on average, BEVs with longer electric ranges are preferred by consumers, as they reduce range anxiety and represent the future market trend. Thus, the potential increased embodied emissions of electric vehicles and the vehicle cycle analysis should not be ignored in the LCA study of vehicle technologies.
From the perspective of associated materials, more than 50% of vehicle-cycle GHG emissions are derived from the production processes of steel. GHG emissions from steel production mainly come from coking coal consumption for iron ore reduction in the blast furnace. Employing technologies of green hydrogen DRI and EAF steelmaking is considered a promising pathway to significantly reducing GHG emissions from steel production and thus the steel-derived embodied emissions of vehicles. Al is another major vehicle material, and vehicle electrification would further increase Al usage for vehicle production because the electric components, including electric generators, electronic controllers, and traction motors, require additional Al materials. Al production is an energy-intensive process with a large amount of electricity consumption for Al electrolysis. Al smelting in China depends on captive coal-fired power plants for Al electrolysis, leading to high-GHG emissions for Al production in China. Phasing out captive coal-fired power plants and using renewable electricity from decarbonized grid power for aluminum electrolysis would pave the way for Al sector decarbonization in China. In addition to steel and Al, the manufacturing of electric vehicles will lead to increased material consumption of lithium, cobalt, nickel, rare earth metals, etc., and associated emissions from the production processes of these materials. More in-depth analysis is required to analyze the environmental impacts as well as GHG emissions associated with the extraction and smelting of these materials, explore emission mitigation potential, and ensure sustainable vehicle material supplies.
The present study reports 5% and 40% higher vehicle-cycle emissions of BEV100 and BEV300 than ICEV, respectively, while Qiao et al. [34] used an older version of the GREET model and estimated the vehicle-cycle emissions of BEV (without differentiating by AER) to be ~60% higher than ICEV. The updated battery material and manufacturing technologies used for modeling in the present study favor the relatively lower vehicle-cycle emissions of BEVs. On the other hand, the fuel-cycle emission estimate of the present study is relatively higher than the estimates by Shen et al. [30] mainly because we have considered on-road degradation and thus applied a lower real-world fuel economy for analysis. Fuel-cycle GHG emissions of ICEVs and BEVs in the present study are 10% (without differentiating by region) and 2–60% (depending on regional grids) higher than those in Shen et al. [30], respectively. With vehicle-cycle and fuel-cycle emissions together, the C2G emissions of BEVs (without differentiating by AER) estimated by Wu et al. [31] are close to our estimate of BEV100, while lower than our estimate of BEV300. Wu et al. [31] estimated that Yunnan has the lowest C2G GHG emissions of BEVs and Shandong has the highest emissions of BEVs, while in the present study, Inner Mongolia was estimated to have the highest C2G emissions of BEVs after considering temperature impact on vehicle performance.
GHG emissions reduction and fossil energy saving is the major goal of vehicle electrification. Electricity decarbonization and reducing upstream emissions from vehicle material production are the key to achieving carbon neutrality of the C2G life cycle for electric vehicles. The C2G analysis of vehicle technologies in the study provides insight into pathways of automotive emission reduction and sustainable vehicle material production. In addition to greenhouse gas emission reduction and fossil energy saving, the sustainable development and policymaking for the on-road transportation sector in China are affected by a variety of factors, including the availability and robustness of charging infrastructure, reliability of electricity generation and transmission systems to ensure increased BEV manufacturing and charging electricity consumption, as well as additional charging infrastructure construction costs and battery production costs. A more in-depth analysis and comprehensive economic assessment of different vehicle technologies will broaden our perspective on sustainable transport development, which is crucial for future work.
Supplementary Materials
The following are available online at https://www.mdpi.com/article/10.3390/su15032627/s1, Table S1: Key parameters modified in well-to-pump analysis in the China-GREET model, Table S2: Technical parameters of mid-size cars in China, Table S3: Material composition of different vehicle technologies. Table S4: Consumption-based electricity mix by province in China, Table S5: Future scenario assumptions on fuel economy improvement, Table S6: Future scenario assumptions on electricity generation mix.
Author Contributions
Conceptualization, Y.G. and Z.L.; data collection, Z.L. and Y.G.; data processing and analysis, Z.L. and Y.G.; writing—original draft, Y.G.; writing—review and editing, Z.L., X.H., M.W. and A.A.A. All authors have read and agreed to the published version of the manuscript.
Funding
This research was funded by the Aramco Services Company and the Phase II program of the Clean Vehicle Consortium of the U.S.–China Clean Energy Research Center (CERC-CVC). CERC-CVC is supported by the U.S. Department of Energy. Argonne National Laboratory is a U.S. Department of Energy laboratory operated by UChicago Argonne, LLC under Contract No. DEAC02-06CH11357.
Institutional Review Board Statement
Not applicable.
Informed Consent Statement
Not applicable.
Data Availability Statement
The supplementary information provides data used for the development of China-GREET model. Other data is available on request to the corresponding author.
Acknowledgments
This work was supported by the Aramco Services Company and the Phase II program of the Clean Vehicle Consortium of the U.S.–China Clean Energy Research Center (CERC-CVC). CERC-CVC is supported by the U.S. Department of Energy. Argonne National Laboratory is a U.S. Department of Energy laboratory operated by UChicago Argonne, LLC under Contract No. DEAC02-06CH11357.
Conflicts of Interest
The authors declare no conflict of interest.
References
- He, J.; Li, Z.; Zhang, X.; Wang, H.; Dong, W.; Chang, S.; Ou, X.; Guo, S.; Tian, Z.; Gu, A.; et al. Comprehensive report on China’s long-term low-carbon development strategy and transformation path. Chin. J. Popul. Resour. Environ. 2020, 18, 263–295. [Google Scholar] [CrossRef]
- ICCSD. Research on China’s Long-Term Low-Carbon Development Strategy and Transformation Path; The Institute of Climate Change and Sustainable Development, Tsinghua University: Beijing, China, 2020. [Google Scholar]
- Caineng, Z.; Xiong, B.; Huaqing, X.; Zheng, D.; Zhixin, G.; Ying, W.; Jiang, L.; Songqi, P.; Songtao, W. The role of new energy in carbon neutral. Pet. Explor. Dev. 2021, 48, 480–491. [Google Scholar]
- Jia, Z.; Lin, B. How to achieve the first step of the carbon-neutrality 2060 target in China: The coal substitution perspective. Energy 2021, 233, 121179. [Google Scholar] [CrossRef]
- Wei, Y.-M.; Chen, K.; Kang, J.-N.; Chen, W.; Wang, X.-Y.; Zhang, X. Policy and management of carbon peaking and carbon neutrality: A literature review. Engineering 2022, 14, 52–63. [Google Scholar] [CrossRef]
- Davidson, M.; Karplus, V.J.; Zhang, D.; Zhang, X. Policies and Institutions to Support Carbon Neutrality in China by 2060. Econ. Energy Environ. Policy 2021, 10, 7–25. [Google Scholar] [CrossRef]
- Zhao, X.; Ma, X.; Chen, B.; Shang, Y.; Song, M. Challenges toward carbon neutrality in China: Strategies and countermeasures. Resour. Conserv. Recycl. 2022, 176, 105959. [Google Scholar] [CrossRef]
- Mallapaty, S. How China could be carbon neutral by mid-century. Nature 2020, 586, 482–484. [Google Scholar] [CrossRef]
- Wang, Y.; Guo, C.; Chen, X.; Jia, L.; Guo, X.; Chen, R.; Zhang, M.; Chen, Z.; Wang, H. Carbon peak and carbon neutrality in China: Goals, implementation path and prospects. China Geol. 2021, 4, 720–746. [Google Scholar] [CrossRef]
- Lu, Q.; Duan, H.; Shi, H.; Peng, B.; Liu, Y.; Wu, T.; Du, H.; Wang, S. Decarbonization scenarios and carbon reduction potential for China’s road transportation by 2060. Npj Urban Sustain. 2022, 2, 34. [Google Scholar] [CrossRef]
- Wu, Y.; Yang, Z.; Lin, B.; Liu, H.; Wang, R.; Zhou, B.; Hao, J. Energy consumption and CO2 emission impacts of vehicle electrification in three developed regions of China. Energy Policy 2012, 48, 537–550. [Google Scholar] [CrossRef]
- Gan, Y.; Wang, M.; Lu, Z.; Kelly, J. Taking into account greenhouse gas emissions of electric vehicles for transportation de-carbonization. Energy Policy 2021, 155, 112353. [Google Scholar] [CrossRef]
- Zhang, X.; Liang, Y.; Yu, E.; Rao, R.; Xie, J. Review of electric vehicle policies in China: Content summary and effect analysis. Renew. Sustain. Energy Rev. 2017, 70, 698–714. [Google Scholar] [CrossRef]
- International Energy Agency (IEA). Global Electric Vehicle Outlook 2022. 2022. Available online: https://www.iea.org/reports/global-ev-outlook-2022 (accessed on 10 September 2022).
- Gan, Y.; Lu, Z.; He, X.; Hao, C.; Wang, Y.; Cai, H.; Wang, M.; Elgowainy, A.; Przesmitzki, S.; Bouchard, J. Provincial greenhouse gas emissions of gasoline and plug-in electric vehicles in China: Comparison from the consumption-based electricity perspective. Environ. Sci. Technol. 2021, 55, 6944–6956. [Google Scholar] [CrossRef] [PubMed]
- Wu, D.; Guo, F.; Field, F.R., III; De Kleine, R.D.; Kim, H.C.; Wallington, T.J.; Kirchain, R.E. Regional heterogeneity in the emissions benefits of electrified and lightweighted light-duty vehicles. Environ. Sci. Technol. 2019, 53, 10560–10570. [Google Scholar] [CrossRef]
- Yuksel, T.; Tamayao, M.-A.M.; Hendrickson, C.; Azevedo, I.M.; Michalek, J.J. Effect of regional grid mix, driving patterns and climate on the comparative carbon footprint of gasoline and plug-in electric vehicles in the United States. Environ. Res. Lett. 2016, 11, 044007. [Google Scholar] [CrossRef]
- Yuksel, T.; Michalek, J.J. Effects of regional temperature on electric vehicle efficiency, range, and emissions in the United States. Environ. Sci. Technol. 2015, 49, 3974–3980. [Google Scholar] [CrossRef]
- Yuan, X.; Li, L.; Gou, H.; Dong, T. Energy and environmental impact of battery electric vehicle range in China. Appl. Energy 2015, 157, 75–84. [Google Scholar] [CrossRef]
- Lewis, A.M.; Kelly, J.C.; Keoleian, G.A. Vehicle lightweighting vs. electrification: Life cycle energy and GHG emissions results for diverse powertrain vehicles. Appl. Energy 2014, 126, 13–20. [Google Scholar] [CrossRef]
- Orsi, F.; Muratori, M.; Rocco, M.; Colombo, E.; Rizzoni, G. A multi-dimensional well-to-wheels analysis of passenger vehicles in different regions: Primary energy consumption, CO2 emissions, and economic cost. Appl. Energy 2016, 169, 197–209. [Google Scholar] [CrossRef]
- Cecchel, S.; Chindamo, D.; Collotta, M.; Cornacchia, G.; Panvini, A.; Tomasoni, G.; Gadola, M. Lightweighting in light commercial vehicles: Cradle-to-grave life cycle assessment of a safety-relevant component. Int. J. Life Cycle Assess. 2018, 23, 2043–2054. [Google Scholar] [CrossRef]
- Naranjo, G.P.-S.; Bolonio, D.; Ortega, M.F.; García-Martínez, M.-J. Comparative life cycle assessment of conventional, electric and hybrid passenger vehicles in Spain. J. Clean. Prod. 2021, 291, 125883. [Google Scholar] [CrossRef]
- Hawkins, T.R.; Singh, B.; Majeau-Bettez, G.; Strømman, A.H. Comparative environmental life cycle assessment of conventional and electric vehicles. J. Ind. Ecol. 2013, 17, 53–64. [Google Scholar] [CrossRef]
- Nanaki, E.A.; Koroneos, C.J. Comparative economic and environmental analysis of conventional, hybrid and electric vehicles–the case study of Greece. J. Clean. Prod. 2013, 53, 261–266. [Google Scholar] [CrossRef]
- Tagliaferri, C.; Evangelisti, S.; Acconcia, F.; Domenech, T.; Ekins, P.; Barletta, D.; Lettieri, P. Life cycle assessment of future electric and hybrid vehicles: A cradle-to-grave systems engineering approach. Chem. Eng. Res. Des. 2016, 112, 298–309. [Google Scholar] [CrossRef]
- Lai, X.; Chen, Q.; Tang, X.; Zhou, Y.; Gao, F.; Guo, Y.; Bhagat, R.; Zheng, Y. Critical review of life cycle assessment of lithium-ion batteries for electric vehicles: A lifespan perspective. eTransportation 2022, 12, 100169. [Google Scholar] [CrossRef]
- Huo, H.; Zhang, Q.; Liu, F.; He, K. Climate and environmental effects of electric vehicles versus compressed natural gas vehicles in China: A life-cycle analysis at provincial level. Environ. Sci. Technol. 2013, 47, 1711–1718. [Google Scholar] [CrossRef]
- Shen, W.; Han, W.; Wallington, T.J. Current and future greenhouse gas emissions associated with electricity generation in China: Implications for electric vehicles. Environ. Sci. Technol. 2014, 48, 7069–7075. [Google Scholar] [CrossRef]
- Shen, W.; Han, W.; Wallington, T.J.; Winkler, S.L. China electricity generation greenhouse gas emission intensity in 2030: Implications for electric vehicles. Environ. Sci. Technol. 2019, 53, 6063–6072. [Google Scholar] [CrossRef]
- Wu, Z.; Wang, C.; Wolfram, P.; Zhang, Y.; Sun, X.; Hertwich, E. Assessing electric vehicle policy with region-specific carbon footprints. Appl. Energy 2019, 256, 113923. [Google Scholar] [CrossRef]
- Zheng, Y.; He, X.; Wang, H.; Wang, M.; Zhang, S.; Ma, D.; Wang, B.; Wu, Y. Well-to-wheels greenhouse gas and air pollutant emissions from battery electric vehicles in China. Mitig. Adapt. Strateg. Glob. Change 2020, 25, 355–370. [Google Scholar] [CrossRef]
- Shi, S.; Zhang, H.; Yang, W.; Zhang, Q.; Wang, X. A life-cycle assessment of battery electric and internal combustion engine vehicles: A case in Hebei Province, China. J. Clean. Prod. 2019, 228, 606–618. [Google Scholar] [CrossRef]
- Qiao, Q.; Zhao, F.; Liu, Z.; Jiang, S.; Hao, H. Comparative study on life cycle CO2 emissions from the production of electric and conventional vehicles in China. Energy Procedia 2017, 105, 3584–3595. [Google Scholar] [CrossRef]
- Yang, L.; Yu, B.; Yang, B.; Chen, H.; Malima, G.; Wei, Y.-M. Life cycle environmental assessment of electric and internal combustion engine vehicles in China. J. Clean. Prod. 2021, 285, 124899. [Google Scholar] [CrossRef]
- Xiong, S.; Ji, J.; Ma, X. Comparative life cycle energy and GHG emission analysis for BEVs and PHEVs: A case study in China. Energies 2019, 12, 834. [Google Scholar] [CrossRef]
- Yu, A.; Wei, Y.; Chen, W.; Peng, N.; Peng, L. Life cycle environmental impacts and carbon emissions: A case study of electric and gasoline vehicles in China. Transp. Res. Part D Transp. Environ. 2018, 65, 409–420. [Google Scholar] [CrossRef]
- Tang, B.; Xu, Y.; Wang, M. Life Cycle Assessment of Battery Electric and Internal Combustion Engine Vehicles Considering the Impact of Electricity Generation Mix: A Case Study in China. Atmosphere 2022, 13, 252. [Google Scholar] [CrossRef]
- Hao, H.; Qiao, Q.; Liu, Z.; Zhao, F. Impact of recycling on energy consumption and greenhouse gas emissions from electric vehicle production: The China 2025 case. Resour. Conserv. Recycl. 2017, 122, 114–125. [Google Scholar] [CrossRef]
- Gan, Y.; El-Houjeiri, H.M.; Badahdah, A.; Lu, Z.; Cai, H.; Przesmitzki, S.; Wang, M. Carbon footprint of global natural gas supplies to China. Nat. Commun. 2020, 11, 824. [Google Scholar] [CrossRef] [PubMed]
- Masnadi, M.S.; El-Houjeiri, H.M.; Schunack, D.; Li, Y.; Roberts, S.O.; Przesmitzki, S.; Brandt, A.R.; Wang, M. Well-to-refinery emissions and net-energy analysis of China’s crude-oil supply. Nat. Energy 2018, 3, 220–226. [Google Scholar] [CrossRef]
- Monfort, J.-C.; El-Houjeiri, H. Energy efficiency and greenhouse gas emissions of petroleum products at China refineries using detailed engineering-based models. In Proceedings of the American Center for Life Cycle Assessment (ACLCA) Conference, Fort Collins, CO, USA, 26 September 2018. [Google Scholar]
- Wang, M.; Elgowainy, A.; Lu, Z.; Benavides, P.T.; Burnham, A.; Cai, H.; Dai, Q.; Hawkins, T.R.; Kelly, J.C.; Kwon, H.; et al. Greenhouse Gases, Regulated Emissions, and Energy Use in Transportation Model® (2019.Net); Argonne National Laboratory: Lemont, IL, USA, 2019.
- International Energy Agency (IEA). World Energy Balance. 2019. Available online: https://iea.blob.core.windows.net/assets/8bd626f1-a403-4b14-964f-f8d0f61e0677/World_Energy_Balances_2019_Overview.pdf (accessed on 11 September 2022).
- China Electricity Council. Annual Compilation of Statistics of the Power Industry 2017; China Electricity Council: Beijing, China, 2018. [Google Scholar]
- National Bureau of Statistics of China. China Energy Statistical Yearbook 2017; China Statistics Press: Beijing, China, 2018.
- China Automobile Fuel Consumption Inquiry System, Ministry of Industry and Information Technology of China. 2019. Available online: http://www.miit.gov.cn/asopCmsSearch/ (accessed on 30 October 2019).
- Ministry of Industry and Information Technology of China. Measures for Passenger Cars Corporate Average Fuel Consumption and New Energy Vehicle Credit Regulation; Ministry of Industry and Information Technology of China: Beijing, China, 2017.
- Zhou, Y.; Vyas, A. VISION Model Description and User’s Guide: Model Used to Estimate the Impacts of Highway Vehicle Technologies and Fuels on Energy Use and Carbon Emissions to 2100; Argonne National Laboratory (ANL): Argonne, IL, USA, 2014.
- He, X.; Ou, S.; Gan, Y.; Lu, Z.; Przesmitzki, S.V.; Bouchard, J.L.; Sui, L.; Amer, A.A.; Lin, Z.; Yu, R. Greenhouse gas consequences of the China dual credit policy. Nat. Commun. 2020, 11, 5212. [Google Scholar] [CrossRef] [PubMed]
- Burnham, A.; Wang, M.; Wu, Y. Development and Applications of GREET 2.7—The Transportation Vehicle-CycleModel; Argonne National Laboratory (ANL): Argonne, IL, USA, 2006.
- Islam, E.; Moawad, A.; Kim, N.; Rousseau, A. An Extensive Study on Sizing, Energy Consumption, and Cost of Advanced Vehicle Technologies; Argonne National Laboratory (ANL): Argonne, IL, USA, 2018.
- China Steel Development and Research Institute. China Steel Yearbook 2017; China Statistics Press: Beijing, China, 2018. [Google Scholar]
- China Nonferrous Metals Industry Association. Yearbook of Nonferrous Metals Industry of China 2018; China Statistics Press: Beijing, China, 2019. [Google Scholar]
- He, X.; Kim, H.C.; Wallington, T.J.; Zhang, S.; Shen, W.; De Kleine, R.; Keoleian, G.A.; Ma, R.; Zheng, Y.; Zhou, B. Cradle-to-gate greenhouse gas (GHG) burdens for aluminum and steel production and cradle-to-grave GHG benefits of vehicle lightweighting in China. Resour. Conserv. Recycl. 2020, 152, 104497. [Google Scholar] [CrossRef]
- Wu, Q.; Gao, W.; Wang, S.; Hao, J. Updated atmospheric speciated mercury emissions from iron and steel production in China during 2000–2015. Atmos. Chem. Phys. 2017, 17, 10423–10433. [Google Scholar] [CrossRef]
- Li, Q.; Zhang, Y.; Liu, X.; Xu, B.; Yang, Y.; Jiang, T. Improvement of gold leaching from a refractory gold concentrate calcine by separate pretreatment of coarse and fine size fractions. Minerals 2017, 7, 80. [Google Scholar] [CrossRef]
- Norgate, T.; Haque, N. Using life cycle assessment to evaluate some environmental impacts of gold production. J. Clean. Prod. 2012, 29, 53–63. [Google Scholar] [CrossRef]
- Hebei Statistical Bureau. Hebei Economic Yearbook 2017; China Statistics Press: Beijing, China, 2018. Available online: https://data.cnki.net/area/Yearbook/Single/N2017120272?dcode=D03 (accessed on 11 September 2022).
- Department of Industry Statistics; National Bureau of Statistics. China Industrial Statistics Yearbook; Department of Industry Statistics; National Bureau of Statistics: Beijing, China, 2018.
- China Automotive Technology & Research Center; China Association of Automobile Manufactures. China Automotive Industry Yearbook; China Automotive Technology & Research Center; China Association of Automobile Manufactures: Beijing, China, 2018. [Google Scholar]
- Gan, Y.; Lu, Z.; Wu, Q.; He, X.; Dai, Q.; Kelly, J.C.; Ankathi, S.K.; Wang, M. Cradle-to-grave mercury emissions of light-duty gasoline and electric vehicles in China. Resour. Conserv. Recycl. 2023, 190, 106736. [Google Scholar] [CrossRef]
- China Automotive Technology Research Center; Automobile Standardization Institute. Research Report of Electric Vehicle Energy Consumption Limits Standard; China Automotive Technology Research Center; Automobile Standardization Institute: Beijing, China, 2018. [Google Scholar]
- National Energy Administration of China. The Plan for Expanding Biofuel Ethanol Production and Promoting Ethanol Usage in Motor Vehicles; National Energy Administration of China: Beijing, China, 2017.
- Energy Transitions Commission (ETC). China 2050: A Fully Developed Rich Zero-Carbon Economy. 2019. Available online: https://www.energy-transitions.org/publications/china-2050-a-fully-developed-rich-zero-carbon-economy/ (accessed on 11 September 2022).
Disclaimer/Publisher’s Note: The statements, opinions and data contained in all publications are solely those of the individual author(s) and contributor(s) and not of MDPI and/or the editor(s). MDPI and/or the editor(s) disclaim responsibility for any injury to people or property resulting from any ideas, methods, instructions or products referred to in the content. |
© 2023 by the authors. Licensee MDPI, Basel, Switzerland. This article is an open access article distributed under the terms and conditions of the Creative Commons Attribution (CC BY) license (https://creativecommons.org/licenses/by/4.0/).