
Seismic Responses of Aqueducts Using a New Type of Self-Centering Seismic Isolation Bearing


Abstract
:1. Introduction
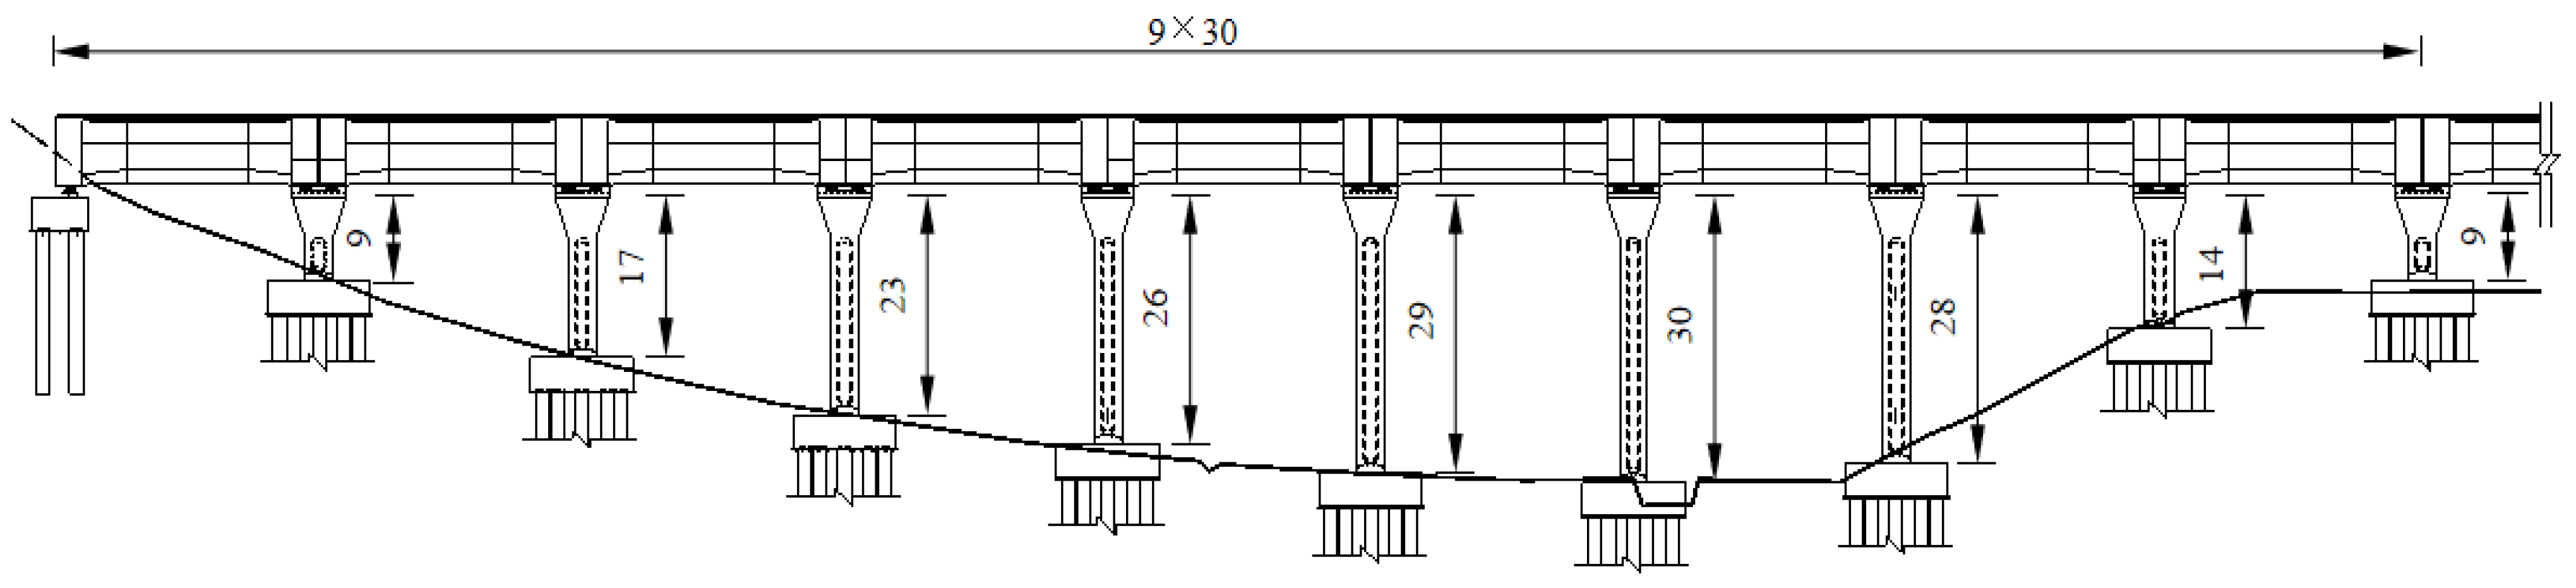
2. An actual Aqueduct Project
2.1. Background Information
2.2. Bearing Settings
3. Design of the Shaking Table Test
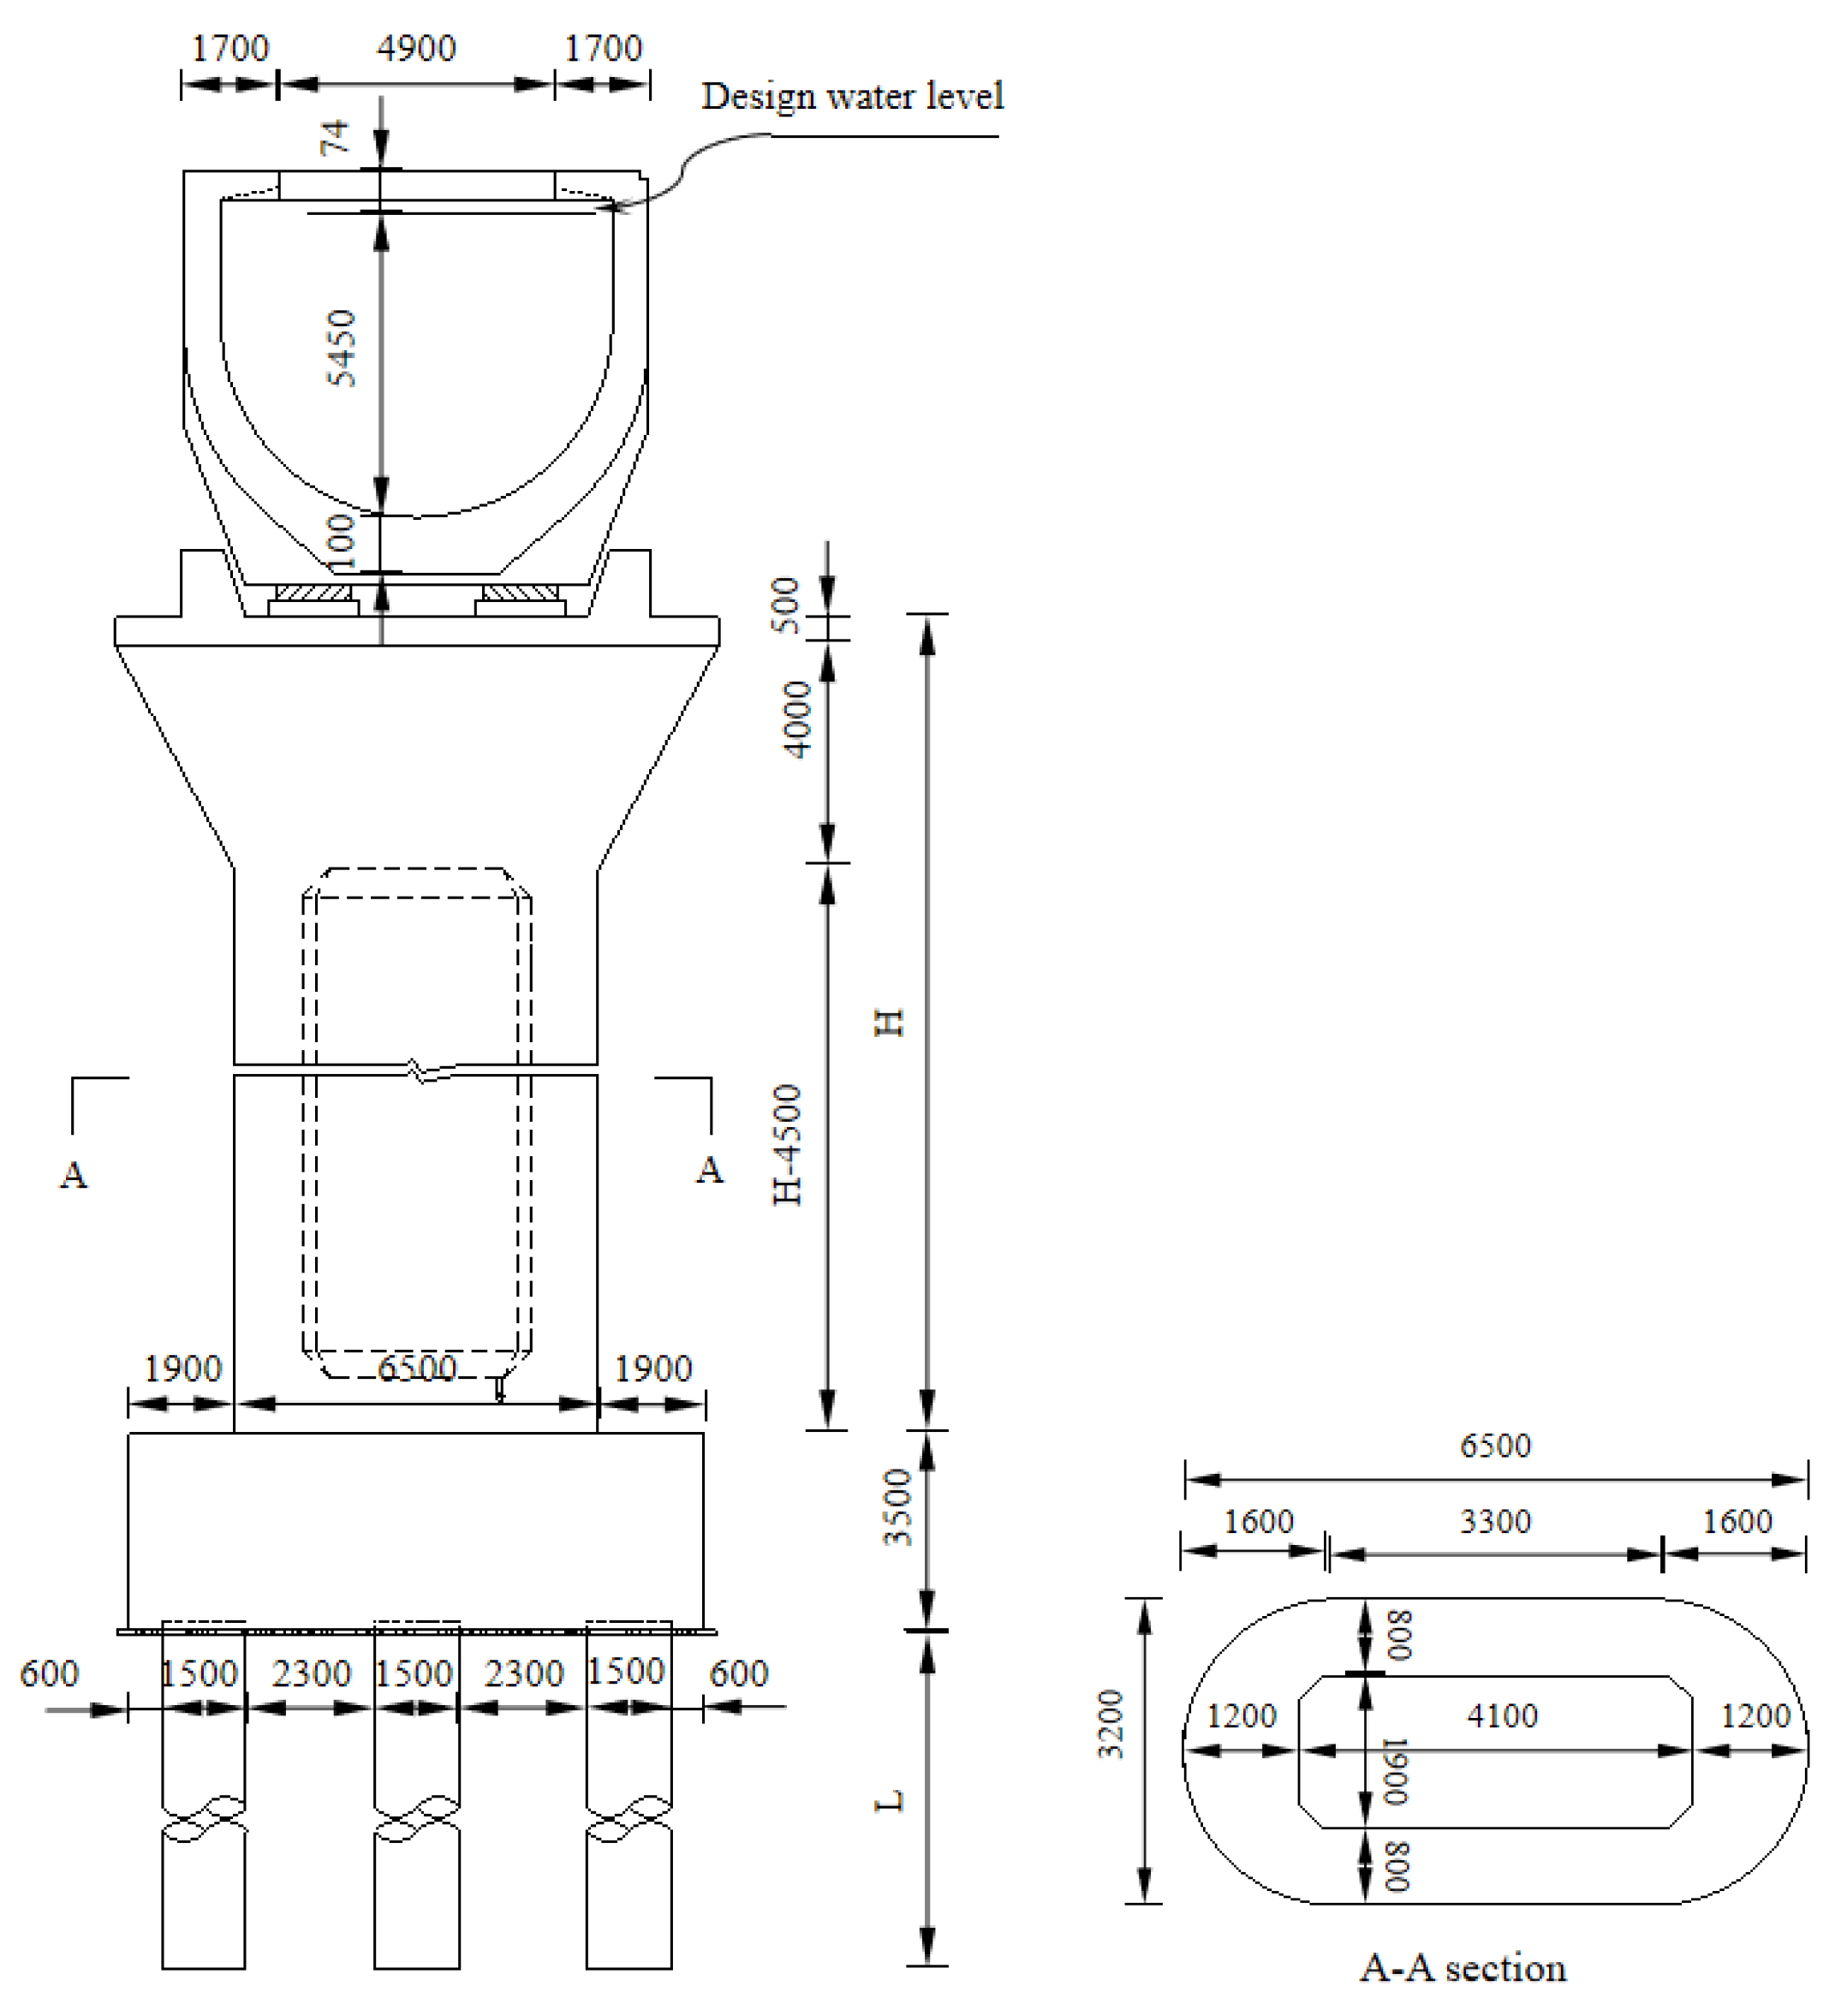
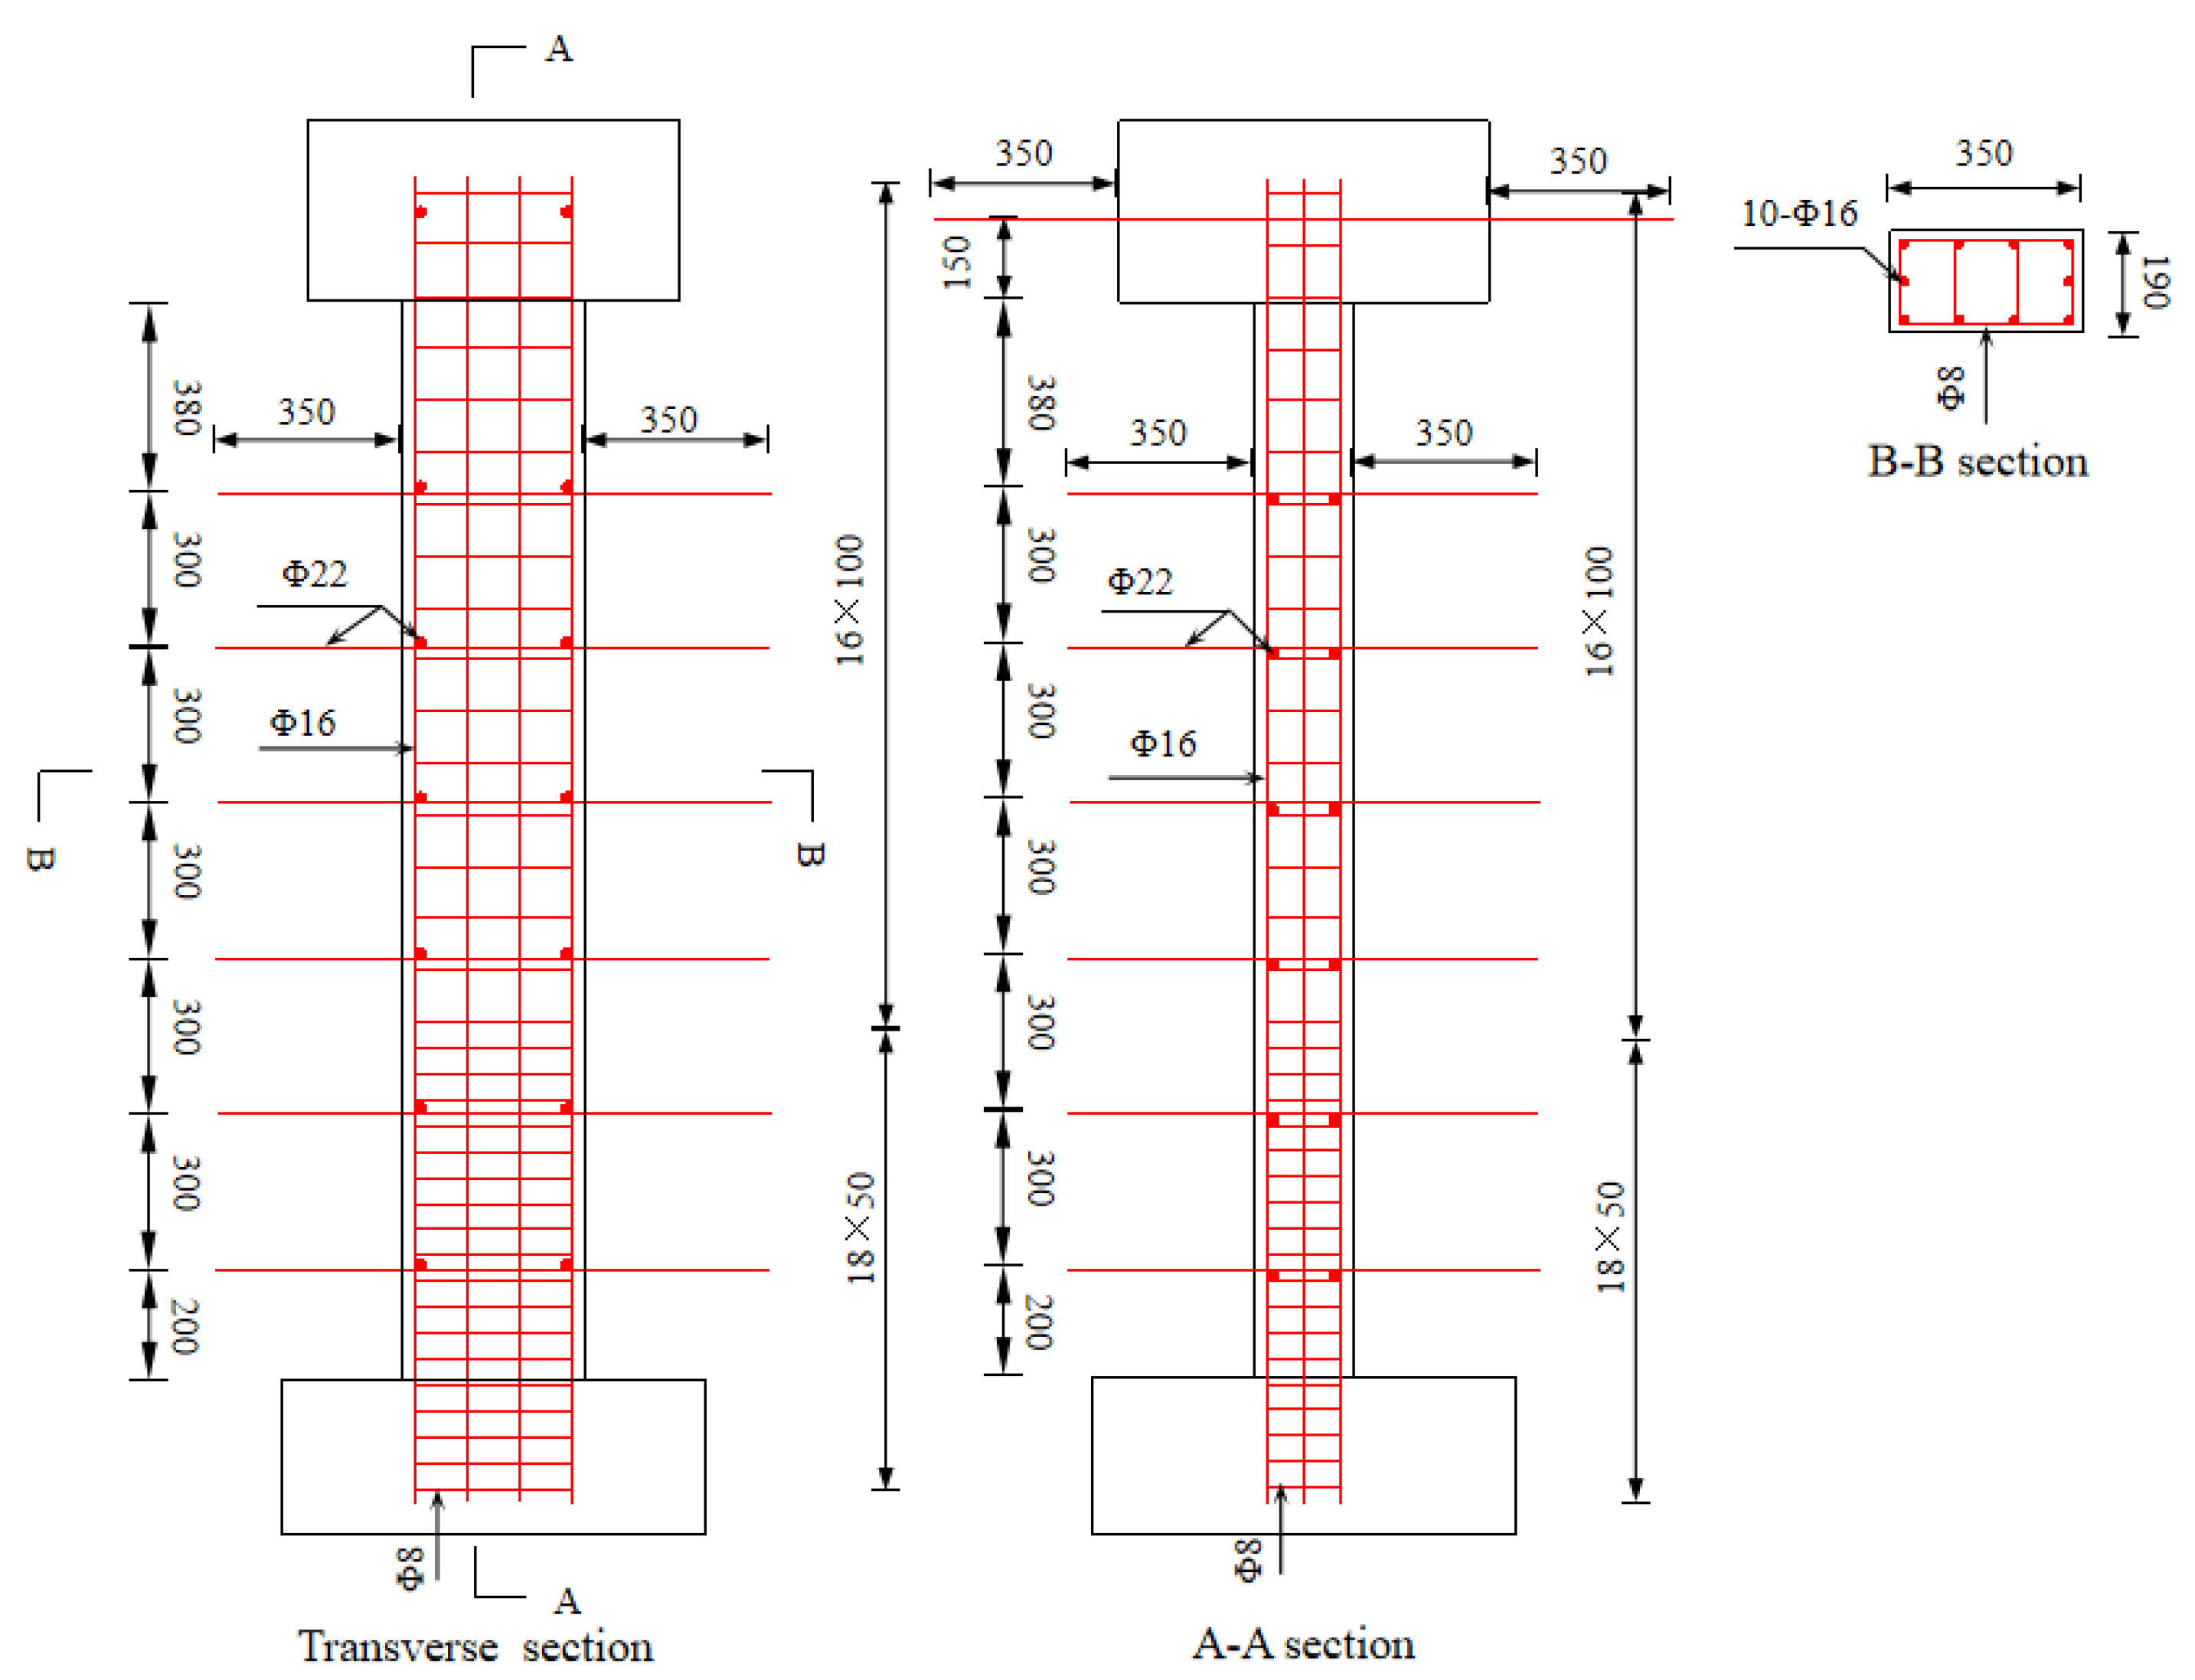
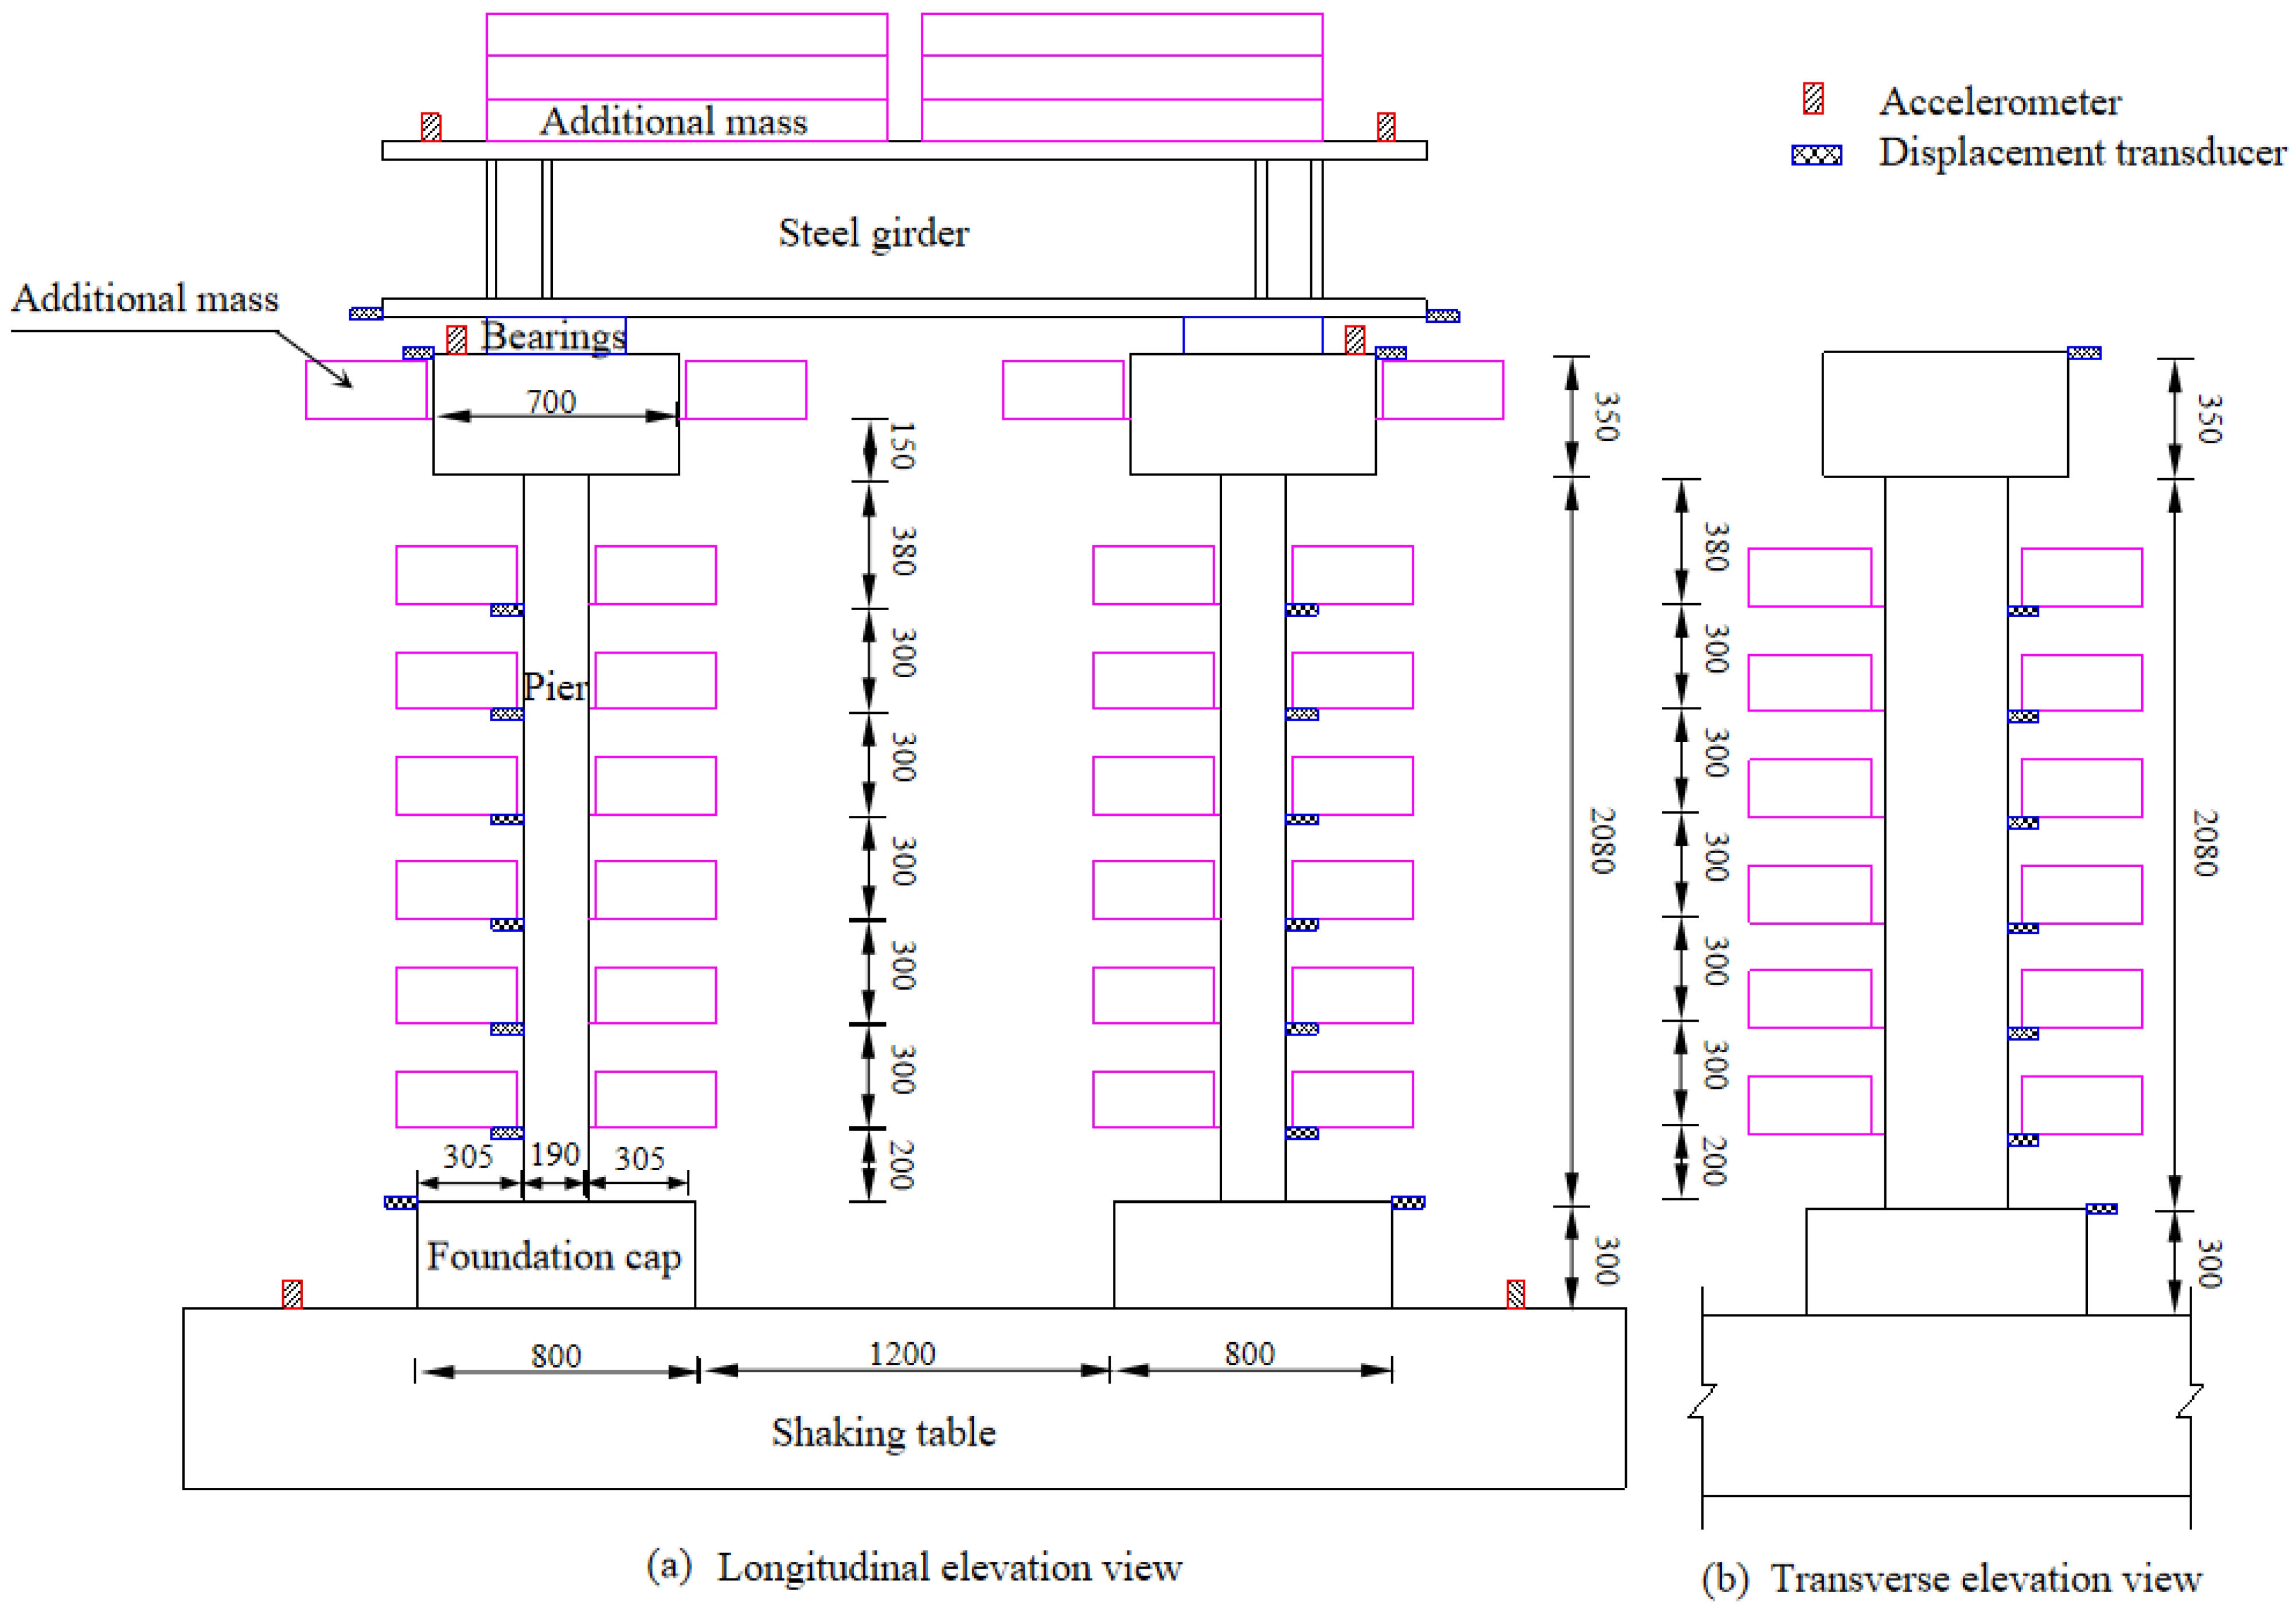
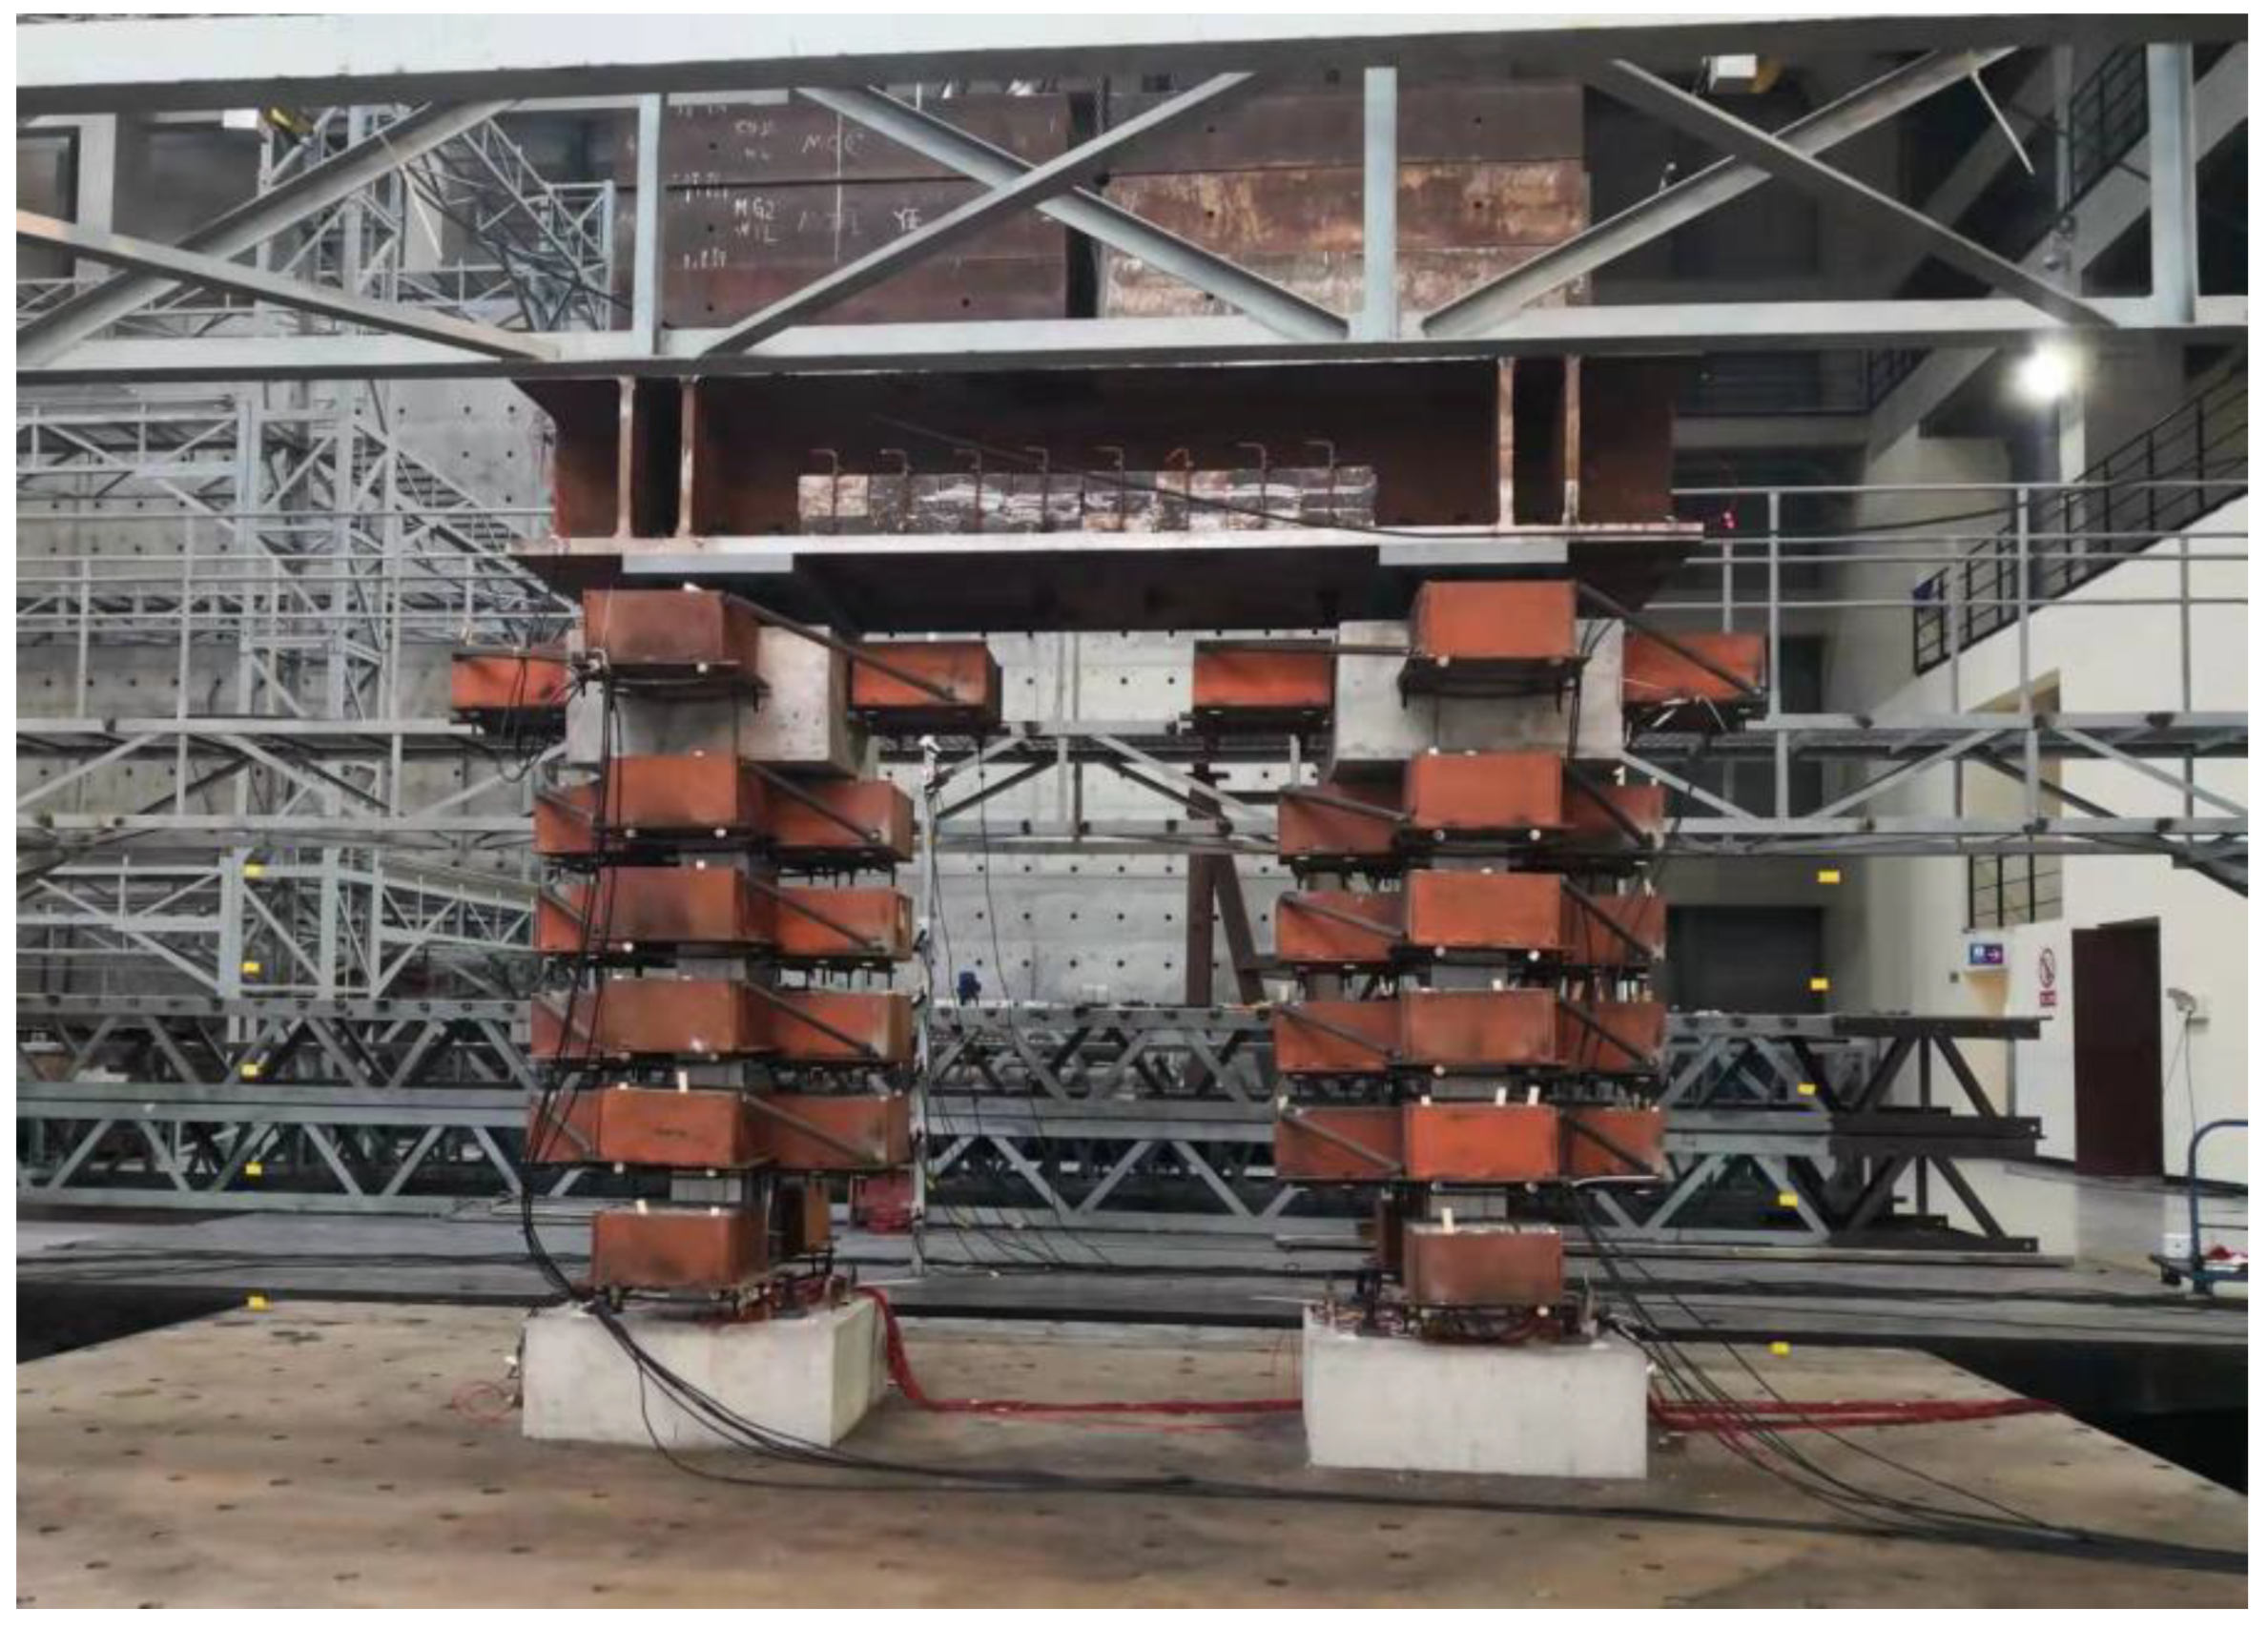
3.1. Test Model Design
3.2. Test Scheme
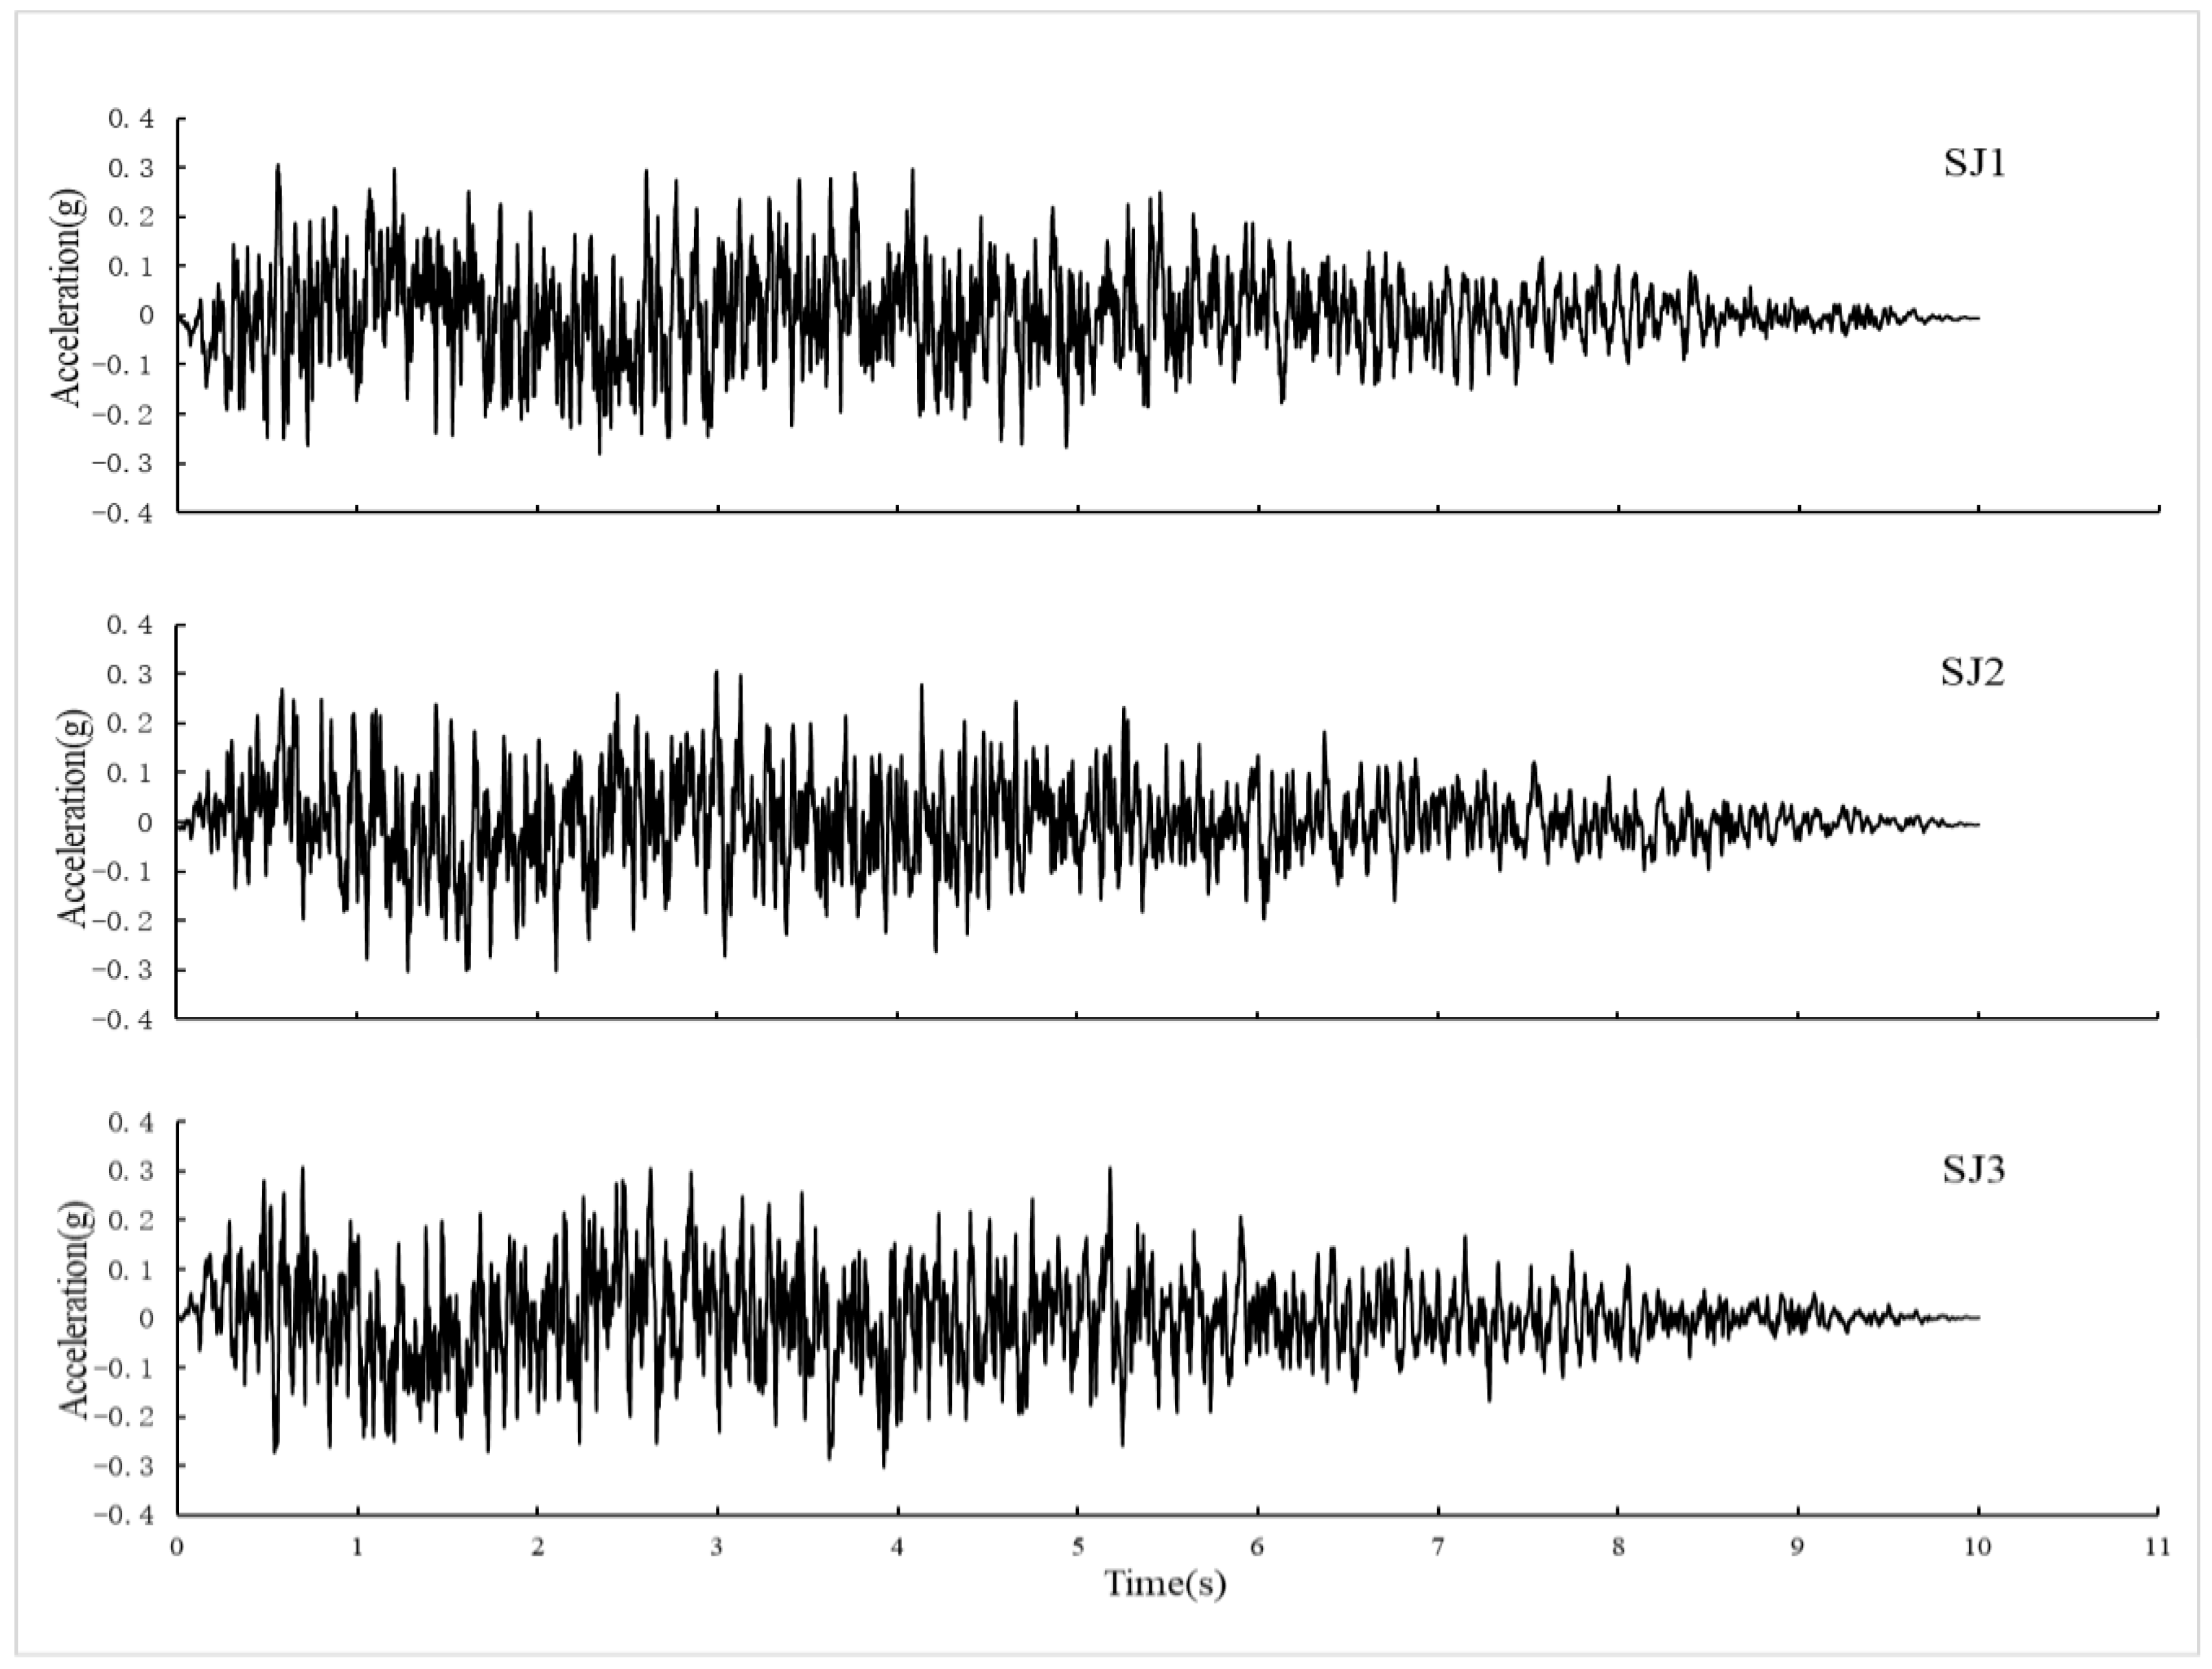
3.3. Earthquake Excitations and Test Cases
4. Analysis of Test Results
4.1. Test Phenomena
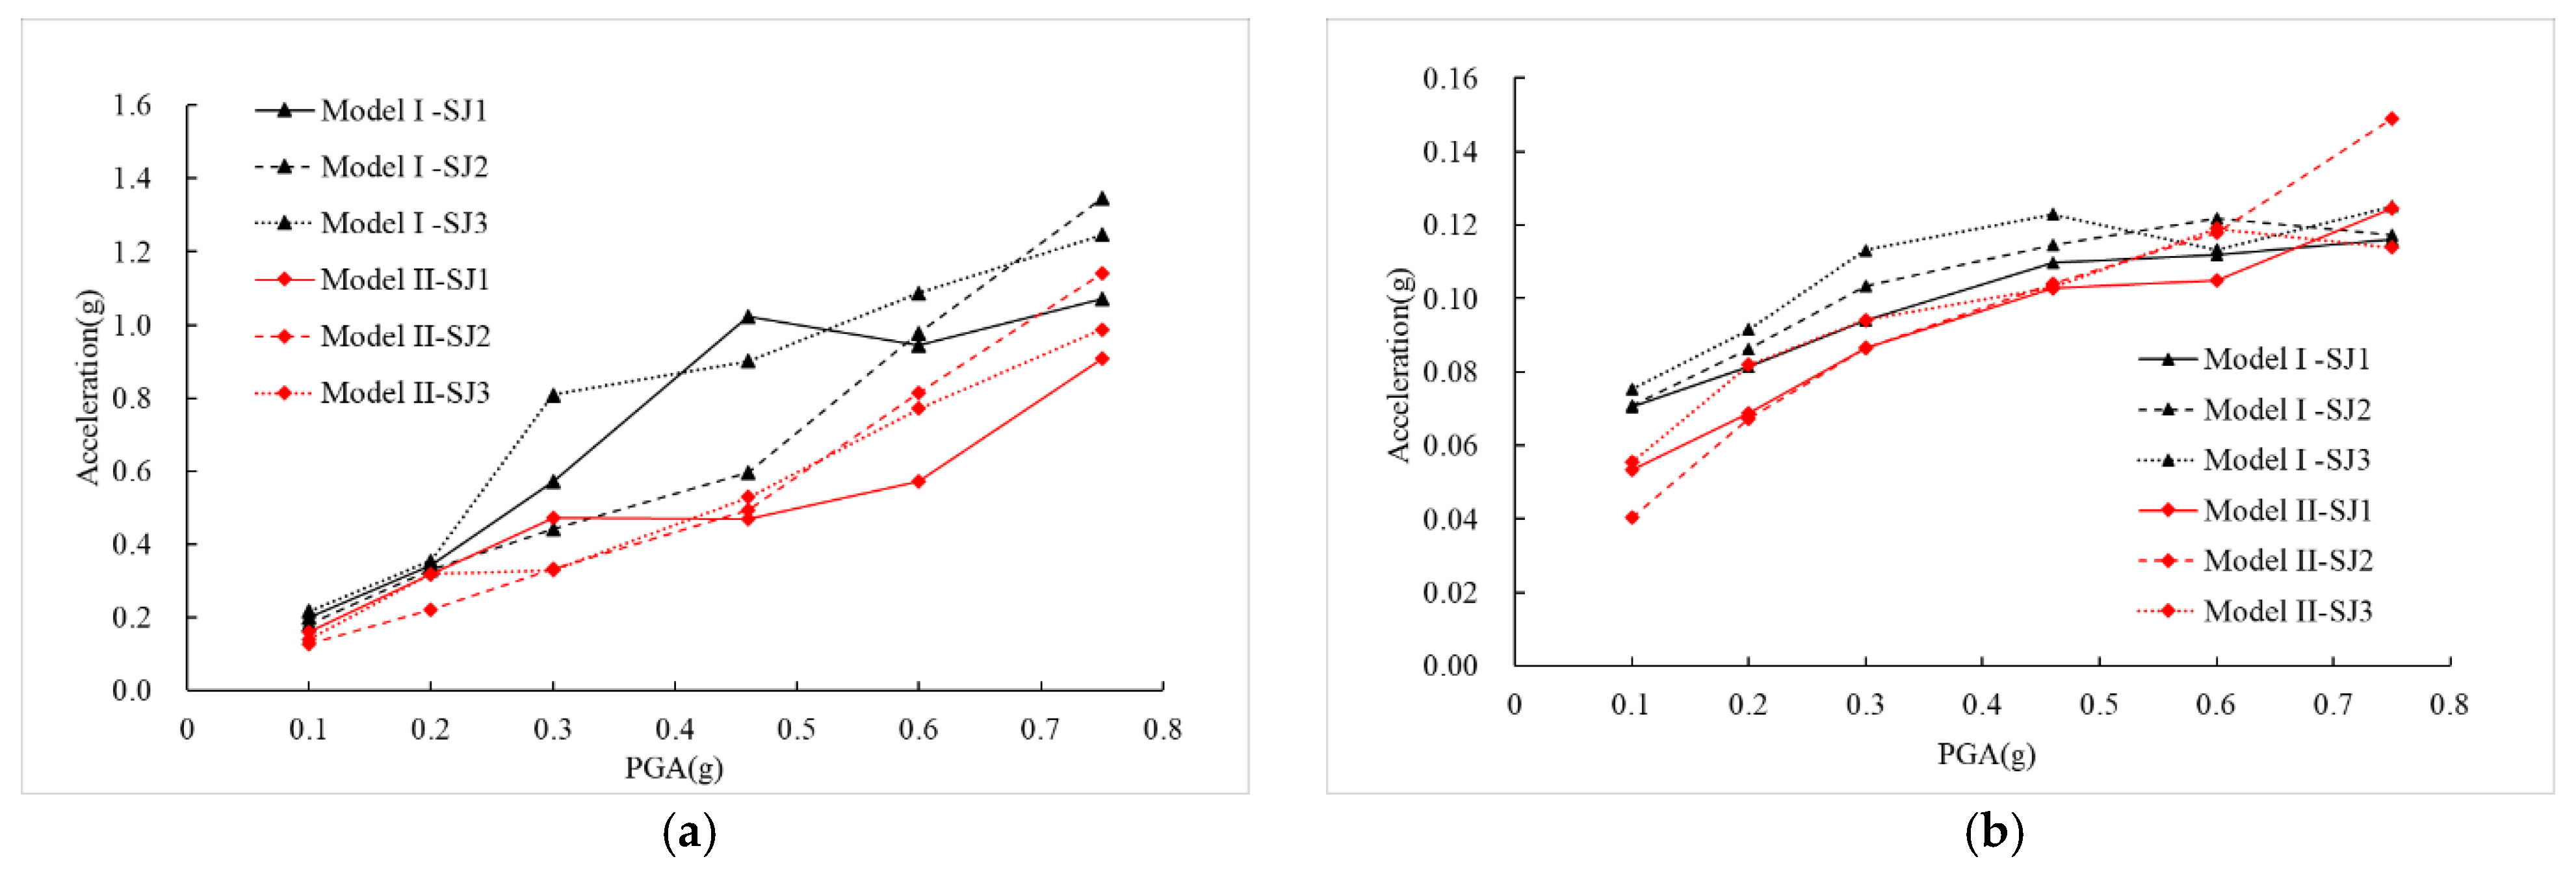
4.2. Seismic Isolation Effect of IPGBs
4.3. Displacement Responses of the IPGBs
4.4. Influence of Pier Height
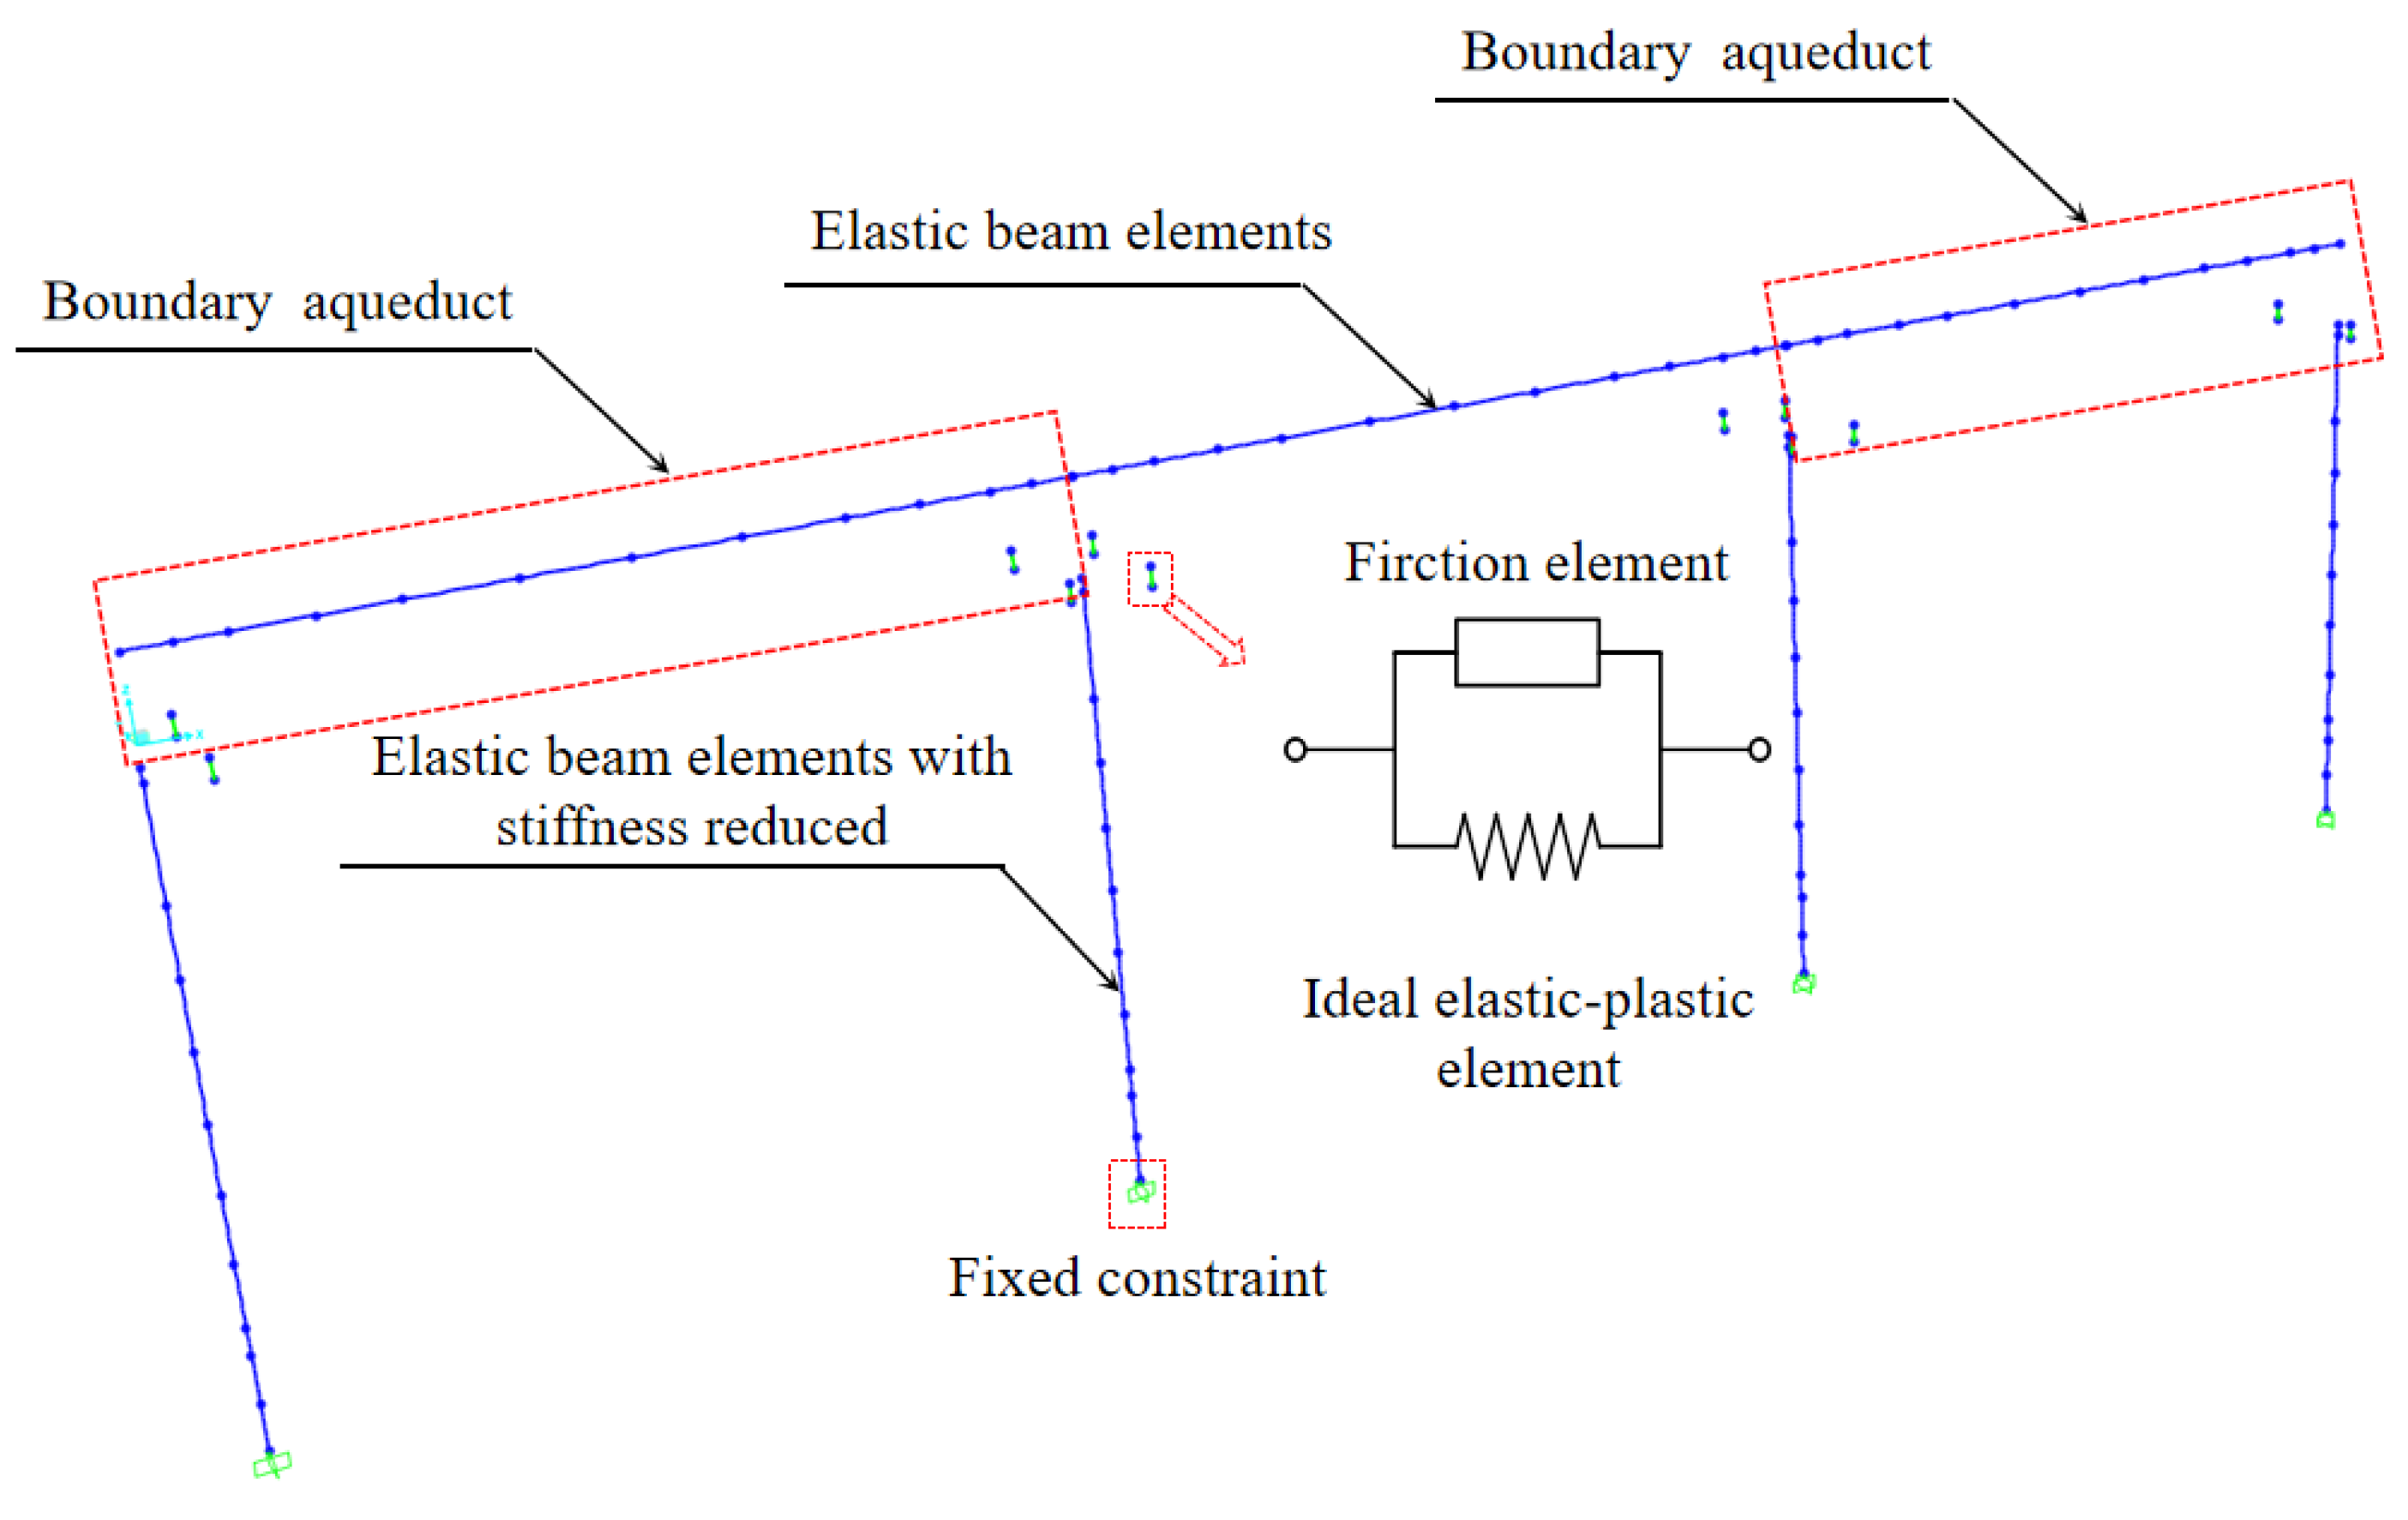
5. Numerical Simulation Method
6. Conclusions
- The seismic isolation rate R is calculated to show the seismic isolation effect of the IPGB. The seismic isolation rate increases with the PGAs, and those of Model I are greater than those of Model II. The seismic isolation rates of both models are greater than 60%, indicating that the IPGBs have an excellent seismic isolation effect.
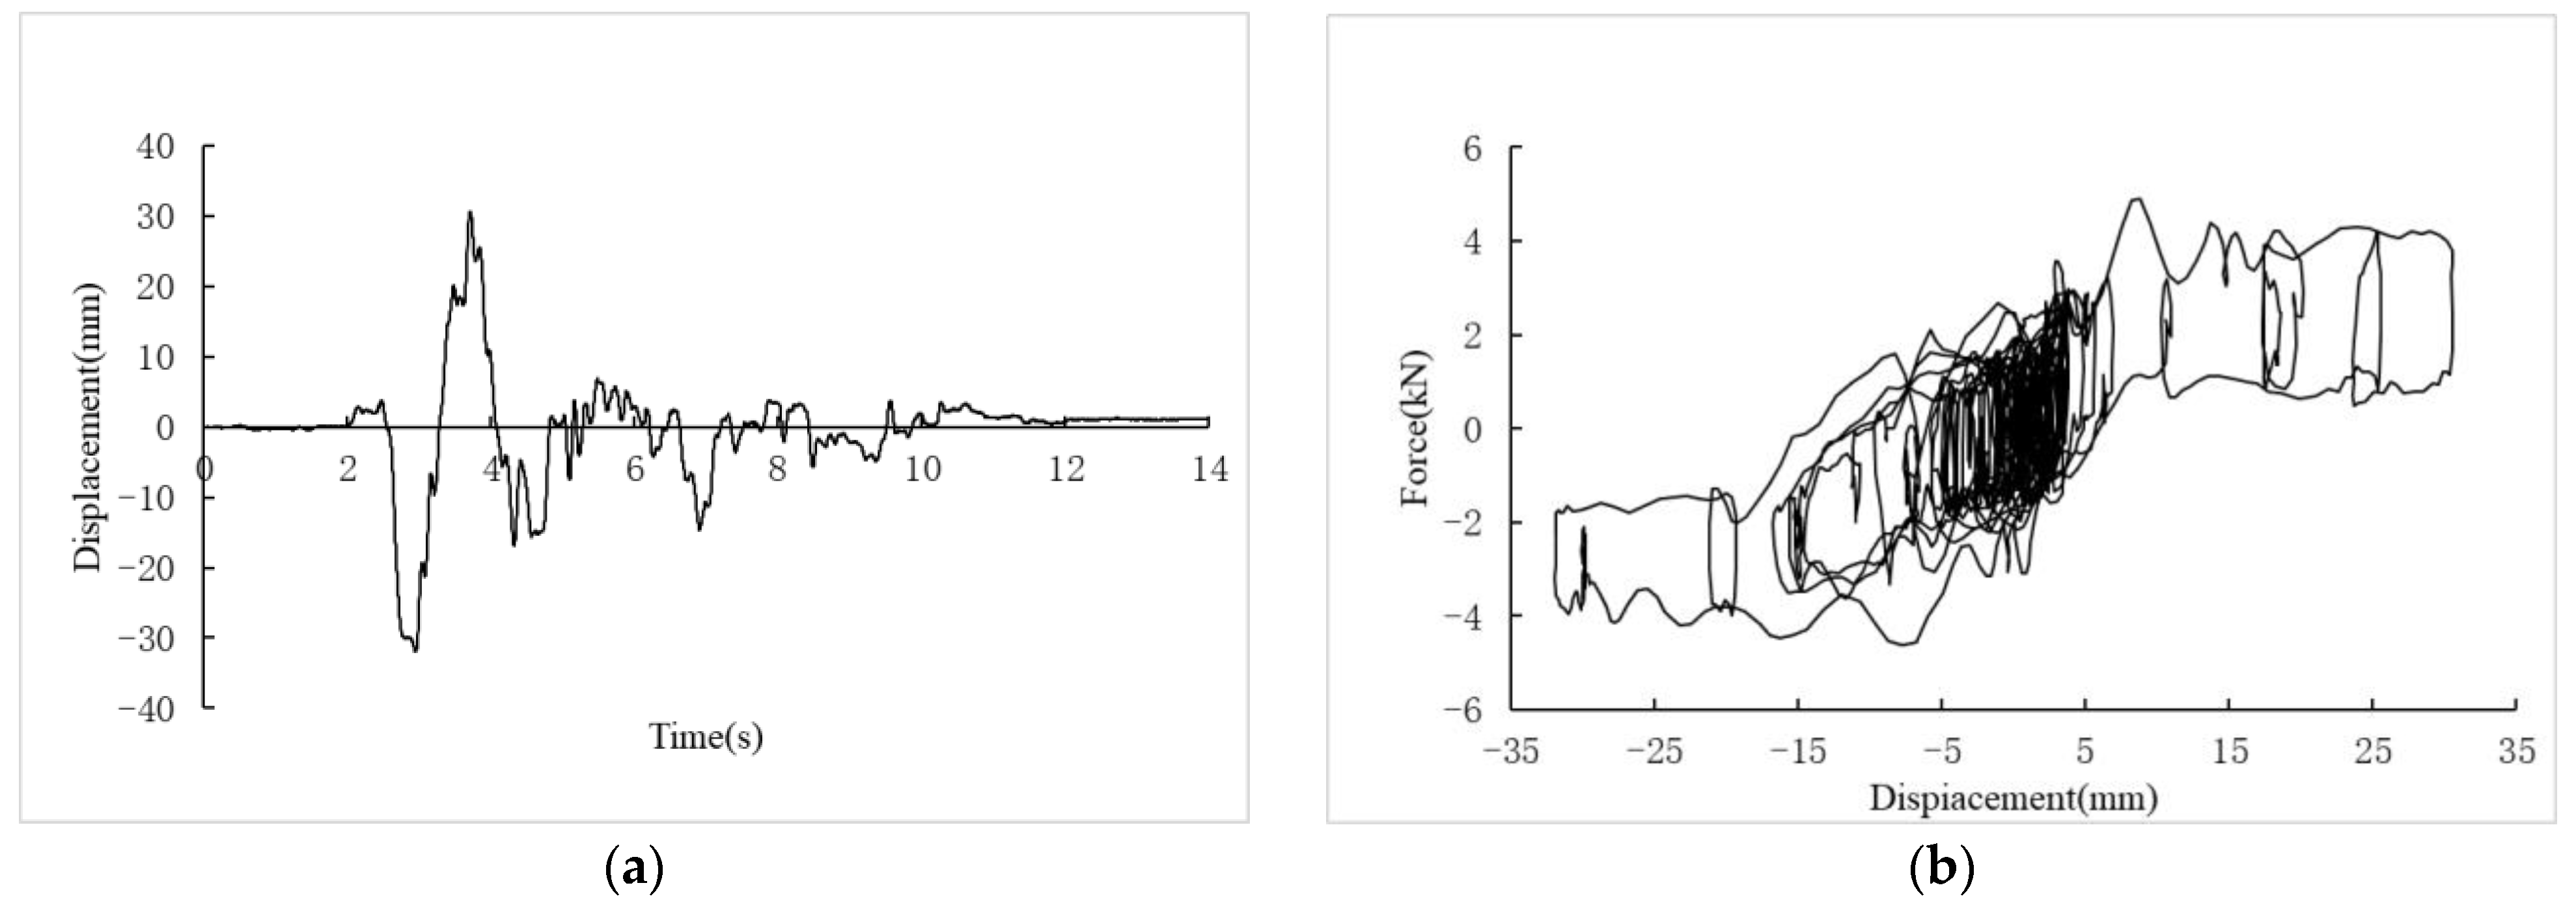
- The average bearing residual displacement of Model II is less than that of Model I, and the bearing residual displacements of both models are less than 1 mm. Therefore, the IPGBs have very good post-earthquake resilience, and the residual displacement of the bearing after the earthquake is minimal.
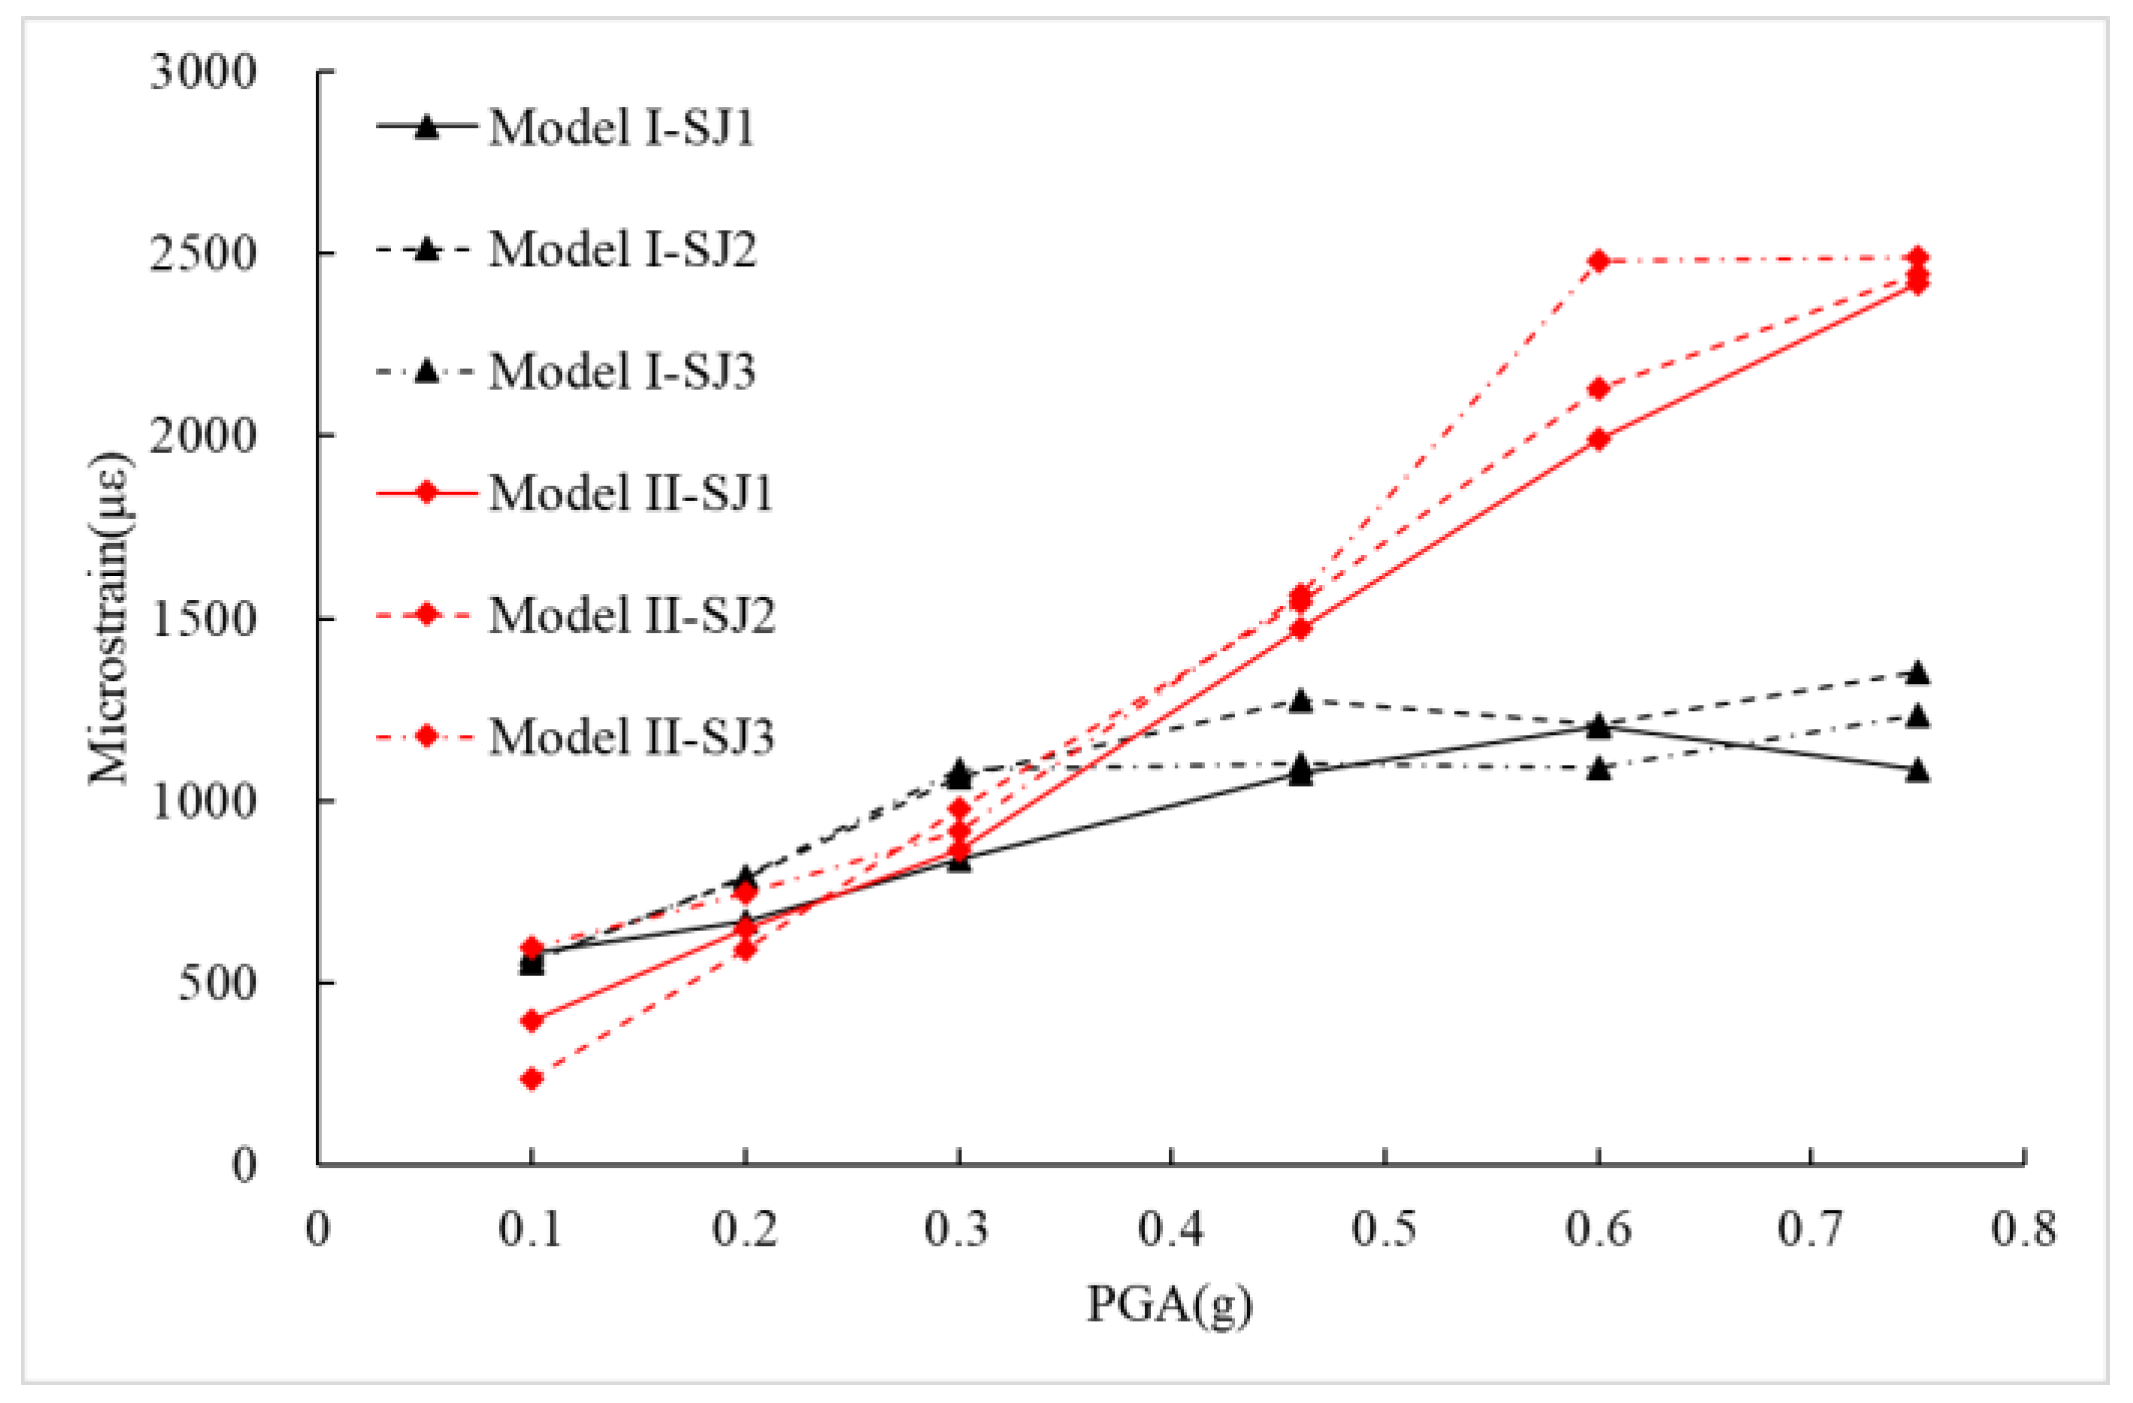
- The pier height has a distinct influence on the aqueduct’s seismic performance. When the PGA is ≥0.3 g, the reinforcement strain at the pier bottom in Model I does not increase with the PGAs. In contrast, the reinforcement strain at the pier bottom in Model II is positively correlated with the PGAs. The aqueduct’s seismic performance in Model II is affected by the high-order mode of the pier.
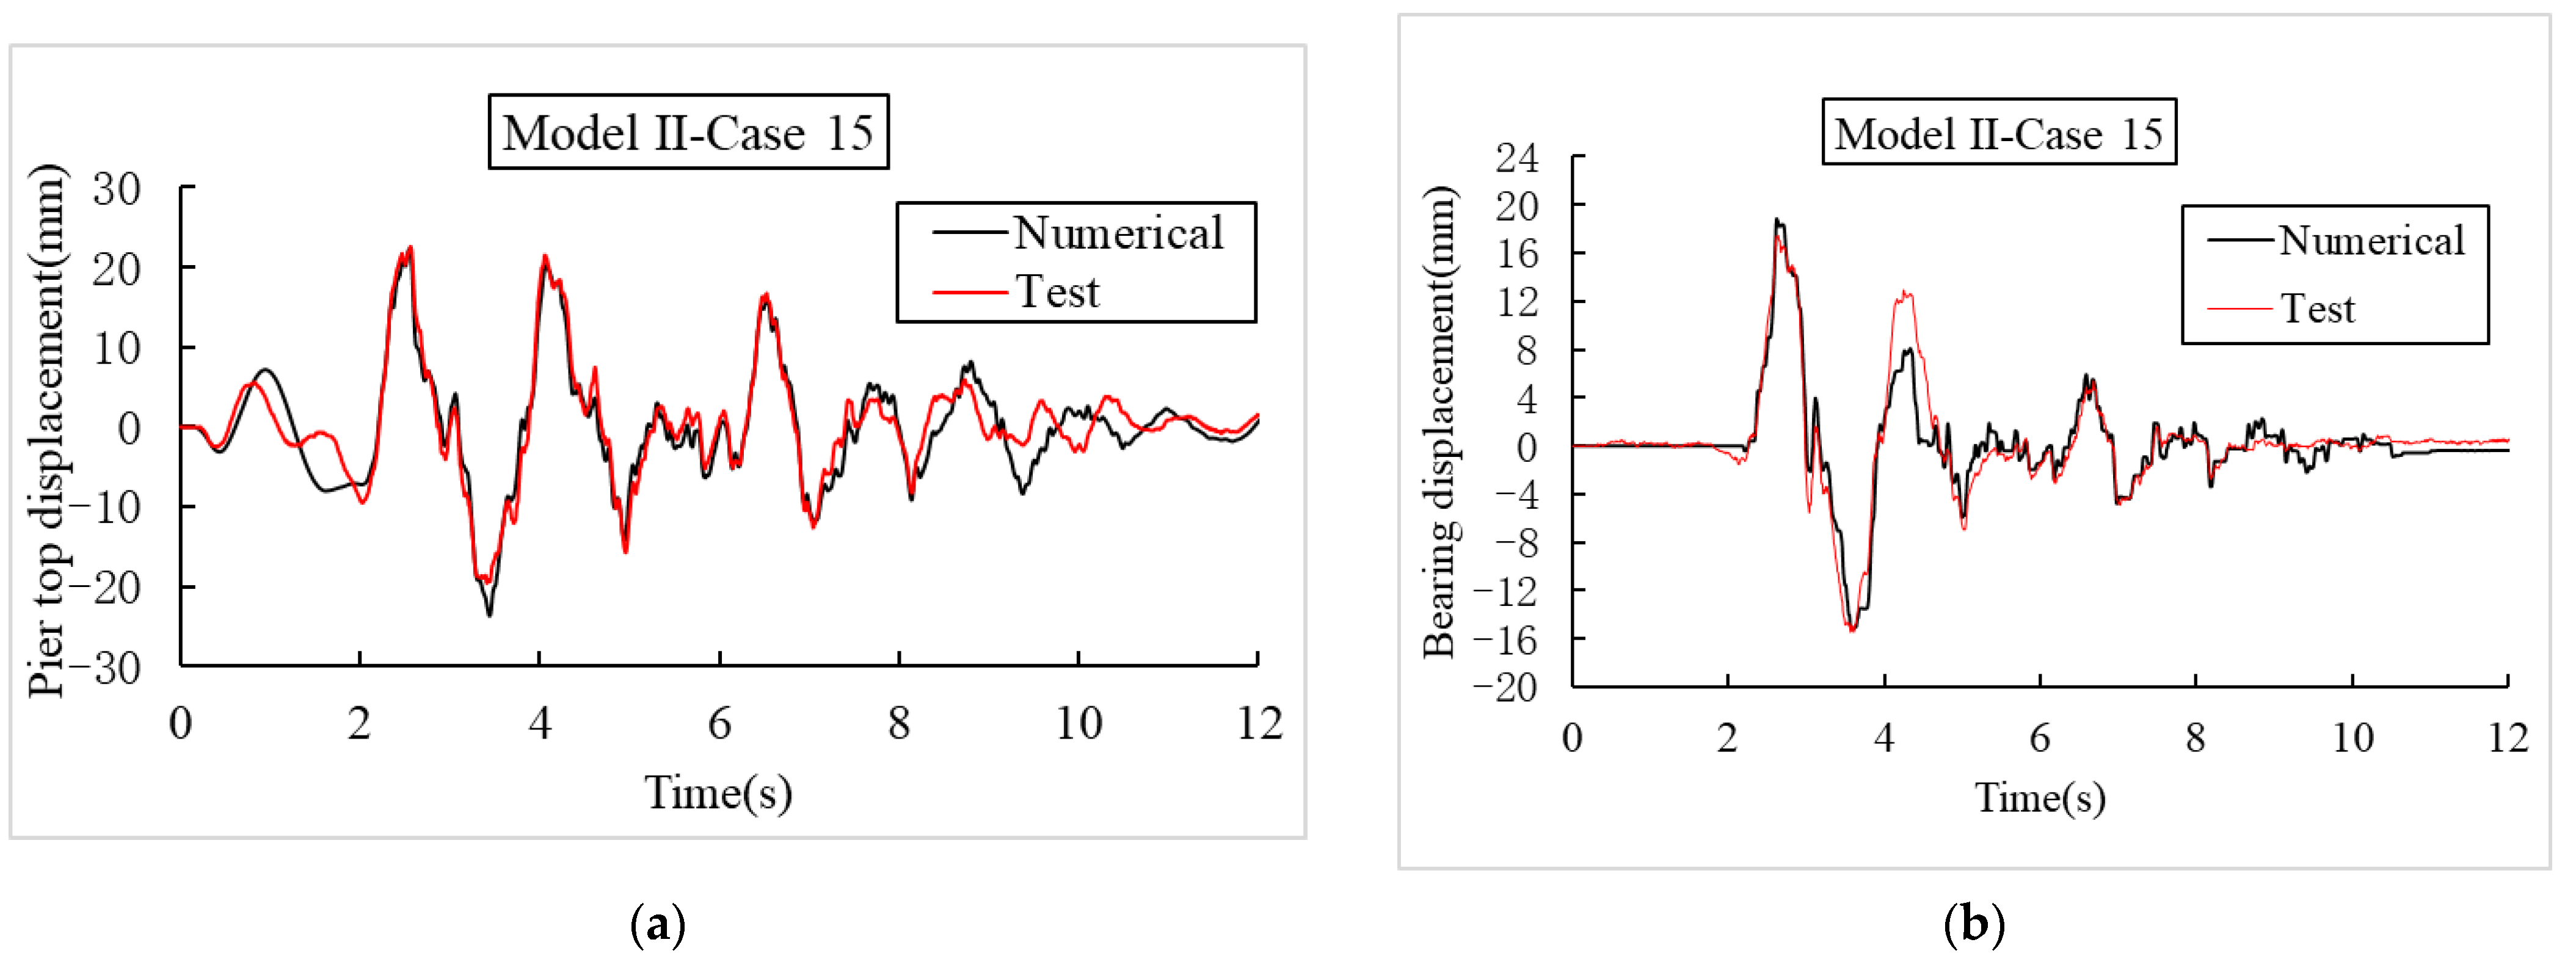
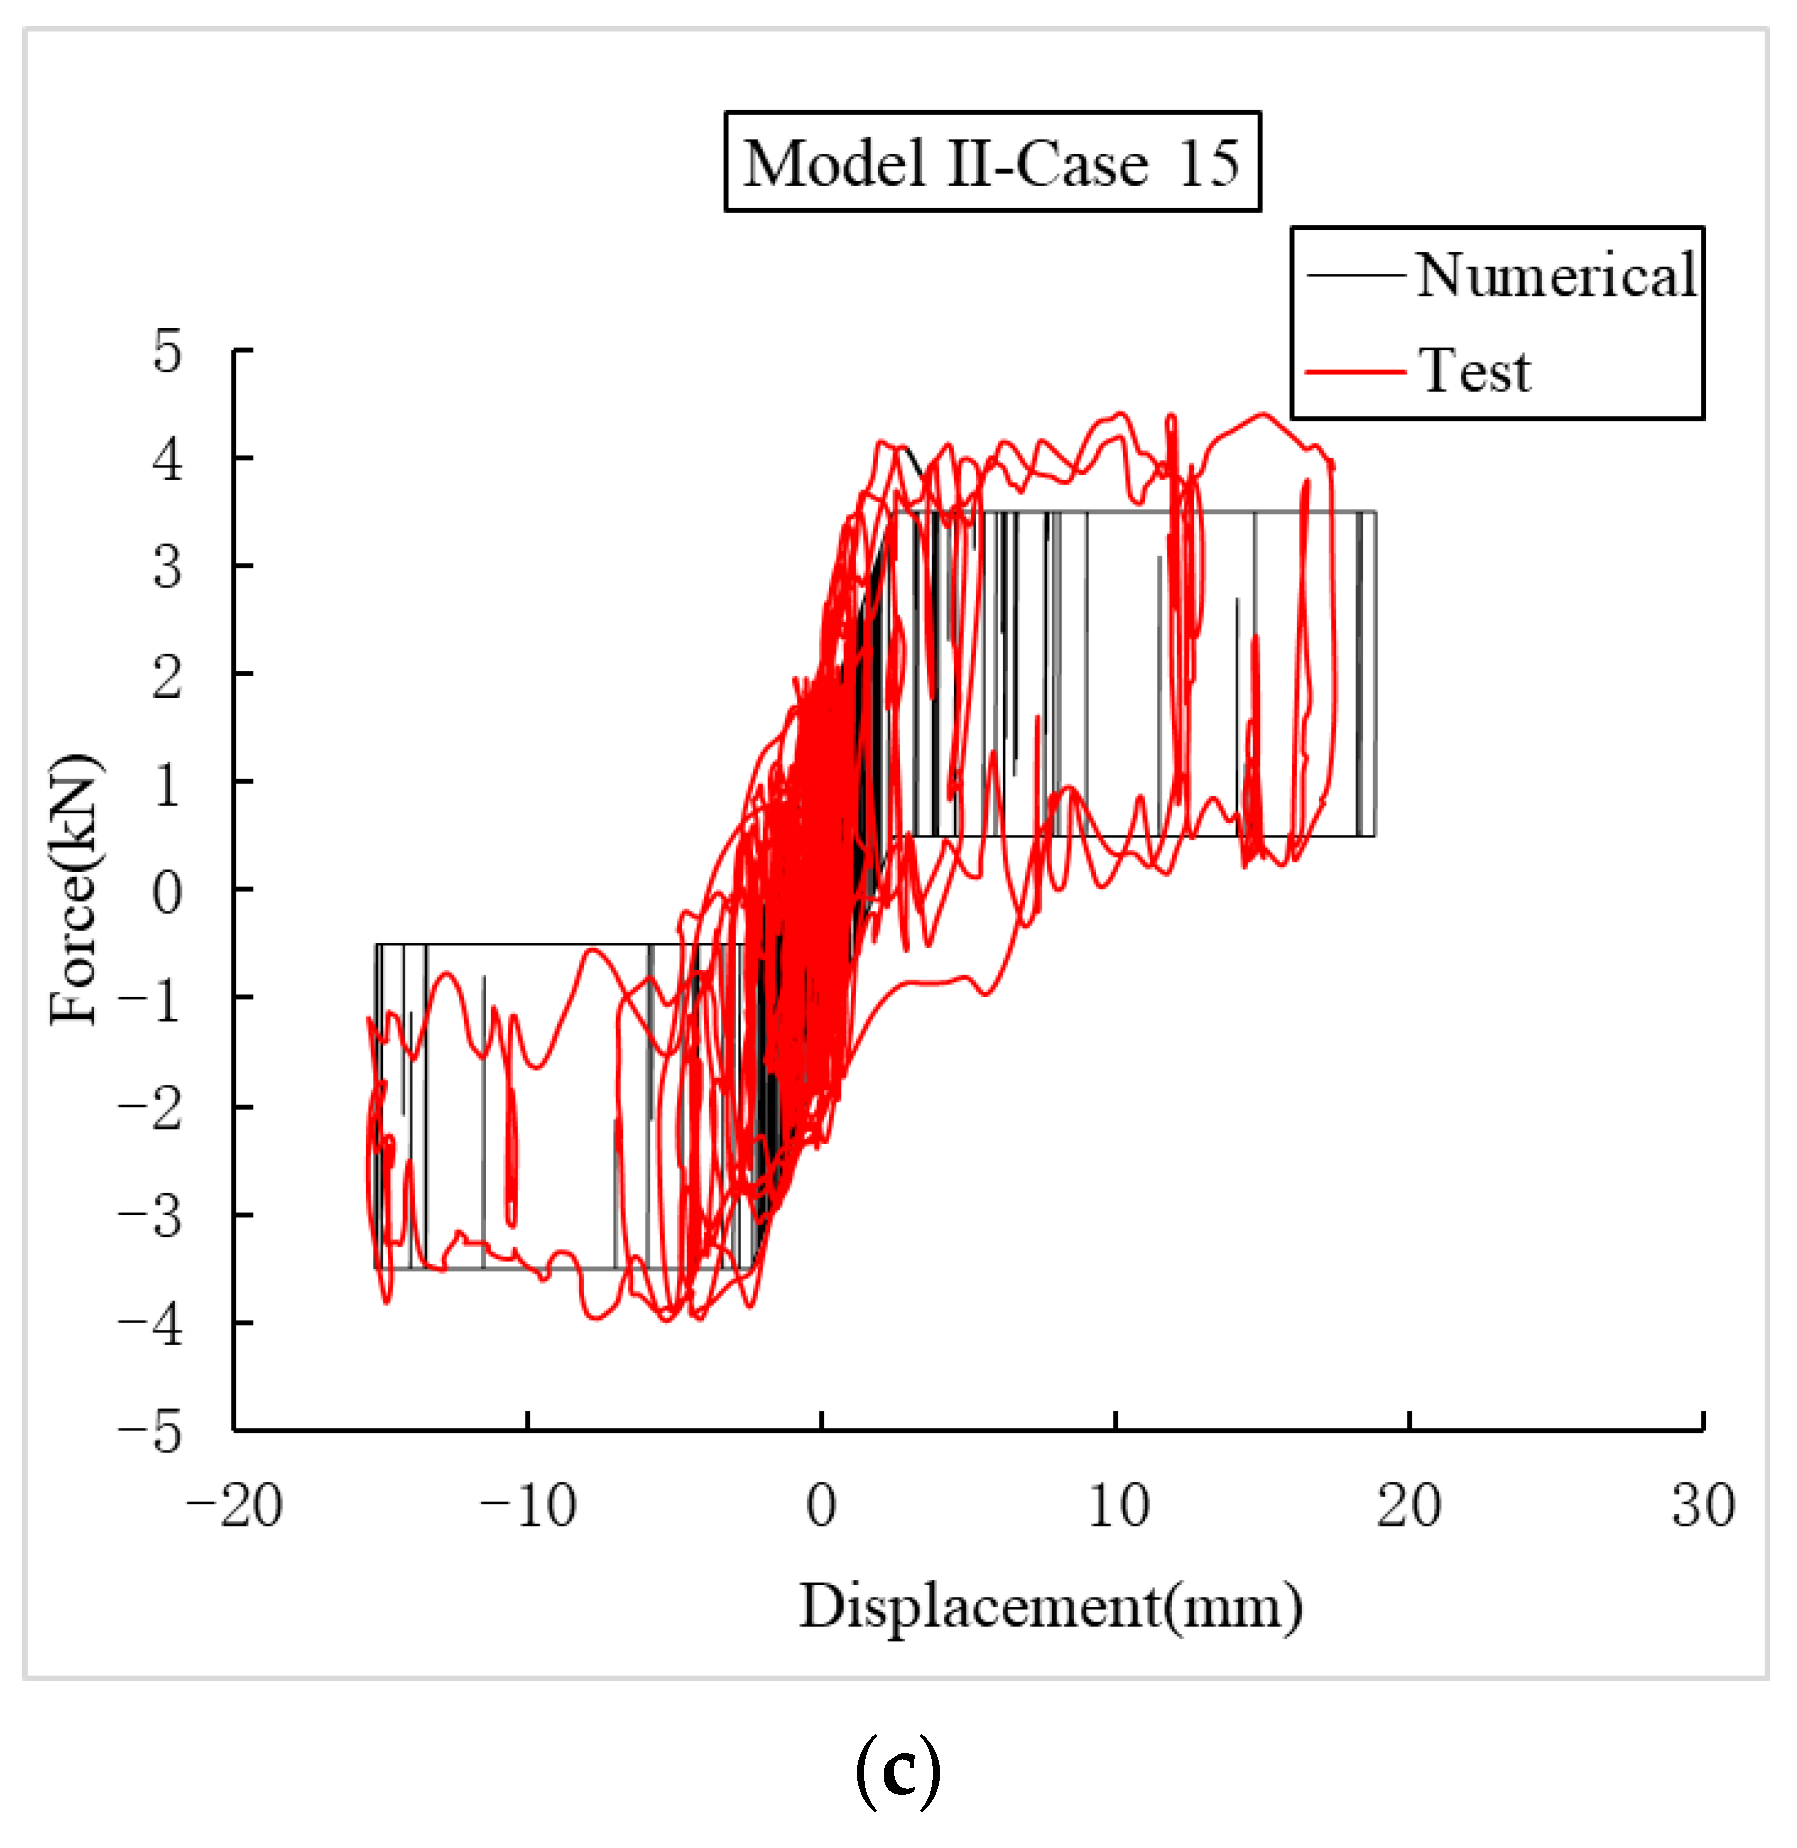
- The maximum errors of pier-top displacement, bearing displacement, and bearing force are 3%, 6%, and 17%, respectively, and the numerical simulation method proposed in this paper is applicable to aqueducts that use IPGBs.
Author Contributions
Funding
Institutional Review Board Statement
Informed Consent Statement
Data Availability Statement
Conflicts of Interest
References
- Gonen, S.; Pulatsu, B.; Erdogmus, E.; Karaesmen, E.; Karaesmen, E. Quasi-Static Nonlinear Seismic Assessment of a Fourth Century A.D. Roman Aqueduct in Istanbul, Turkey. Heritage 2021, 4, 401–421. [Google Scholar] [CrossRef]
- Jieyuan, Z.; Huiting, L.; Tianchen, Z.; Wen, Z.; Lina, T.; Yan, Y.; Yunjun, Z.; Mingfang, T. Effects of Water and Soil Conservation in the Water Source Area of the Middle Route of the South to North Water Transfer Project. Resour. Environ. Yangtze Basin 2021, 30, 310–320. [Google Scholar]
- Seed, R.B.; Marachi, N.D. Seismic risk assessment for a lifeline aqueduct system. Dev. Geotech. Eng. 1987, 45, 415–426. [Google Scholar]
- Scira, M. Chains of damages and failures in a metropolitan environment: Some observations on the Kobe earthquake in 1995. J. Hazard. Mater. 2001, 86, 101–119. [Google Scholar]
- Pagano, A. Bayesian vulnerability assessment tool for drinking water mains under extreme events. Nat. Hazards 2014, 74, 2193–2227. [Google Scholar] [CrossRef]
- Chen, G.; Jin, D.; Mao, J.; Gao, H.; Wang, Z.; Jing, L.; Li, Y.; Li, X. Seismic damage and behavior analysis of earth dams during the 2008 Wenchuan earthquake, China. Eng. Geol. 2014, 180, 99–129. [Google Scholar] [CrossRef]
- Xu, J.; Wang, B.; Chen, H.; Liu, X. Longitudinal nonlinear pounding study of large-scale aqueduct under earthquake. J. Earthq. Eng. Eng. Vib. 2010, 30, 126–133. [Google Scholar]
- Yun-he, L.; Houqun, L. Aseismic Effect of Lead Rubber Bearing for Large Scaled Aqueduct. J. Hydraul. Eng. 2003, 34, 98–103. [Google Scholar]
- Davis, C.; O’Rourke, T. ShakeOut Scenario: Water System Impacts from a Mw 7.8 San Andreas Earthquake. Earthq. Spectra 2011, 27, 459–476. [Google Scholar] [CrossRef]
- Benjelloun, Y.; De Sigoyer, J.; Dessales, H.; Garambois, S.; Şahin, M. Construction history of the aqueduct of Nicaea (Iznik, NW Turkey) and its on-fault deformation viewed from archaeological and geophysical investigations. J. Archaeol. Sci. Rep. 2018, 21, 389–400. [Google Scholar] [CrossRef]
- Liu, Y.; Dang, K.; Dong, J. Finite element analysis of the aseismicity of a large aqueduct. Soil Dyn. Earthq. Eng. 2017, 94, 102–108. [Google Scholar] [CrossRef]
- Drei, A. Linear and non-linear modelling of the seismic behaviour of the stone masonry aqueduct of “Aguas Livres” in Lisbon. In Proceedings of the 1st International Symposium on Earthquake Resistant Engineering Structures (ERES’96), Thessaloniko, Greece, 30 October–1 November 1996. [Google Scholar]
- Drei, A.; Milani, G.; Sincraian, G. DEM numerical approach for masonry aqueducts in seismic zone: Two valuable Portuguese examples. Int. J. Mason. Res. Innov. 2017, 2, 1–29. [Google Scholar] [CrossRef]
- Mamaklı, F.S.; Hamamcıoğlu, T.M.; Aktaş, E.; Vardaroğlu, M. Conservation-Aimed Evaluation of a Historical Aqueduct in İzmir. J. Archit. Eng. 2019, 25, 04019014. [Google Scholar] [CrossRef]
- Beconcini, M.L.; Croce, P.; Marsili, F.; Muzzi, M.; Rosso, E. Probabilistic reliability assessment of a heritage structure under horizontal loads. Probabilistic Eng. Mech. 2016, 45, 198–211. [Google Scholar] [CrossRef]
- Rawat, A.; Matsagar, V.A.; Nagpal, A.K. Earthquake induced sloshing and hydrodynamic pressures in rigid liquid storage tanks analyzed by coupled acoustic-structural and Euler-Lagrange methods. Thin-Walled Struct. 2019, 134, 333–346. [Google Scholar] [CrossRef]
- Housner, G.W. Dynamic pressures on accelerated fluid containers. Bull. Seismol. Soc. Am. 1957, 48, 15–35. [Google Scholar] [CrossRef]
- Moslemi, M.; Farzin, A.; Kianoush, M.R. Nonlinear sloshing response of liquid-filled rectangular concrete tanks under seismic excitation. Eng. Struct. 2019, 188, 564–577. [Google Scholar] [CrossRef]
- Ibrahim, R.A. Liquid Sloshing Dynamics: Theory and Applications; Cambridge University Press: Cambridge, UK; New York, NY, USA, 2005. [Google Scholar]
- Gong, Y.; Li, Y.; Di, Q. Equivalent mechanical models of sloshing fluid in arbitrary-section aqueducts. Earthq. Eng. Struct. Dyn. 2012, 41, 1069–1087. [Google Scholar]
- Xia, F.Z.; Song, Y.; Jing, L.; Xiong, Y. Test Research on Dynamic Characteristics of Vibration Isolation System for Large-scale Aqueduct. South North Water Transf. Water Sci. Technol. 2009, 7, 59–61, 73. [Google Scholar]
- Junrong, H.; Ling, Y.; Shiping, L.; Lunwen, W. Study on seismic isolation design of beam aqueduct in high-intensity area. Water Resour. Plan. Des. 2019, 35, 140–146. [Google Scholar]
- Zhang, H.; Liu, L.; Dong, M.; Sun, H. Analysis of wind-induced vibration of fluid-structure interaction system for isolated aqueduct bridge. Eng. Struct. 2013, 6, 28–37. [Google Scholar] [CrossRef]
- Takahashi, Y. Damage of rubber bearings and dampers of bridges in 2011 Great East Japan Earthquake. In Proceedings of the International Symposium on Engineering Lessons Learned from the 2011 Great East Japan Earthquake, Tokyo, Japan, 1–4 March 2012. [Google Scholar]
- Liu, Y.; Tan, P.; Zhou, F.; Heisha, W.; Mercan, O. Seismic simulation shaking table test of high pier isolation continuous beam. China J. Highw. Transp. 2015, 28, 60–68, 94. [Google Scholar]
- Chen, Y.J.; Honglie, S.; Zhenfa, F. Study on seismic isolation of long span double deck steel truss continuous girder bridge. Appl. Sci. 2022, 12, 2567. [Google Scholar] [CrossRef]
- Zhang, W.W.; Jian, H.; Ying, C.; Xiuli, D. Simplified calculation formula for lateral seismic response of aqueduct structure considering fluid structure coupling. Eng. Mech. 2017, 34, 69–75. [Google Scholar] [CrossRef]
- Zhang, C.; Xu, J.; Wang, B.; Wu, C. Nonlinear random seismic response analysis of the double-trough aqueduct based on fiber beam element model. Soil Dyn. Earthq. Eng. 2021, 150, 106856. [Google Scholar] [CrossRef]
- Zhang, C.; Xu, J.; Qian, Y.; Zhang, J.; Wang, R.; Wang, B. Seismic reliability analysis of random parameter aqueduct structure under random earthquake. Soil Dyn. Earthq. Eng. 2022, 153, 107083. [Google Scholar] [CrossRef]
- Xu, X.Y.; Xuhui, L.; Jiang, L.; AliKhan, M.Y. Dynamic Damage Mechanism and Seismic Fragility Analysis of an Aqueduct Structure. Appl. Sci. 2021, 11, 11709. [Google Scholar] [CrossRef]
- Liu, Z.J.; Xing, F. Stochastic earthquake response and seismic reliability analysis of large-scale aqueduct structures. J. Yangtze River Sci. Res. Inst. 2012, 29, 77–81. [Google Scholar]
- Zeng, B.; Yanfu, X.; Zhangjun, L. Seismic Analysis of large-scale aqueduct structures based on the probability density evolution method. China Earthq. Eng. J. 2014, 36, 99–996. [Google Scholar]
- Zhang, W.; Bo, W.; Jianguo, X.; Liang, H. Solution to reliability of large aqueduct structures subjected to random earthquake ground motions. J. Hydroelectr. Eng. 2018, 37, 13–120. [Google Scholar]
- Chen, H.Q. Seismic safety of the south-to-north water transfer project. J. China Inst. Water Resour. Hydropower Res. 2003, 1, 19–24. [Google Scholar]
- Wang, H.; Li, C.; Zhao, L. Experimental Study on Dynamic Interaction between Large U-Shape Aqueduct and Water. KSCE J. Civ. Eng. 2021, 26, 1203–1213. [Google Scholar] [CrossRef]
- Wang, H.B.; Chunlei, L.; Kunhang, Z. Experimental study on liquid surface sloshing convection in U-shaped aqueduct. J. Water Resour. 2020, 51, 1453–1461. [Google Scholar]
- Wang, H.B.; Chunlei, L.; Can, Z.; Junrong, H. Shaking table test research on fluid structure coupling of large thin-walled aqueducts. J. Water Resour. 2020, 51, 653–663. [Google Scholar]
- Huang, Y.X.; Xiangdong, Q. Experimental study on TLD effect model of aqueduct under strong earthquake. J. Hehai Univ. Nat. Sci. Ed. 2014, 42, 547–552. [Google Scholar]
- Duan, Q.H.; Lou, M.L. Shaking Table Model Test for Vertical Seismic Response of Bent-Type Aqueduct. Adv. Mater. Res. 2011, 163, 4156–4164. [Google Scholar] [CrossRef]
- Krawinkler, H.; Moncarz, P.D. Theory and Application of Experimental Model Analysis in Earthquake Engineering; Tehcnical Report No. 82; Stanford University: Stanford, CA, USA, 1981. [Google Scholar]
- Cristiano, P.A.; Coutinho, C.P.; Baptista, A.J.; Rodrigues, J.D. Reduced scale models based on similitude theory: A review up to 2015. Eng. Struct. 2016, 119, 81–94. [Google Scholar]
- Zhong, J.; Longfei, S.; Tao, Y.; Xiaoxian, L.; Yixian, W. Probabilistic seismic demand model of UBPRC columns conditioned on Pulse-Structure parameters. Eng. Struct. 2022, 270, 114829. [Google Scholar] [CrossRef]
- Zhong, J.; XiangLin, Z.; Qiaofei, W.; LinWei, J.; Min, H.; XinZhi, D. Seismic fragility and resilience assessment of bridge columns with dual-replaceable composite link beam under near-fault GMs. Structures 2023, 474, 12–24. [Google Scholar] [CrossRef]
- AASHTO. Guide Specifications for Seismic Isolation Design, 4th ed.; American Association of State Highway and Transportation Officials: Washington, DC, USA, 2014. [Google Scholar]
- AASHTO. Guide Specifications for LRFD Seismic Bridge Design, 2nd ed.; American Association of State Highway and Transportation Officials: Washington, DC, USA, 2011. [Google Scholar]
- Dao, N.D.; Ryan, K.L.; Sato, E.; Sasaki, T. Predicting the displacement of triple pendulum bearings in a full-scale shaking experiment using a three-dimensional element. Earthq. Eng. Struct. Dyn. 2013, 42, 1677–1695. [Google Scholar] [CrossRef]


| Physical Quantity | Dimensional Calculation | Scale Factors |
|---|---|---|
| Length, l | 0.625 | |
| Displacement, x | 0.625 | |
| Elastic modulus, E | 1 | |
| Strain, | 1 | |
| Stress, | 1 | |
| Density, | 16 | |
| Acceleration, a | 1 | |
| Gravitational acceleration, g | 1 | |
| Concentrated load, P | 0.390 | |
| Moment, M | 0.244 | |
| Time, t | 0.25 | |
| Frequency, | 4 | |
| Damping ratio, | 1 | |
| Stiffness, k | 0.625 | |
| Mass, m | 0.244 |
| Components | Mass of the Ideal Model | Mass of the Test Model | Additional Mass |
|---|---|---|---|
| 20 m-high pier | 3920 | 1040 | 2880 |
| 40 m-high pier | 6490 | 1180 | 5310 |
| Girder | 17,000 | 3000 | 14,000 |
| Case | Model | Earthquake Excitation | PGA (g) | Seismic Intensity Level |
|---|---|---|---|---|
| 1 | Model I and II | White noise | 0.05 | |
| 2 | SJ1 | 0.1 | Frequent earthquakes | |
| 3 | SJ2 | 0.1 | ||
| 4 | SJ3 | 0.1 | ||
| 5 | SJ1 | 0.2 | ||
| 6 | SJ2 | 0.2 | ||
| 7 | SJ3 | 0.2 | ||
| 8 | SJ1 | 0.3 | Design earthquakes | |
| 9 | SJ2 | 0.3 | ||
| 10 | SJ3 | 0.3 | ||
| 11 | SJ1 | 0.45 | Rare earthquakes | |
| 12 | SJ2 | 0.45 | ||
| 13 | SJ3 | 0.45 | ||
| 14 | White noise | 0.05 | ||
| 15 | SJ1 | 0.6 | Rare earthquakes | |
| 16 | SJ2 | 0.6 | ||
| 17 | SJ3 | 0.6 | ||
| 18 | SJ1 | 0.75 | ||
| 19 | SJ2 | 0.75 | ||
| 20 | SJ3 | 0.75 | ||
| 21 | White noise | 0.05 |
| Model | Case 1 | Case 14 | Case 21 |
|---|---|---|---|
| Model I | 3.0 Hz | 2.9 Hz | 2.8 Hz |
| Model II | 1.6 Hz | 1.4 Hz | 1.3 Hz |
| Model | Earthquake Excitation | PGA (g) | |||||
|---|---|---|---|---|---|---|---|
| 0.1 | 0.2 | 0.3 | 0.46 | 0.6 | 0.75 | ||
| Model I | SJ1 | 64.9% | 76.2% | 83.5% | 89.3% | 88.1% | 89.2% |
| SJ2 | 61.1% | 73.8% | 76.6% | 80.7% | 87.5% | 91.3% | |
| SJ3 | 65.4% | 74.2% | 86.0% | 86.4% | 89.6% | 90.0% | |
| Model II | SJ1 | 66.9% | 78.4% | 81.7% | 78.1% | 81.6% | 86.2% |
| SJ2 | 68.5% | 69.6% | 74.1% | 78.9% | 85.5% | 86.9% | |
| SJ3 | 60.6% | 74.3% | 71.4% | 80.5% | 84.6% | 88.4% | |
| Model and Test Condition | Pier-Top Displacement (mm) | Bearing Displacement (mm) | Bearing Force (kN) | ||||||
|---|---|---|---|---|---|---|---|---|---|
| Test | Numerical | Numerical/Test | Test | Numerical | Numerical/Test | Test | Numerical | Numerical/Test | |
| Model I, case 19 | 5.47 | 5.32 | 0.97 | 30.62 | 30.35 | 0.99 | 4.58 | 3.90 | 0.85 |
| Model II, case 15 | 22.63 | 22.26 | 0.98 | 17.46 | 18.45 | 1.06 | 4.21 | 3.50 | 0.83 |
Disclaimer/Publisher’s Note: The statements, opinions and data contained in all publications are solely those of the individual author(s) and contributor(s) and not of MDPI and/or the editor(s). MDPI and/or the editor(s) disclaim responsibility for any injury to people or property resulting from any ideas, methods, instructions or products referred to in the content. |
© 2023 by the authors. Licensee MDPI, Basel, Switzerland. This article is an open access article distributed under the terms and conditions of the Creative Commons Attribution (CC BY) license (https://creativecommons.org/licenses/by/4.0/).
Share and Cite
Peng, T.; Dong, Y. Seismic Responses of Aqueducts Using a New Type of Self-Centering Seismic Isolation Bearing. Sustainability 2023, 15, 2402. https://doi.org/10.3390/su15032402
Peng T, Dong Y. Seismic Responses of Aqueducts Using a New Type of Self-Centering Seismic Isolation Bearing. Sustainability. 2023; 15(3):2402. https://doi.org/10.3390/su15032402
Chicago/Turabian StylePeng, Tianbo, and Yang Dong. 2023. "Seismic Responses of Aqueducts Using a New Type of Self-Centering Seismic Isolation Bearing" Sustainability 15, no. 3: 2402. https://doi.org/10.3390/su15032402
APA StylePeng, T., & Dong, Y. (2023). Seismic Responses of Aqueducts Using a New Type of Self-Centering Seismic Isolation Bearing. Sustainability, 15(3), 2402. https://doi.org/10.3390/su15032402