Article

Experimental Study of a Pump-Driven Microchannel-Separated Heat Pipe System

1
College of Emergency Management, Nanjing Tech University, Nanjing 211816, China
2
Nanjing Canatal Data-Centre Enviromentol Tech Co., Ltd., Nanjing 211111, China
3
School of Energy and Environment, Southeast University, Nanjing 210096, China
*
Authors to whom correspondence should be addressed.
Sustainability 2023, 15(24), 16839; https://doi.org/10.3390/su152416839
Submission received: 1 November 2023 / Revised: 25 November 2023 / Accepted: 11 December 2023 / Published: 14 December 2023

Abstract

:
The current situation of high energy consumption in data centers places high demands on the energy consumption and heat-dissipation efficiency of cooling technology. This article studies the steady-state flow and heat-transfer characteristics of a pump-driven separated heat pipe system from an experimental perspective. After designing and selecting the pump-driven microchannel-separated heat pipe system, an experimental platform is built to test the pump-driven microchannel-separated heat pipe system under variable operating conditions. It is found that the optimal filling rate range of the system is 75% to 95%, and the optimal condensing air volume is 4250 m3/h. The relationship between the circulating mass flow rate and the heat-transfer capacity of the heat pipe system is comprehensively influenced by the resistance of each section and the heat-transfer coefficient at the heat exchanger. When the indoor and outdoor temperature difference increases from 10 °C to 30 °C, the heat transfer increases by 261.5%, and the working medium of R410a has a better heat-transfer performance than R134A at outdoor temperatures ranging from 0 to 15 °C. The results contribute to the application of pump-assisted microchannel heat pipe systems in data center machines, which provide guidance for the application of cabinet-level thermal management.

1. Introduction

As an important carrier of new-generation information and communication technologies such as 5G, artificial intelligence, cloud computing, and block chain, data centers have become the physical foundation of the digital economy era and have an unprecedented strategic position [1]. At the same time, due to the development of electronic technology and higher demand for data processing, servers in data center cabinets and heat-generating components in servers are moving towards higher integration. Even the storage device tape with the lowest heat-dissipation density has an average value of 2 kW/m2 when fully configured. The green demonstration project indicators of the National Data Center provide requirements for a single rack power of no less than 6 kW and a high density of no less than 20 kW [2]. Data show that the power density of small data centers is generally within the range of 120–940 W/m2, while high-power density data centers even reach over 3000 W/m2. Compared to ordinary commercial buildings, the power density is only 50–110 W/m2 [3]. High-heat-density data centers face more severe heat-dissipation problems, requiring cooling technologies with a better heat-transfer performance. The pump-driven microchannel-separated heat pipe is a cooling method that utilizes the phase change of the working fluid to absorb, release latent heat of vaporization, and transfer heat through the flow of the working fluid. This heat pipe relies on gravity and pump-driving force as the driving force for the working fluid cycle, and has advantages such as low energy consumption, high heat-transfer efficiency, flexible layout, and low cost. It has high research value and wide application prospects for data center cooling.
The power of passive separated heat pipes is capillary force and gravity, which do not require external mechanical power. This characteristic is both an advantage and a disadvantage of this type of separated heat pipe. Due to the small driving force of capillary force and gravity, the stability of the system cannot be guaranteed during startup and variable load operation. When the system resistance is too high, the passive separated heat pipe cannot be started. On this basis, researchers designed a mechanically driven separated heat pipe, which has the main advantages of a high heat-transfer capacity and long transmission distance but requires additional mechanical systems and a special system design. Compared to gravity-type separated heat pipes, pump-driven separated heat pipes have two more components, the circulating pump and storage tank. The driving force of the pump-driven separated heat pipe system circuit is mainly a circulating pump, which is mainly applied in the fields of safe operation and data center cooling. Research on pump-driven separated heat pipes mainly includes the use of multiple evaporators, the impact of mechanical pumps on startup, variable load, and heat-transfer characteristics, and the evaporation and condensation section or system model [4,5,6].
Miyazaki [7] conducted research on two different lengths of pump-driven loop heat pipes, 0.2 m and 1 m, and the startup and operational characteristics of a 0.2 m long heat pipe system were compared and studied with or without a mechanical pump. Park et al. [8,9] studied and analyzed the operational characteristics of pump-driven loop heat pipe systems under different connection modes, namely the series mode and parallel mode. In the series mode, the circuit device of the system is simple, but the two evaporators cannot reach the optimal operating state simultaneously. In the parallel mode, the system can transmit a higher heat-flux density, but it is difficult to achieve a balanced flow distribution between the two evaporators. Zhang [10] studied the flow condensation heat-transfer process in a pump-assisted loop heat pipe using R134a as the working fluid. In order to deeply analyze the flow condensation characteristics, the VOF model and Lee model were selected. The analysis was combined with experimental research and a numerical simulation. The experimental results are consistent with the numerical simulation results, indicating that the pressure drop and heat-transfer coefficient increase with the increase in mass flow rate and steam mass. A bypass system has been designed in the system by Ambrose [11] to transport the non-vaporized liquid in the evaporator to the pump inlet or condenser, effectively solving the problem of excessive liquid supply. The maximum heat flux that the system can transmit is 100 W/cm2. Using R600 as the working fluid in the heat pipe, Vasta [12] analyzed the effects of the temperature of the evaporator and condenser, the flow rate of the working fluid, and the filling rate on system performance, and correlations were derived to predict experimental results. The system transfers heat up to 3 kW at an optimal filling rate of 46%.
Typically, the evaporator simulation model uses Gungor and Müller-Steinhagen correlations in the construction of the simulation model, while the condenser simulation model uses modified Shah and Souza correlations. The results show that the correlation equation used in the evaporator simulation model is in good agreement with the experimental data, with a heat-transfer error within ±3% and a pressure-drop error within ±5%. In the condenser simulation model, the results obtained from the modified Shah and Souza correlations are also consistent with the experimental data, with heat-transfer and pressure-drop errors within ±15%. The Müller-Steinhagen–Heck model and the Chen model for predicting the pressure-drop characteristics and heat-transfer characteristics during the flow condensation process in dynamic heat pipes were compared throughout the experiments. The results indicate that the pressure drop increases with the increase in the refrigerant mass flow rate and gas fraction in the tube, and the heat-transfer coefficient increases with the increase in the working fluid mass flow rate and gas fraction in the tube. The growth slope in the low gas fraction region is significantly greater than that in the high gas fraction region.
This study first conducted a thermal analysis of the cycle of the pump-driven separated microchannel heat pipe system, and then designed and selected the components and working fluids of the heat pipe system to complete the design of the pump-driven separated microchannel heat pipe system. On this basis, an experimental platform was built to conduct experiments on the experimental design scheme of the pump-driven microchannel-separated heat pipe system.

2. Design of Pump-Driven Microchannel-Separated Heat Pipe System

2.1. Working Fluid Selection

After comprehensive consideration, R134a was selected as the working fluid for this experiment; R134a is widely used as a medium to low temperature refrigerant. The saturation pressure within the temperature range of 30–55 °C was 0.77–1.49 Mpa, which did not require a high-pressure bearing capacity of the system. The high latent heat of vaporization and low viscosity ensured its good flow ability in flat pipes with high flow resistance. R134a has stable physical and chemical properties, is non-toxic, and is not prone to deflagration. After leakage, it evaporates at the leakage point and produces low local temperatures without causing other hazards. It does not react with materials in the working fluid flow environment and has excellent cost-effectiveness and environmental friendliness. It is an excellent choice for separated heat pipe experiments.
In order to study the operation and heat-transfer characteristics of the pump-driven separated heat pipe cycle in detail, a T-S diagram of the pump-driven separated heat pipe cycle is drawn, as shown in Figure 1a,c. The process flow diagram of the working fluid cycle is shown in Figure 1. Firstly, process 1–2 is a heat absorption process using the working fluid in the evaporator. This is followed by process 2–3, where the flow of the working fluid in the rising tube is considered an adiabatic process. Then, process 3–4 involves heat release from the liquefaction of the gaseous working fluid in the condenser. Next is process 4-(5–7); here, the working fluid adiabatically flows in the storage tank. Finally, in process 7–1 an ideal state is reached, where the working fluid in the pump is in an isentropic state. However, in reality, due to the loss of heat and friction between the fluid and the pump components, entropy increases. During stable operation, the working fluid flows into the evaporator in a supercooled liquid state.

2.2. Thermodynamic Calculation

Due to the fact that this heat exchange system is mainly used for heat dissipation in data centers, and the heating power of individual workstations in general data centers is around 4 kW, a designed heat-exchange capacity of 4 kW is determined for this work, and the rated operating conditions at an ambient temperature of 25 °C are shown in Table 1. Qualitative temperature refers to the temperature at which the medium inside the heat pipe system is used to calculate its physical properties. Due to the low viscosity of water, the arithmetic mean temperature of the inlet and outlet temperatures is taken as the qualitative temperature in this study.
The formula for calculating the heat transfer of the heat exchanger on the air side is as follows:
Q = [ ρ V c p | t i n t o u t | ] e = [ ρ V c p | t i n t o u t | ] c
where Q is the designed heat-exchange capacity, kW; ρ is the density of the air on the heat exchanger side at a qualitative temperature, kg/m3; Cp is the constant pressure-specific heat capacity of the air on the heat exchanger side at a qualitative temperature, kJ/(kg k); the subscripts e and c represent the evaporator and condenser side parameters, respectively. According to Equation (1), the required air volumes for the evaporator and condenser sides are calculated as follows:
V e = Q [ ρ c p | t i n t o u t | ] e = 4 1.09 × 1.017 × 5 =   0.72   m 3 / s = 2598   m 3 / h
V c = Q [ ρ c p | t i n t o u t | ] c = 4 1.18 × 1.013 × 4 = 0.83   m 3 / s = 3013   m 3 / h
Considering the heat exchange margin and air leakage volume margin, the side air flow rate of the evaporator is taken as 3600 m3/h, and the side air flow rate of the condenser is taken as 5000 m3/h.

2.3. Condenser Design

In this experiment, microchannel parallel flow heat exchangers with a superior heat-transfer performance, large specific surface area, small wind resistance, and low refrigerant charge were used. Microchannels generally refer to channels with an equivalent diameter of less than 3 mm. The smaller the equivalent diameter of the channel in the heat exchanger, the greater the heat transfer per unit of heat-transfer area. Microchannel parallel flow heat exchangers are currently mainly used in small refrigeration equipment such as car-mounted air conditioners. In recent years, scholars have achieved ideal results by using microchannel parallel flow heat exchangers as loop heat pipes for evaporators and condensers, and as heat-dissipation devices in enclosed spaces.
The microchannel parallel flow heat exchanger used in this experiment is made of aluminum flat tubes, louvered fins, and collector tubes brazed together. The finned flat tube of the heat exchanger is shown in Figure 1b, and the process structural parameters of the finned flat tube are shown in Table 2. The interior of the flat tube is separated by thin sheets, and the channel size is 1.2 mm × 1.2 mm, with copper connecting pipes welded at the inlet and outlet manifold. There are louver fins welded between adjacent flat tubes to enhance the air-side heat-transfer effect, which have a high heat-transfer coefficient and low air-side resistance. According to the structural parameters and air volume, the air-side heat-transfer coefficient and fin efficiency are calculated. The heat-transfer area between the outer surface of the flat tube in the heat exchanger and the air is calculated as follows:
A a 1 = N L [ 2 ( B t 0 H t 0 ) ( 1 δ f P f ) + π H t 0 ]
where L is the length of the flat tube, m, and N is the number of flat tubes. The calculation of the heat-transfer area between the fins and the air in a heat exchanger is as follows:
A a 2 = 2 N L B f P f ( H f 2 δ f )
The calculation of the fin efficiency is as follows:
η f = t h [ 2 h a ( L + δ w ) λ t δ w L H t i 2 ] 2 h a ( L + δ w ) λ t δ w L H t i 2 = 0.81
The total efficiency of the fins is calculated as follows:
η = A a 1 + A a 2 η f A a 1 + A a 2 = 0.84
The calculation of the windward area of the heat exchanger is as follows:
A f = N ( H f + H t 0 ) L
The area covered by the flat tube on the windward side is calculated as follows:
A f 1 = N H t 0 L
The area covered by the flat tube on the leeward side is calculated as follows:
A f 2 = N L P f [ H f δ f + ( P f δ f ) δ f ]
The actual windward area is calculated as follows:
A fa = A f A f 1 A f 2
The wind speed at the condenser is calculated as follows:
v c = ρ c V c A f a = 1.2 × 5000 3600 × 0.213 = 7.82   m / s
The Reynolds number on the air side is calculated as follows:
Re a = v e P l μ a = 7.82 × 1 × 10 3 1.85 × 10 5 = 422
where Pl is the spacing between louvers, m; μa is the aerodynamic viscosity at a qualitative temperature, Pa s. Based on Kim and Bullard’s research [13], the following correlation formula for calculating the air-side heat-transfer coefficient is used to calculate the air-side heat-transfer coefficient:
j = R e a 0.487 ( θ 90 ) 0.257 ( P f P l ) 0.14 ( H f P l ) 0.29 ( B f P l ) 0.23 ( L l P l ) 0.68 ( P t P l ) 0.28 ( δ f P l ) 0.05 = 0.0467
h a = j Re a Pr a 1 / 3 λ a P l = 87.3   W / m 2 K
The equivalent diameter of the microchannels in the flat tubes is calculated as follows:
D h = 4 A L = 4 × 1.2 × 1.2 2 ( 1.2 + 1.2 ) = 1.2   m m
Using Bivens’ research [14], the derived correlation formula of the condenser for the heat-transfer coefficient is calculated as follows:
h r = 0.023 Re l 0.8 Pr l 0.4 λ l D h × [ ( 1 x ) 0.8 + 3.8 x 0.76 ( 1 x ) 0.04 Pr 0.38 ] × [ 0.78738 + 6187.89 ( 4 G / n π D h 2 ) 2 ] = 3453.2   W / m 2 K
The total heat-transfer coefficient of the heat exchanger is calculated as follows:
K = 1 1 h r + δ w λ w + 1 η h a = 1 1 3453.2 + 0.4 × 10 3 237 + 1 0.84 × 87.3 = 71.58   W / m 2 K
The logarithmic average temperature difference of the condenser is calculated as follows:
θ m = Δ t 1 Δ t 2 ln ( Δ t 1 Δ t 2 ) = 17.5 13.5 ln ( 17.5 13.5 ) = 15.75   ° C
The total heat-transfer area is calculated as follows:
A O = Q K θ m = 4000 71.58 × 15.75 = 3.54   m 2
The condenser and evaporator designs are used in order to guide the design of corresponding sizes and conduct experimental research. The calculated heat-transfer values are all larger than the experimental values, with a relative error between 8.2% and 9.9%. This is because the heat exchanger model assumes that the refrigerant flows evenly into all flat tubes, ignoring the non-uniform flow rate of the refrigerant from the collection pipe to the flat tube. In actual experiments, the flow rate distributed to the flat tube farther from the inlet of the heat exchanger is smaller, and the heat transfer is correspondingly reduced. Therefore, the total heat transfer is lower than the calculated value. This non-uniform flow can be fixed by improving the protruding depth of the flat pipe in the header and using flat pipes with different inlet apertures.
The total heat-transfer coefficient of the heat exchanger during the overheating stage is lower than that of the two-phase zone, so the total heat-transfer area Ao needs to be increased in practical applications. The length L of the flat tube is 488 mm, the number of flat tubes N is 48, and the outer size is 500 mm × 488 mm × 38 mm. The three process microchannel heat exchanger (which refers to a spoiler fin flat tube heat exchanger with an equivalent diameter of less than 3 mm that can be adjusted in the X, Y, and Z directions) serves as the condenser for this experiment, with a total heat-transfer area of 4.21 m2.

2.4. Evaporator Design

In this experiment, the evaporator is also a microchannel parallel flow heat exchanger, with the same parameters as the condenser for the flat tubes, fins, and collector tubes. However, the heat-transfer correlation proposed by Kandlikar [15] was chosen for the calculation of the refrigerant side heat-transfer coefficient in the heat exchanger design. The usual nucleation boiling heat-transfer mechanism, including liquid film evaporation and the transient heat transfer of liquid near the contact line, plays an important role. The liquid film under the large steam slug completely evaporates downstream, so it periodically appears dry as each large steam slug passes through. The proposed heat-transfer correlation equation is shown in Equations (11)–(19). The other calculation processes and steps are similar to those of the condenser. The total heat-transfer area required for the evaporator is calculated to be 2.53 m2, and the outer size is selected to be 500 mm × 373 mm × 38 mm. The three process microchannel heat exchanger serves as the evaporator for the experiment, with a total heat-transfer area of 3.13 m2.

2.5. Selection of Centrifugal Pumps

The pump is mainly used for transporting the working fluid and providing the driving force for circulation. In theory, there is no minimum startup threshold limit for the pump-driven heat pipe system. The pumping action produces a high shear rate of the fluid. As the viscosity increases, it is necessary to consider the additional resistance that the fluid exerts on the shear rate. However, common refrigerants on the market, such as R22, R404A, R407C, R410A, and R134A, are low viscosity fluids with low resistance [16,17,18,19,20]. Therefore, a centrifugal pump that can continuously provide a large flow rate and a constant flow rate with good efficiency should be selected, and a vertical multi-stage pump has the characteristics of high efficiency, low noise, beautiful appearance, small volume, light weight, convenient maintenance, and reliable sealing performance. The multi-stage pump produces no secondary pollution to the conveyed liquid, and it can withstand mild corrosion. The performance curve is shown in Figure 1d.

2.6. Design of Reservoir

The liquid reservoir can reduce the fluctuation of circulating conditions in a pump-driven separated heat pipe system, and its function is as follows: (1) to store and provide working fluid, and to supplement and regulate the liquid volume in steady-state circulation, and (2) to adjust and stabilize the circulating pressure to avoid pump cavitation due to low pressure, and to prevent system damage or even explosions due to high pressure. The volume of the liquid storage tank is generally selected in the range from 1/3 to 1/2 of the total system volume. In this article, the sum of the volumes of the evaporator and condenser is about 6 L, so the BLR/RLR-3P liquid storage tank (Nanjing Baize Machinery Co., Ltd., Nanjing, China) with a volume of 2.8 L is selected. In order to reduce the problem of cavitation in the shielded pump, the liquid level in the storage tank must maintain a certain height difference from the centerline of the centrifugal pump.

2.7. Circulation Pipeline Design

Within the allowable range, the pipeline with the largest diameter as possible should be selected to reduce the flow resistance of the working fluid, reduce the power consumption of the centrifugal pump, and reduce the evaporation temperature of the working fluid. The ascending and descending pipes are all made of 304 stainless steel corrugated pipes wrapped with insulation cotton. The corrugated pipes are resistant to pressure and corrosion, and the working fluid inside them can be considered to adiabatically flow when wrapped with insulation cotton. The diameters and lengths of one section of the rising pipe and three sections of the falling pipe in the experiment are shown in Table 3.

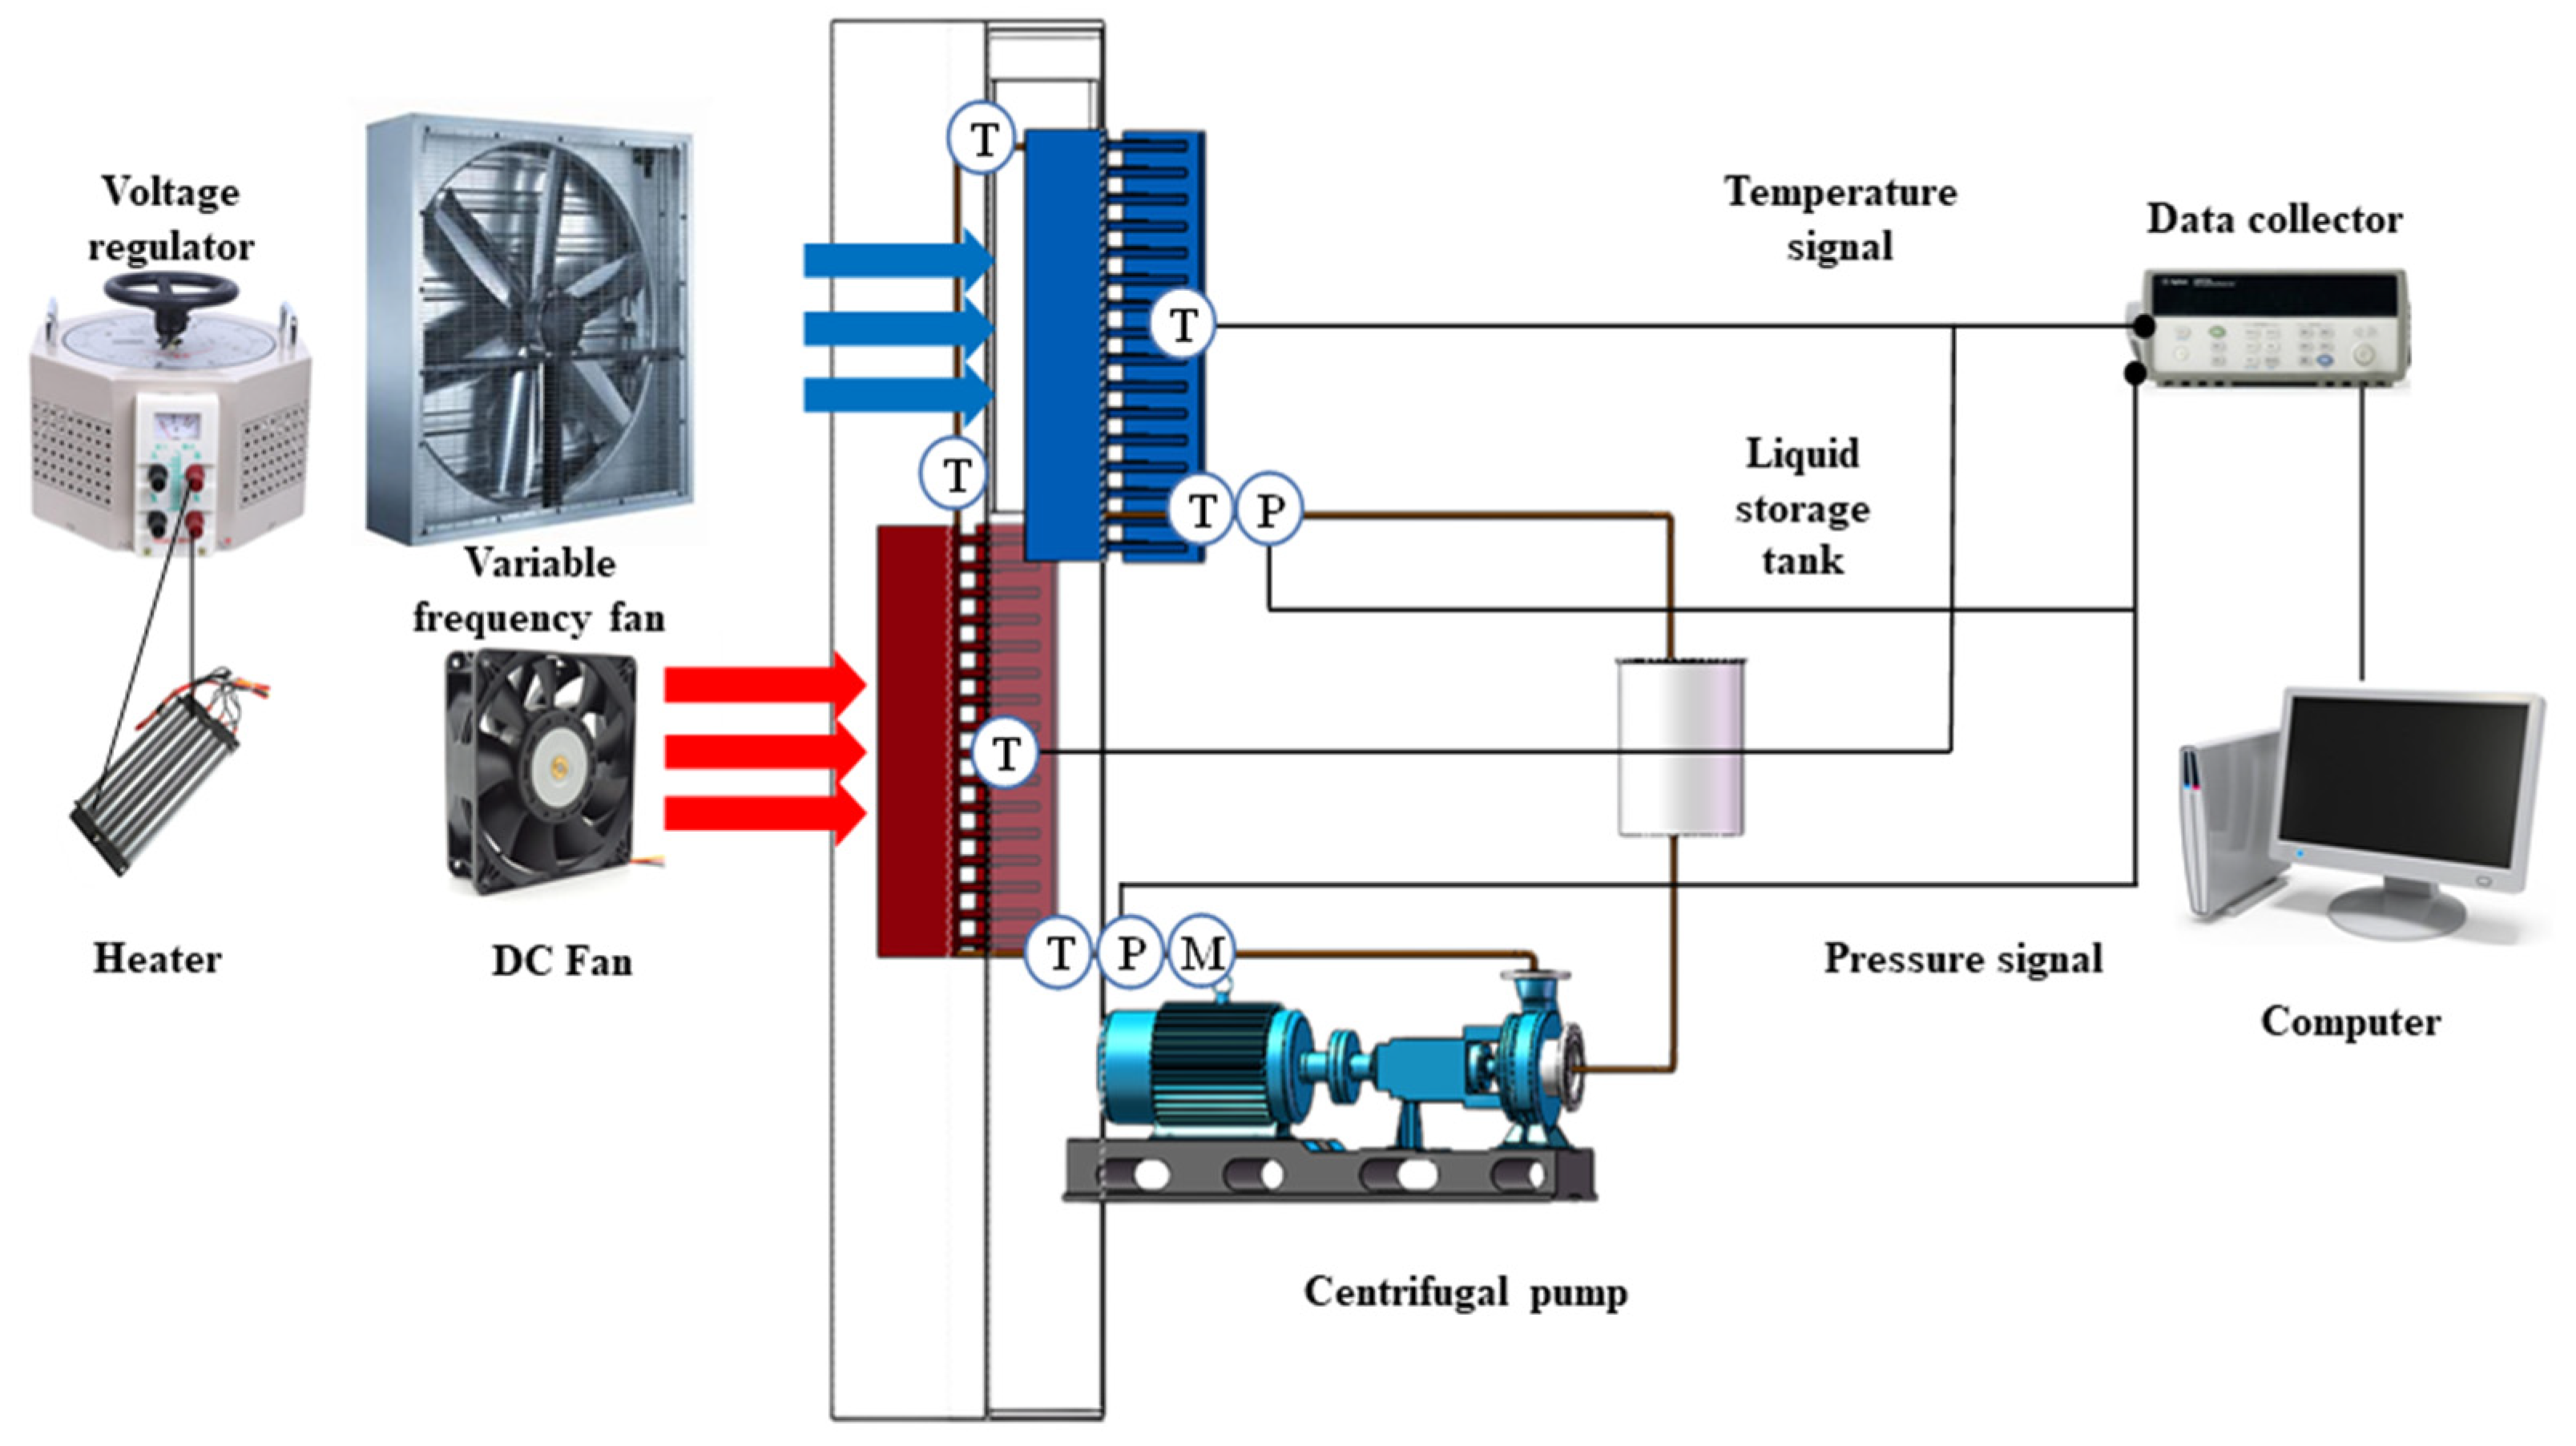
2.8. Establishment of Experimental System

The pump-driven microchannel-separated heat pipe designed in the above section is used as the main body to build an experimental platform to study the heat-transfer characteristics of the pump-driven microchannel-separated heat pipe. The schematic diagram of the heat pipe system experimental platform is shown in Figure 2, and the pump-driven separated heat pipe loop is composed of a working fluid pump, evaporator, condenser, liquid storage tank, and connecting pipeline. After the vacuum extraction of the confined space, the circulating working fluid is injected into it. The working principle of this device is that the pump transports the liquid working fluid from the storage tank to the evaporator, and when the working fluid passes through the high-temperature gas outside the evaporator tube, it absorbs heat and undergoes a phase change heat exchange. Subsequently, the working fluid is converted into a gas–liquid two-phase fluid and enters the condenser. When passing through the condenser, it releases heat and liquefies into the storage tank, completing the entire heat absorption and release cycle.
After completing the above preparations, the experiment begins. The experimental steps are as follows: (1) Close gate valve 1 and gate valve 2, open gate valve 3, start the vacuum pump, vacuum the air between the vacuum pump and the three-way valve, open gate valve 2, and vacuum the heat pipe system. When the pressure indication of the three-way valve reaches below 10 Pa, close gate valve 3, and let it stand for 0.5 h to ensure the vacuum and sealing inside the system. If the pressure gauge does not change, it indicates that the sealing is intact, and the working fluid can be injected into the system. If the pressure indication remains unchanged, the vacuum pumping is completed. (2) After vacuuming the heat pipe system, open gate valve 1 for liquid filling, and store R134a in a high-pressure refrigerant tank at room temperature. (3) Start the data acquisition instrument and collect data every 5 s. (4) Observe the temperature measurement parameters of the thermocouple at the air inlet of the evaporator side. When the air temperature at the inlet of the evaporator fluctuates within ±0.3 °C of the operating condition setting value within 10 min after the last transformer adjustment, it is considered that the heat pipe system is in a steady-state heat-transfer state. (5) Selecting a 91% liquid filling rate, 25 °C outdoor temperature, 55 °C indoor temperature, 5000 m3/h condensing air volume, and 450 mm heat exchanger height difference as the standard operating conditions, the steady-state heat-transfer characteristics of the heat pipe under variable operating conditions were studied through the control variable method. The entire pump-driven cooling system consists of a separate evaporation section and a condensation section, which are connected by connecting pipes to form an internal working fluid circulation circuit. However, the filling rate is only applicable to the evaporation section, which refers to the ratio of the volume of the filled working fluid to the volume of the evaporator.

2.9. Error Analysis

The range and accuracy of each measuring instrument are shown in the table, and the relative error is equal to the absolute error divided by the true value. Therefore, the maximum relative error occurs when the true value is at its minimum. Moreover, the flow meter is installed at the inlet of the evaporator to avoid the impact of the phase change of the working fluid, which is due to the accumulation of a large amount of condensed and refluxed liquid working fluid in the inlet section of the evaporator with high saturation.
(1) Air temperature: The accuracy of the temperature measured by the T-type thermocouple is ±0.20 °C, and the lowest temperature measured in the experiment is about 20 °C. The relative error of the air temperature measurement is as follows:
δ ( T a i r ) = Δ T T a i r = 1 %
(2) Working medium temperature: The accuracy of the PT100 temperature sensor (Shanghai Modular Automation Technology Co., Ltd., Shanghai, China) in measuring temperature is ±0.10 °C, and the lowest temperature measured in the experiment is about 20 °C. The relative error of the working medium temperature measurement is as follows:
δ ( T R 134 a ) = Δ T T R 134 a = 0.5 %
(3) Working fluid pressure: The MIK-P300 pressure sensor (Shanghai Modular Automation Technology Co., Ltd., Shanghai, China) has a temperature compensation in the range of −10 to 70 °C, with an accuracy level of 0.25 and a range of 0 to 2.5 Mpa, resulting in a full-scale error of 6.25 kPa. In experiments, the pressure is usually above 1 Mpa, and the relative error of the working fluid pressure measurement is as follows:
δ ( P R 134 a ) = Δ P P R 134 a = 0.625 %
(4) Working fluid flow rate: The accuracy level of the DN10 turbine flow meter is 0.2, and the extended flow range is 0.15 to 1.5 m3/h, resulting in a full-scale error of 2.7 × 10⁻³ m3/h. The flow rate of the working fluid in the experiment is usually above 0.5 m3/h, and the relative error of the measurement of the working fluid flow rate is as follows:
δ ( q m ) = Δ q m q m = 0.54 %
(5) Heat exchange: ignoring the uncertainty of the specific heat capacity at a constant pressure on the refrigerant side, according to the principle of error propagation, the relative error of heat exchange is as follows:
δ ( Q ) = δ ( q m ) 2 + δ ( T R 134 a ) 2 = 0.73 %
Based on the above analysis results, it can be seen that the measurement errors of temperature, pressure, flow rate, and heat transfer in this experiment are relatively small, and within the allowable range of engineering. Therefore, the experimental results are reliable.

3. Results and Discussion

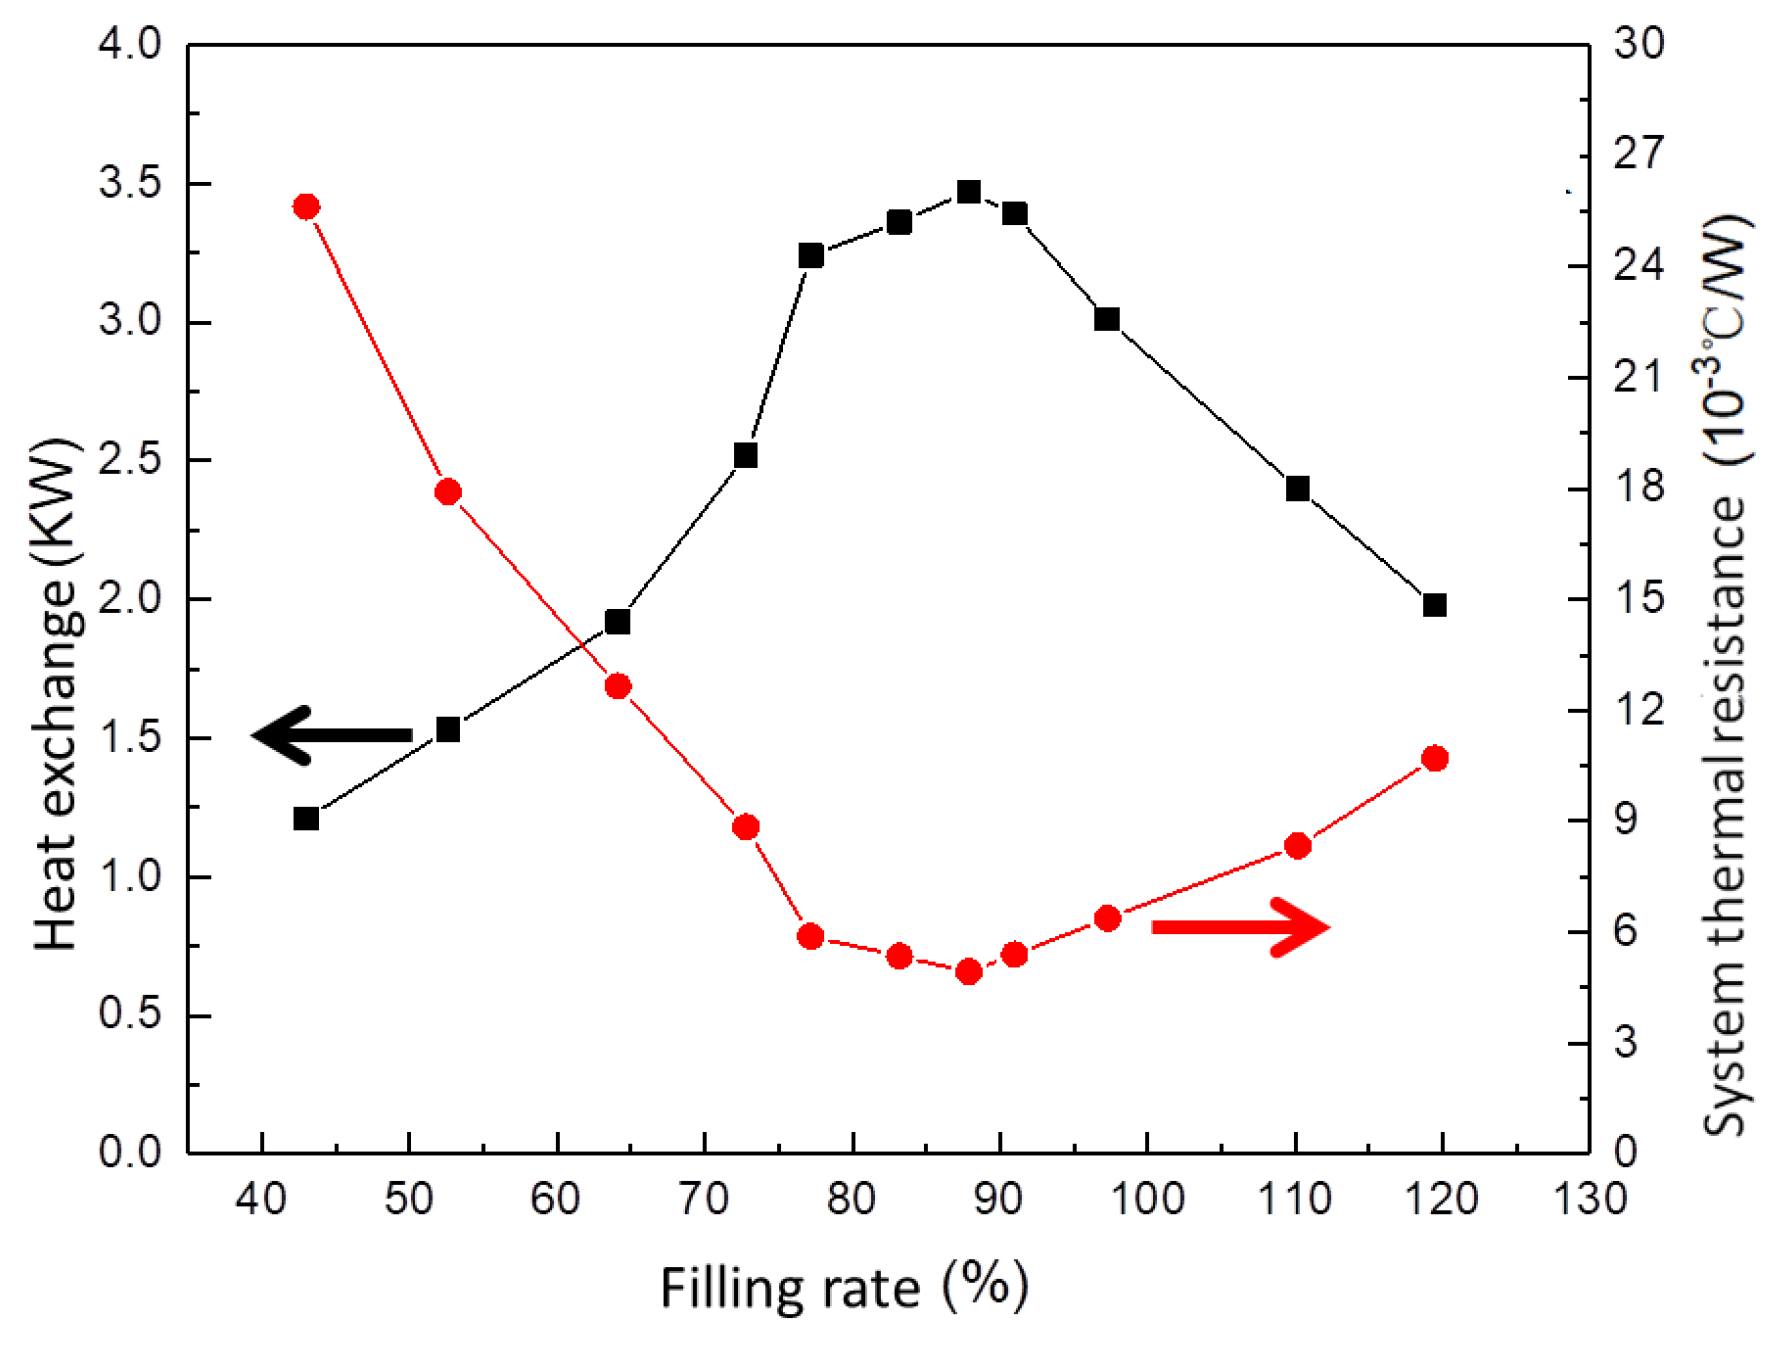
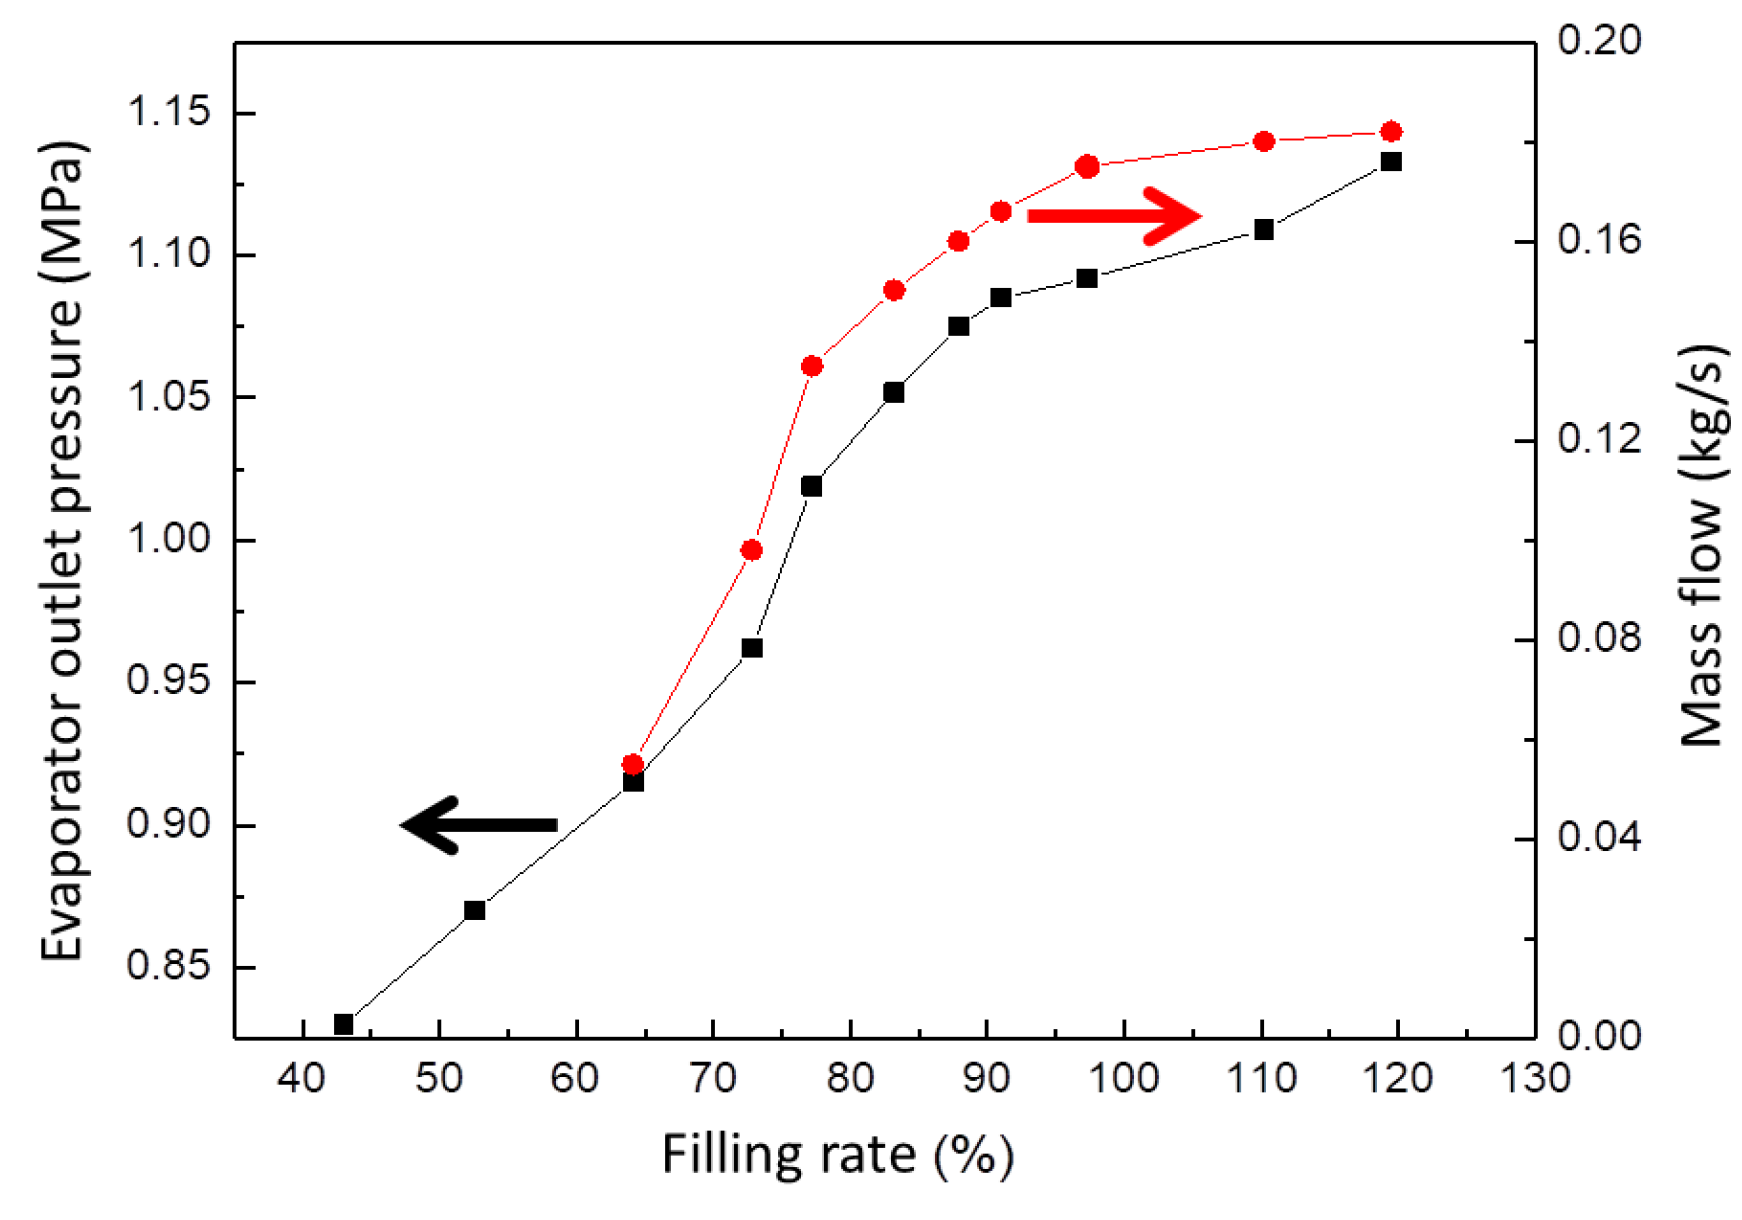
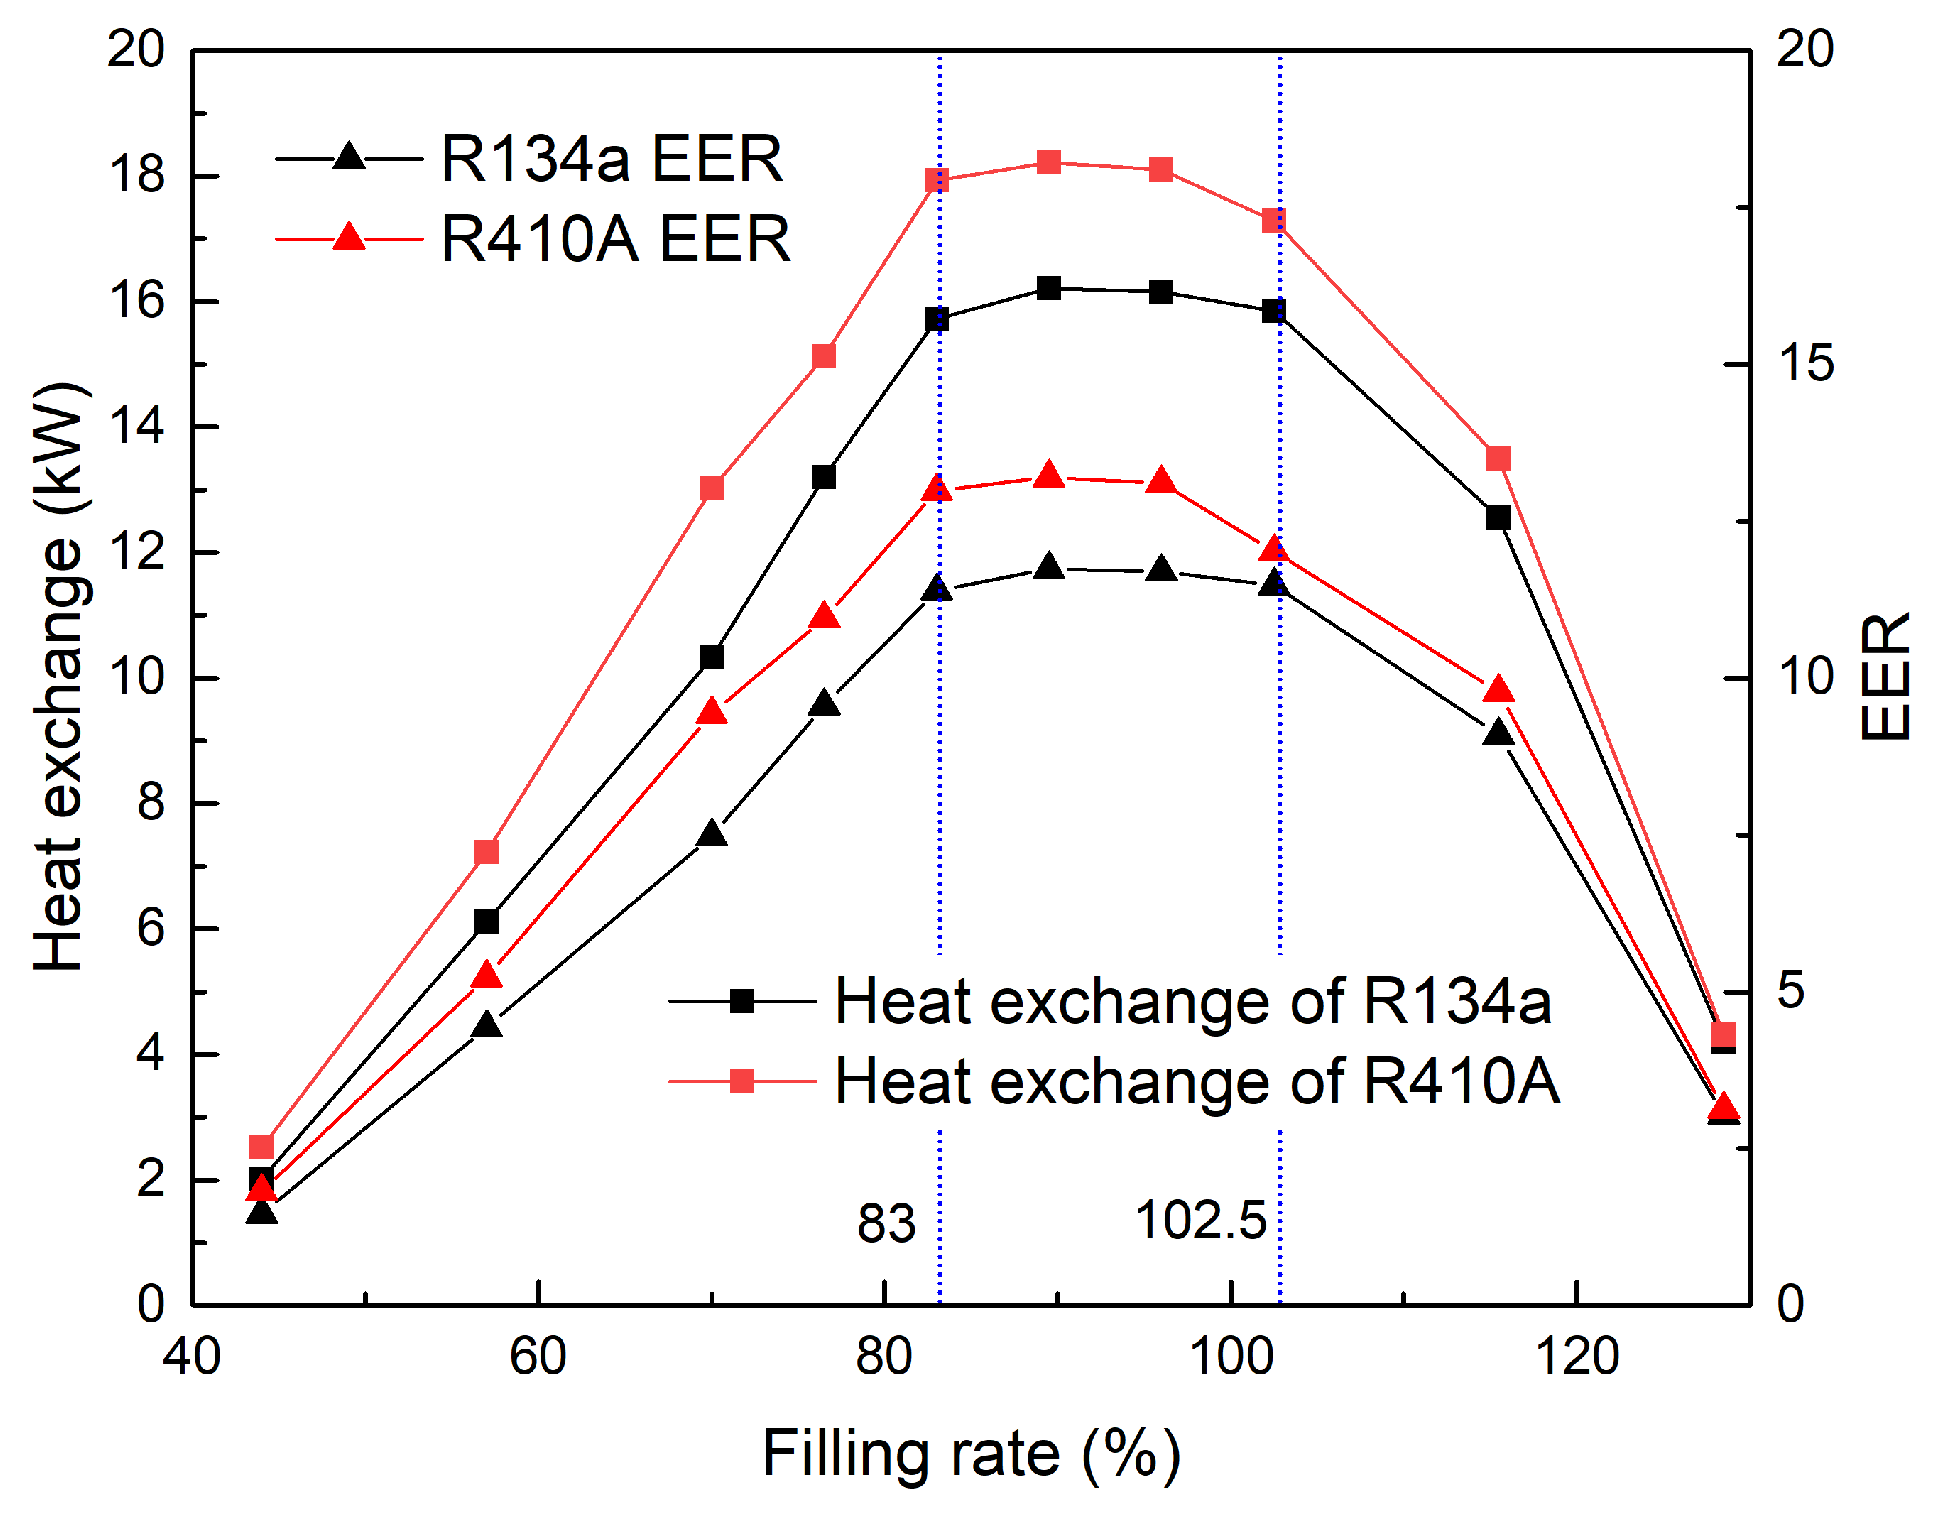
3.1. Effect of Different Liquid Filling Rates

The superheat at the outlet of the evaporator’s working fluid is used to evaluate the heat-transfer performance of the evaporation section, and its calculation formula is as follows:
T s h = T e , o u t T ( P s ) | P s = P e , o u t
Among them, Tsh is the superheat of the working fluid at the evaporator outlet, °C; Te,out is the working fluid temperature at the evaporator outlet, °C; T(Ps)∣Ps=Pe,out is the saturation temperature corresponding to the outlet pressure of the evaporator working fluid, °C. Thermal resistance is a parameter that directly reflects the heat-transfer efficiency of a heat pipe system. The heat-transfer ability of the heat pipe is increased with the thermal resistance decrease. The thermal resistance is determined by the difference between the average temperature of the refrigerant working fluid in the evaporator and condenser, as well as the heat flow rate. Due to the high thermal conductivity of aluminum and the thin wall of the flat tube, the temperature of the tube wall can be considered the same as the temperature of the corresponding working fluid in the tube. Therefore, the average temperature of the refrigerant working fluid in the evaporator and condenser can be approximately replaced by the temperature of the tube wall. The calculation formula for system thermal resistance is as follows:
R s y s = T w , e ¯ T w , c ¯ Q
Among them, Rsys is the system thermal resistance, °C/W; T w , e ¯ and T w , c ¯ are, respectively, the average wall temperatures of the evaporator and condenser, °C. In this experiment, 11 filling rates were selected, namely 43%, 52.6%, 64.1%, 72.8%, 77.2%, 83.2%, 87.9%, 91%, 97.3%, 110.2%, and 119.3%. The filling rates were changed under standard operating conditions. The changes in the system heat transfer and thermal resistance with the liquid filling rate are shown in Figure 3. It can be seen that the heat transfer of the pump-driven separated heat pipe shows a trend of first increasing and then decreasing with the increase in the liquid filling rate. Based on the analysis of the phase changes inside the flat tube under different filling rates, it is found that under low filling rates, the refrigerant rapidly vaporizes and reaches saturation at the inlet stage of the evaporator. Subsequently, the superheated steam is further heated. Due to the small heat transfer temperature difference and specific heat capacity of the steam, the heat transfer is at a lower level. As the filling rate increases, the quality of the refrigerant undergoing phase change heat transfer in the evaporator gradually improves. The heat-transfer performance of the heat pipe system is significantly superior to other ranges within the range of 75% to 95% liquid filling rate. The heat-transfer capacity of the system is 3.47 kW when the liquid filling rate is 87.9%, which is 2.87 times higher than when the liquid filling rate is 43%, and 1.75 times higher than when the liquid filling rate is 119.3%. When the filling rate exceeds the optimal filling rate range, the liquid working fluid in the evaporator gradually increases, the supercooled section gradually increases, the phase change ratio decreases, and the heat exchange decreases until the excessively high filling rate causes the refrigerant at the outlet of the evaporator to remain in a gas–liquid two-phase state, affecting the circulation driving force and further reducing the heat exchange. The thermal resistance of the heat pipe shows a trend of first decreasing and then increasing as the filling rate increases. This is because the thermal resistance is determined by the difference in the average temperature of the refrigerant working fluid in the evaporator and condenser, and the heat flow rate, reflecting the heat-transfer efficiency of the heat pipe system. The efficiency of the phase change heat transfer in the two-phase region is much higher than that of the sensible heat transfer. In the sensible heat transfer, the efficiency of the heating subcooled liquid is higher than that of the heating superheated steam. When the filling rate gradually increases, the heat-transfer method with the highest proportion inside the evaporator is from heating superheated steam to two-phase heat transfer to heating subcooled liquid. The corresponding heat pipe thermal resistance also decreases first and then increases, and the system thermal resistance when the liquid filling rate is too low is higher than when the liquid filling rate is too high. The results indicate that the addition of mechanical pumps can effectively improve the heat-transfer capacity and system loop length of the heat pipe system [21,22].
The curve of the outlet temperature and superheat of the evaporator as a function of the filling rate is shown in Figure 4. It can be seen that the overall outlet temperature and superheat of the evaporator show a gradually decreasing trend. When the filling rate is 43%, the superheat of the working fluid at the outlet of the evaporator is 20.7 °C. At this time, the working fluid inside the evaporator mainly undergoes a sensible heat exchange, while when the filling rate is 97.3%, the superheat of the working fluid at the outlet of the evaporator is 0.3 °C, indicating that the working fluid inside the evaporator mainly undergoes a phase change heat exchange. When the liquid filling rate continues to increase, the superheat is 0, indicating that the working fluid at the evaporator outlet is in a gas–liquid state of coexistence. The curve of the outlet pressure and mass flow rate of the evaporator changing with the filling rate is shown in Figure 5. It can be seen that the outlet pressure of the evaporator increases with the increase in the filling rate and the growth trend slows down. This is because the more the refrigerant filling rate increases, the greater the working fluid pressure in the heat pipe system. Besides, the pressure increase caused by the increase in the quality of gaseous working fluids is greater than that caused by the increase in the quality of the gas–liquid mixed working fluids. Therefore, when the outlet working fluid of the evaporator changes from gaseous to a two-phase fluid, the increase in the outlet pressure of the evaporator is slowed down.

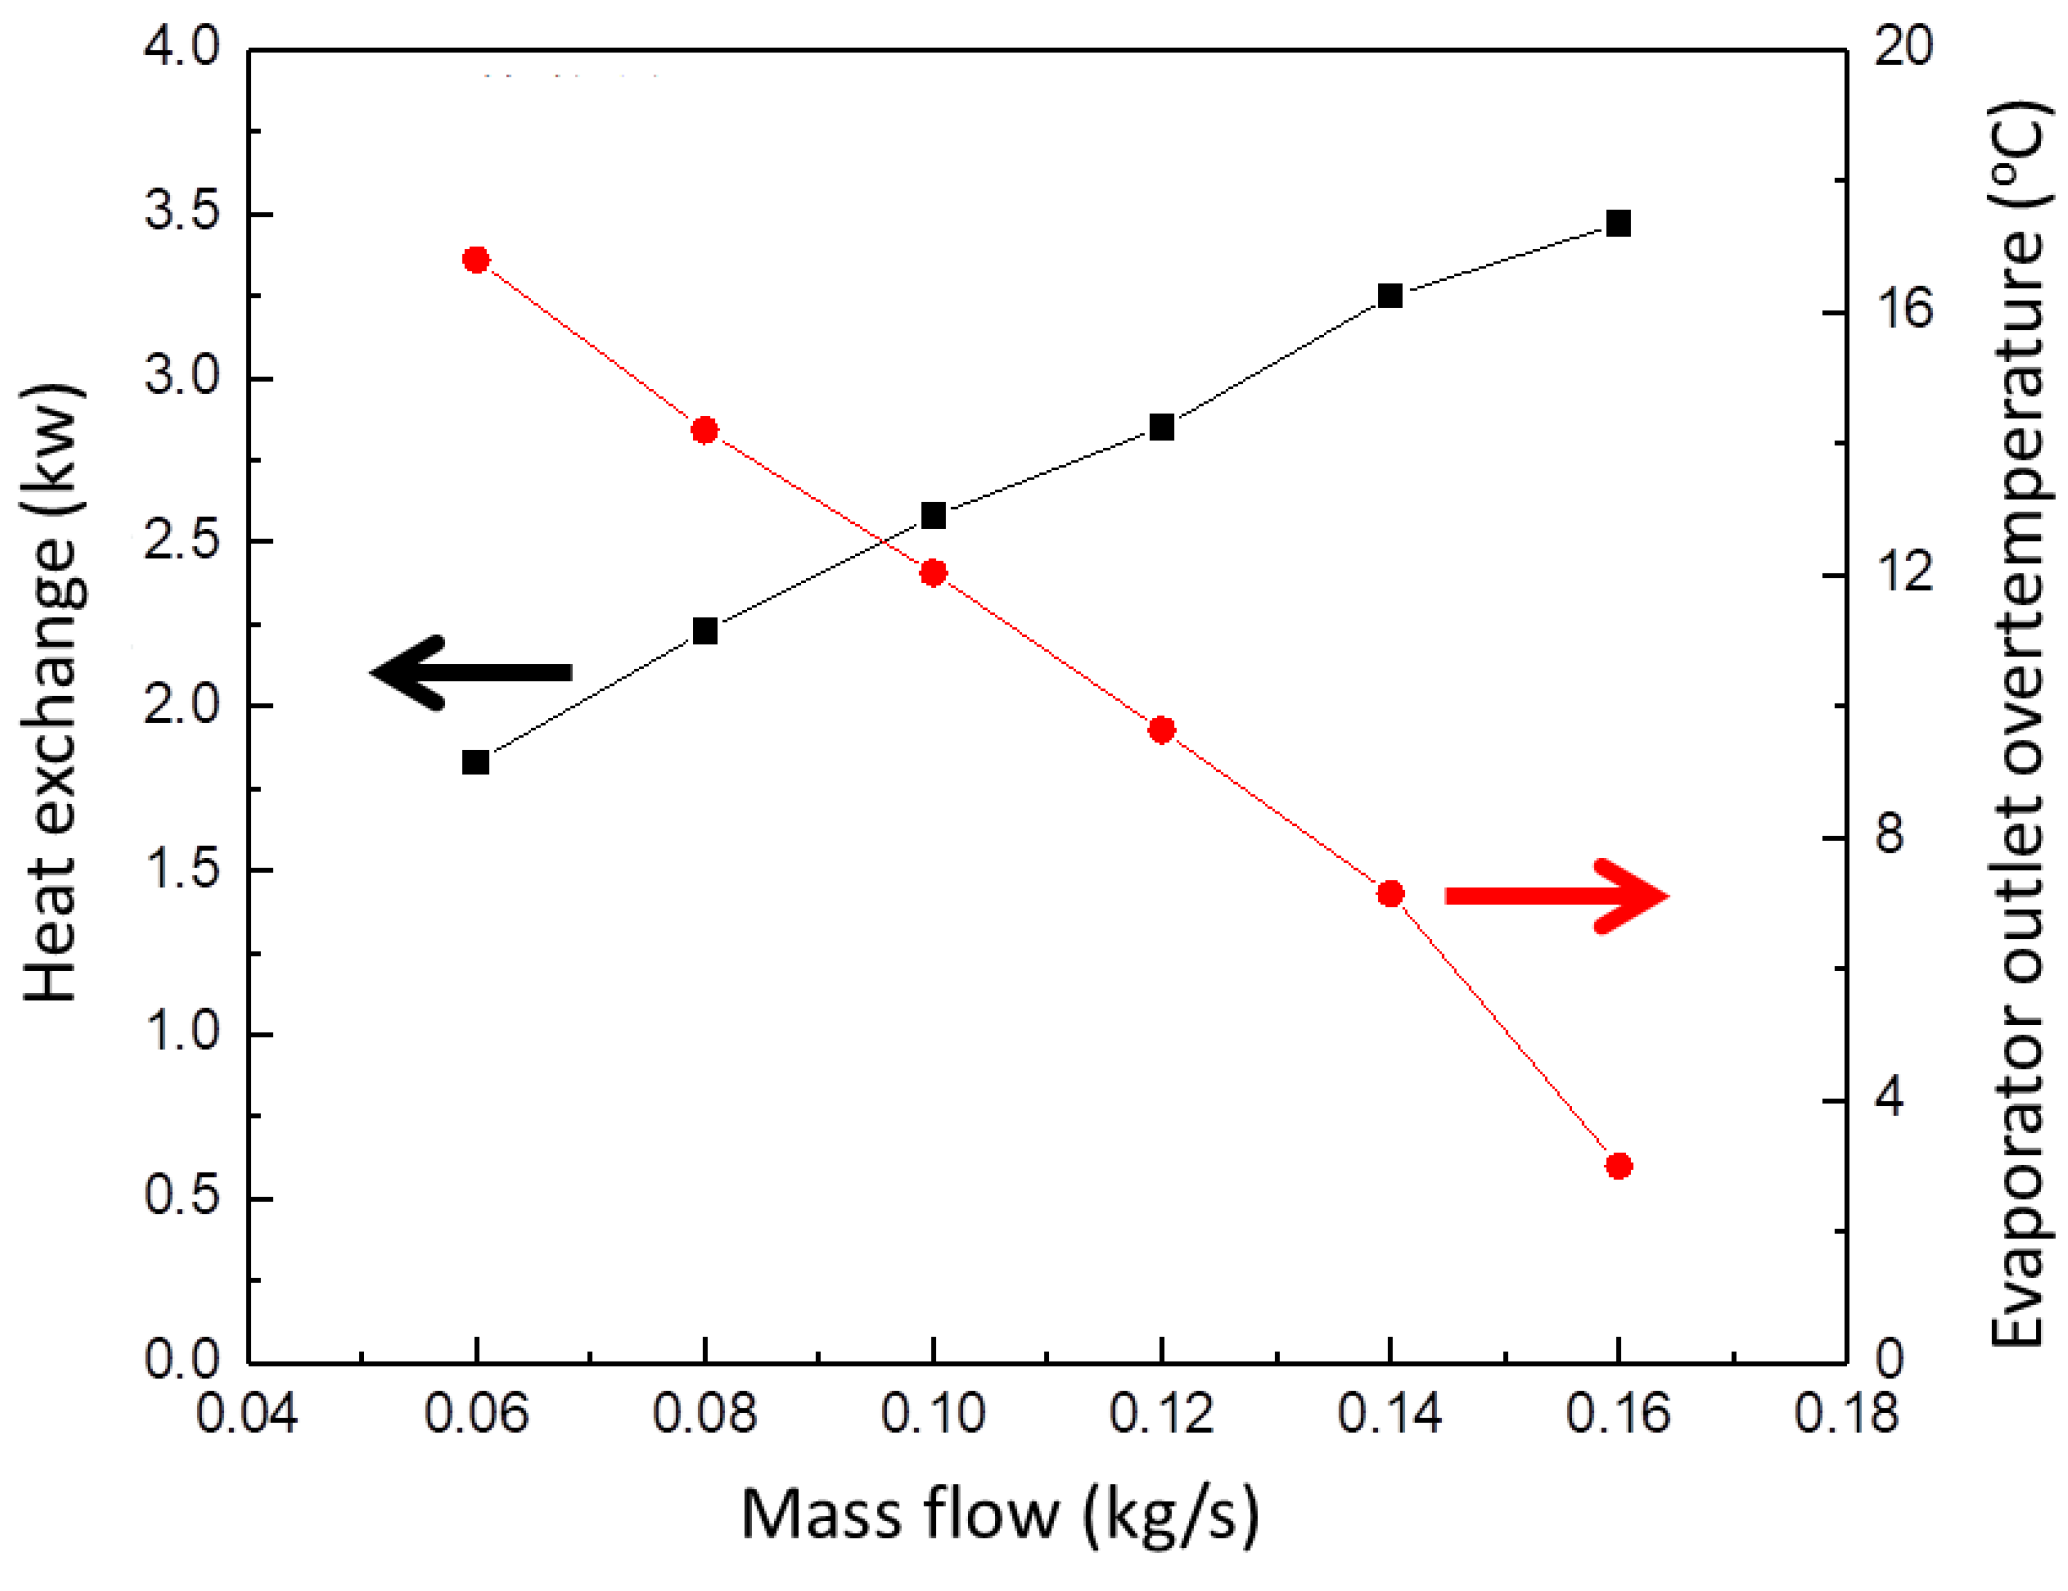
3.2. Effect of Different Mass Flow Rates

On the basis of standard operating conditions, we adjusted the opening of the vacuum fine tuning valve to control the local resistance coefficient and cross-sectional flow area at this location, so that the circulating mass flow rates of the pump-driven separated heat pipe system are 0.06 kg/s, 0.08 kg/s, 0.1 kg/s, 0.12 kg/s, 0.14 kg/s, and 0.16 kg/s, respectively. The relationship between the heat-exchange rate and the superheat degree of the working fluid at the outlet of the evaporator as a function of the mass flow rate is shown in Figure 6. It can be seen that the heat-exchange rate of the evaporator increases with the increase in the circulating mass flow rate. The relationship between the heat exchange (y) and mass flow rate (x) is expressed as y = 0.89 + 16.47x. Similarly, the relationship between the heat exchange (y) and mass flow rate (x) is expressed as y = 25.02 − 132.24x. The increase in the circulating flow rate leads to an increase in the flow resistance of each section in the heat pipe circuit, while the heat-transfer coefficient of the evaporation and condensation sections increases. For the rising and falling pipes, the increase in flow resistance leads to a decrease in the two-phase heat-transfer ratio of the evaporator and an increase in the subcooled heat-transfer ratio. For evaporators and condensers, the increase in flow resistance leads to an increase in heat transfer first and then a decrease in heat transfer. The increase in the heat-transfer coefficient in each phase leads to an increase in the heat-exchange rate, so the mass flow rate and heat-exchange rate is influenced by the comprehensive resistance of each section and the heat-transfer coefficient at the heat exchanger. The superheat is used to evaluate the heat-transfer performance of the evaporator. When the mass flow rate is low, the superheat at the outlet of the evaporator is high, and when the overheated steam heat-exchange section is longer, the average heat-transfer coefficient on the refrigerant side inside the evaporator is lower. When the mass flow rate is high, the degree of superheat is very small, indicating that the undercooling and two-phase heat-transfer sections are longer, and the average heat-transfer coefficient on the refrigerant side is higher. The superheat at the outlet of the evaporator decreases with the increase in the mass flow rate. When the mass flow rate is 0.06 kg/s, the superheat at the outlet of the evaporator is 16.8 °C. At this time, the superheated steam heat-exchange section is longer, and the average heat-transfer coefficient on the refrigerant side inside the evaporator is lower; at a mass flow rate of 0.16 kg/s, the superheat degree is 3.0 °C, indicating that the undercooling and two-phase heat-transfer sections are longer at this time, and the average heat-transfer coefficient on the refrigerant side is higher. However, an excessive heat flow no longer increases the heat-transfer performance after saturating the pressure inside the evaporator and may even cause a blockage of the working fluid circulation due to overheating.

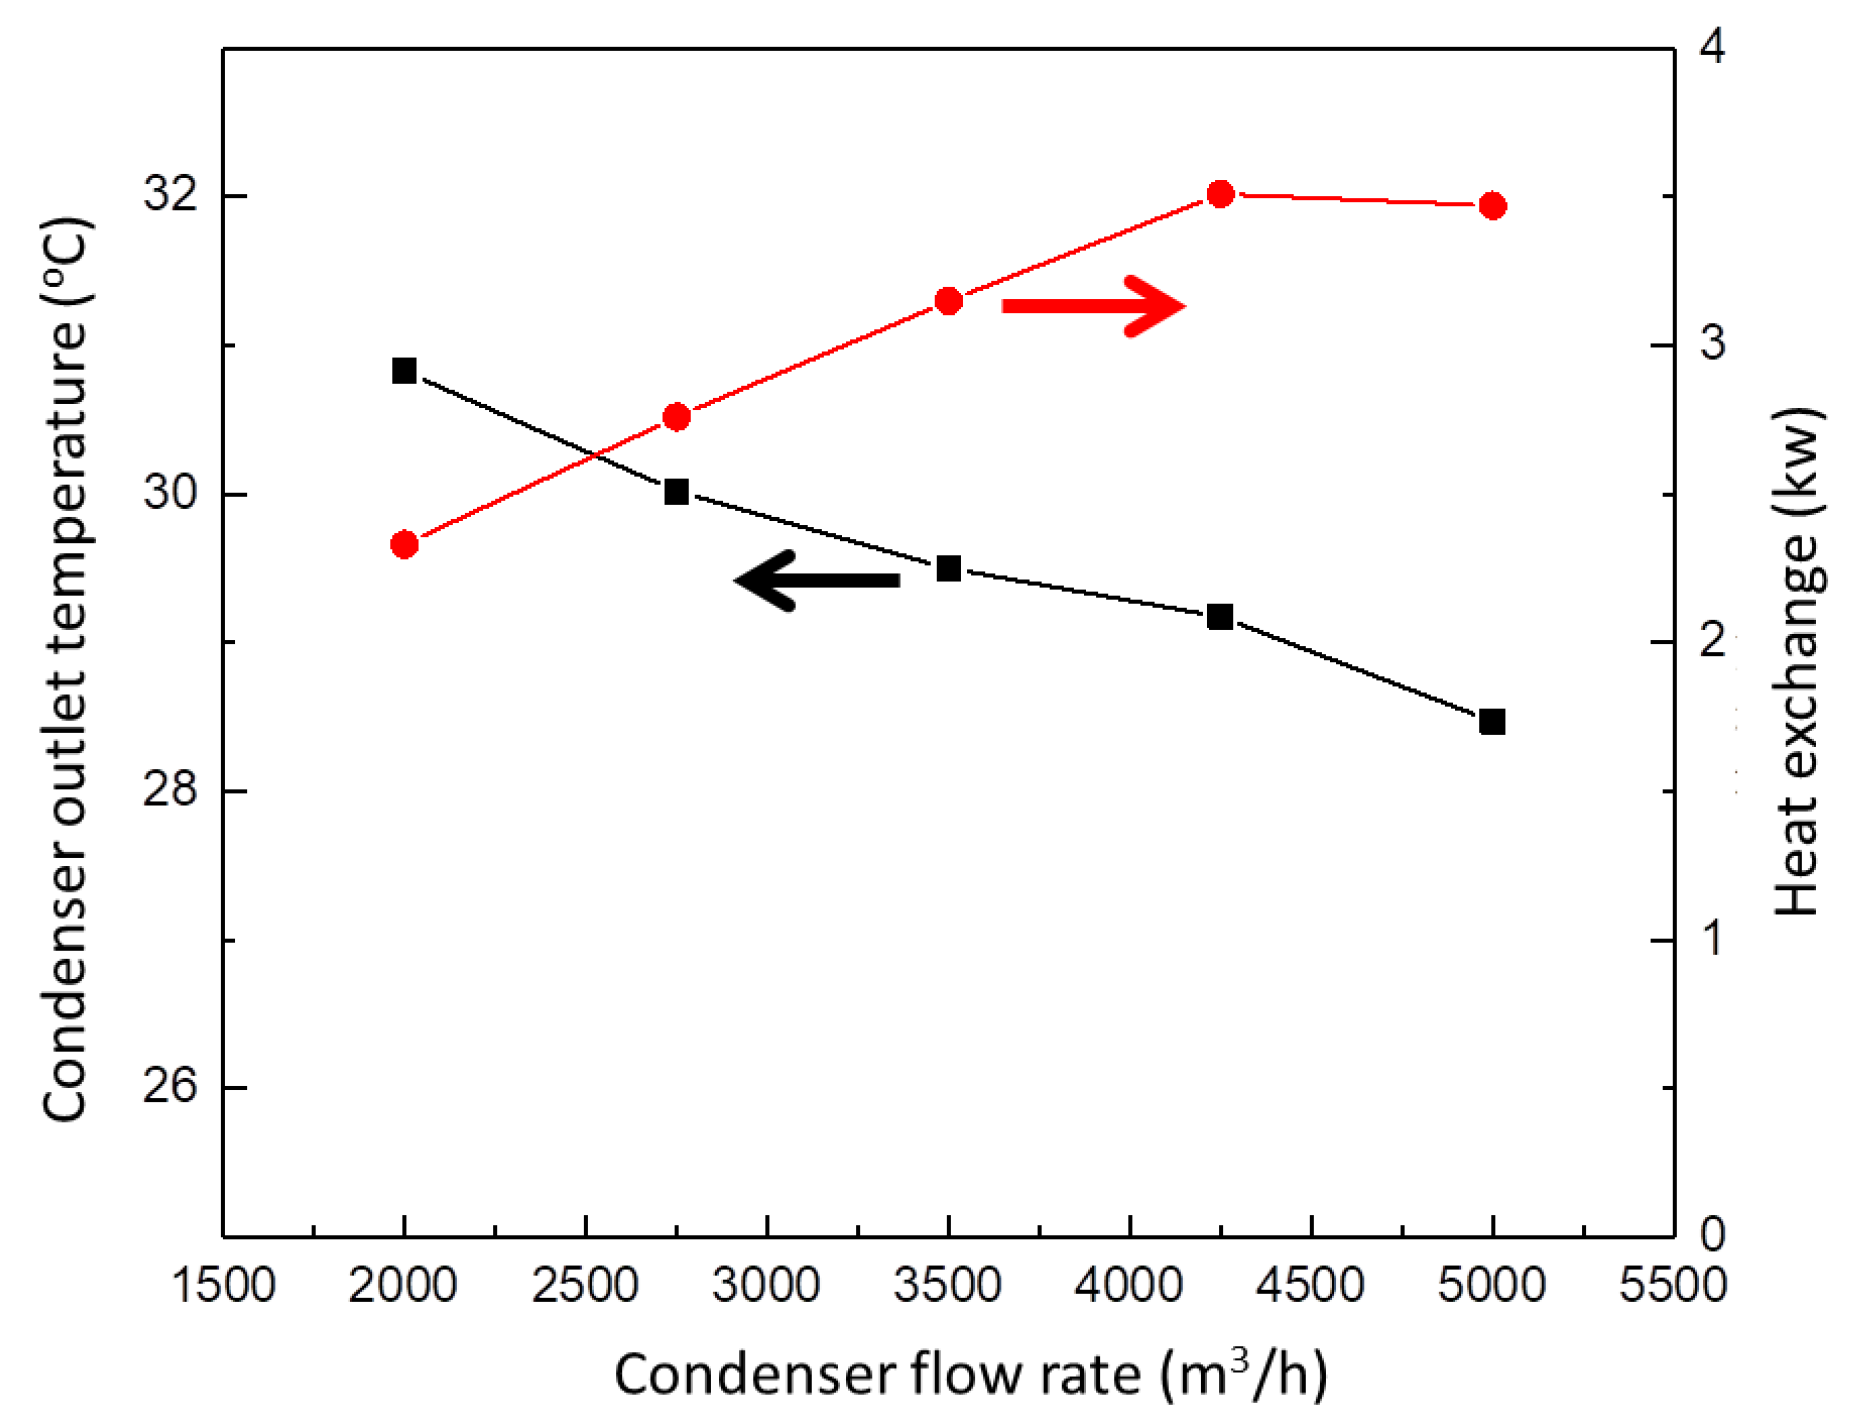
3.3. Effect of Different Condensing Air Volumes

On the basis of standard operating conditions, the air volume of the condenser side fan is controlled through a frequency converter, and the QDF-6 hot ball anemometer is used to test the actual air volume. Experiments are conducted on five operating conditions: 2000 m3/h, 2750 m3/h, 3500 m3/h, 4250 m3/h, and 5000 m3/h. The relationship between the temperature of the condenser outlet air and the heat-exchange rate with the condensing air flow rate is shown in Figure 7. It can be seen that the heat-exchange rate of the heat pipe system initially increases with the increase in the condensing air flow rate, but there is a slight decrease at 4250–5000 m3/h where the condensing air flow rate is relatively high. This is because the increase in air flow rate increases the heat-exchange rate when there is a sufficient heat exchange between the air and the heat exchanger. In the case of an excessive air flow, the contact time between the air and the condenser is short, and the heat exchange cannot be fully carried out, resulting in a decrease in heat exchange. The outlet air temperature of the condenser decreases with the increase in condensing air volume because the time for heat exchange between the unit mass air and the condenser decreases with the increase in the condensing air volume.

3.4. Effect of Different Temperature Differences

On the basis of standard operating conditions, the indoor temperature is changed to regulate the temperature difference between the air inlet of the evaporator and condenser. Experiments are conducted on five operating conditions: 55 °C, 50 °C, 45 °C, 40 °C, and 35 °C. If the inlet air temperature on the condenser side is 25 °C, the inlet air temperature difference under the five operating conditions is 30 °C, 25 °C, 20 °C, 15 °C, and 10 °C, respectively. The relationship between the heat-transfer capacity of the heat pipe system and the outlet temperature of the evaporator as a function of the inlet air temperature difference is shown in Figure 8. When the inlet air temperature difference between the evaporator and condenser is 10 °C, the heat-transfer capacity of the heat pipe system is 0.96 kW, while when the temperature difference is 30 °C, the heat-transfer capacity is 3.47 kW, increasing by 261.5%. It can be seen that improving the indoor and outdoor temperature difference has a significant effect on the heat-transfer performance of the separated heat pipe. The heat-exchange rate basically shows a linear relationship with the temperature difference of the inlet air because there is no phase change in the air, and in this case, the heat-exchange rate is directly proportional to the temperature difference of the heat exchange.

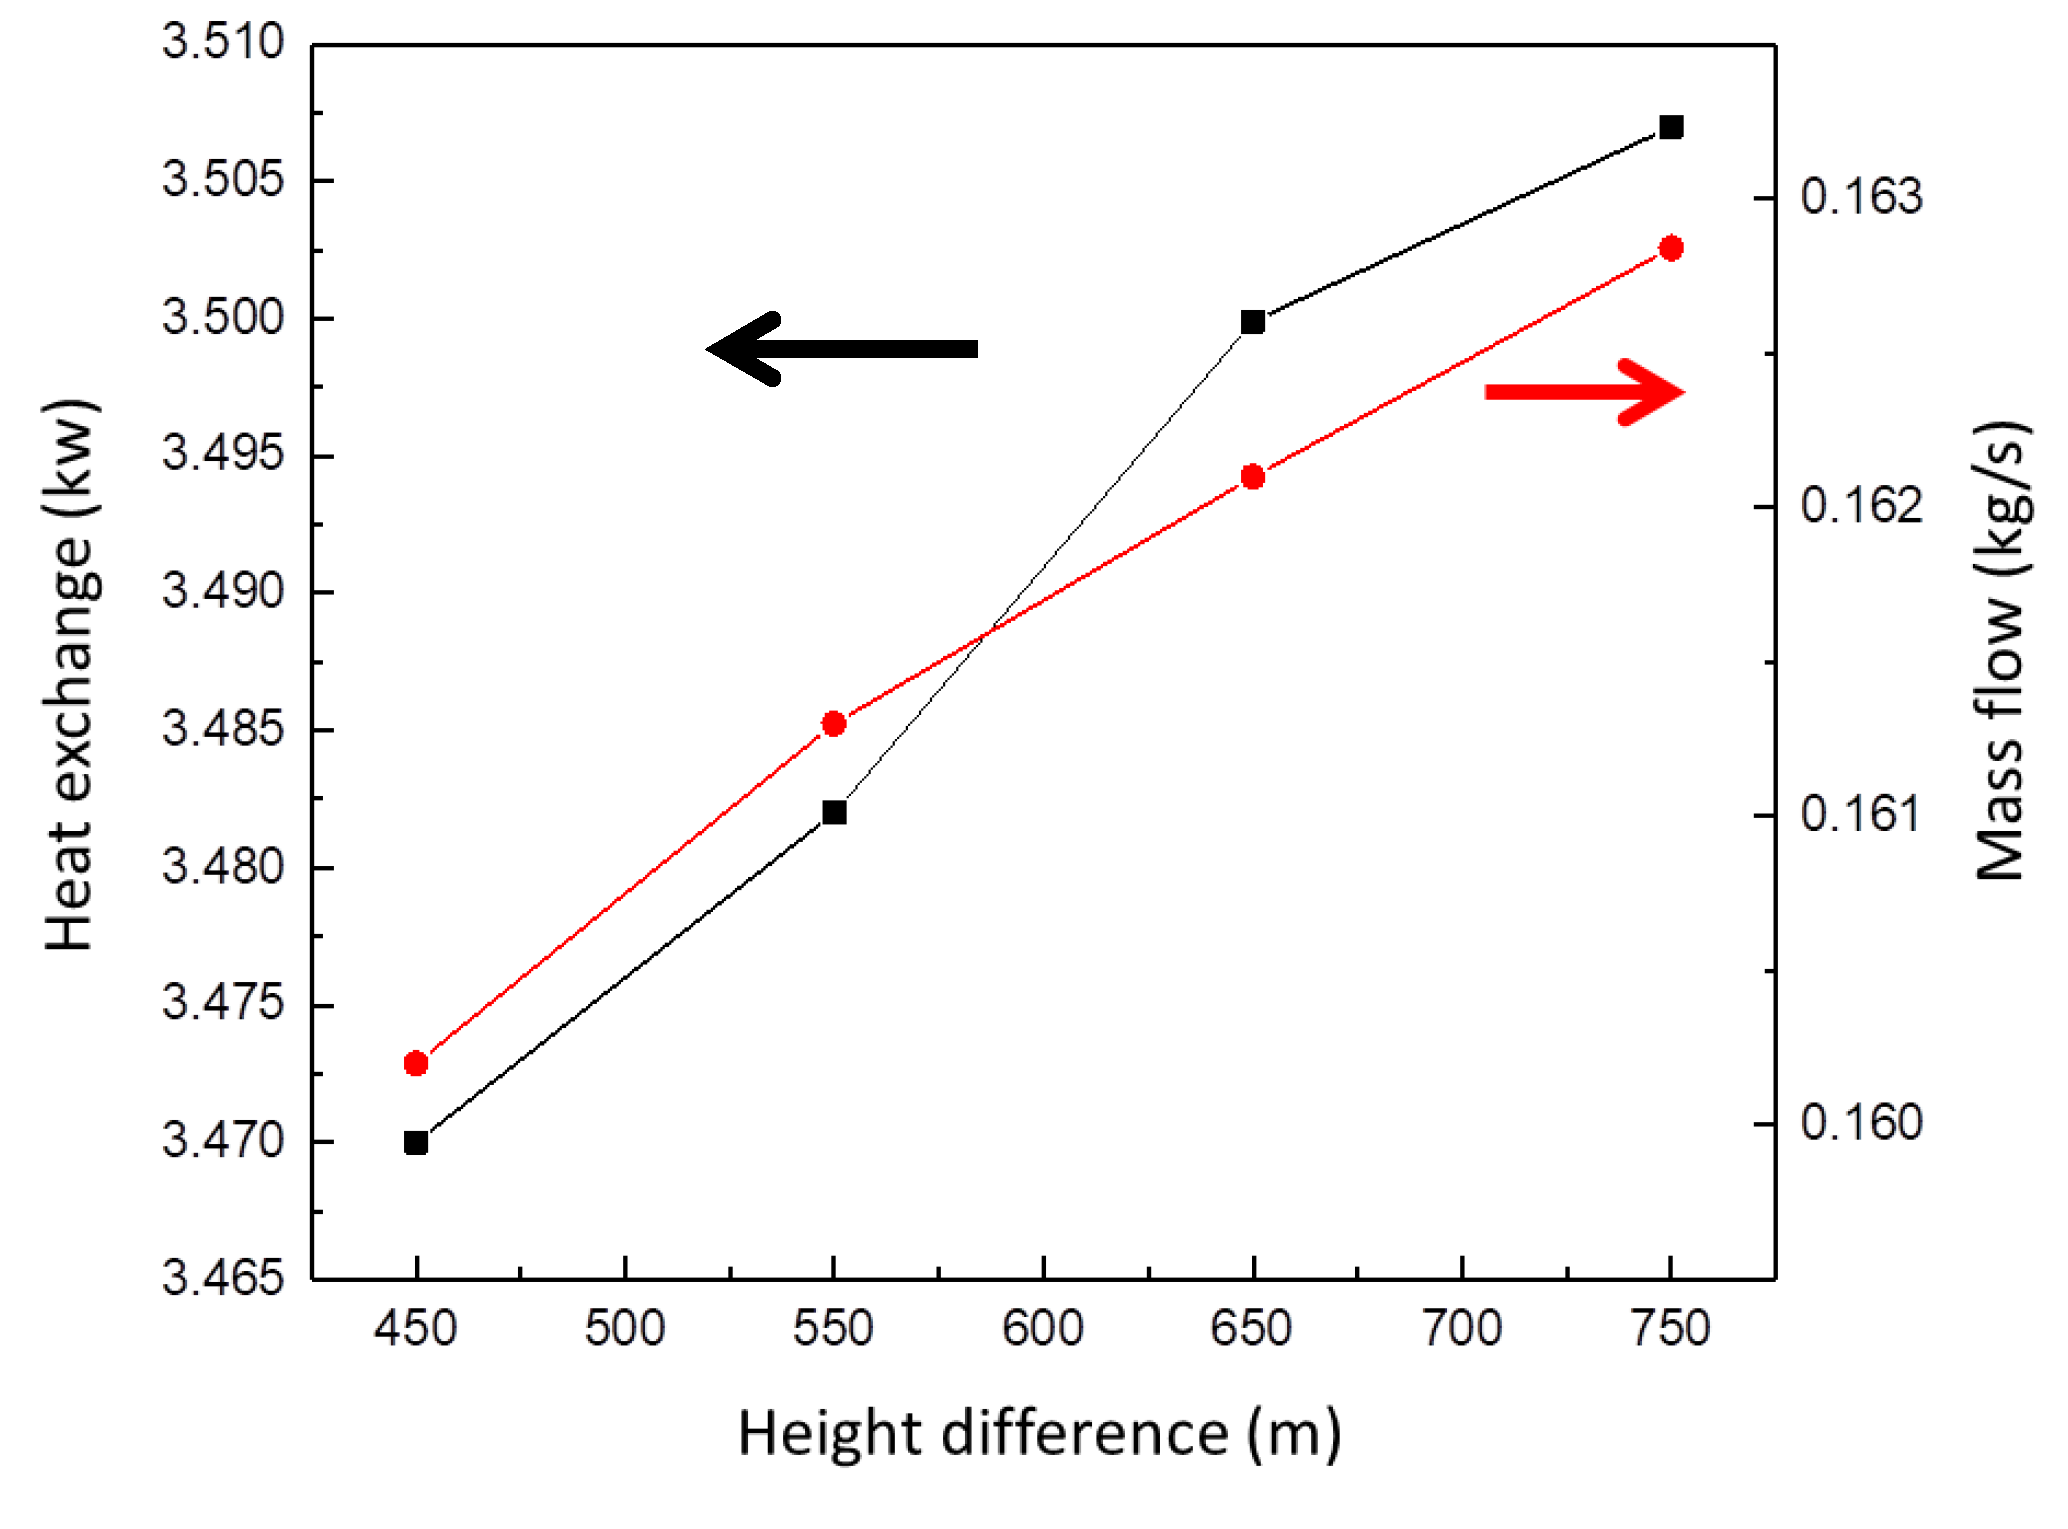
3.5. Effect of Different Height Differences

On the basis of standard working conditions, the installation position of the condenser was raised by building a bracket, and four working conditions were set for the experiment: 450 mm, 550 mm, 650 mm, and 750 mm height differences were set between the evaporator and condenser. The relationship between the heat-exchange rate and circulating flow rate of the heat pipe system and the height difference between the two devices is shown in Figure 9. It can be seen that as the height difference increases, the heat-transfer and mass flow rate of the pump-driven separated heat pipe increase slightly. When the height difference changes from 450 mm to 750 mm, the increments of the heat-transfer and mass flow rate are 1.07% and 1.65%, respectively. This situation is consistent with the simulation results. This is because for pump-driven separated heat pipes, the circulating power is jointly provided by the pump and gravity, and its calculation formula is as follows:
Δ P p u m p + Δ P g = Δ P e v a p + Δ P l i q u i d + Δ P c o n d + Δ P g a s + Δ P tan k
Δ P g = ( ρ l i q u i d ρ g a s ) g Δ H
Ppump and ∆Pg are the pressure differences provided by the centrifugal pump and gravity, Pa. ∆Pevap, ∆Pliquid, ∆Pcond, ∆Pgas, and ∆Ptank refer to the pressure drop at the evaporator, down comer, condenser, riser, and storage tank without considering gravity, Pa; ρliquid and ρgas is the density of the liquid working fluid and gas state, kg/m3; and ∆H is the height difference between the liquid level in the rising and falling pipes. From Equations (28) and (29), it can be seen that the height difference between the evaporator and condenser is increased with the circulating power and flow rate, and a better heat-transfer performance is observed by the pump-driven separated heat pipe. Increasing the height difference has a certain effect on improving the system heat transfer of the pump-driven separated heat pipe, but the improvement effect is not significant. At the same time, it is necessary to increase the length of the ascending and descending pipes. Therefore, in engineering practice, it is necessary to evaluate whether it is necessary to sacrifice the flexibility manufacturing height difference in exchange for a relatively small improvement in the heat-transfer performance of the pump-driven separated heat pipe based on actual application situations.

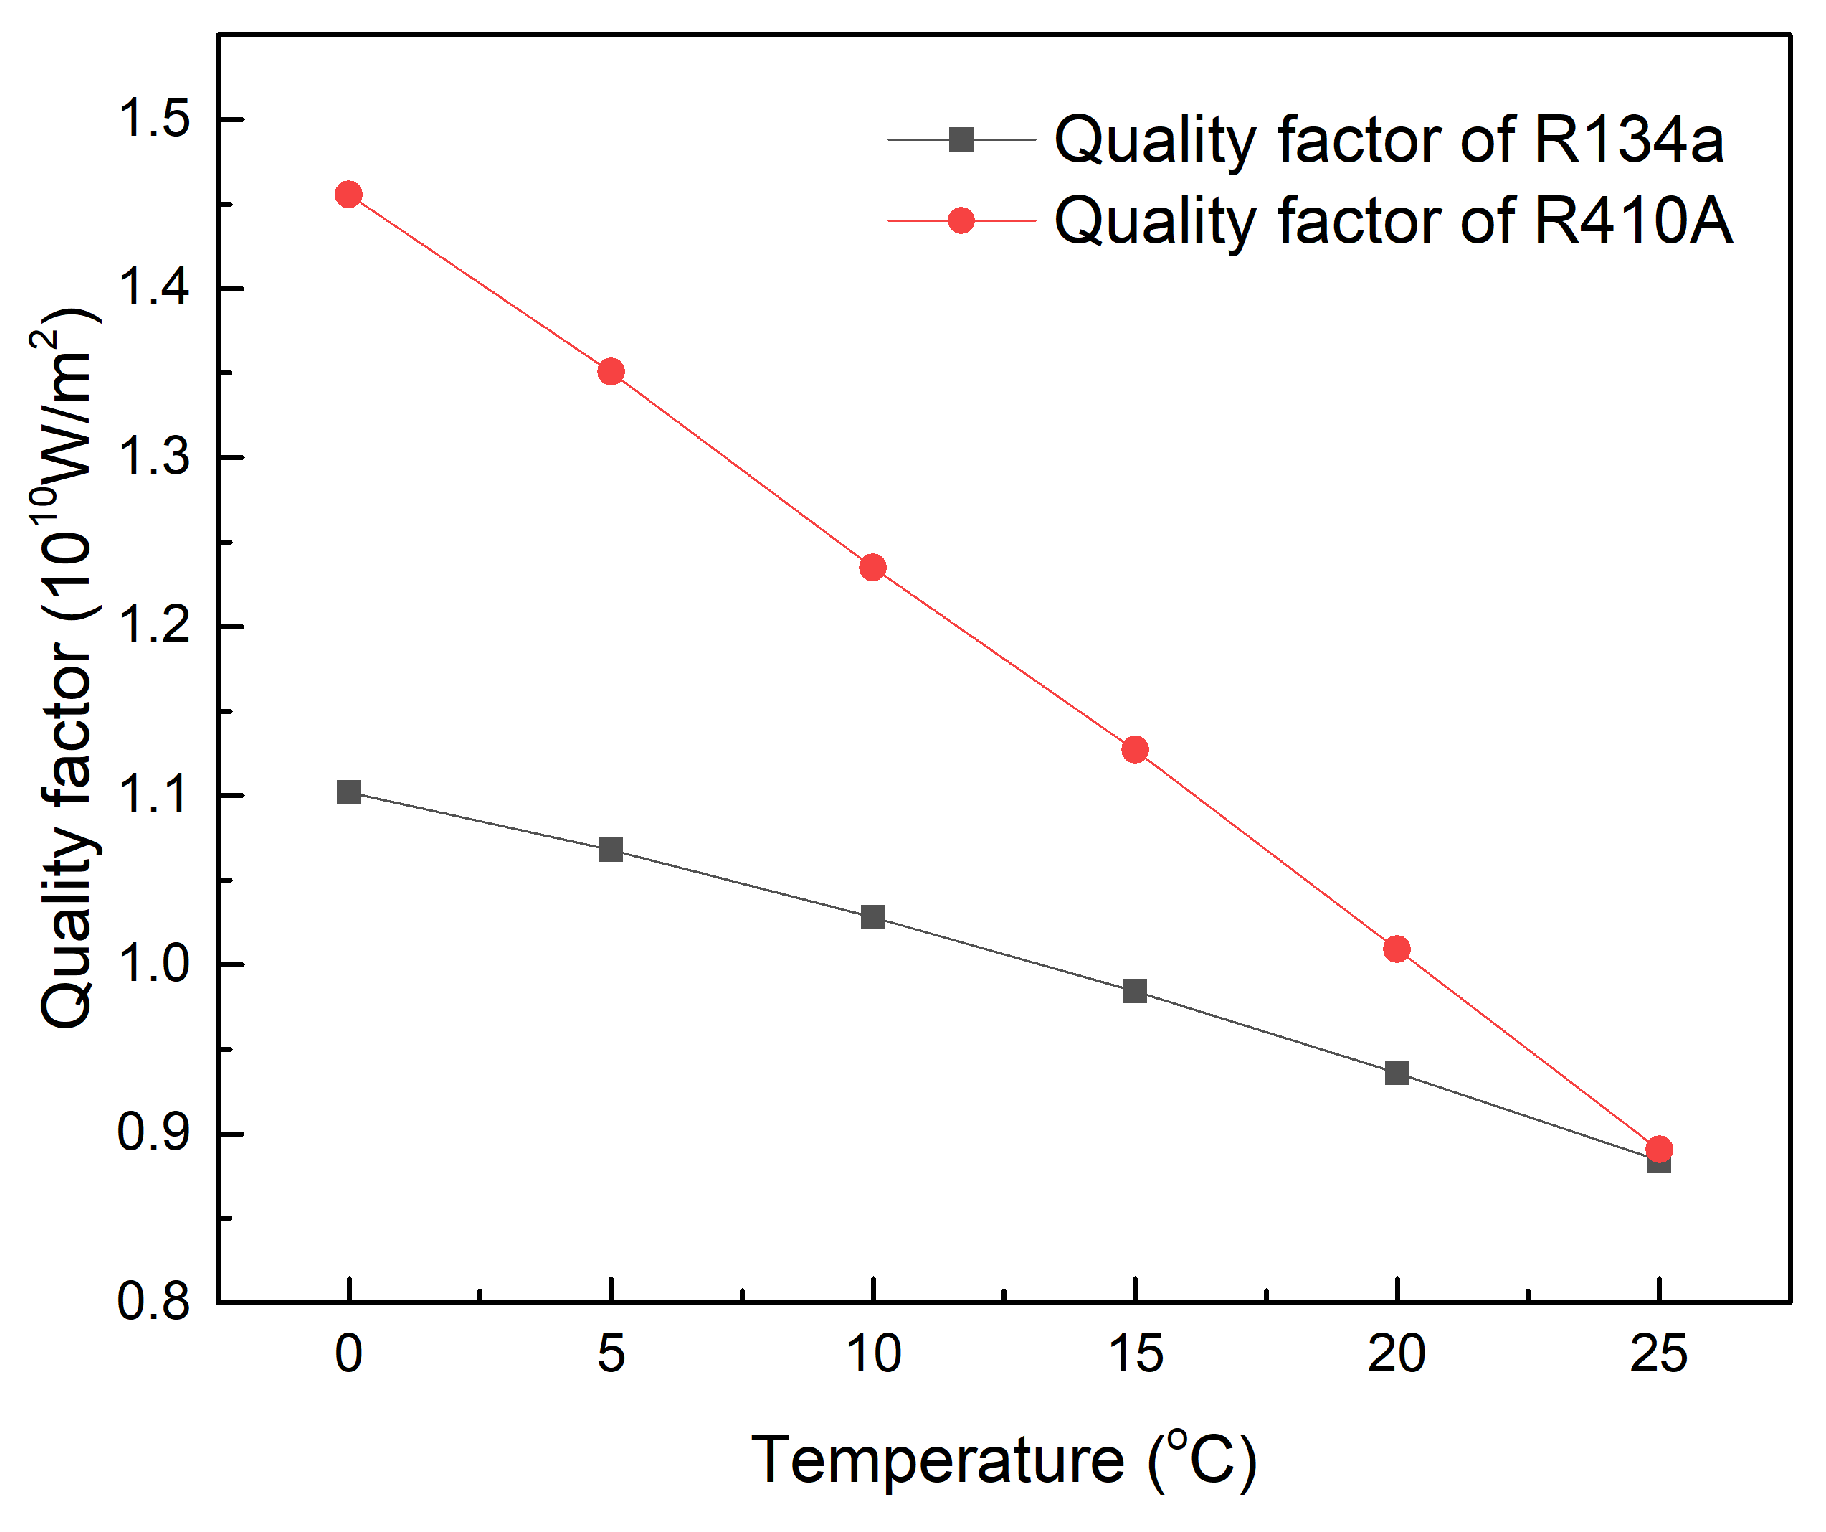
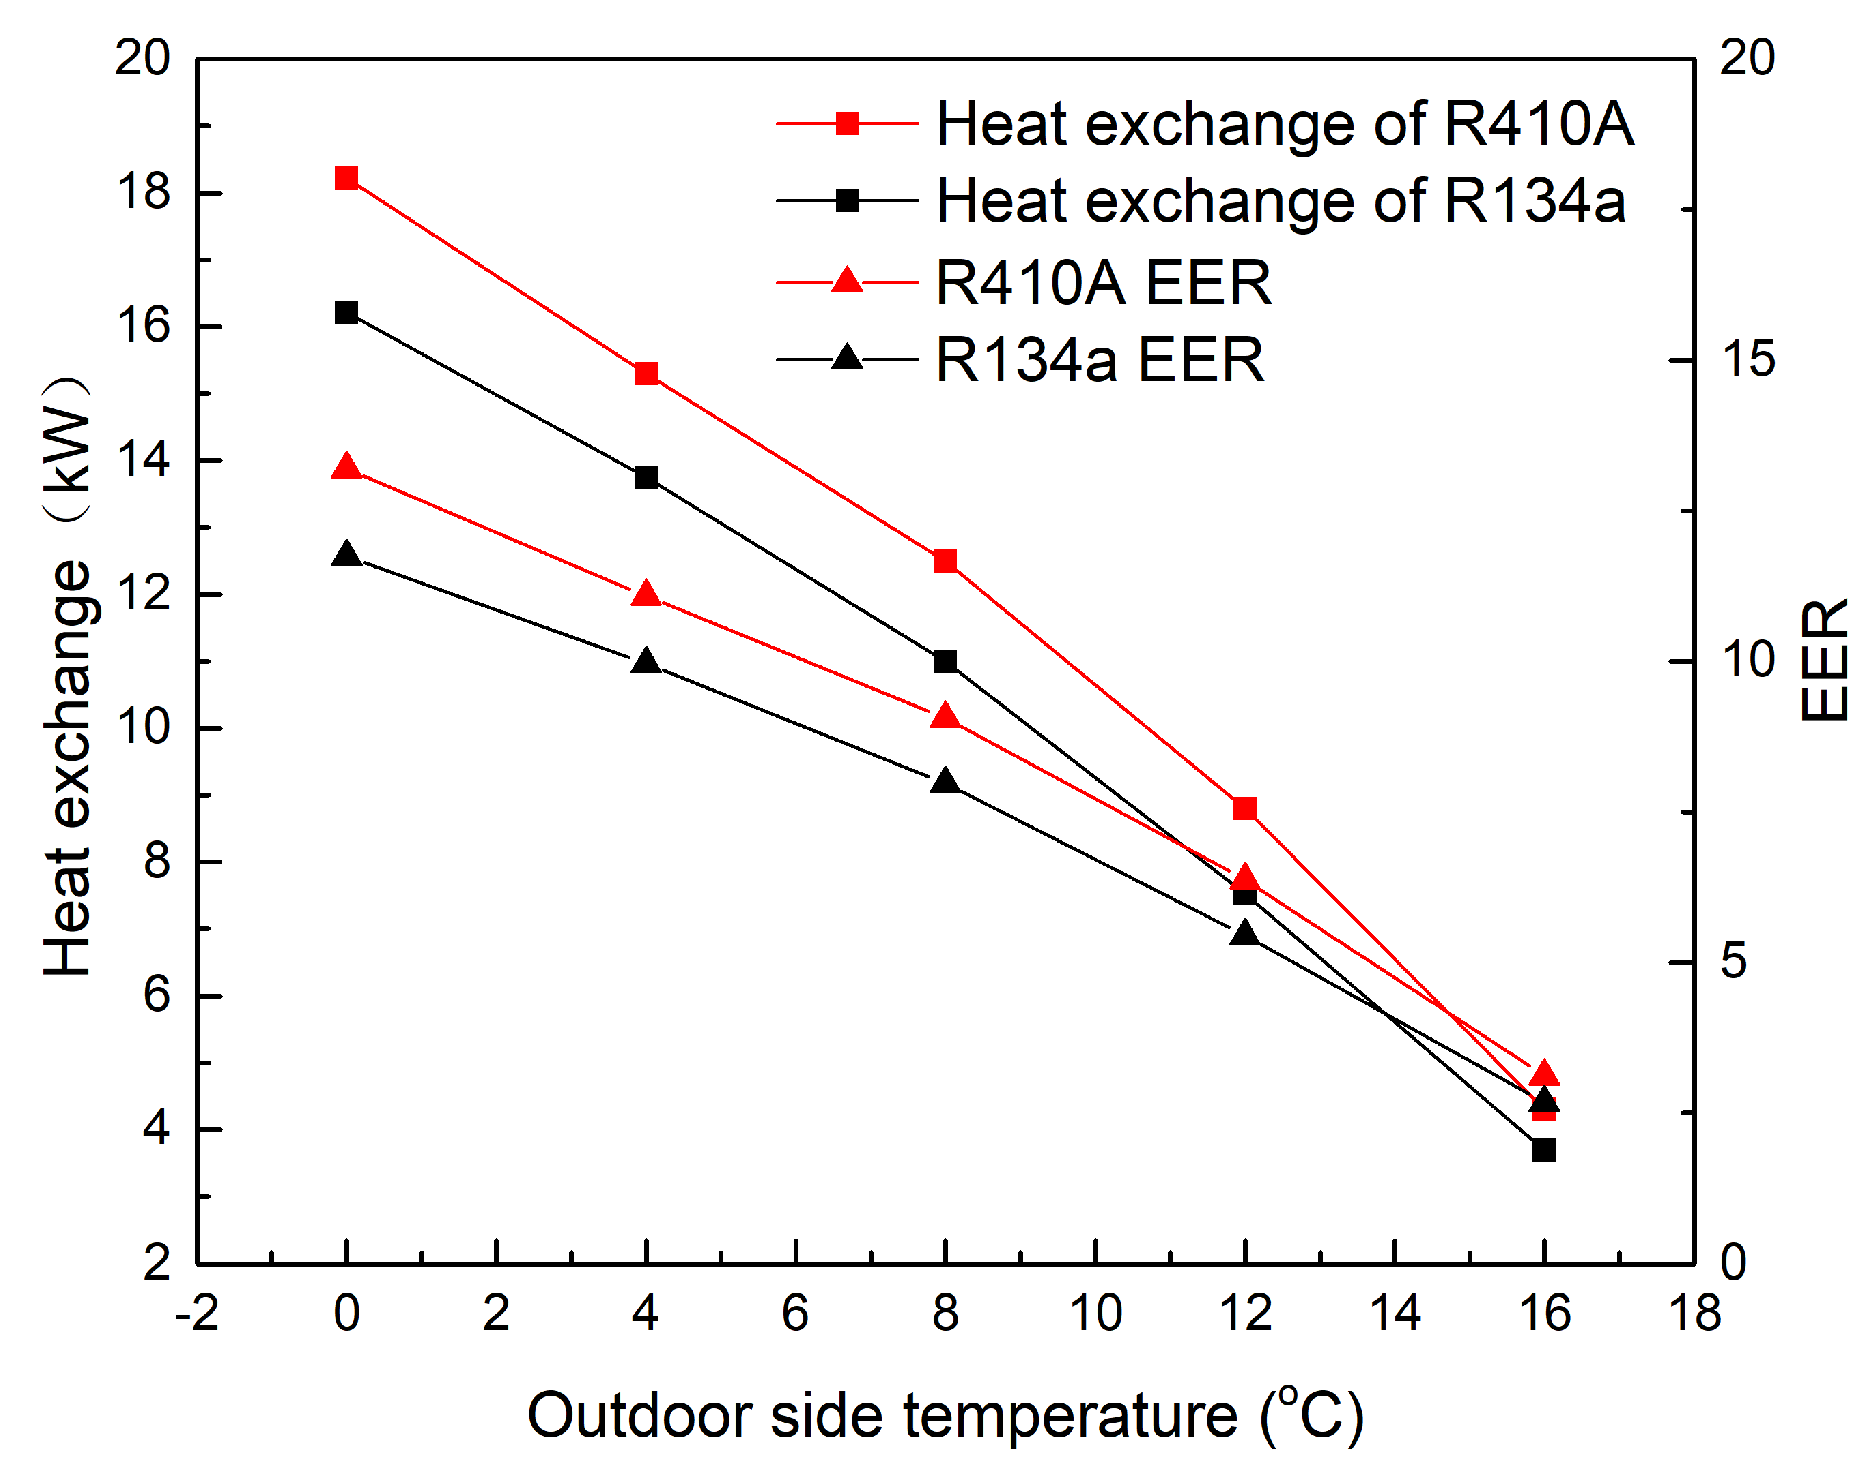
3.6. Effect of Different Type of Working Medium

In traditional heat pipes, the quality factor M is used to evaluate the heat-transfer ability of the working fluid [23,24,25]. The higher the quality factor, the better the heat-transfer and flow performance of the working fluid. Although there are significant differences in the structure and driving force between pump-driven separated heat pipes and traditional heat pipes, the quality factor M, which comprehensively characterizes the working fluid through its surface tension, density, latent heat of vaporization, and viscosity, can still serve as a reference for the selection of working fluids [23]. The calculation formula is as follows:
M = σ ρ l h f g μ l
σ is the surface tension of the working medium, N/m; ρl is the density of the liquid working fluid, kg/m3; μL is the dynamic viscosity of the liquid working fluid, Pa·s; hfg is the latent heat of vaporization of the working fluid, J/kg. The quality factors of R134a and R410A between operating temperatures of 0–25 °C are shown in Figure 10. Within the temperature range of 0–25 °C, the quality factor of R410A is higher than that of R134a, indicating that R410A has superior heat-transfer and flow performance compared to R134a within this temperature range.
From an experimental perspective, the heat-transfer performance of these two working fluids was compared. The indoor temperature of 25 °C, the outdoor temperature of 0 °C, and the condensing side fan air volume of 8000 m3/h were set as standard operating conditions. Firstly, the optimal filling rate range of the two working fluids was determined by changing the refrigerant filling amount. Within the standard operating conditions and the optimal filling rate range, the outdoor temperature and the inlet air temperature of the condenser side was changed to characterize the heat-transfer performance of the working fluid through different heat-exchange effects. Energy efficiency ratio (EER) represents the heat-transfer efficiency of the heat pipe system. The EER calculation formula for the heat pipe system is as follows:
E E R = Q W i n
W i n = P f a n , e + P f a n , c + P p u m p = 24 × 12 × 1.6 + 370 + 550 = 1380.8   W = 1.308   kW
where Q is the heat-exchange capacity of the heat pipe system, kW; Win is the input power of the system, kW; Pfan,e, Pfan,c, and Ppump, respectively, represent the energy consumption of the evaporator side small fan, condenser side fan, and centrifugal pump, W. The changes in the heat transfer and energy efficiency ratio (EER) of the two working fluids with the filling rate are shown in Figure 11. The optimal filling rate range for both working fluids is 83~102.5%. Within each filling rate range, the heat transfer of the heat pipe system when using R410A working fluid is higher than that when using R134a, with an increase of 2.8~26%. As the filling rate increases, this proportion gradually decreases, and the filling rate is in the lower range of 44~83%. The heat-exchange rate of R410A is 14.5~26% higher than that of R134a. Within the optimal filling rate range of 83~102.5%, R410A has a 9.1~14% higher heat-exchange rate than R134a; however, in the range of 102.5% to 128.5% with a high liquid filling rate, R410A has only 2.9% to 7.6% more heat exchange than R134a. This is because within the lower liquid filling rate range, the working fluid rapidly vaporizes in the evaporation section and approaches the inlet temperature of the evaporator side at the outlet. For R410A, the difference in specific enthalpy between the gas working fluid with a higher temperature and the liquid working fluid with a lower temperature is higher than R134a. As the filling rate increases, the growth value of the working fluid temperature decreases, the difference in specific enthalpy correspondingly decreases, and the relative difference in heat transfer decreases. Due to the constant input power Win of the system, the trend of changes and comparisons in the EER of the two working fluids is the same as that of the heat exchange. Within the optimal filling rate range, the maximum EER values of R410A and R134a reached 11.74 and 13.20, respectively.
Keeping the indoor temperature constant at 25 °C, the trend of the heat transfer and EER of the two working fluids with the change of the outdoor temperature is shown in Figure 4 and Figure 5. As the outdoor air temperature increases, the temperature difference between the hot and cold ends of the heat exchanger decreases and the temperature difference between the air and refrigerant in the condenser also decreases. The subcooling of the working fluid at the outlet of the condenser decreases, while the phase change of the working fluid decreases. The proportion of the latent heat transfer with the higher heat-transfer efficiency decreases, and the proportion of the sensible heat transfer increases. The heat exchange rate decreases, and as the temperature difference decreases, the trend of decreasing heat exchange gradually increases; the main reason for the decrease in the heat exchange is the shift from a decrease in undercooling to a decrease in the proportion of working fluids for the latent heat exchange. When the outdoor temperature increases from 0 °C to 16 °C, the indoor and outdoor temperature difference decreases from 25 °C to 9 °C, the heat transfer of R410A decreases from 18.22 kW to 4.3 kW, and the EER decreases from 13.20 to 3.11, with a decrease of 76.4%; the heat-exchange rate of R134a decreases from 16.21 kW to 3.69 kW, and the EER decreases from 11.74 to 2.67, with a decrease of 77.2%. It can be seen from Figure 12 that as a refrigerant, R410A has a better heat-transfer performance when applied to the separated heat pipe system in this paper when the outdoor temperature is below 15 °C. The heat transfer and EER obtained by applying R410A to the heat pipe are fitted with the change in outdoor temperature. When the indoor temperature is 25 °C, the function equation of the heat transfer and EER of the pump-driven separated heat pipe system with the change in outdoor temperature is as follows:
Q = 0.01812 t 2 0.5685 t + 18.112
EER = 0.01313 t 2 0.41172 t + 13.11703

4. Conclusions

This paper designed and selected a pump-driven microchannel-separated heat pipe system and built an experimental platform. Through the testing of variable operating conditions and a numerical analysis of the pump-driven microchannel-separated heat pipe system, the steady-state characteristics of the separated heat pipe system were studied. The following conclusions can be drawn:
(1) Under standard operating conditions, the optimal filling rate range of the system is 75% to 95%. When the pump-driven heat pipe system reaches a steady-state heat transfer, the heat transfer shows a trend of first increasing and then decreasing with the increase in the filling rate, while the thermal resistance shows a trend of first decreasing and then increasing with the increase in the filling rate. The outlet temperature and superheat of the evaporator decrease with the increase in the filling rate, while the outlet pressure of the evaporator increases, and the growth trend slows down with the increase in the filling rate.
(2) The relationship between the circulating mass flow rate and the heat-transfer capacity of the heat pipe system is influenced by the comprehensive resistance of each section and the heat-transfer coefficient of the heat exchanger. Under the experimental conditions, the beneficial effects of increasing the circulating flow rate on the heat-transfer capacity is greater than the unfavorable effects. The heat-transfer capacity increases with the increase in the mass flow rate, and the superheat degree of the working fluid at the evaporator outlet decreases with the increase in the mass flow rate.
(3) There is an optimal condensing air volume to maximize the system’s heat exchange. Reducing the air volume below the optimal level leads to insufficient air quality, while increasing the air volume leads to an insufficient heat exchange between the air and the wall of the heat exchanger. In addition, increasing the indoor and outdoor temperature difference has a significant effect on improving the heat-transfer performance of the separated heat pipes.
(4) Gravity is not the main driving force in pump-driven separated heat pipes, and an increase in height difference does not significantly improve the system’s heat-transfer efficiency. In engineering practice, it should be considered whether it is necessary to sacrifice flexibility to manufacture height difference in exchange for improving the heat-transfer performance of pump-driven separated heat pipes.
(5) Comparing the heat-transfer performance of the R410a and R134A refrigerants used as working fluids in pump-driven microchannel-separated heat pipe systems, it was found that R410a has a better heat-transfer performance than R134A at outdoor temperatures ranging from 0 to 15 °C.

Author Contributions

Conceptualization, S.C.; Methodology, P.X.; Software, J.S.; Formal analysis, L.S.; Investigation, C.H.; Writing—original draft, Z.C. All authors have read and agreed to the published version of the manuscript.

Funding

This research was funded by National Natural Science Foundation of China grant number [No. 52306090, No. 52076040] and China Postdoctoral Science Foundation grant number [2023M731642].

Informed Consent Statement

Not applicable.

Data Availability Statement

The data that support the findings of this study are available on request from the corresponding author.

Conflicts of Interest

Author Shengpeng Chen was employed by the company Nanjing Canatal Data-Centre Enviromentol Tech Co., Ltd. The remaining authors declare that the research was conducted in the absence of any commercial or financial relationships that could be construed as a potential conflict of interest.

References

  1. Chen, X.; Wang, X.; Ding, T.; Li, Z. Experimental research and energy saving analysis of an integrated data center cooling and waste heat recovery system. Appl. Energy 2023, 352, 121875. [Google Scholar] [CrossRef]
  2. Abbas, A.M.; Huzayyin, A.S.; Mouneer, T.A.; Nada, S. Effect of data center servers’ power density on the decision of using in-row cooling or perimeter cooling. Alex. Eng. J. 2021, 60, 3855–3867. [Google Scholar] [CrossRef]
  3. Fu, H.; Baltazar, J.C.; Claridge, D.E. Review of developments in whole-building statistical energy consumption models for commercial buildings. Renew. Sustain. Energy Rev. 2021, 147, 111248. [Google Scholar] [CrossRef]
  4. Chen, X.; Zhang, C.; Li, Y. Research and development of hydrogen energy safety. Emerg. Manag. Sci. Technol. 2022, 2, 3. [Google Scholar] [CrossRef]
  5. Guo, P.; Xu, C.; Lu, J.; Wang, Z.; Chang, X.; Hu, L.; Wang, Z.; Dong, J. Study on the effect of channel spacing on premixed syngas-air explosion inside parallel narrow channels. Emerg. Manag. Sci. Technol. 2023, 3, 8. [Google Scholar] [CrossRef]
  6. Liu, S.; Ma, G.; Jia, X.; Xu, S.; Wu, G. Performance of a mechanically-driven loop heat pipe heat recovery system. Appl. Therm. Eng. 2022, 207, 118066. [Google Scholar]
  7. Miyazaki, Y.; Oshima, S.; Furukawa, M.; Imai, R. Pump assisted heat pipe system. In Proceedings of the Thermophysics, Plasmadynamics & Lasers Conference, San Antonio, CA, USA, 27–29 June 1988. [Google Scholar]
  8. Park, C.; Vallury, A.; Zuo, J. Performance evaluation of a pump-assisted capillary two- phase cooling loop. J. Therm. Sci. Eng. Appl. 2009, 1, 022004. [Google Scholar] [CrossRef]
  9. Park, C.; Crepinsek, M. Effect of operational conditions on cooling performance of pump-assisted and capillary-driven two- phase loop. J. Thermophys. Heat Transf. 2011, 25, 572–580. [Google Scholar] [CrossRef]
  10. Zhang, D.; Li, G.; Liu, Y.Q.; Tian, X. Simulation and experimental studies of R134a flow condensation characteristics in a pump-assisted separate heat pipe. Int. J. Heat Mass Transf. 2018, 126, 1020–1030. [Google Scholar] [CrossRef]
  11. Ambrose, J.H.; Feild, A.R.; Holmes, H.R. A pumped heat pipe cold plate for high-flux applications. Exp. Therm. Fluid Sci. 1995, 10, 156–162. [Google Scholar] [CrossRef]
  12. Salvatore, V.; Valeria, P.; Davide, L.R.; Bonanno, A. Experimental assessment and numerical study of a pump-assisted loop heat pipe for high capacity thermal systems. Appl. Therm. Eng. 2020, 180, 115828. [Google Scholar]
  13. Kim, M.H.; Bullard, C.W. Air-side thermal hydraulic performance of multi-louvered fin aluminum heat exchangers. Int. J. Refrig. 2002, 25, 390–400. [Google Scholar] [CrossRef]
  14. Bivens, D.B.; Yokozeki, A. Heat transfer coefficient and transfer properties for alternative refrigerants. In Proceedings of the 1994 International Refrigeration Conference at Purdue, West Lafayette, IN, USA, 19–22 July 1994. [Google Scholar]
  15. Kandlikar, S.G.; Steinke, M.E. Predicting heat transfer during flow boiling in minichannels and microchannels. ASHRAE Trans. 2003, 109, 667–676. [Google Scholar]
  16. Fannou, J.L.C.; Rousseau, C.; Lamarche, L.; Stanislaw, K. A comparative performance study of a direct expansion geothermal evaporator using R410A and R407C as refrigerant alternatives to R22. Appl. Therm. Eng. 2015, 82, 306–317. [Google Scholar] [CrossRef]
  17. Dang, C.; Jia, L.; Xu, M.C. Experimental study on flow boiling characteristics of pure refrigerant (R134a) and zeotropic mixture (R407C) in a rectangular micro-channel. Int. J. Heat Mass Transf. 2017, 104, 351–361. [Google Scholar] [CrossRef]
  18. Bolaji, B.O. Performance investigation of ozone-friendly R404A and R507 refrigerants as alternatives to R22 in a window air-conditioner. Energy Build. 2011, 43, 3139–3143. [Google Scholar] [CrossRef]
  19. Jiang, G.B.; Tan, J.T.; Nian, Q.X.; Tang, S.C.; Tao, W.Q. Experimental study of boiling heat transfer in smooth/micro-fin tubes of four refrigerants. Int. J. Heat Mass Transf. 2016, 98, 631–642. [Google Scholar] [CrossRef]
  20. Han, C.L.; He, L.D.; Tian, Z.Z.; Xu, B.; Chen, Z. Study of heat dissipation characteristics of loop heat pipe with heat sink of composite material. Appl. Therm. Eng. 2022, 200, 117572. [Google Scholar] [CrossRef]
  21. Der, O.; Edwardson, S.; Marengo, M.; Bertola, V. Engineered composite polymer sheets with enhanced thermal conductivity. IOP Conf. Ser. Mater. Sci. Eng. 2019, 613, 012008. [Google Scholar] [CrossRef]
  22. Zhang, D.; He, Z.; Guan, J.; Tang, S.Z.; Shen, C. Heat transfer and flow visualization of pulsating heat pipe with silica nanofluid: An experimental study. Int. J. Heat Mass Transf. 2022, 183, 122100. [Google Scholar] [CrossRef]
  23. Reay, D.; Kew, P.; Mcglen, R.J. Heat Pipes: Theory, Design and Applications, 6th ed.; Butterworth-Heinemann: Oxford, UK, 2014. [Google Scholar]
  24. Holman, J.P. Heat Transfer, 10th ed.; McGraw-Hill: New York, NY, USA, 2002. [Google Scholar]
  25. Yang, S.M.; Tao, W.Q. Heat Transfer, 4th ed.; Higher Education Press: Beijing, China, 2006. (In Chinese) [Google Scholar]
Figure 1. (a) Temperature entropy diagram of pump-driven separated heat pipe working fluid cycle; (b) schematic diagram of spoiler fin flat tube; (c) working fluid cycle flow sheet; (d) performance curve of centrifugal pump.
Sustainability 15 16839 g001
Figure 2. Schematic diagram of pump-driven microchannel-separated heat pipe system.
Sustainability 15 16839 g002
Figure 3. Curve of heat exchange and system thermal resistance changing with liquid filling rate.
Sustainability 15 16839 g003
Figure 4. Curve of evaporator outlet temperature and superheat as a function of liquid filling rate.
Sustainability 15 16839 g004
Figure 5. Evaporator outlet pressure and mass flow rate variation curve with liquid filling rate.
Sustainability 15 16839 g005
Figure 6. Evaporator outlet pressure and heat-transfer curve with mass flow rate.
Sustainability 15 16839 g006
Figure 7. Temperature and heat-transfer curve of condenser outlet air with condensing air volume.
Sustainability 15 16839 g007
Figure 8. Curve of heat exchange and evaporator outlet temperature of heat pipe system changing with inlet air temperature difference.
Sustainability 15 16839 g008
Figure 9. Curve of heat exchange and circulating flow rate of heat pipe system changing with the height difference between the two devices.
Sustainability 15 16839 g009
Figure 10. Quality factor curves of two refrigerants.
Sustainability 15 16839 g010
Figure 11. Changes in heat transfer and energy efficiency ratio (EER) of two working mediums as a function of filling rate.
Sustainability 15 16839 g011
Figure 12. Changes in heat transfer and energy efficiency ratio (EER) of two working fluids with outside room temperature.
Sustainability 15 16839 g012
Table 1. Rated design parameters of pump-driven separated heat pipe system.
Design ParametersValueDesign ParametersValue
Heat-exchange capacity of heat pipe (kW)4Working temperature of heat pipe (°C)42.5
Inlet temperature of evaporator te,in (°C)55Inlet temperature of condenser tc,in (°C)25
Outlet temperature of evaporator te,out (°C)50Outlet temperature of condenser tc,out (°C)29
Qualitative temperature of evaporator te (°C)52.5Qualitative temperature of condenser tc (°C)27
Table 2. Structural parameters of microchannel parallel flow heat exchanger.
Design ParametersValueDesign ParametersValue
Outer width of flat tube Bto
(mm)
32Fin height Hf (mm)8
Inter width of flat tube
Bti (mm)
31Fin pitch Pf (mm)1.5
Outer height of flat tube Bto (mm)2Fin width Bf (mm)32
Inter height of flat tube
Bti (mm)
1.2Spoiler angle θ (°)30°
Number of thin walls inside the tube Nw20Fin thickness δf (mm)0.1
Wall thickness δ (mm)0.27Fin slot length L1 (mm)7
Pipe diameter D (mm)38Spoiler spacing P1 (mm)1
Table 3. Pipeline design parameters.
Pipeline LocationDiameter (mm)Length (mm)
Evaporator outlet to condenser inlet15.881.5
Condenser outlet to storage tank inlet15.881.0
Outlet of storage tank to inlet of pump15.880.5
Pump outlet to evaporator inlet15.881.0
Disclaimer/Publisher’s Note: The statements, opinions and data contained in all publications are solely those of the individual author(s) and contributor(s) and not of MDPI and/or the editor(s). MDPI and/or the editor(s) disclaim responsibility for any injury to people or property resulting from any ideas, methods, instructions or products referred to in the content.

