

Thermal Comfort Comparison and Cause Analysis of Low-Temperature High-Humidity Indoor Environments of Rural Houses in Gansu Province, China


Abstract
:1. Introduction
1.1. Research Background
1.2. Objective of This Study
- (1)
- In a low-temperature, high-humidity environment, what is the underlying mechanism behind the real physical performance of low-cost indigenous materials?
- (2)
- How can houses be made more conducive to comfort and health while keeping economic costs limited?
2. Methodology
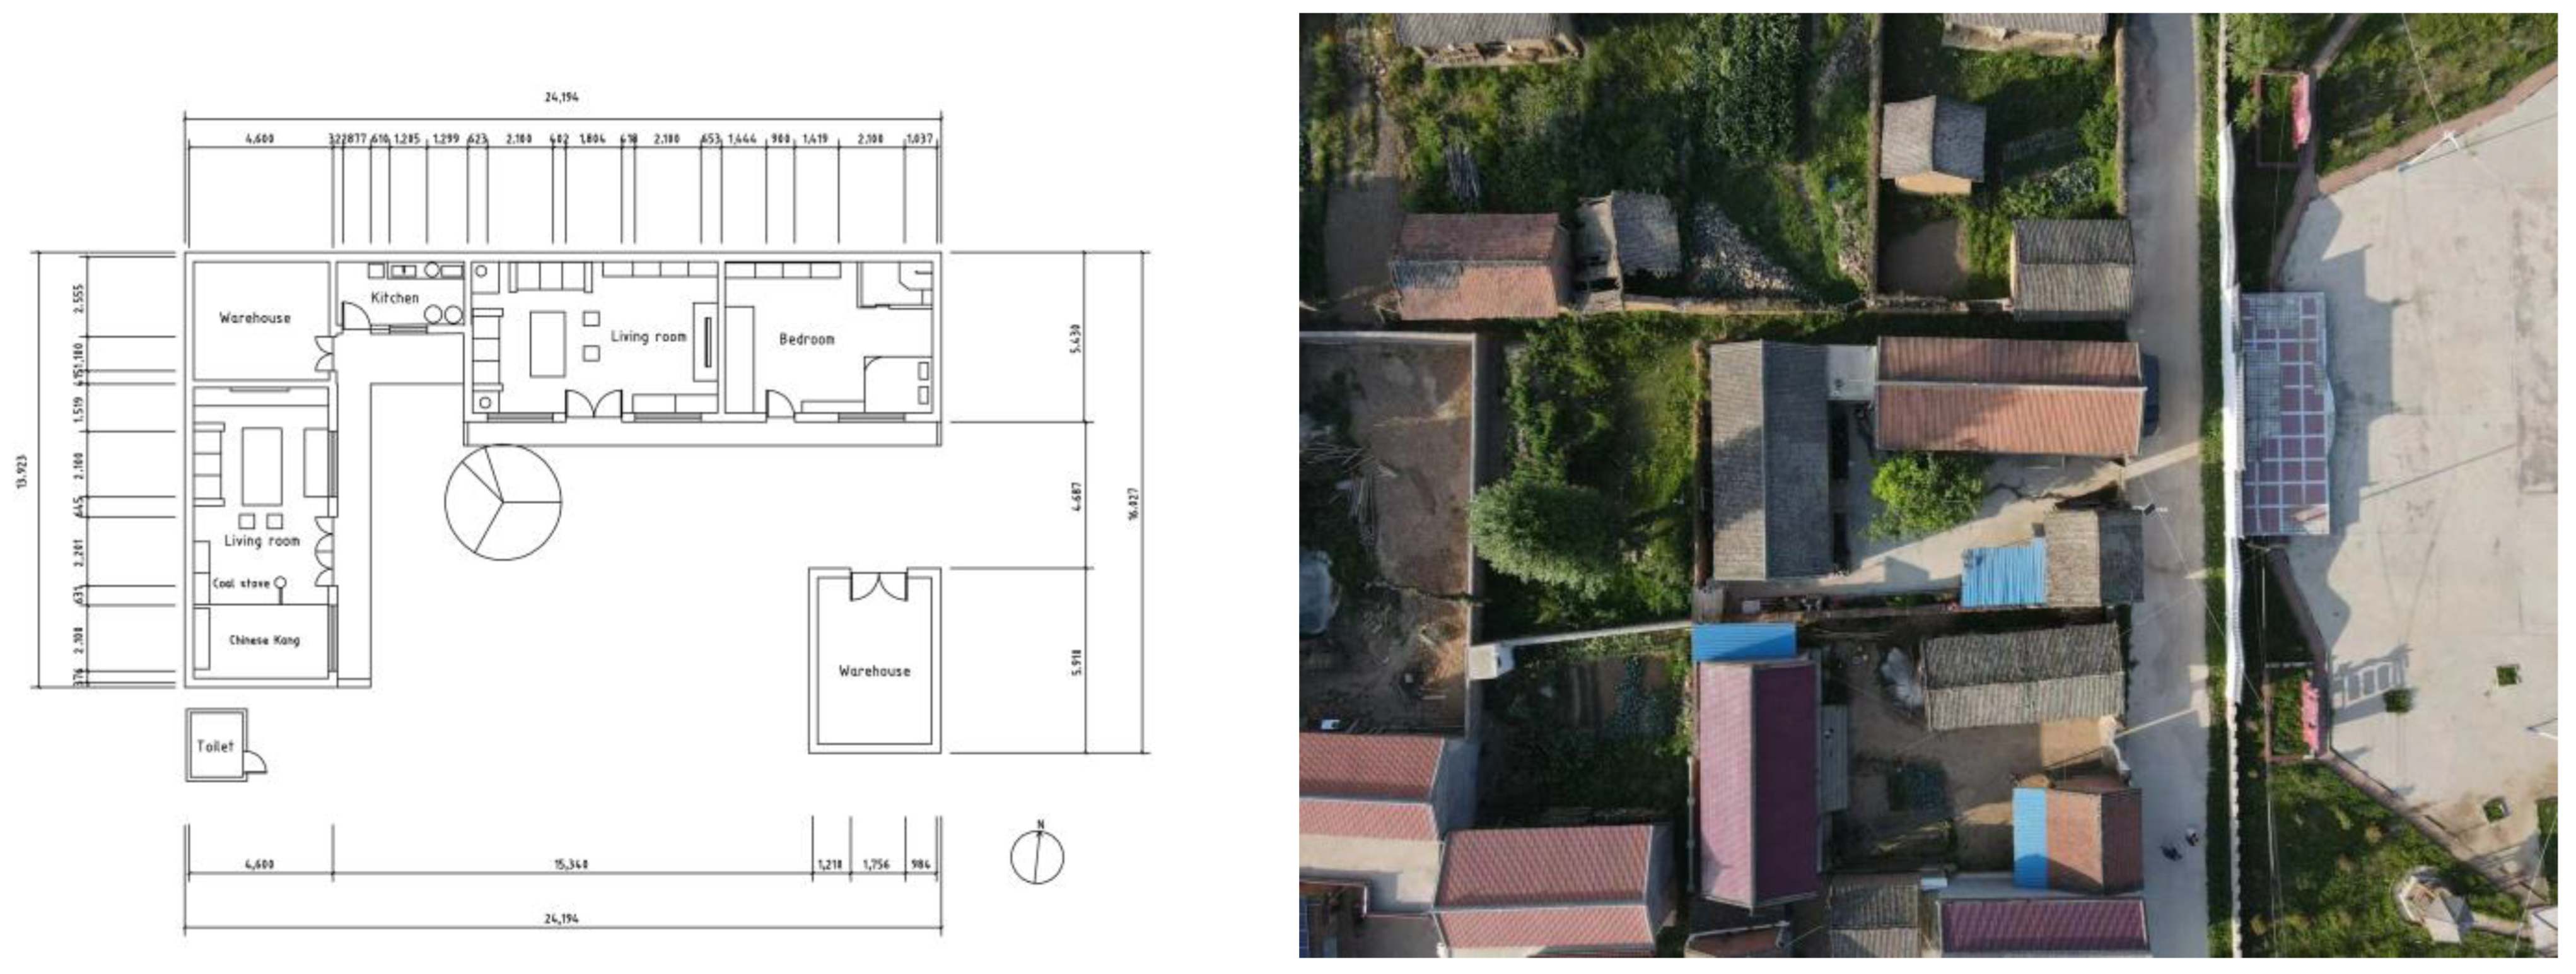
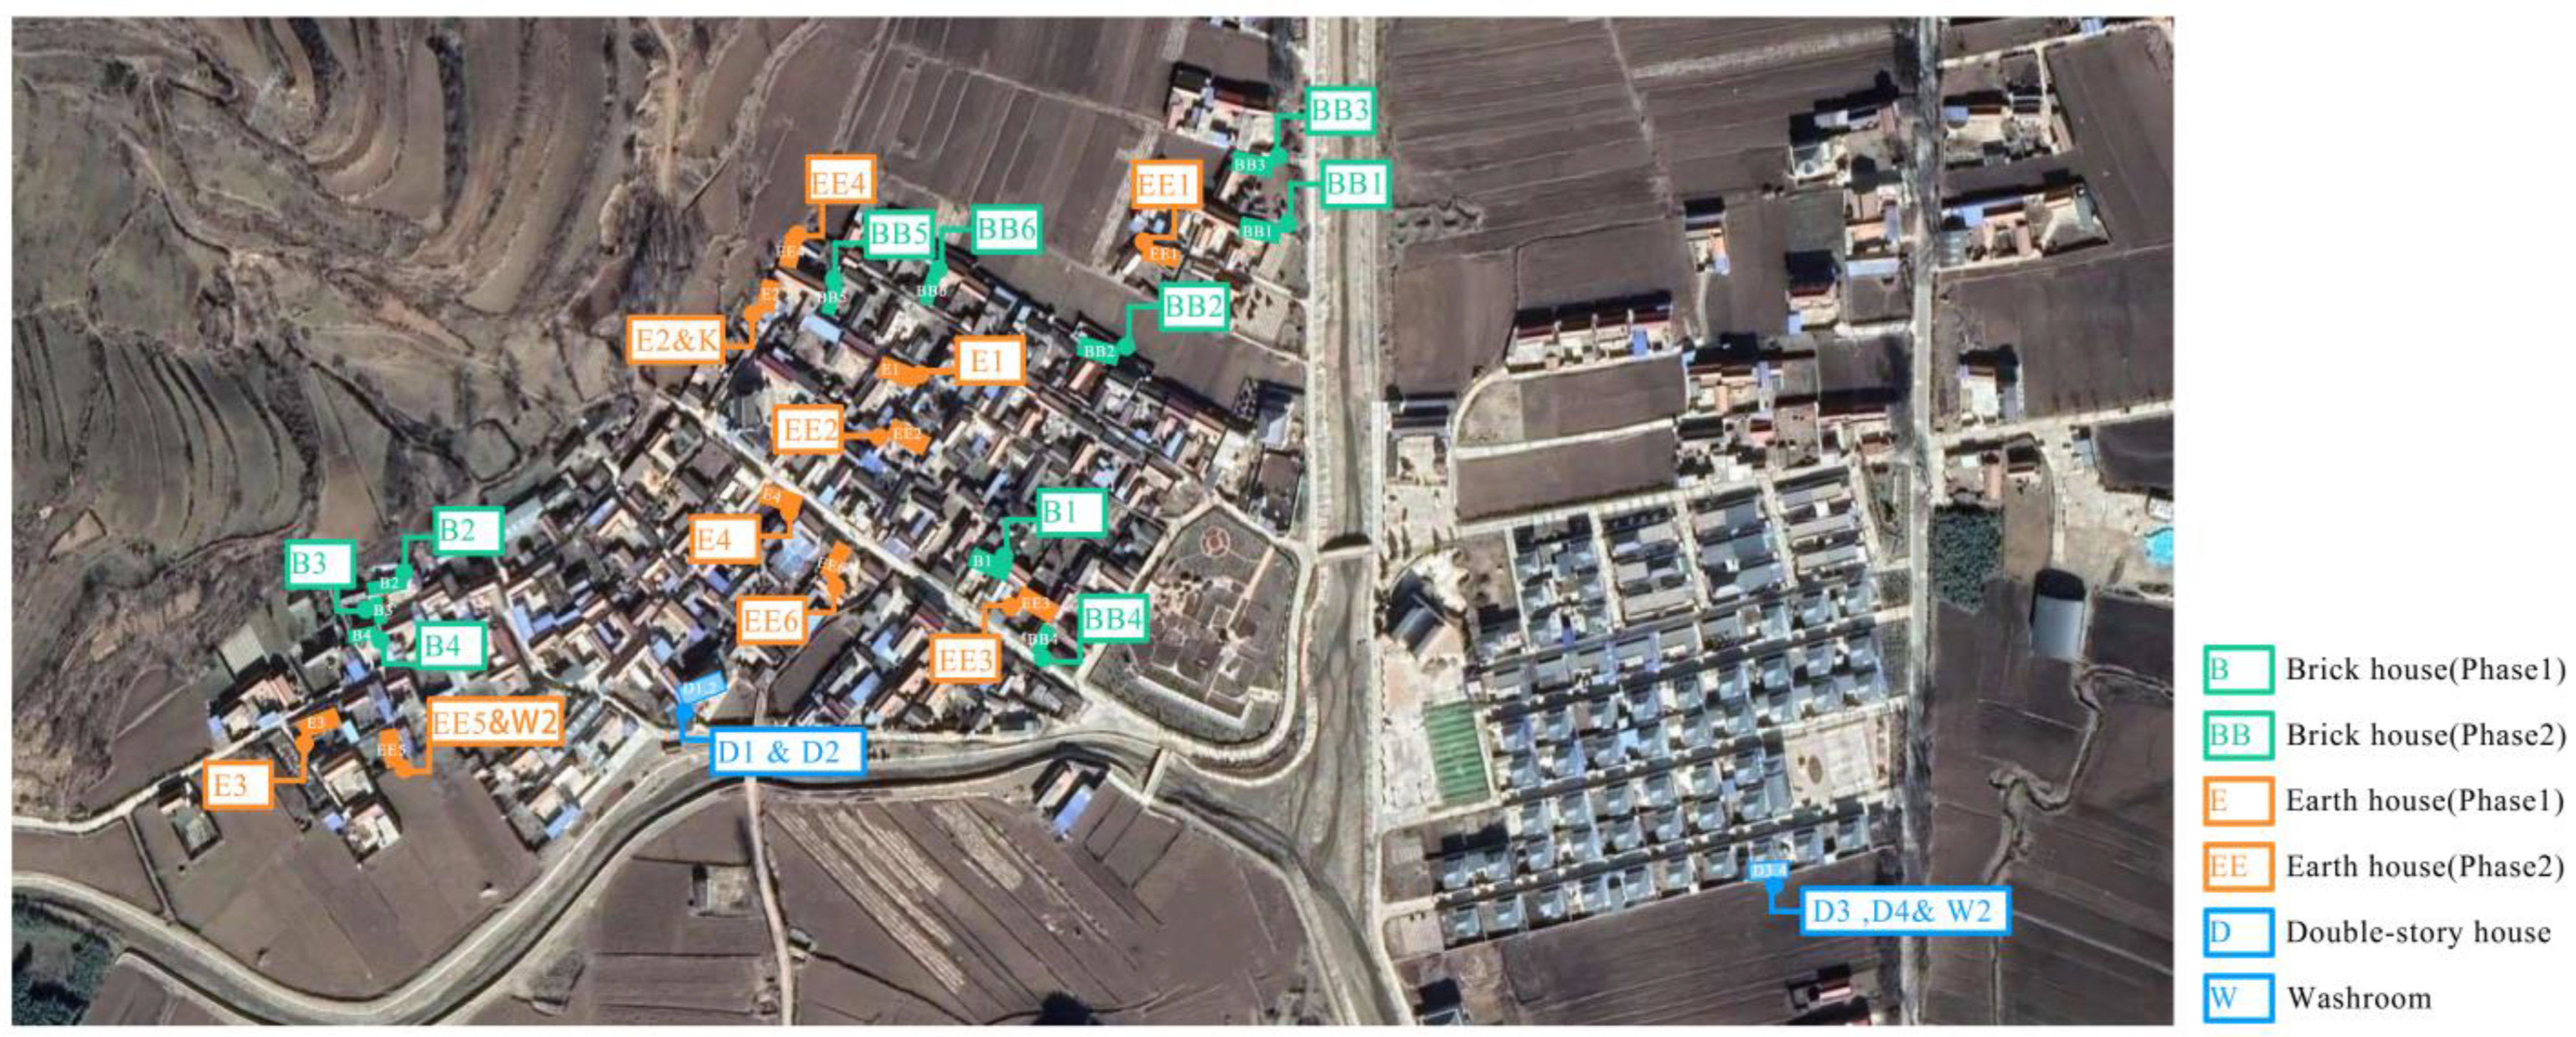
2.1. Study of the Current Situation
2.2. Questionnaires
- (1)
- In the respondent’s home, turn on the temperature thermometer and place it at a height of approximately 1.2 m (out of direct sunlight).
- (2)
- After, the respondent rests for 5–10 min. Then, measure the body temperature of respondent, the room temperature and humidity.
- (3)
- Questionnaire interview about indoor environment.
- (4)
- After remaining indoors for 2–5 min, respondents were asked to move outdoors for 10 min without changing their clothing.
- (5)
- Questionnaire interview about outdoor environment.
2.3. On-Site Monitoring Method
3. Summary of Research Findings and Characteristics
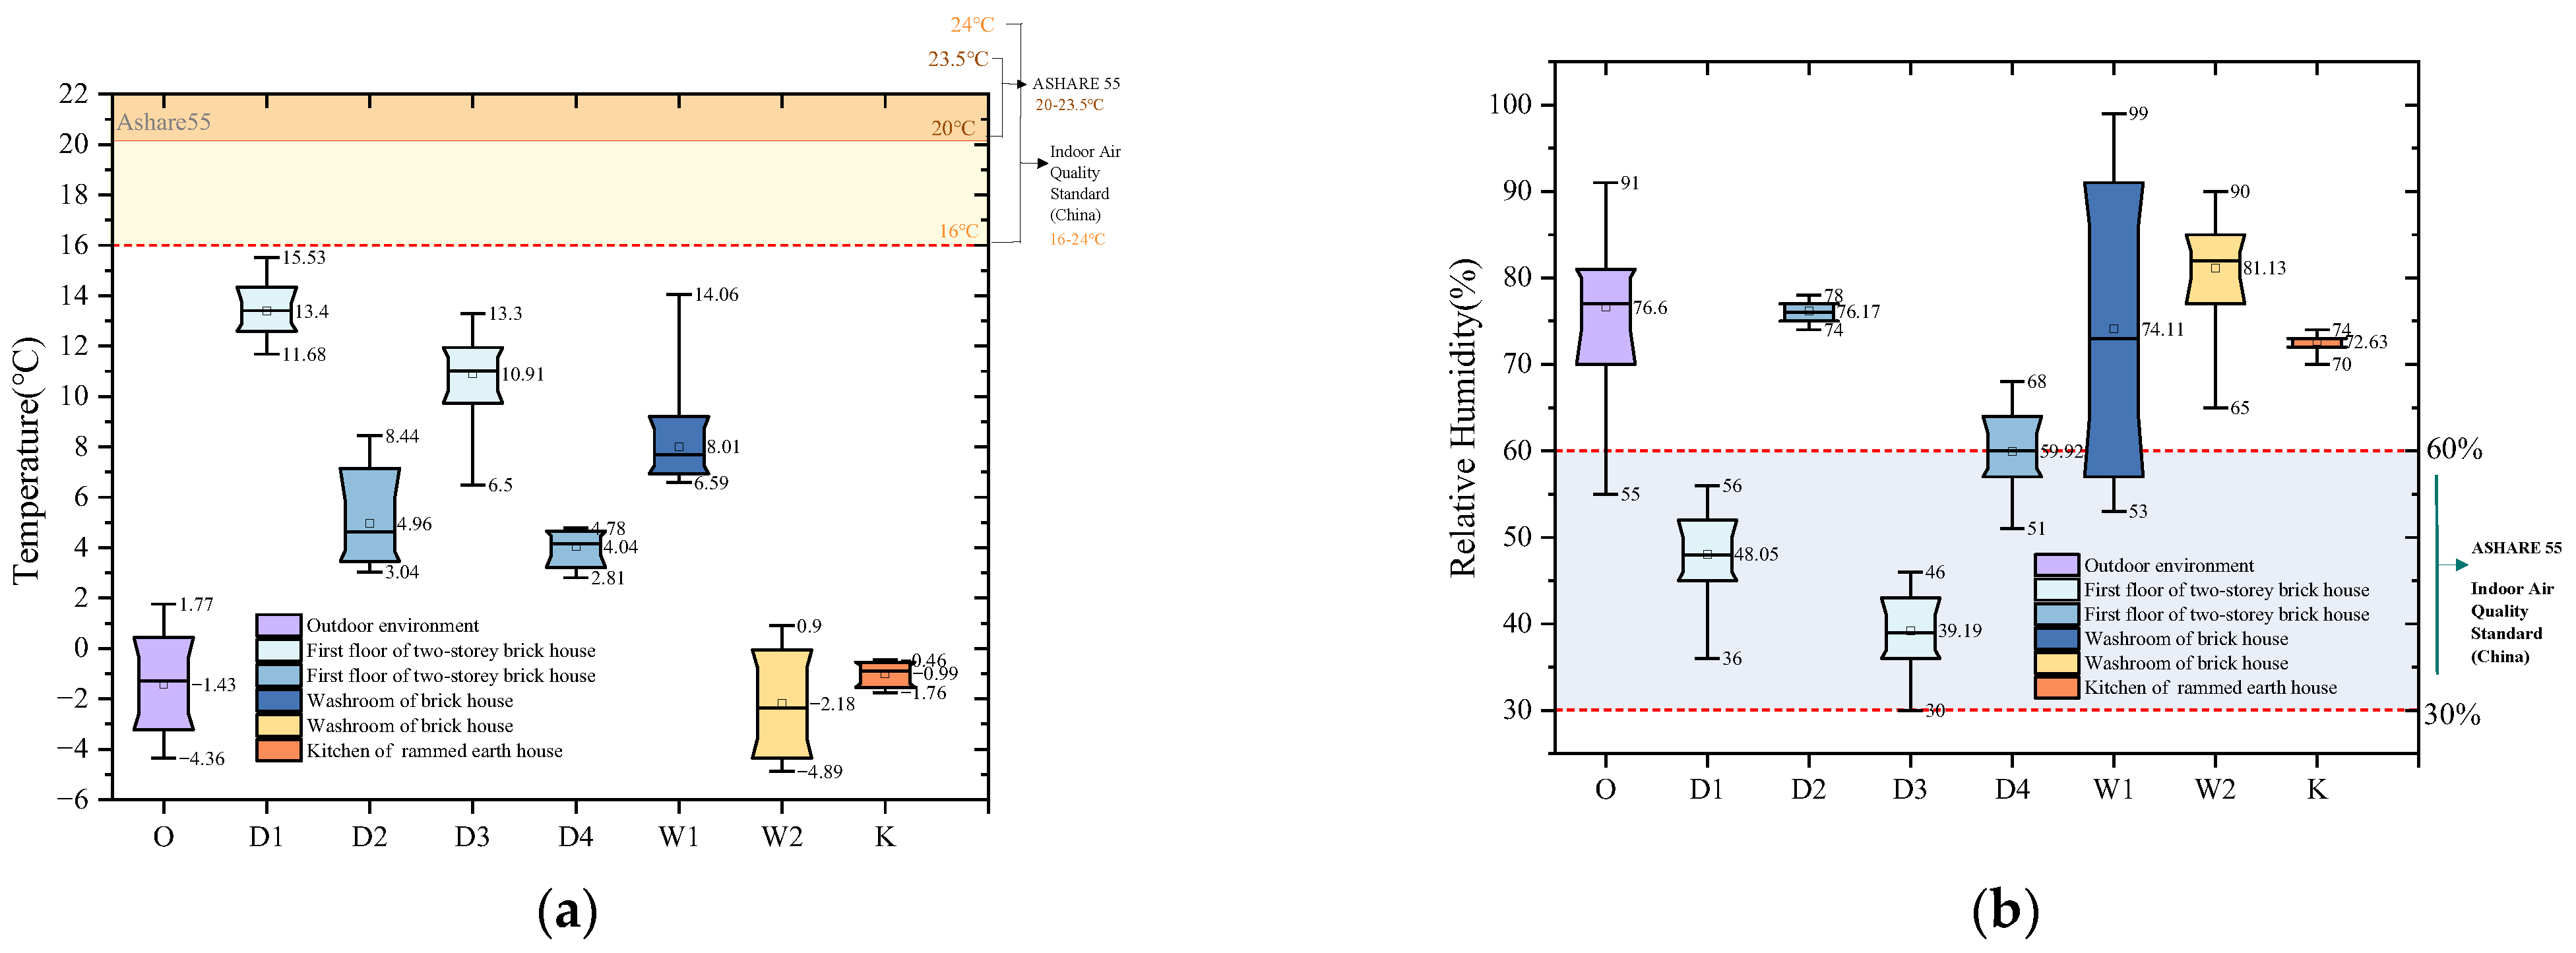
3.1. Results of the Indoor Thermal Environment Study
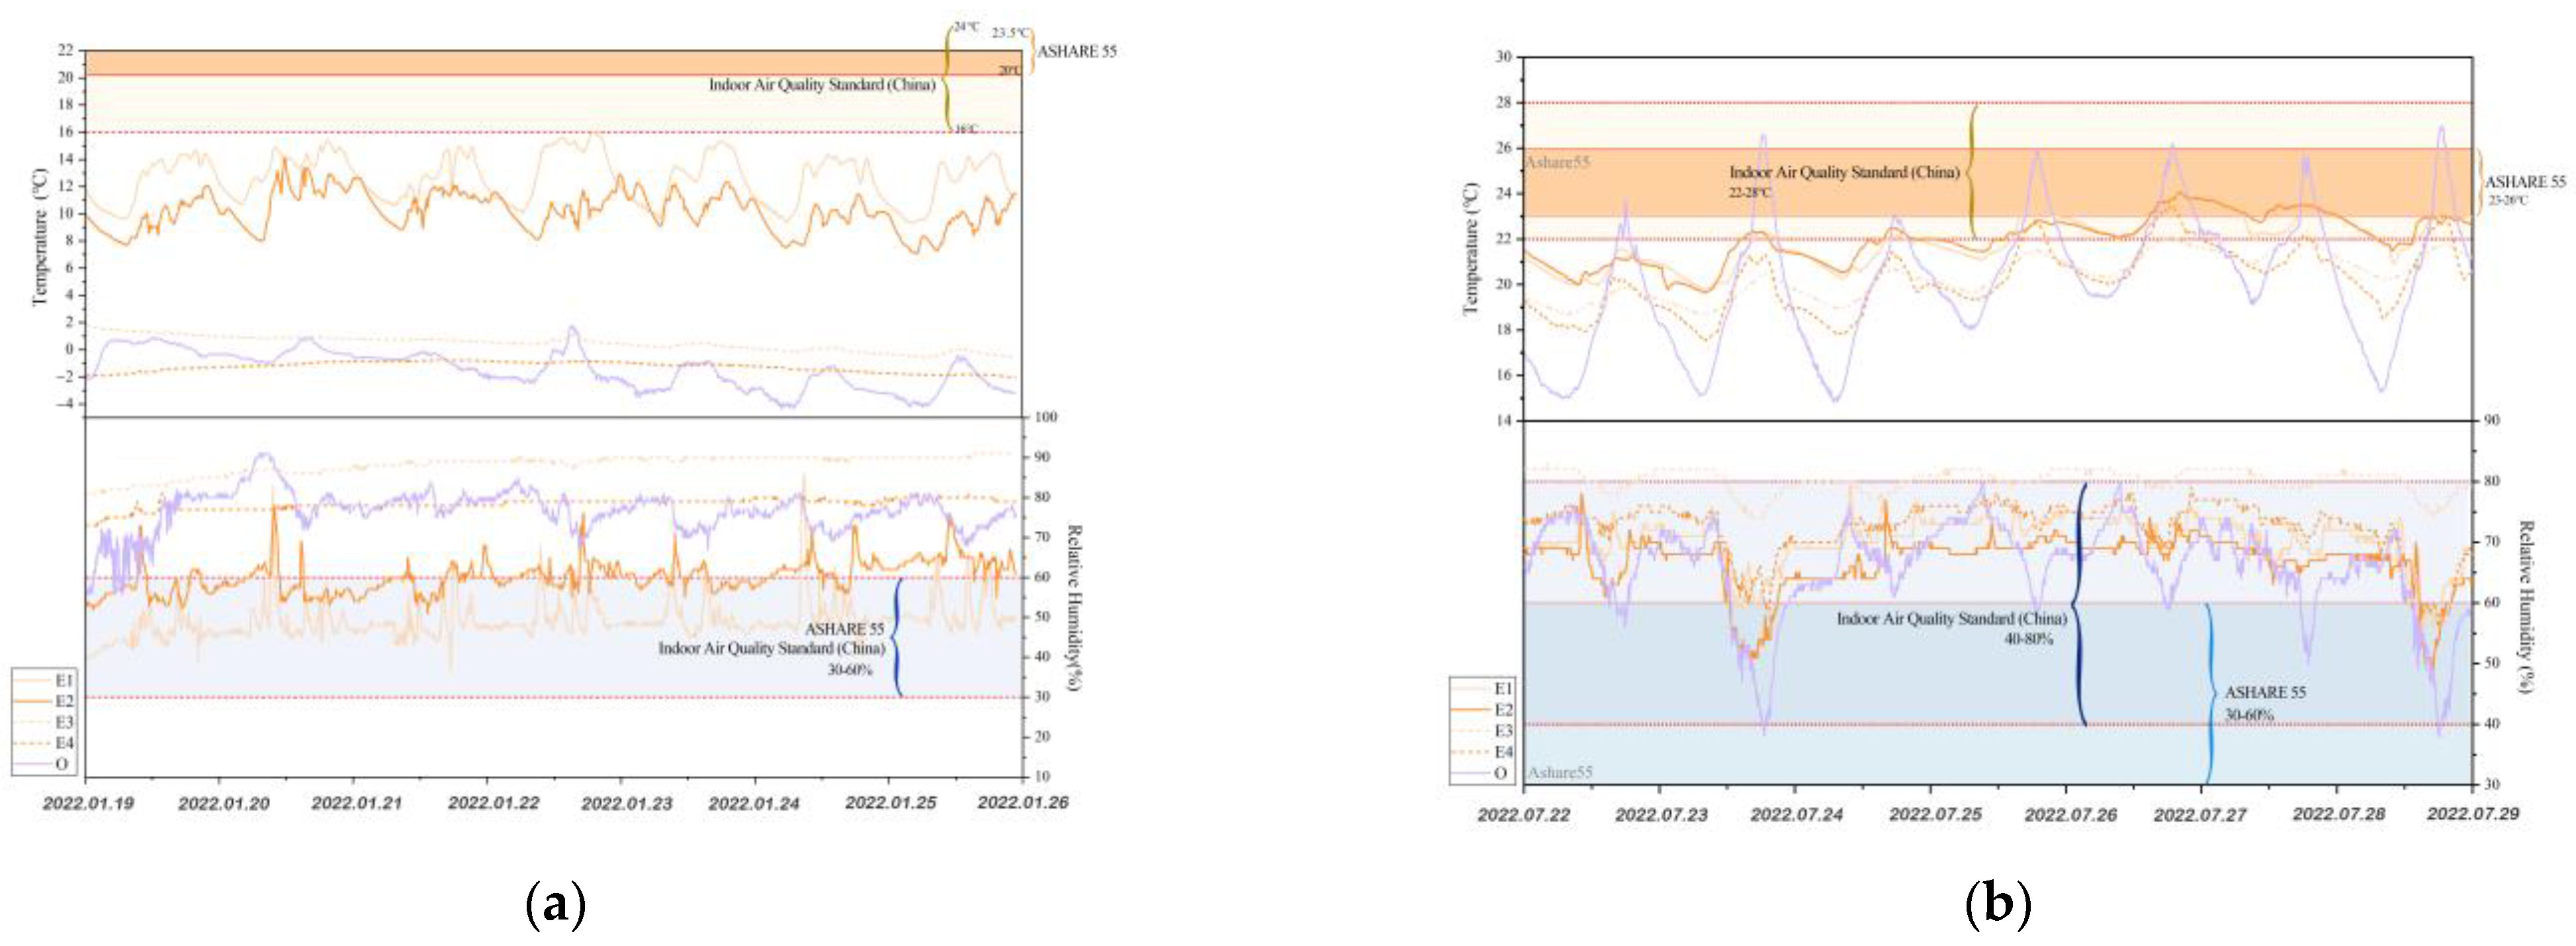
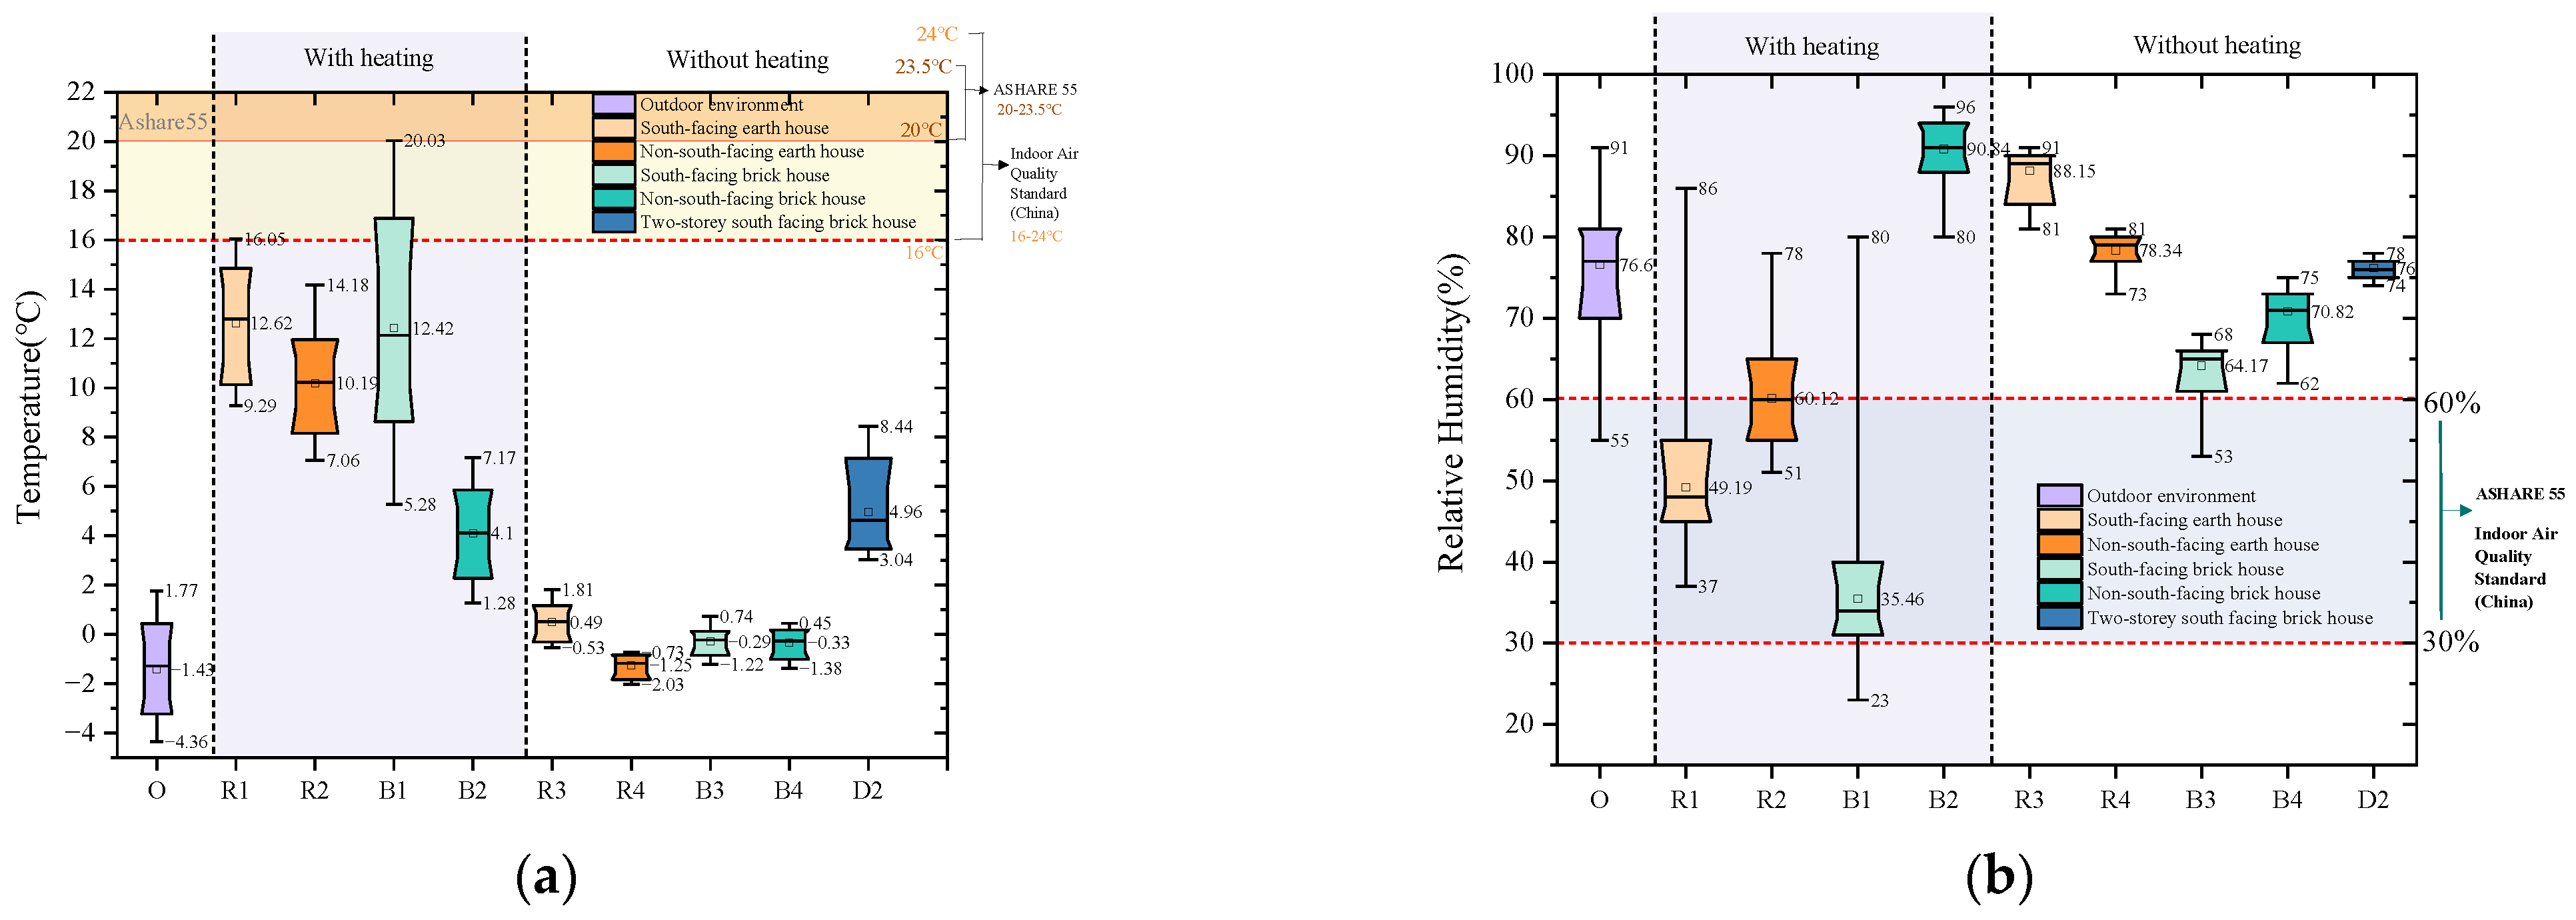
3.1.1. Temperature and Relative Humidity Performance of Earth Houses
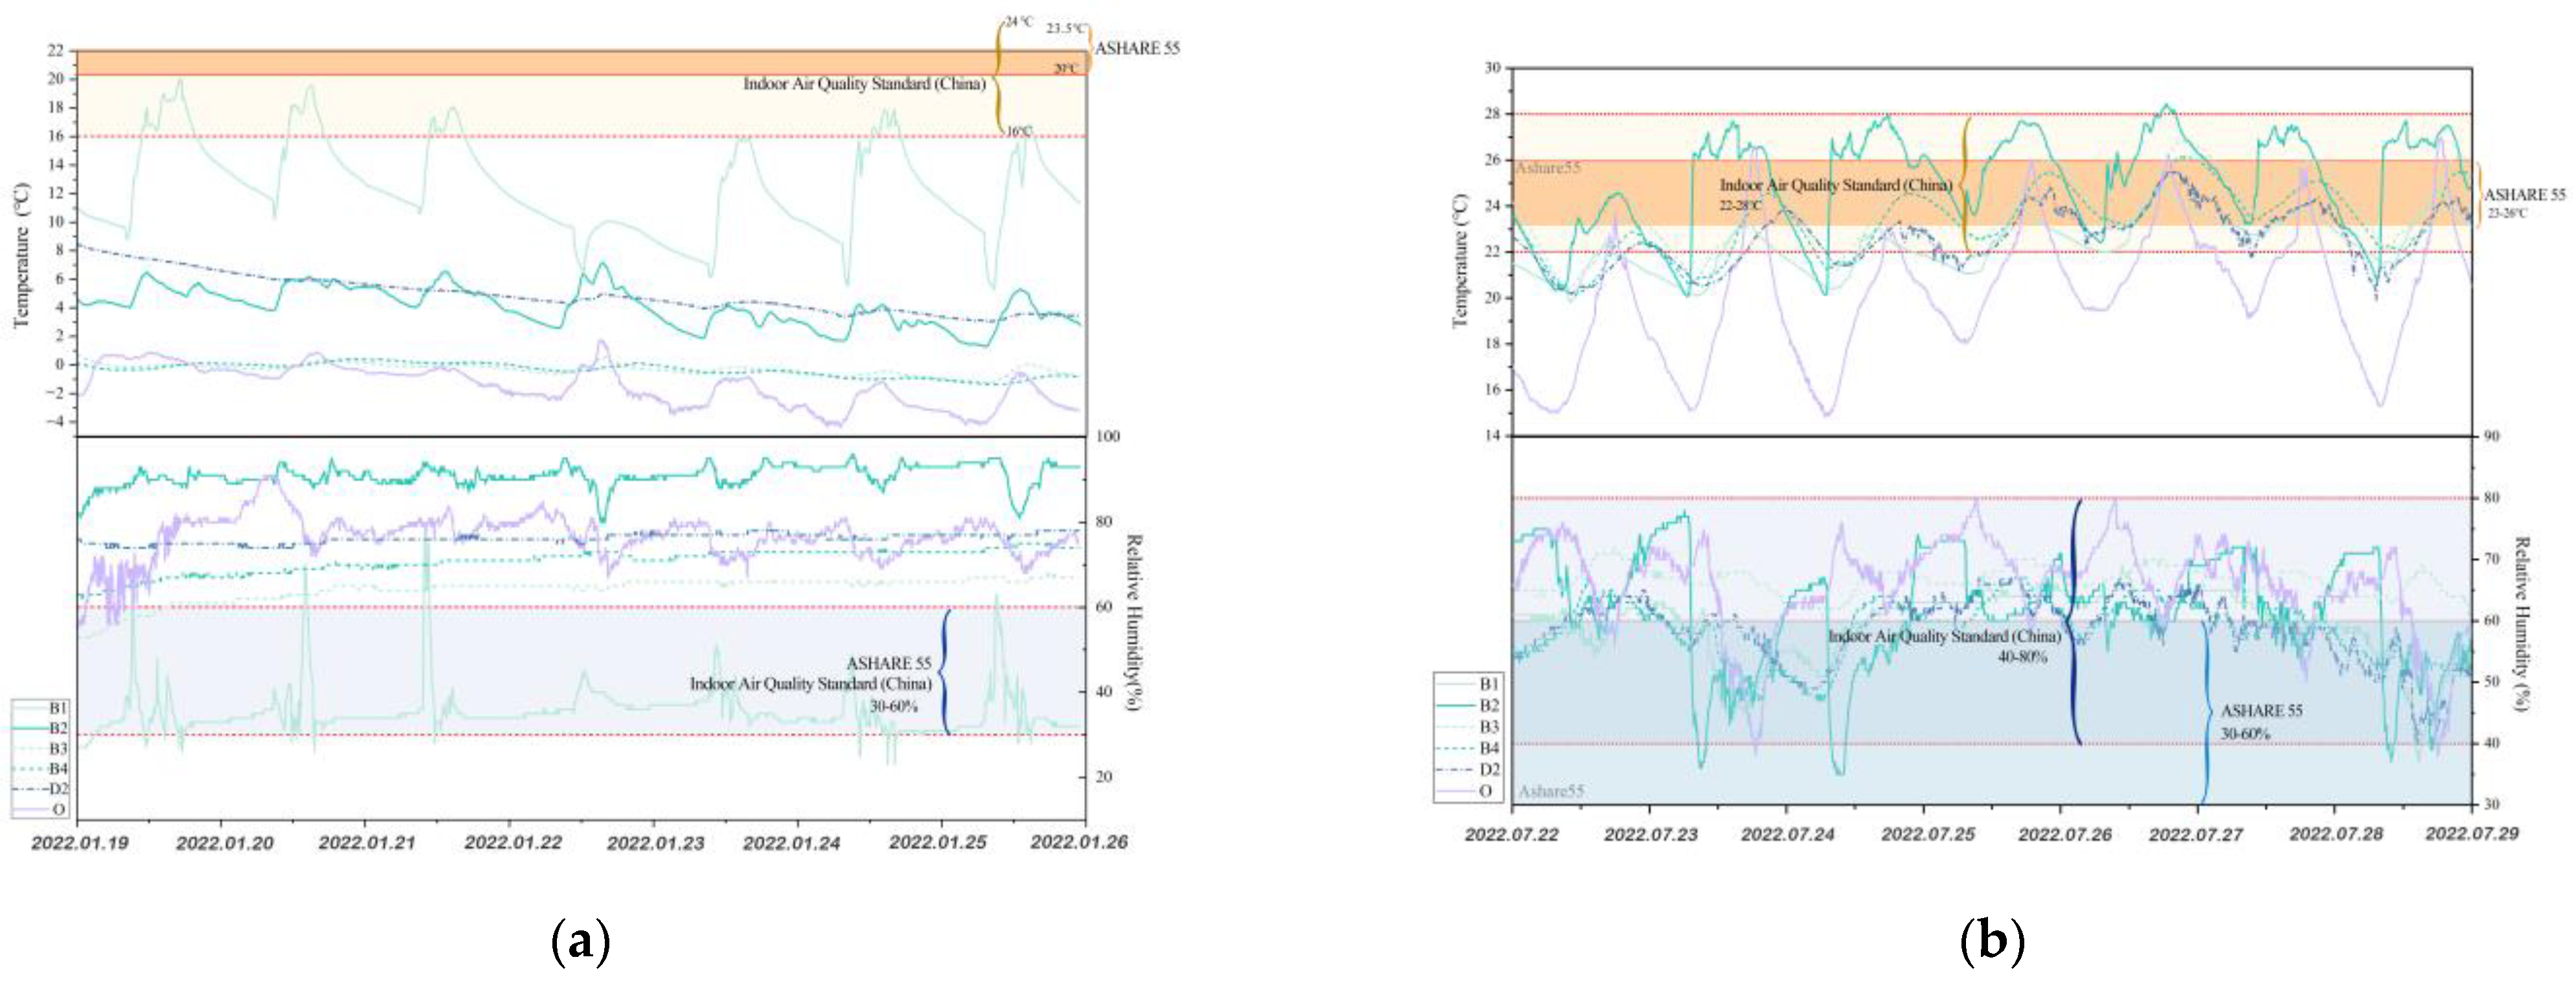
3.1.2. Temperature and Relative Humidity Performance of Brick Houses
3.2. Comparison of Two-Story Brick Houses in the Village
4. Analysis of the Causes of High Humidity in Indoor Environments in Winter
4.1. Residential Monitoring Comparison
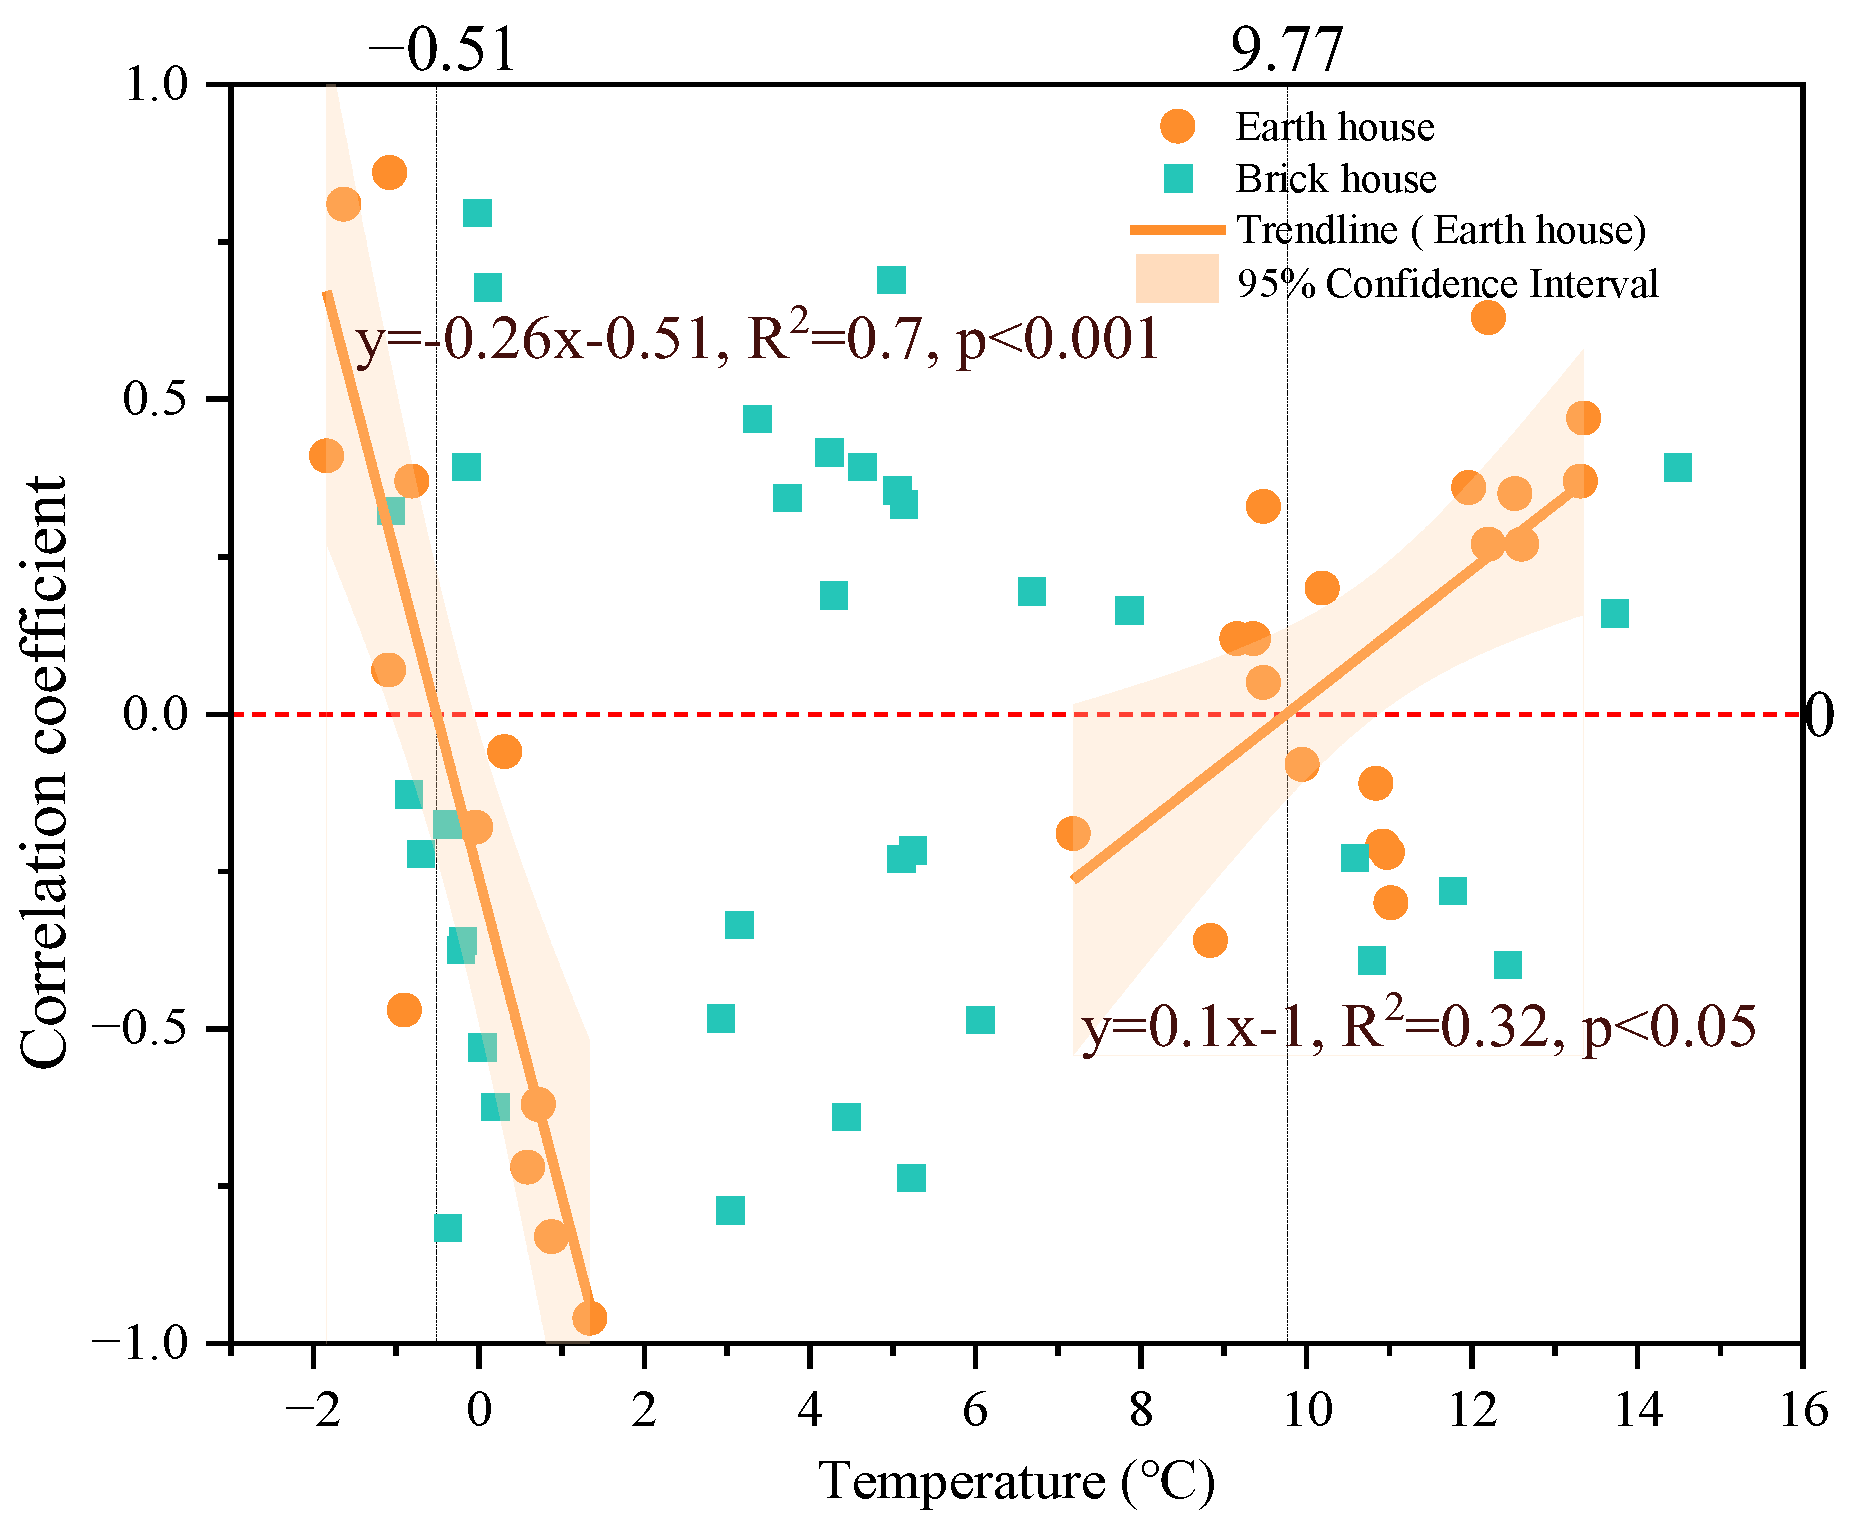
4.2. Analysis of the Correlation of the Indoor Thermal Environment in Earth Houses
5. Thermal Comfort of Residents
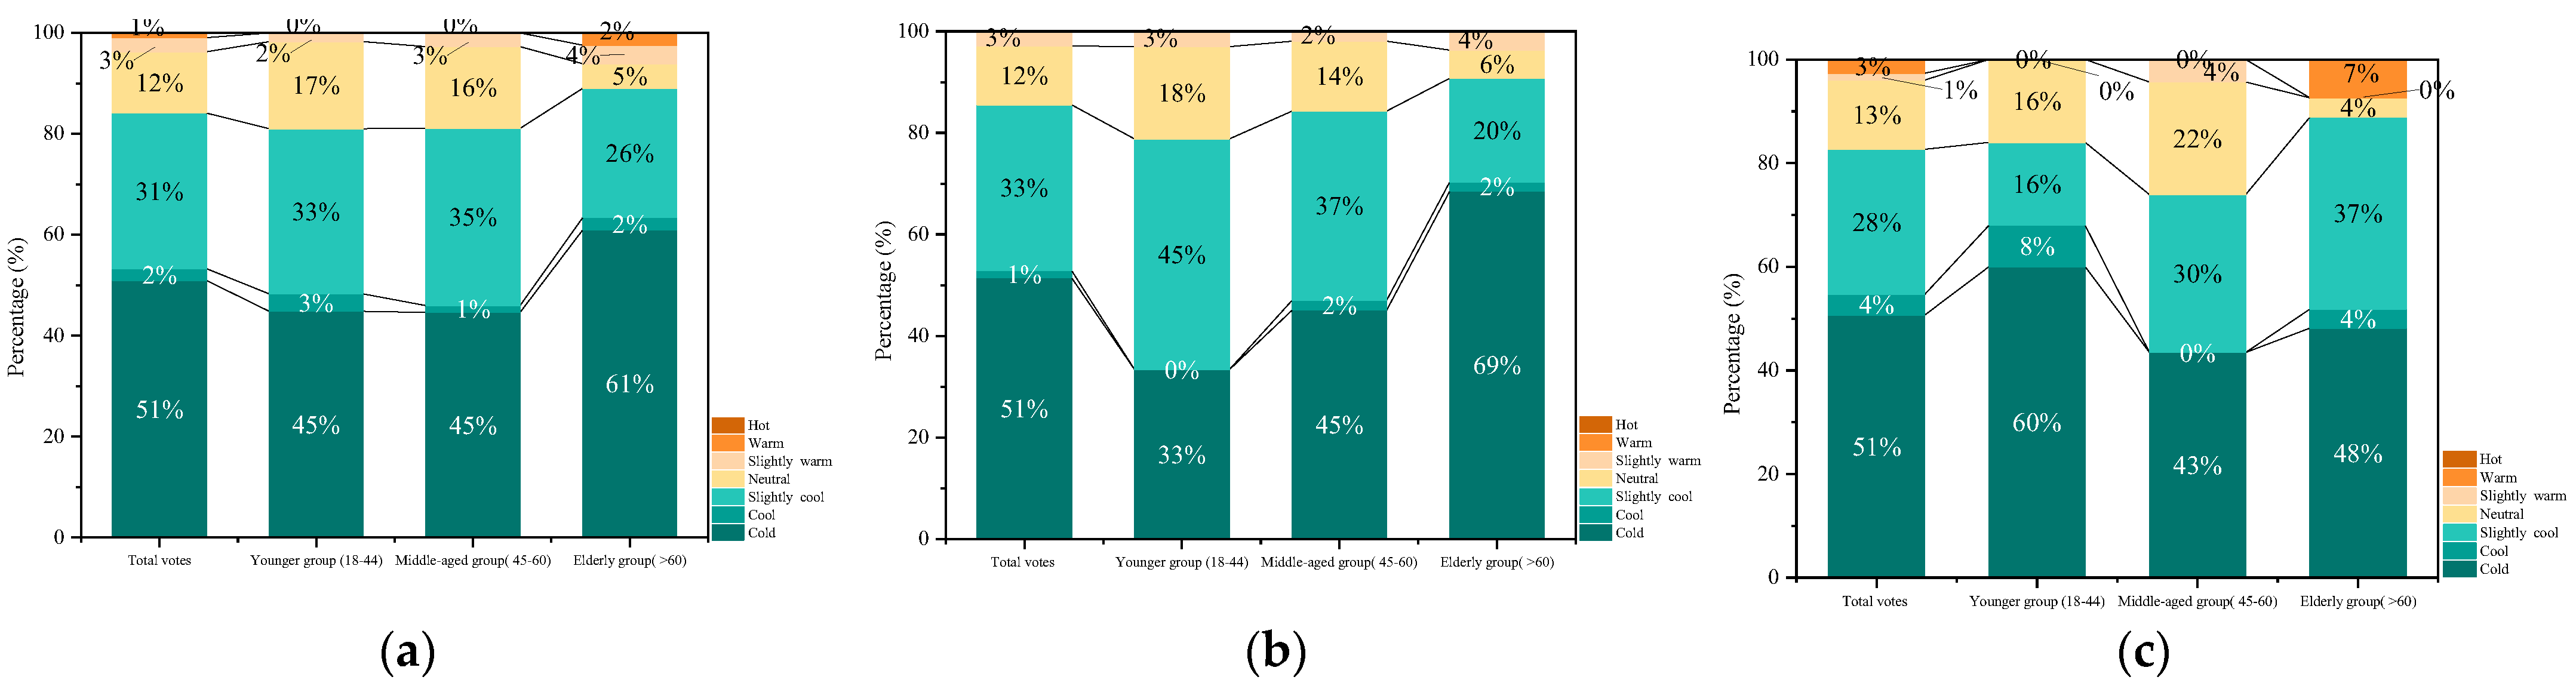
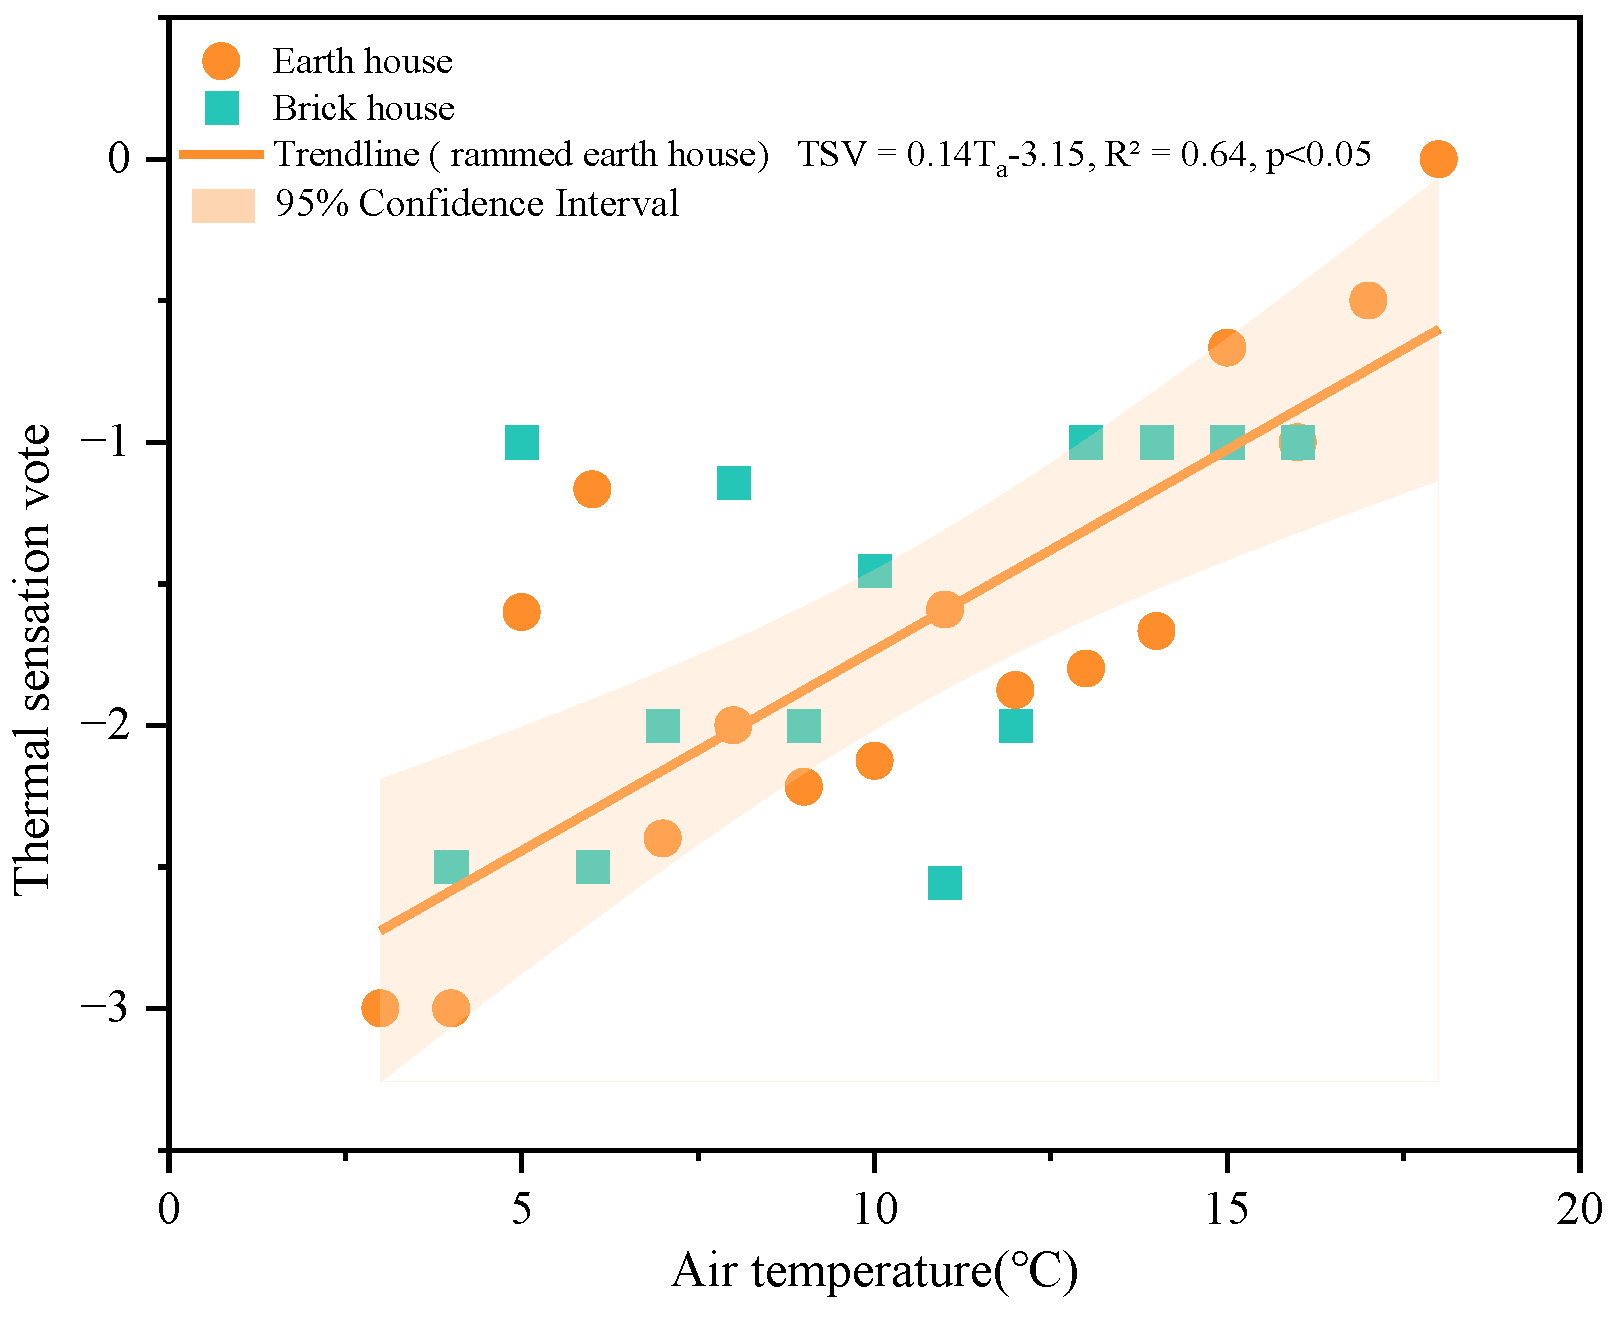
5.1. Thermal Sensation Vote (TSV) in Low-Temperature High-Humidity Indoor Environments
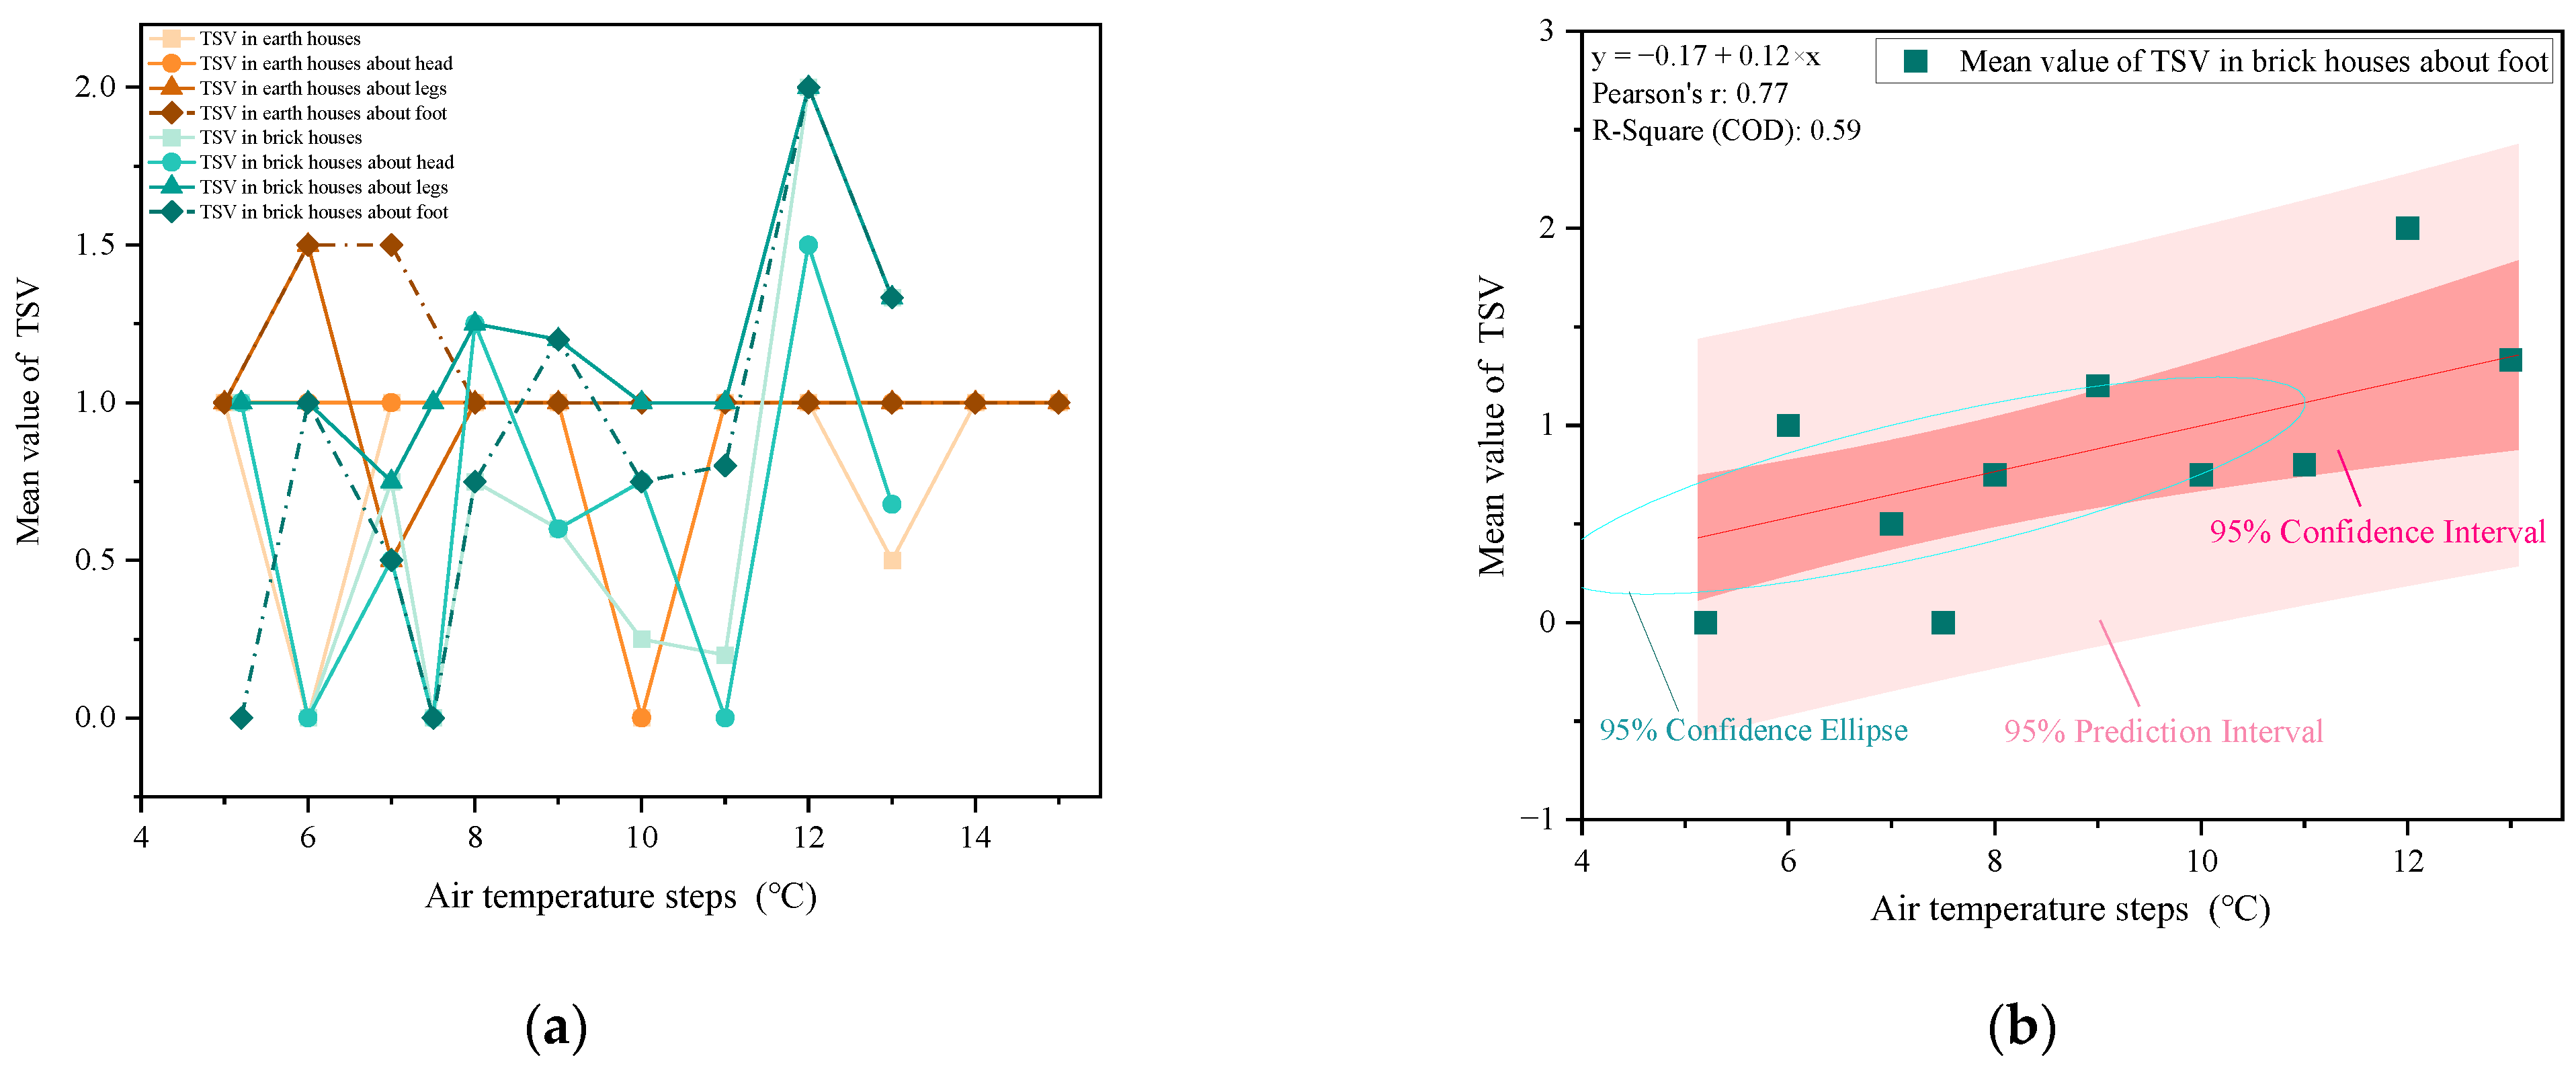
5.2. Indoor-Outdoor Temperature Steps and Thermal Comfort for Residents
6. Discussion and Limitations
7. Conclusions
Author Contributions
Funding
Institutional Review Board Statement
Informed Consent Statement
Data Availability Statement
Conflicts of Interest
Appendix A
| Designation | Age | Gender | Height (cm) | Weight (kg) | ||||
|---|---|---|---|---|---|---|---|---|
| Attire description: | ||||||||
| Predominant room type for daily habitation: | a. Earth house | b. Brick house | ||||||
| Heating method: | ||||||||
| Do you have any medical conditions? (Please specify) | ||||||||
| To what extent do you believe your physical ailments are influenced by your living environment? | No discernible effect 0 | Slightly impactful. 1 | Impactful 2 | Profoundly impactful 3 | ||||
| Do you have a habitual inclination towards consuming alcoholic beverages? | a. Yes | b. No | Has the consumption of alcoholic beverages led to any deleterious health implications? | a. Yes | b. No | |||
| Do you have a habitual inclination towards tobacco consumption? | a. Yes | b. No | Has act of tobacco inhalation led to any deleterious health implications? | a. Yes | b. No | |||
| Please assess your state of bodily health | a. Optimal physical well-being | b. Albeit with occasional illnesses. | c. Ailments impede a harmonious existence. | |||||
| In the context of winter heating, please assess the indoor air quality? | Poor quality −3 | Deficient −2 | Slightly deficient. −1 | Neutral 0 | Slightly satisfactory. 1 | Satisfactory. 2 | Good quality. 3 | |
| Overall assessment of indoor environment: | Present indoor temperature: | Current body temperature of the subject: | ||||||
| Thermal sensation vote | Cold −3 | Cool −2 | Slightly cool −1 | Neutral 0 | Slightly warm 1 | Warm 2 | Hot 3 | |
| Thermal comfort vote | Very uncomfortable −3 | Uncomfortable −2 | Just uncomfortable −1 | Just comfortable 1 | Comfortable 2 | Very comfortable 3 | ||
| Thermal acceptability vote | Very unacceptable −3 | Unacceptable −2 | Just unacceptable −1 | Just acceptable 1 | Acceptable 2 | Very acceptable 3 | ||
| Thermal sensation vote for head | Cold −3 | Cool −2 | Slightly cool −1 | Neutral 0 | Slightly warm 1 | Warm 2 | Hot 3 | |
| Thermal comfort vote for head | Very unacceptable −3 | Unacceptable −2 | Just unacceptable −1 | Just acceptable 1 | Acceptable 2 | Very acceptable 3 | ||
| Thermal sensation vote for leg | Cold −3 | Cool −2 | Slightly cool −1 | Neutral 0 | Slightly warm 1 | Warm 2 | Hot 3 | |
| Thermal comfort vote for leg | Very unacceptable −3 | Unacceptable −2 | Just unacceptable −1 | Just acceptable 1 | Acceptable 2 | Very acceptable 3 | ||
| Thermal sensation vote for foot | Cold −3 | Cool −2 | Slightly cool −1 | Neutral 0 | Slightly warm 1 | Warm 2 | Hot 3 | |
| Thermal comfort vote for foot | Very unacceptable −3 | Unacceptable −2 | Just unacceptable −1 | Just acceptable 1 | Acceptable 2 | Very acceptable 3 | ||
| Evaluate the overall level of humidity in the current environment | Very dry −3 | Dry −2 | Just dry −1 | Neutral 0 | Just humid 1 | Humid 2 | Very humid 3 | |
| Evaluate the level of air freshness in the environment | Very stuffy −3 | Stuffy −2 | Just stuffy −1 | Neutral 0 | Just fresh 1 | Fresh 2 | Very fresh 3 | |
| Overall assessment of outdoor environment: | Present indoor temperature: | Current body temperature of the subject: | ||||||
| Thermal sensation vote | Cold −3 | Cool −2 | Slightly cool −1 | Neutral 0 | Slightly warm 1 | Warm 2 | Hot 3 | |
| Thermal sensation vote for head | Cold −3 | Cool −2 | Slightly cool −1 | Neutral 0 | Slightly warm 1 | Warm 2 | Hot 3 | |
| Thermal comfort vote for head | Very unacceptable −3 | Unacceptable −2 | Just unacceptable −1 | Just acceptable 1 | Acceptable 2 | Very acceptable 3 | ||
| Thermal sensation vote for leg | Cold −3 | Cool −2 | Slightly cool −1 | Neutral 0 | Slightly warm 1 | Warm 2 | Hot 3 | |
| Thermal comfort vote for leg | Very unacceptable −3 | Unacceptable −2 | Just unacceptable −1 | Just acceptable 1 | Acceptable 2 | Very acceptable 3 | ||
| Thermal sensation vote for foot | Cold −3 | Cool −2 | Slightly cool −1 | Neutral 0 | Slightly warm 1 | Warm 2 | Hot 3 | |
| Thermal comfort vote for foot | Very unacceptable −3 | Unacceptable −2 | Just unacceptable −1 | Just acceptable 1 | Acceptable 2 | Very acceptable 3 | ||
References
- Hoxha, E.; Passer, A.; Mendes Saade, M.; Trigaux, D.; Shuttleworth, A.; Pittau, F.; Allacker, K.; Habert, G.J.B. Biogenic carbon in buildings: A critical overview of LCA methods. Build. Cities 2020, 1, 504–524. [Google Scholar] [CrossRef]
- U.S. Energy Information Administration; International Energy Statistics; International Energy Agency. World Energy Outlook; 2021; Volume 2021, p. 314. Available online: https://www.iea.org/countries/china (accessed on 29 September 2023).
- Building Energy Research Center, Tsinghua University. 2020 Report Annual Report on China Building Energy Efficiency; China Architecture & Building Press: Beijing, China, 2020. (In Chinese) [Google Scholar]
- National Bureau of Statistics of the People’s Republic of China. 2021 China Statistical Yearbook; China Statistics Press: Beijing, China, 2021. (In Chinese) [Google Scholar]
- Gao, Y.; Gao, Z.; Ban, H.; Liu, W.; Lv, M.; Li, H.; Yu, Z.; Yuan, T.; Qu, K.; Sun, C. Construction plan and implementation effectiveness of clean heating in a northern city in winter. Constr. Sci. Technol. 2020, 2, 50–54. (In Chinese) [Google Scholar]
- Zhuang, Z.; Li, Y.; Chen, B.; Guo, J. Chinese kang as a domestic heating system in rural northern China—A review. Energy Build. 2009, 41, 111–119. [Google Scholar] [CrossRef]
- Shan, M.; Wang, P.; Li, J.; Yue, G.; Yang, X. Energy and environment in Chinese rural buildings: Situations, challenges, and intervention strategies. Build. Environ. 2015, 91, 271–282. [Google Scholar] [CrossRef]
- Zhu, Y. China Energy News, Urgent Task of “Greening” Rural Energy Systems; People’s Daily Press: Beijing, China, 2021; (In Chinese). [Google Scholar] [CrossRef]
- He, X.; Zhou, G.; Ma, Y.; Li, L.; Fu, S.; Liu, S.; Liu, C.; He, Y.; Su, Z.; Liu, J.J.B.; et al. Winter vacation, indoor air pollution and respiratory health among rural college students: A case study in Gansu Province, China. Build. Environ. 2021, 188, 107481. [Google Scholar] [CrossRef]
- Zhang, J.; Xu, W.; Li, A.; Zheng, K.; Zhang, J. Modified method for evaluating improved technologies for indoor thermal environment of earth buildings. Build. Environ. 2018, 144, 673–681. [Google Scholar] [CrossRef]
- Wang, Z.; Cao, B.; Lin, B.; Zhu, Y.J.E. Investigation of thermal comfort and behavioral adjustments of older people in residential environments in Beijing. Energy Build. 2020, 217, 110001. [Google Scholar] [CrossRef]
- Wang, H.; Shi, C.; Li, W.; Wang, L.; Wang, J.; Wang, G.; Hu, S. Field investigation on thermal environment and comfort of people in a coastal village of Qingdao (China) during winter. Build. Environ. 2021, 191, 107585. [Google Scholar] [CrossRef]
- Gui, X.G. Study on the Characteristics of the Red Layer and Zoning of Danxia Landform in Gansu. Master’s Thesis, Lanzhou University, Lanzhou, China, 2019. (In Chinese). [Google Scholar]
- Zhang, X.Q.; Wang, J.M.; Zhao, X.P. Research on the ridge decoration of traditional buildings in the Tianshui area. Shanxi Archit. 2008, 5, 21–22. (In Chinese) [Google Scholar]
- Meng, X.W.; Ye, M.H.; Shi, H.R.; Yan, Y.F. Research on The Adobe Wall of Traditional Civil Structure Dwelling in Tianshui & Guanzhong. Adv. Mater. Res. 2012, 535, 1759–1762. [Google Scholar] [CrossRef]
- Meng, X.W.; Ye, M.H.; Shi, H.R. Study on the architectural ideas of environmental adaptability of traditional residential houses in Guantian region. Small Town Constr. 2012, 11, 100–104. (In Chinese) [Google Scholar]
- An, Z.N. Classification and application of loess wetness class in Tianshui area. J. Lanzhou Coll. Arts Sci. (Nat. Sci. Ed.) 2017, 31, 34–39. (In Chinese) [Google Scholar]
- Zhang, Q.; Shi, J.Y. Investigation and optimization of thermal environment of rural residential buildings in Tianshui area. J. Xi’an Univ. Sci. Technol. 2017, 37, 552–558. (In Chinese) [Google Scholar]
- Luo, J. Research on traditional earth building form zoning and construction techniques in Gansu area. Master’s Thesis, Lanzhou University, Lanzhou, China, 2019. (In Chinese). [Google Scholar]
- Jiang, B.; Wu, T.; Xia, W.; Liang, J. Hygrothermal performance of rammed earth wall in Tibetan Autonomous Prefecture in Sichuan Province of China. Build. Environ. 2020, 181, 107128. [Google Scholar] [CrossRef]
- Charai, M.; Mezrhab, A.; Moga, L. A structural wall incorporating biosourced earth for summer thermal comfort improvement: Hygrothermal characterization and building simulation using calibrated PMV-PPD model. Build. Environ. 2022, 212, 108842. [Google Scholar] [CrossRef]
- ISO 7726; Ergonomics of the Thermal Environment-Instruments for Measuring Physical Quantities. International Organization for Standardization: Geneva, Switzerland, 1998.
- JGJ/T 347; Standard of Test Methods for Thermal Environment of Building. Ministry of Housing and Urban-Rural Development of the People’s Republic of China. China Architecture & Building Press: Beijing, China, 2014.
- World Health Organization. International Health Regulations (2005); World Health Organization: Geneva, Switzerland, 2008. [Google Scholar]
- ANSI/ASHRAE/IES Guideline 29-2019; Guideline for the Risk Management of Public Health and Safety in Buildings. Refrigerating and Air Conditioning Engineers, Ventilation. American Society of Heating: Atlanta, GA, USA, 2019.
- International WELL Building Institute. “WELL v2™”. 2018. Available online: https://v2.wellcertified.com/cn/v/community/feature/1 (accessed on 29 September 2023).
- ANSI/ASHRAE, 55 5; Thermal Environmental Conditions for Human Occupancy. Refrigerating and Air Conditioning Engineers. American Society of Heating: Atlanta, GA, USA, 1992.
- GB/T 18883-2022; Indoor Air Quality Standard. Ministry of Environmental Protection of the People’s Republic of China: Beijing, China, 2022. (In Chinese)
- Yin, W.; Zhang, G.; Yang, W.; Wang, X. Natural ventilation potential model considering solution multiplicity, window opening percentage, air velocity and humidity in China. Build. Environ. 2010, 45, 338–344. [Google Scholar] [CrossRef]
- Wang, Z.; Yu, H.; Jiao, Y.; Chu, X.; Luo, M. Chinese older people’s subjective and physiological responses to moderate cold and warm temperature steps. Build. Environ. 2019, 149, 526–536. [Google Scholar] [CrossRef]
- Wu, J.; Sun, B.; Hu, Z.; Li, L.; Zhu, H. Physiological responses and thermal sensation during extremely cold exposure (−20 °C). Build. Environ. 2021, 206, 108338. [Google Scholar] [CrossRef]
- Hu, S.; He, M.; Zhang, X.; Guan, H.; Song, P.; Liu, R.; Liu, G. Cold and hot step-changes affecting thermal comfort and physiological indicators in winter. Energy Build. 2022, 254, 111587. [Google Scholar] [CrossRef]
- Yan, Z.F.; Liu, J.P.; Wang, R.S. Experimental Study on the Isothermal Hygroscopic Properties of Soil Envelopes. J. Xi’an Univ. Archit. Technol. (Nat. Sci. Ed.) 2003, 4, 347–349+353. (In Chinese) [Google Scholar]
- Yan, Z.F.; Zhao, J.Y.; Liu, G.P. Experimental study of moisture moisture buffering ability processes on the surface of earth building envelope. J. Chang. Univ. (Build. Environ. Sci. Ed.) 2003, 4, 16–19. (In Chinese) [Google Scholar]
- ANSI/ASHRAE/IES Standard 55-2020; Thermal Environmental Conditions for Human Occupancy. Refrigerating and Air Conditioning Engineers. American Society of Heating: Atlanta, GA, USA, 2020.
- Liu, H.; Liao, J.; Yang, D.; Du, X.; Hu, P.; Yang, Y.; Li, B. The response of human thermal perception and skin temperature to step-change transient thermal environments. Build. Environ. 2014, 73, 232–238. [Google Scholar] [CrossRef]
- Nardin, R.A.; Fogerson, P.M.; Nie, R.; Rutkove, S.B. Foot temperature in healthy individuals: Effects of ambient temperature and age. J. Am. Podiatr. Med. Assoc. 2010, 100, 258–264. [Google Scholar] [CrossRef] [PubMed]
- Arens, E.; Zhang, H.; Huizenga, C. Partial-and whole-body thermal sensation and comfort—Part II: Non-uniform environmental conditions. J. Therm. Biol. 2006, 31, 60–66. [Google Scholar] [CrossRef]
- Nakamura, M.; Yoda, T.; Crawshaw, L.I.; Yasuhara, S.; Saito, Y.; Kasuga, M.; Nagashima, K.; Kanosue, K. Regional differences in temperature sensation and thermal comfort in humans. J. Appl. Physiol. 2008, 105, 1897–1906. [Google Scholar] [CrossRef] [PubMed]
- Leppaluoto, J.; Korhonen, I.; Hassi, J. Habituation of thermal sensations, skin temperatures, and norepinephrine in men exposed to cold air. J. Appl. Physiol. 2001, 90, 1211–1218. [Google Scholar] [CrossRef] [PubMed]
- Chen, C.-P.; Hwang, R.-L.; Chang, S.-Y.; Lu, Y.-T. Effects of temperature steps on human skin physiology and thermal sensation response. Build. Environ. 2011, 46, 2387–2397. [Google Scholar] [CrossRef]
- Halonen, J.I.; Zanobetti, A.; Sparrow, D.; Vokonas, P.S.; Schwartz, J. Relationship between outdoor temperature and blood pressure. Occup. Environ. Med. 2011, 68, 296–301. [Google Scholar] [CrossRef]
- Xiong, J.; Lian, Z.; Zhou, X.; You, J.; Lin, Y. Potential indicators for the effect of temperature steps on human health and thermal comfort. Energy Build. 2016, 113, 87–98. [Google Scholar] [CrossRef]
- Murakawa, S.; Sekine, T.; Narita, K.-I.; Nishina, D. Study of the effects of a river on the thermal environment in an urban area. Energy Build. 1991, 16, 993–1001. [Google Scholar] [CrossRef]
- Tan, X.; Sun, X.; Huang, C.; Yuan, Y.; Hou, D. Comparison of cooling effect between green space and water body. Sustain. Cities Soc. 2021, 67, 102711. [Google Scholar] [CrossRef]
- Yang, L.; Liu, X.; Qian, F. Research on water thermal effect on surrounding environment in summer. Energy Build. 2020, 207, 109613. [Google Scholar] [CrossRef]
- Jin, H.; Shao, T.; Zhang, R. Effect of water body forms on microclimate of residential district. Energy Procedia 2017, 134, 256–265. [Google Scholar] [CrossRef]
- Dai, X.; Liu, J.; Li, X.; Zhao, L. Long-term monitoring of indoor CO2 and PM2.5 in Chinese homes: Concentrations and their relationships with outdoor environments. Build. Environ. 2018, 144, 238–247. [Google Scholar] [CrossRef]
- Lovec, V.B.; Jovanović-Popović, M.Đ.; Živković, B.D. The thermal behavior of rammed earth wall in traditional house in Vojvodina: Thermal mass as a key element for thermal comfort. Therm. Sci. 2018, 22 (Suppl. S4), 1143–1155. [Google Scholar] [CrossRef]
- Taouirte, Y.; Tiffonnet, A.L.; Marion, M.; Louahlia, H.; El Alami, M.; Gounni, A.; Lépinasse, E.; Voicu, I. Effect of Temperature on Moisture Migration in Earth and Fiber Mixtures for Cob Materials. Energies 2023, 16, 5526. [Google Scholar] [CrossRef]
- Wu, T. Research on the Thermal and Moisture Performance of Passive Moisture-Regulating Earthen Structural Walls in Northwest Sichuan. Master’s Thesis, Southwest University of Science and Technology, Sichuan, China, 2019. (In Chinese). [Google Scholar]
- Choi, Y.; Lim, Y.; Kim, J.; Song, D. Why does a high humidity level form in low-income households despite low water vapor generation? Sustainability 2020, 12, 7563. [Google Scholar] [CrossRef]
- Rupp, R.F.; Vásquez, N.G.; Lamberts, R. A review of human thermal comfort in the built environment. Energy Build. 2015, 105, 178–205. [Google Scholar] [CrossRef]


| Equipment Model | Measurement Data and Units | Measurement Range | Measurement Accuracy | t/min |
|---|---|---|---|---|
| Ubibot GS1 AL4G1RS | Temperature (°C) | −20 °C–60 °C | ±0.3 °C | 5 |
| Relative Humidity (%) | 10–90% | ±3%RH | 5 | |
| Light (lux) | 0.01 to 83K lux | 2% | 5 | |
| RS485 CO2 sensor | Carbon dioxide concentration (ppm) (0–50 °C, 0–95% RH) | 0~10,000 ppm | ±(30 ppm + 3%F.S) | 5 |
| Phase | Mapping Location | Sample Photo | Instrument Placement | Number of People Using the Room | Room Size/m2 | Duration of Use/Years | House No. |
|---|---|---|---|---|---|---|---|
| Phase 1 | Earth house | 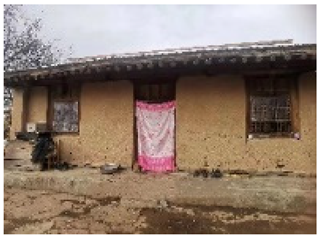 | South-facing room with heating | 6 | 16 | 23 | E1 |
| Non-south-facing room with heating | 4 | 14 | 23 | E2 | |||
| South-facing room without heating | 3 | 11 | 30 | E3 | |||
| Non-south-facing room without heating | 7 | 15 | 40 | E4 | |||
| Brick house | South-facing room with heating | 10 | 21 | 4 | B1 | ||
| Non-south-facing room with heating | 4 | 26 | 5 | B2 | |||
| South-facing room without heating | 4 | 21 | 5 | B3 | |||
| Non-south-facing room without heating | 4 | 18 | 5 | B4 | |||
| Two-story brick house |  | 1st floor south-facing room with heating | 6 | 24 | 2 | D1 | |
| 2nd floor south-facing room without heating | 0 | 15 | 2 | D2 | |||
| New two-story house | 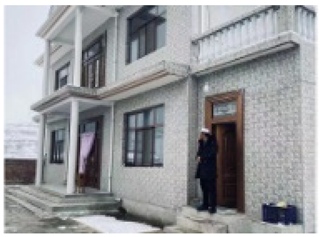 | 1st floor south-facing room with heating | 3 | 26 | 3 | D3 | |
| 2nd floor south-facing room without heating | 3 | 22 | 3 | D4 | |||
| Indoor washroom | 3 | 3 | W1 | ||||
| Washroom (outdoor toilet) | Hanging against the wall | 2 | 23 | W2 | |||
| Kitchen | Kitchen in a earth house | 5 | 30 | K | |||
| O | |||||||
| Phase 2 | Earth house | 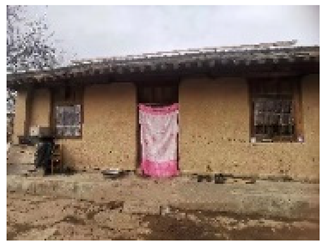 | South-facing room with heating | 4 | 23 | 10 | EE1 |
| 6 | 16 | 23 | EE2 | ||||
| 4 | 20 | 23 | EE3 | ||||
| Non-south-facing room with heating | 3 | 18 | 20 | EE4 | |||
| 6 | 26 | 30 | EE5 | ||||
| 1 | 30 | 32 | EE6 | ||||
| Brick house | 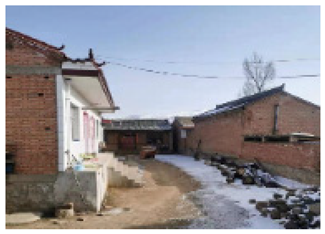 | South-facing room with heating | 3 | 20 | 6 | BB1 | |
| 7 | 28 | 6 | BB2 | ||||
| 4 | 24 | 10 | BB3 | ||||
| Non-south-facing room with heating | 2 | 23 | 14 | BB4 | |||
| 5 | 12 | 7 | BB5 | ||||
| 6 | 26 | 3 | BB6 | ||||
| Outdoor | OO | ||||||
| International Health Regulations [24] | ASHARE Guideline 29-2019 [25] | WELL V2 Standard [26] | Circumstances of Houses within This Study | |
|---|---|---|---|---|
| Guideline for the Risk Management of Public Health and Safety in Buildings | Type | Content | ||
| This regulation does not encompass provisions regarding the hygiene conditions of residential buildings, but it places greater emphasis on the requirements for facilities within public buildings. | The requirements for the indoor environment of buildings in this standard are unclear. Specific requirements for building envelopes should be established to regulate energy transfer and minimize air and vapor transportation. Additionally, it is recommended to provide emergency and energy storage systems. | Air | In the Fundamental Air Quality section, it is mentioned that projects must ensure the provision of air quality levels deemed acceptable by public health authorities. In the section dedicated to Implementing Demand-Controlled Ventilation, it is specified that the indoor carbon dioxide concentration must be below 900 ppm in order to fall within the scoring range. | Those houses rely on coal stoves and heated brick beds for warming purposes, resulting in significant air pollution. This heating methodology deviates from the standards of healthy constructions. During the monitoring process, it was observed that the local heated rooms suffer from poor ventilation, leading to elevated levels of carbon dioxide. The CO2 content in all the monitored heated rooms exceeded 900 ppm. This represents an average increase of over 300 ppm compared to the outdoor carbon dioxide concentration. |
| Nourishment | This endeavor necessitates the accessibility of an assortment of fruits and vegetables, while emphasizing the importance of transparency in terms of nutritional value. | In the rural areas of China, it is possible to cultivate all kinds of vegetables and other food products for personal consumption, ensuring freshness and promoting health. But according to surveys, local residents have a habit of consuming pickled vegetables. | ||
| Light | Regarding the stipulations applicable to residential premises, it is mandated that the extent of transparent envelope glazing shall not be lesser than 7% of the total floor area. | The local area experiences strong sunlight radiation, and the selected building windows have an average transparency of around 0.3, which generally meets the requirements. | ||
| Movement | As per the provisions of this regulation, it is mandated that both the community and the interior of buildings allocate facilities for physical exercise, further necessitating the engagement of residents in regular physical activities. | Under the impetus of the government, the rural areas of the region have all been equipped with fitness apparatus. But their households lack the requisite infrastructure for fitness facilities. | ||
| Thermal Comfort | In the Thermal Comfort Monitors section, it mandates the installation of a sensor on each floor at a minimum frequency of one per 325 square meters, with a placement distance of no less than 1 m from the primary heat or cold source. | The placement positions of the instruments in this study all adhere to the specified criteria. | ||
| In the Humidity Control section, It stipulates that the relative humidity in primary occupancy areas should be regulated within the range of 30% to 60%. | Humidity control is rarely implemented in the local area. | |||
| In the Individual Thermal Control section, it requires the project to provide individual thermal comfort control devices or flexible dressing strategies. | The local area lacks any measures to ensure this aspect. | |||
| Sound | It is required to take into consideration the impact of noise on health, as well as to implement measures for its control and mitigation. | Based on the survey results, the majority of local residents have not implemented soundproofing facilities. Furthermore, the survey reveals that only 54.23% of individuals acknowledge that noise has not affected them personally. Many residents perceive the impact of noise on their well-being. | ||
| Materials | This provision dictates the imperative need for stringent regulation of hazardous substances inherent in building materials. | The local materials predominantly comprise indigenous resources, with minimal utilization of interior decoration. | ||
| Community; Innovations; Water | These three requirements encompass the principles of communal co-creation, innovative design, and the assurance of water quality. | Based on the interviews conducted, it has been ascertained that the community in this area fosters amicable neighborly relations, while the provision of water resources is uniformly managed through municipal engineering projects. | ||
| Minimum Value | Maximum Value | Average Value | Standard Deviation | Variance | ||
|---|---|---|---|---|---|---|
| E1 | Temperature (°C) | 9.287785 | 16.051727 | 12.61588200 | 1.729110480 | 2.990 |
| Relative Humidity (%) | 37 | 86 | 49.19 | 4.955 | 24.548 | |
| E2 | Temperature (°C) | 7.063400 | 14.249256 | 10.18938402 | 1.394559673 | 1.945 |
| Relative Humidity (%) | 51 | 78 | 60.12 | 3.971 | 15.767 | |
| E3 | Temperature (°C) | −0.533684 | 1.808193 | 0.49046708 | 0.530403608 | 0.281 |
| Relative Humidity (%) | 81 | 91 | 88.15 | 2.490 | 6.199 | |
| E4 | Temperature (°C) | −2.029068 | −0.733959 | −1.25271162 | 0.377199255 | 0.142 |
| Relative Humidity (%) | 73 | 81 | 78.34 | 1.365 | 1.863 |
| Minimum Value | Maximum Value | Average Value | Standard Deviation | Variance | ||
|---|---|---|---|---|---|---|
| B1 | Temperature (°C) | 5.276951 | 20.025177 | 12.42265321 | 3.144733858 | 9.889 |
| Relative Humidity (%) | 23 | 80 | 35.46 | 5.570 | 31.021 | |
| B2 | Temperature (°C) | 1.276798 | 7.167545 | 4.10184646 | 1.307188409 | 1.709 |
| Relative Humidity (%) | 80 | 96 | 90.84 | 2.527 | 6.384 | |
| B3 | Temperature (°C) | −1.219959 | 0.748074 | −0.29292286 | 0.374274319 | 0.140 |
| Relative Humidity (%) | 53 | 68 | 64.17 | 3.014 | 9.082 | |
| B4 | Temperature (°C) | −1.382851 | 0.446327 | −0.32932605 | 0.471483247 | 0.222 |
| Relative Humidity (%) | 62 | 75 | 70.82 | 2.863 | 8.196 | |
| D2 | Temperature (°C) | 3.036545 | 8.443962 | 4.96344065 | 1.341701328 | 1.800 |
| Relative Humidity (%) | 74 | 78 | 76.17 | 1.079 | 1.163 |
| Room No. | O | E1 | E2 | E3 | E4 | B1 | B2 | B3 | B4 | D2 |
|---|---|---|---|---|---|---|---|---|---|---|
| N | 2015 | 2015 | 2015 | 2015 | 2015 | 2015 | 2015 | 2015 | 2015 | 2015 |
| Pearson Correlation | −0.156 | 0.308 | −0.234 | −0.868 | 0.021 | −0.092 | −0.465 | −0.519 | −0.585 | −0.789 |
| Sig. (bobtail) | 0.000 | 0.000 | 0.000 | 0.000 | 0.351 | 0.000 | 0.000 | 0.000 | 0.000 | 0.000 |
| House Type | Mean Value of Indoor Air Temperature (°C) | Mean Value of Indoor Body Temperature (°C) | Mean Value of TSV in Indoor Environments | Mean Value of TCV in Indoor Environments | |||||
|---|---|---|---|---|---|---|---|---|---|
| Entire | Head | Legs | Foot | Head | Legs | Foot | |||
| Earth house (n = 19) | 15.368 | 36.463 | 0.000 | 0.211 | −0.053 | 0.211 | 1.000 | 0.789 | 0.737 |
| Brick house (n = 31) | 13.765 | 36.468 | 0.290 | 0.323 | −0.161 | 0.129 | 1.097 | 0.032 | -0.032 |
| House type | Mean value of outdoor air temperature (°C) | Mean value of outdoor body temperature (°C) | Mean value of TSV in outdoor environments | Mean value of TCV in outdoor environments | |||||
| Entire | Head | Legs | Foot | Head | Legs | Foot | |||
| Earth house (n = 19) | 4.947 | 36.342 | −0.684 | −0.737 | −0.632 | −0.737 | −0.474 | −0.447 | −0.789 |
| Brick house (n = 31) | 4.484 | 36.374 | −0.290 | −0.290 | −0.452 | −0.774 | 0.419 | −0.032 | −0.516 |
| House type | Mean value of temperature steps (°C) | Mean value of body temperature changes (°C) | Difference between indoor and outdoor environmental mean TSV | Difference between indoor and outdoor environmental mean TCV | |||||
| Entire | Head | Legs | Foot | Head | Legs | Foot | |||
| Earth house (n = 19) | 10.421 | 0.121 | 0.684 | 0.947 | 0.579 | 0.947 | 1.474 | 1.237 | 1.526 |
| Brick house (n = 31) | 9.281 | 0.094 | 0.581 | 0.613 | 0.290 | 0.903 | 0.677 | 0.065 | 0.484 |
Disclaimer/Publisher’s Note: The statements, opinions and data contained in all publications are solely those of the individual author(s) and contributor(s) and not of MDPI and/or the editor(s). MDPI and/or the editor(s) disclaim responsibility for any injury to people or property resulting from any ideas, methods, instructions or products referred to in the content. |
© 2023 by the authors. Licensee MDPI, Basel, Switzerland. This article is an open access article distributed under the terms and conditions of the Creative Commons Attribution (CC BY) license (https://creativecommons.org/licenses/by/4.0/).
Share and Cite
Li, J.; Wu, X.; Chow, S.K.W.; Zhuang, Q.; Habert, G. Thermal Comfort Comparison and Cause Analysis of Low-Temperature High-Humidity Indoor Environments of Rural Houses in Gansu Province, China. Sustainability 2023, 15, 16428. https://doi.org/10.3390/su152316428
Li J, Wu X, Chow SKW, Zhuang Q, Habert G. Thermal Comfort Comparison and Cause Analysis of Low-Temperature High-Humidity Indoor Environments of Rural Houses in Gansu Province, China. Sustainability. 2023; 15(23):16428. https://doi.org/10.3390/su152316428
Chicago/Turabian StyleLi, Junjie, Xijun Wu, Sharon K. W. Chow, Qiushi Zhuang, and Guillaume Habert. 2023. "Thermal Comfort Comparison and Cause Analysis of Low-Temperature High-Humidity Indoor Environments of Rural Houses in Gansu Province, China" Sustainability 15, no. 23: 16428. https://doi.org/10.3390/su152316428
APA StyleLi, J., Wu, X., Chow, S. K. W., Zhuang, Q., & Habert, G. (2023). Thermal Comfort Comparison and Cause Analysis of Low-Temperature High-Humidity Indoor Environments of Rural Houses in Gansu Province, China. Sustainability, 15(23), 16428. https://doi.org/10.3390/su152316428