

Sustainable Water Management with Design and Economic Evaluation of Recycling Greywater at Abu Dhabi University—A Case Study on Decentralization


Abstract
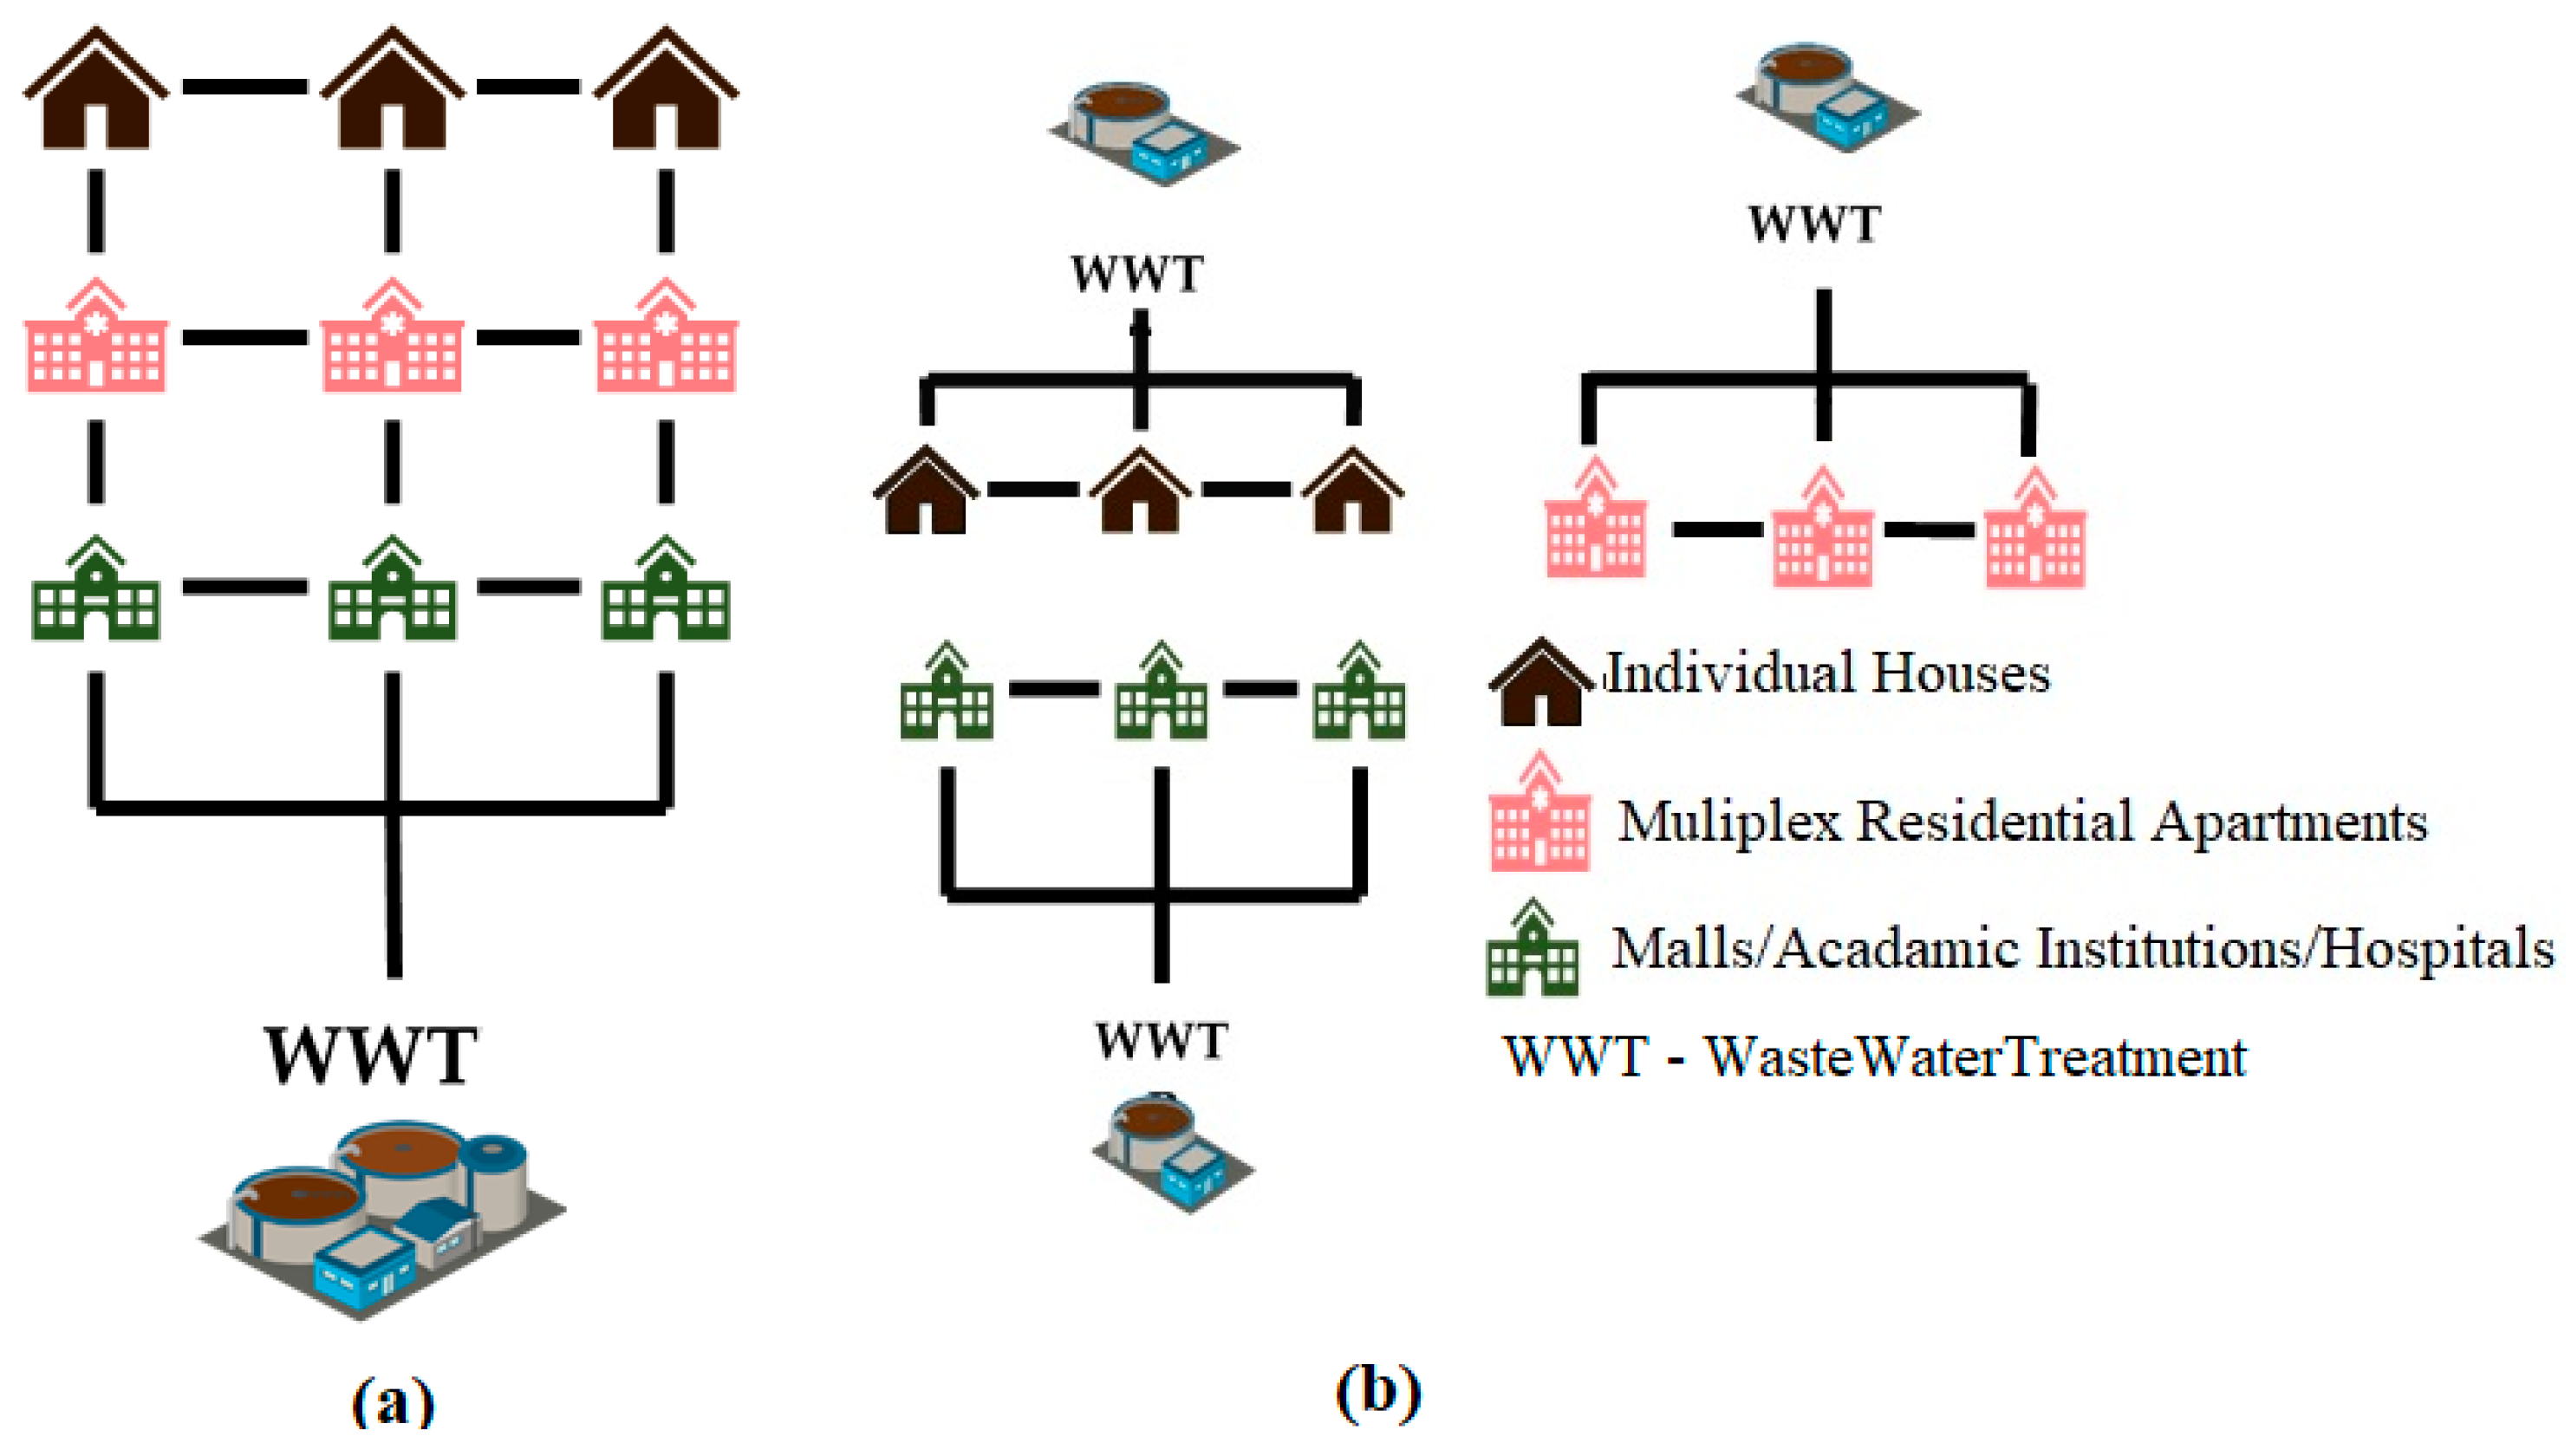
:1. Introduction
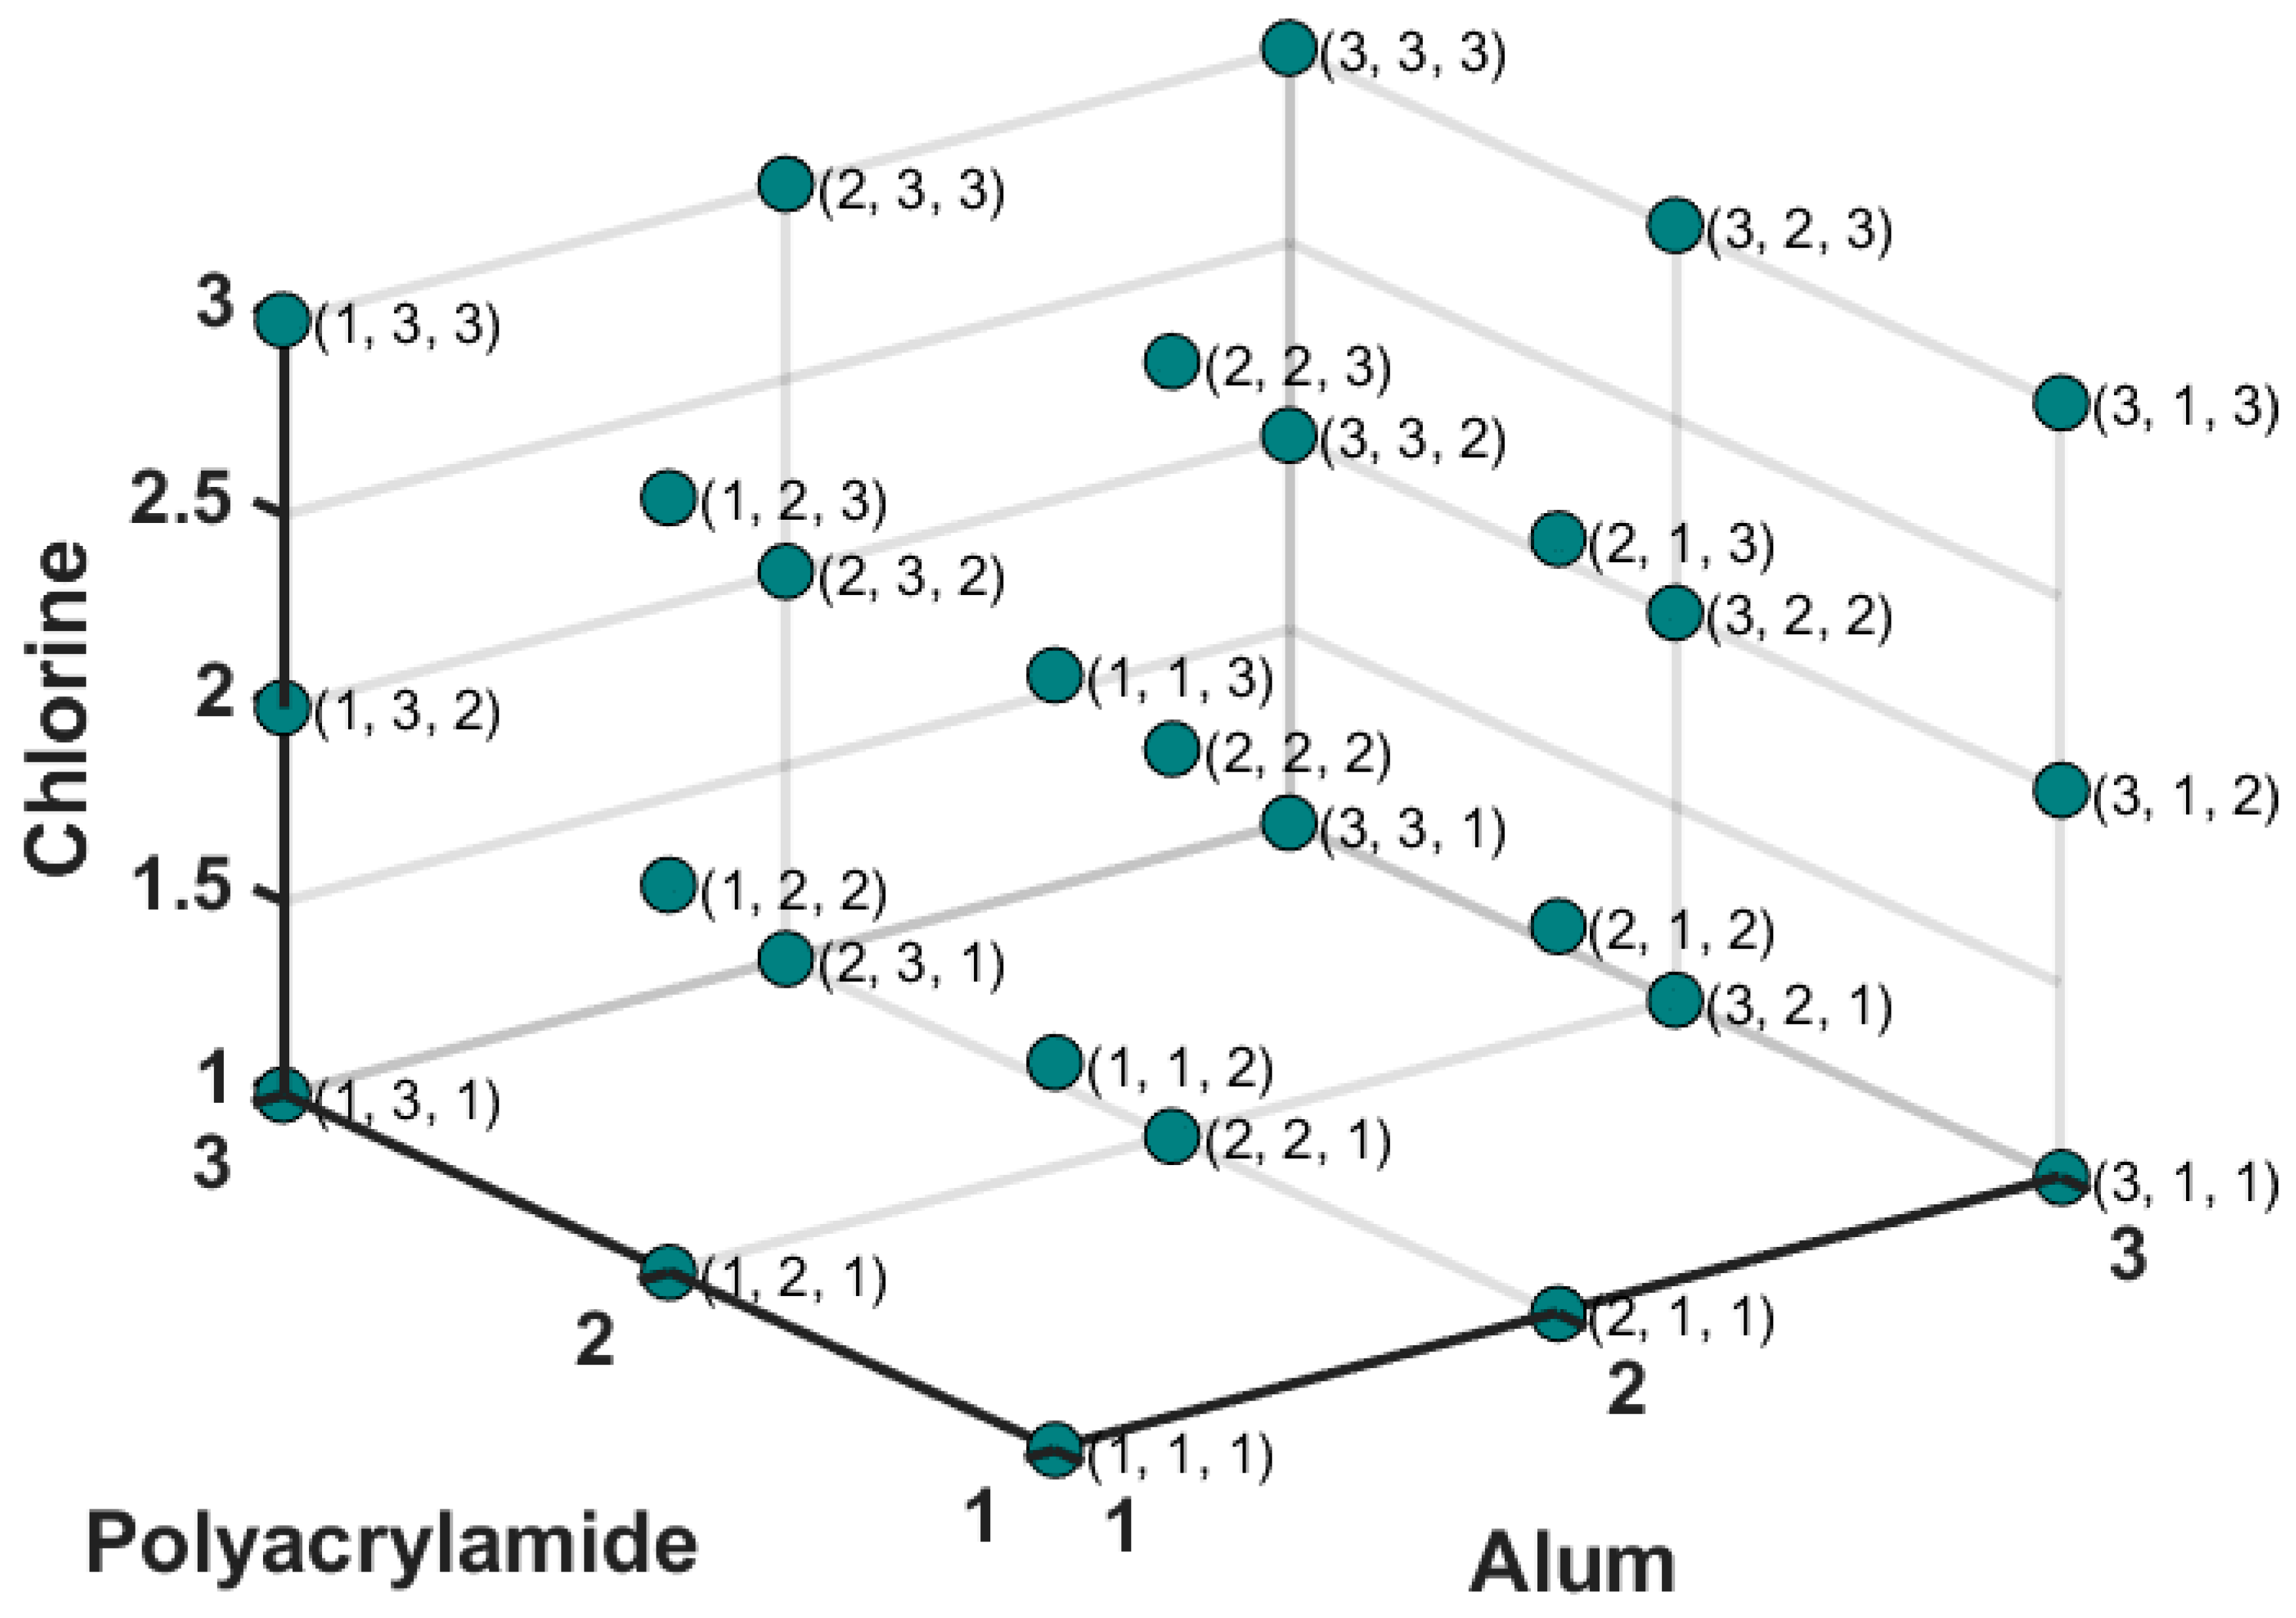
2. Materials and Methods
3. Results and Discussion
3.1. Effect on pH
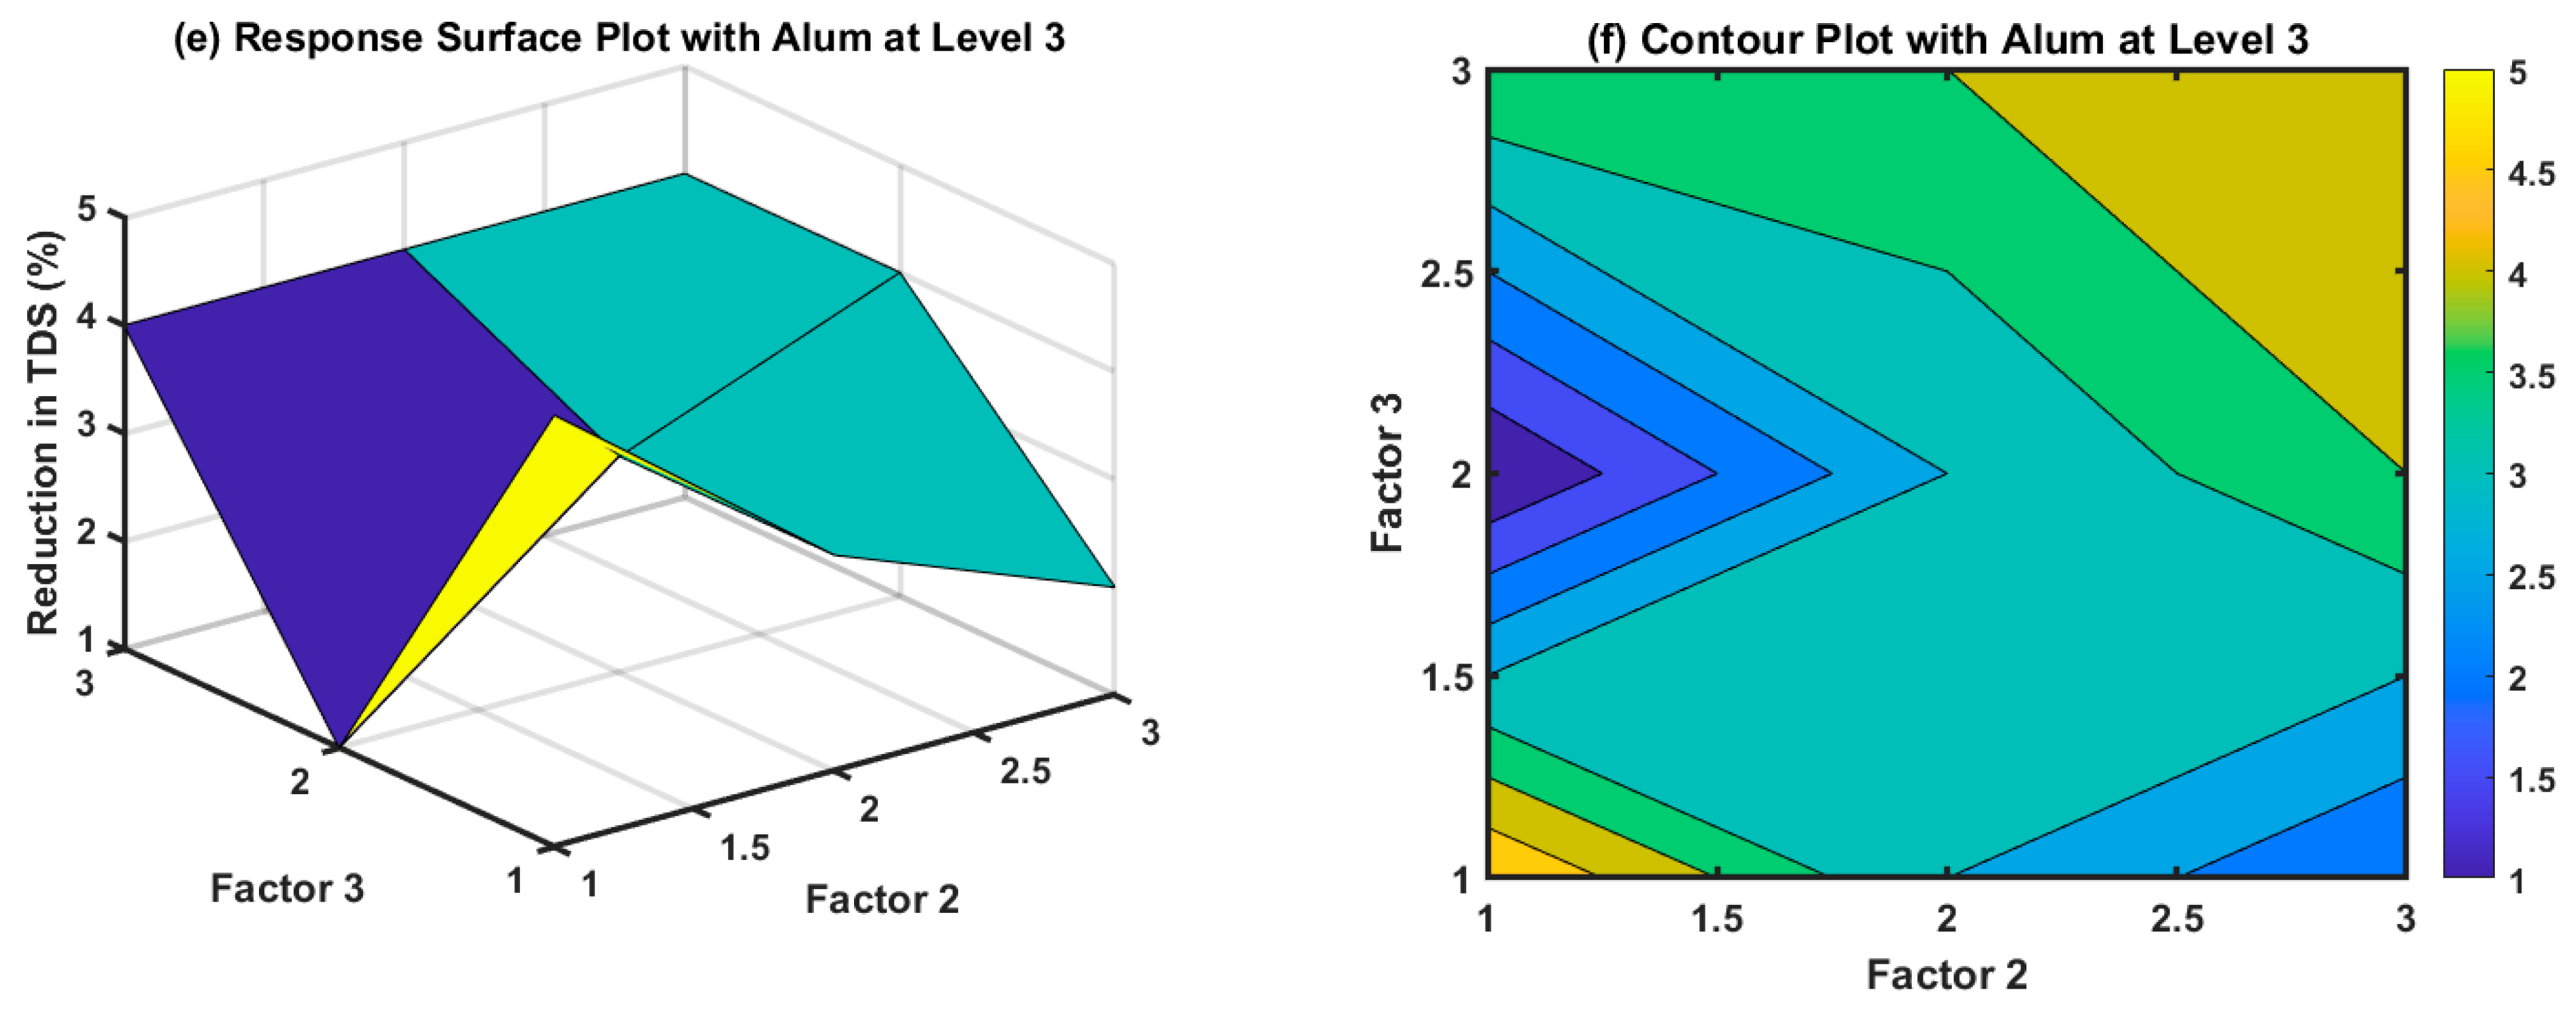
3.2. Effect on TDS
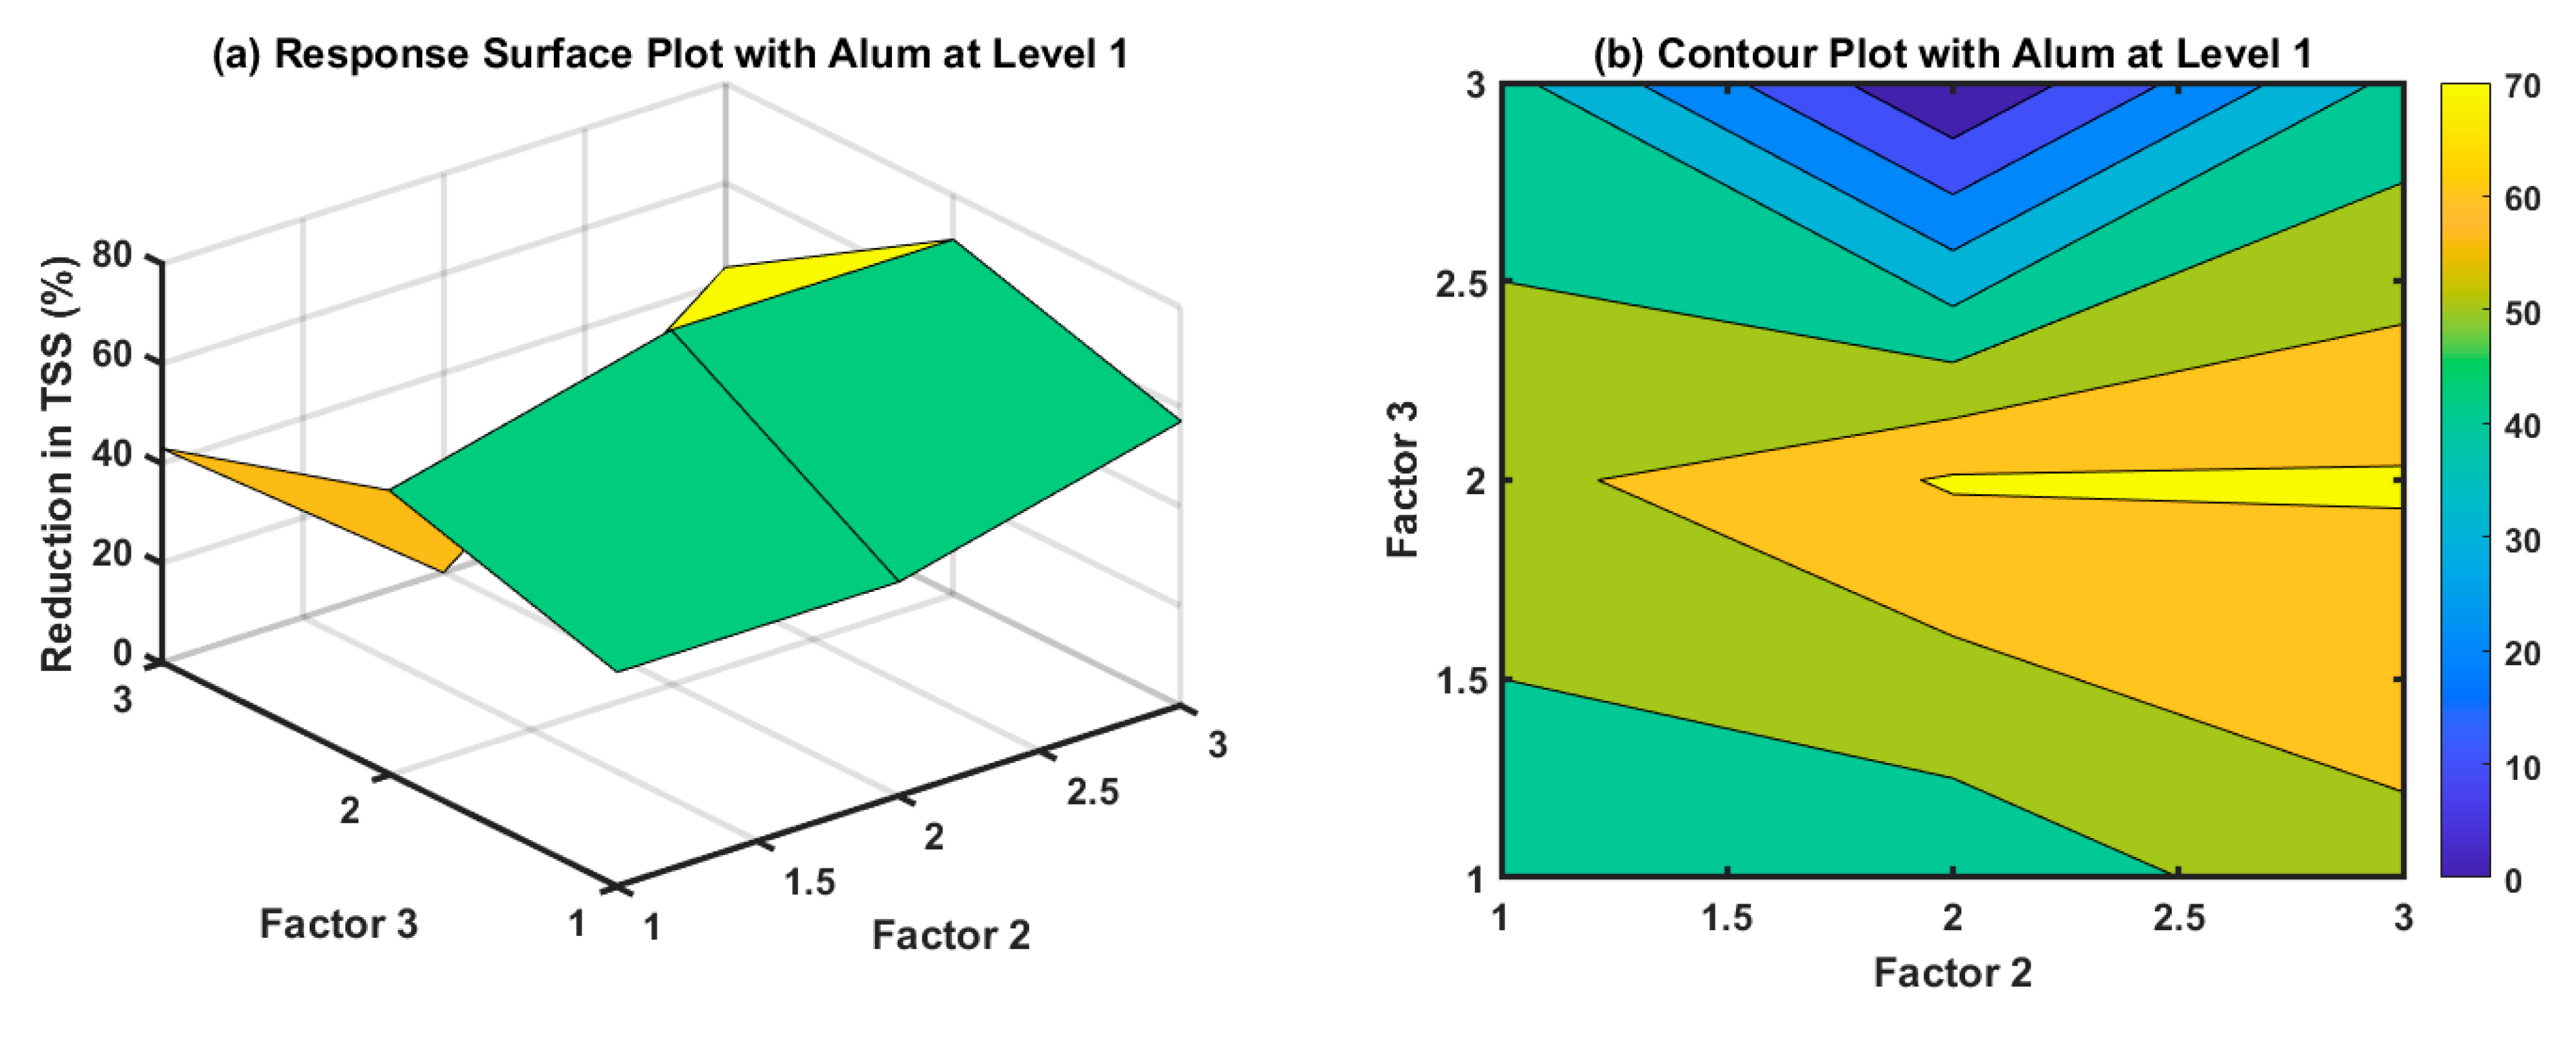
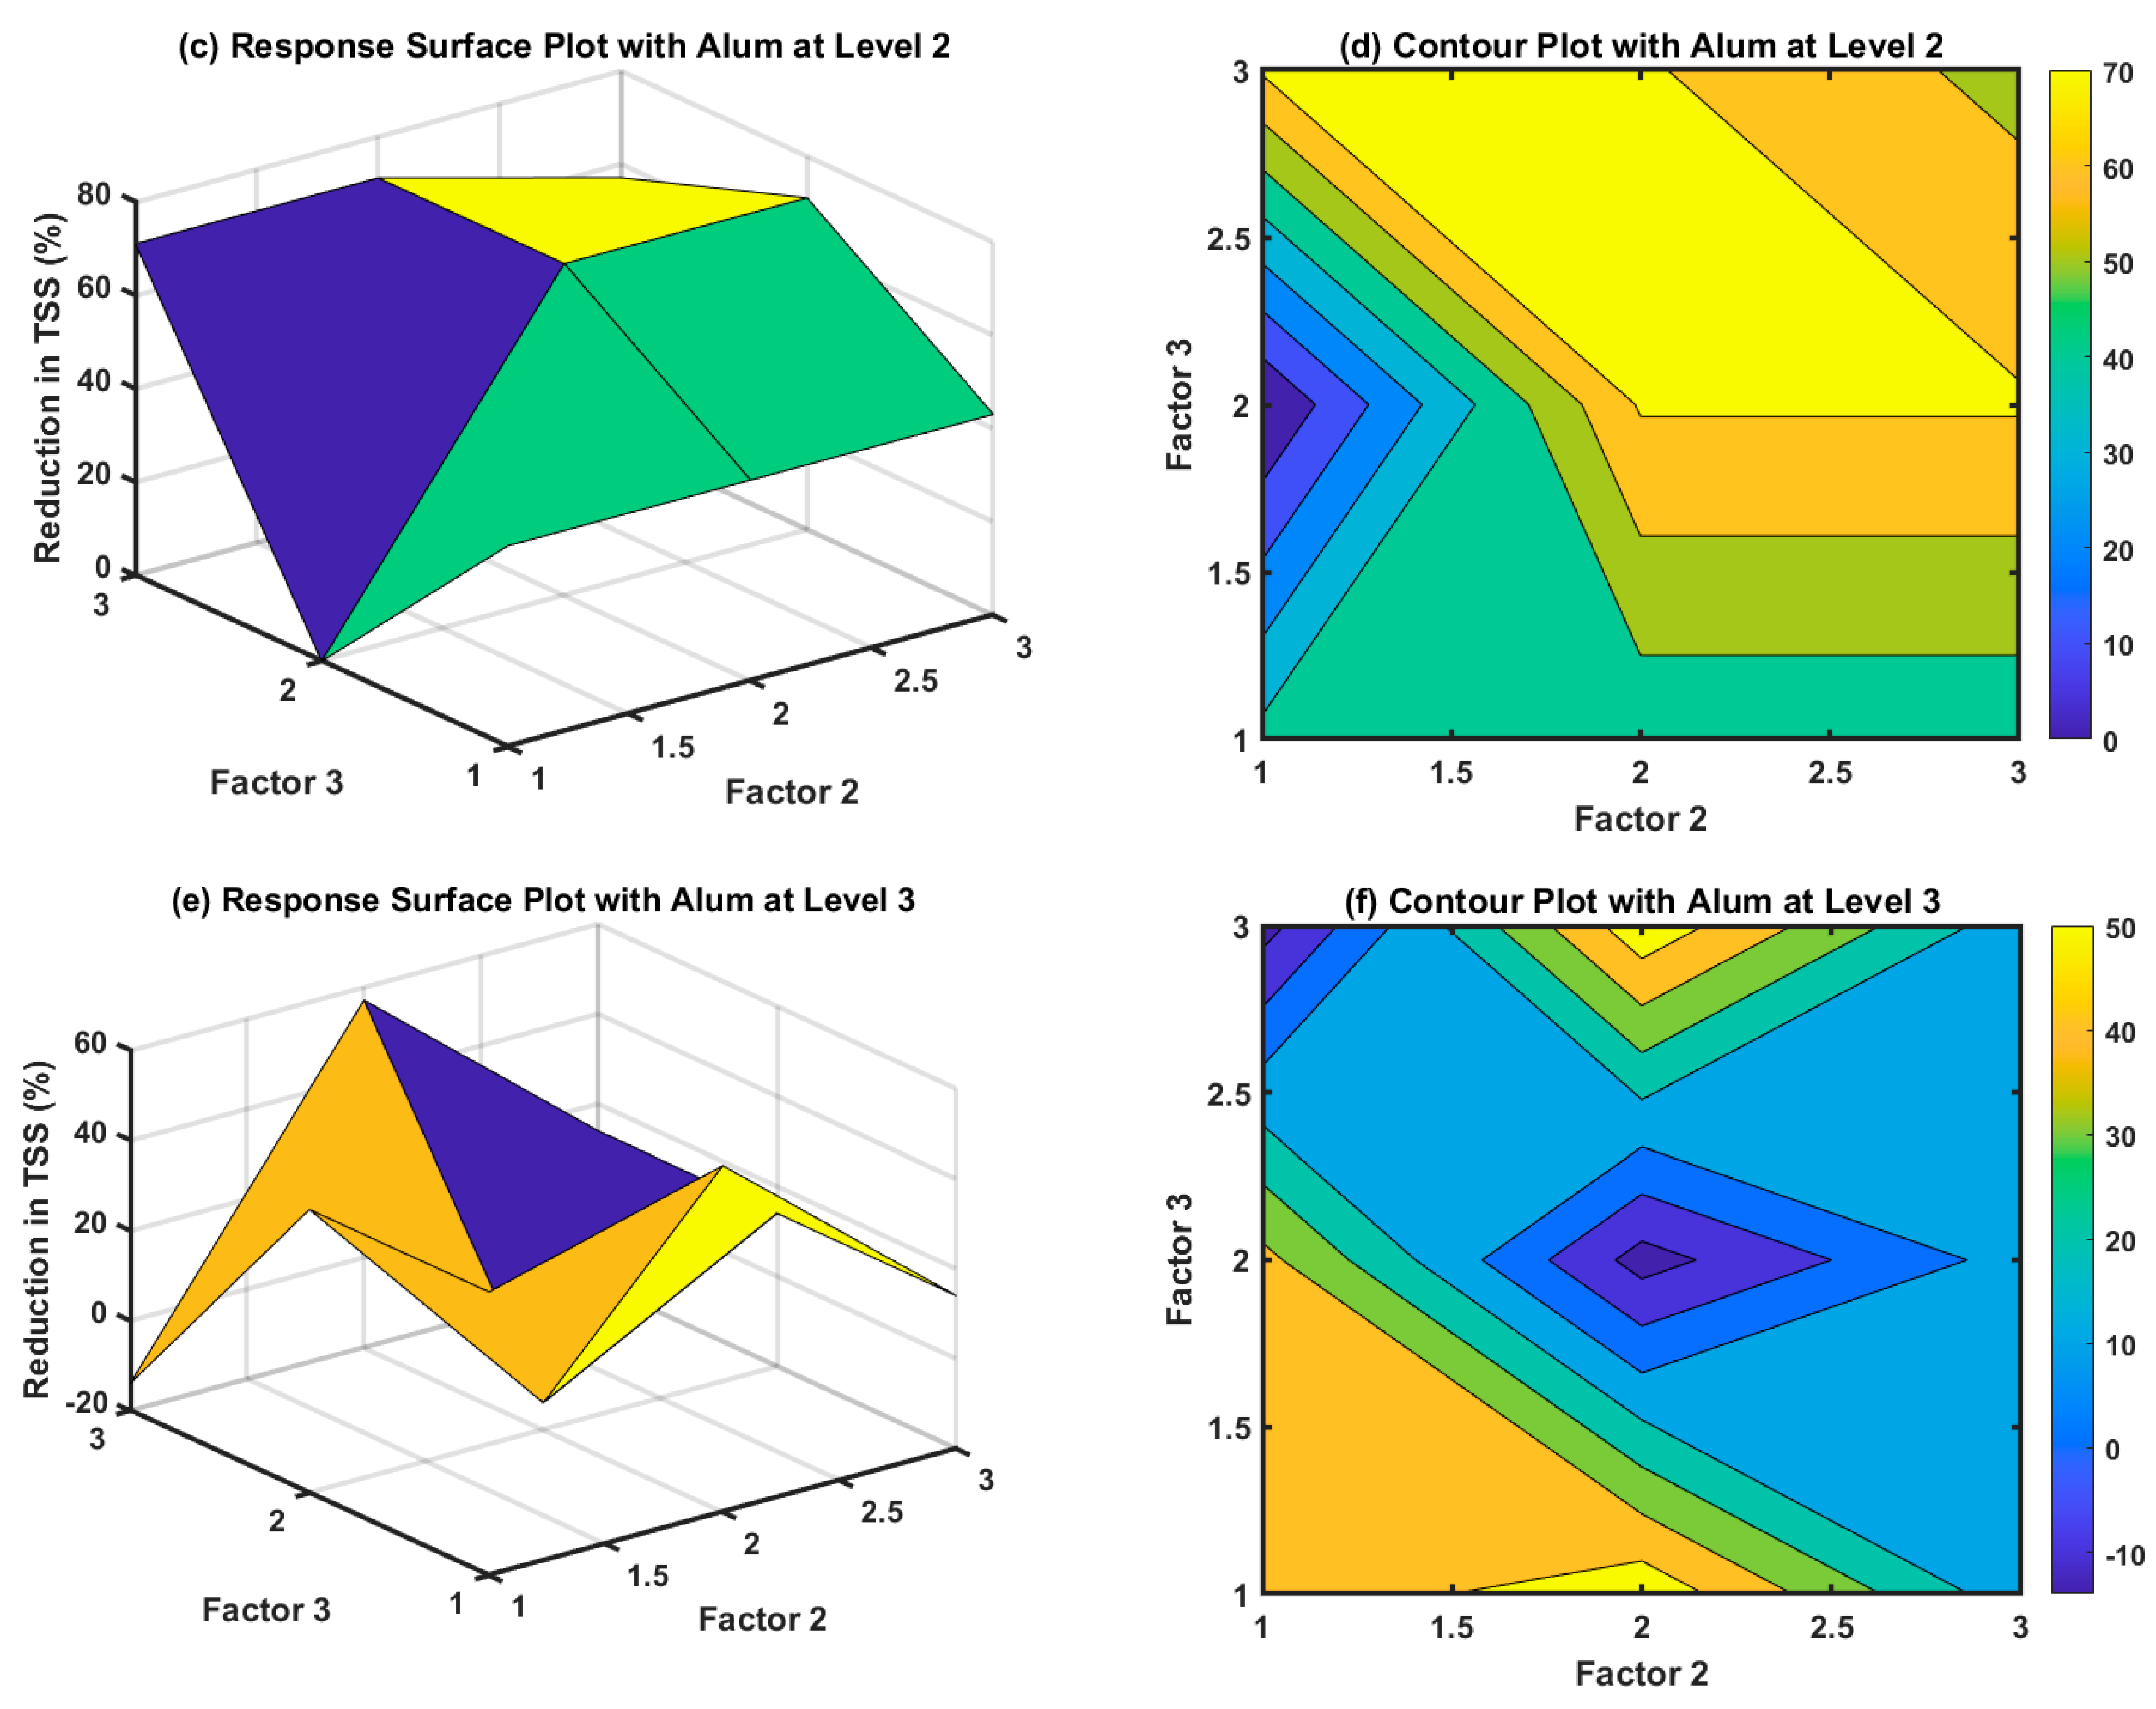
3.3. Effect on TSS
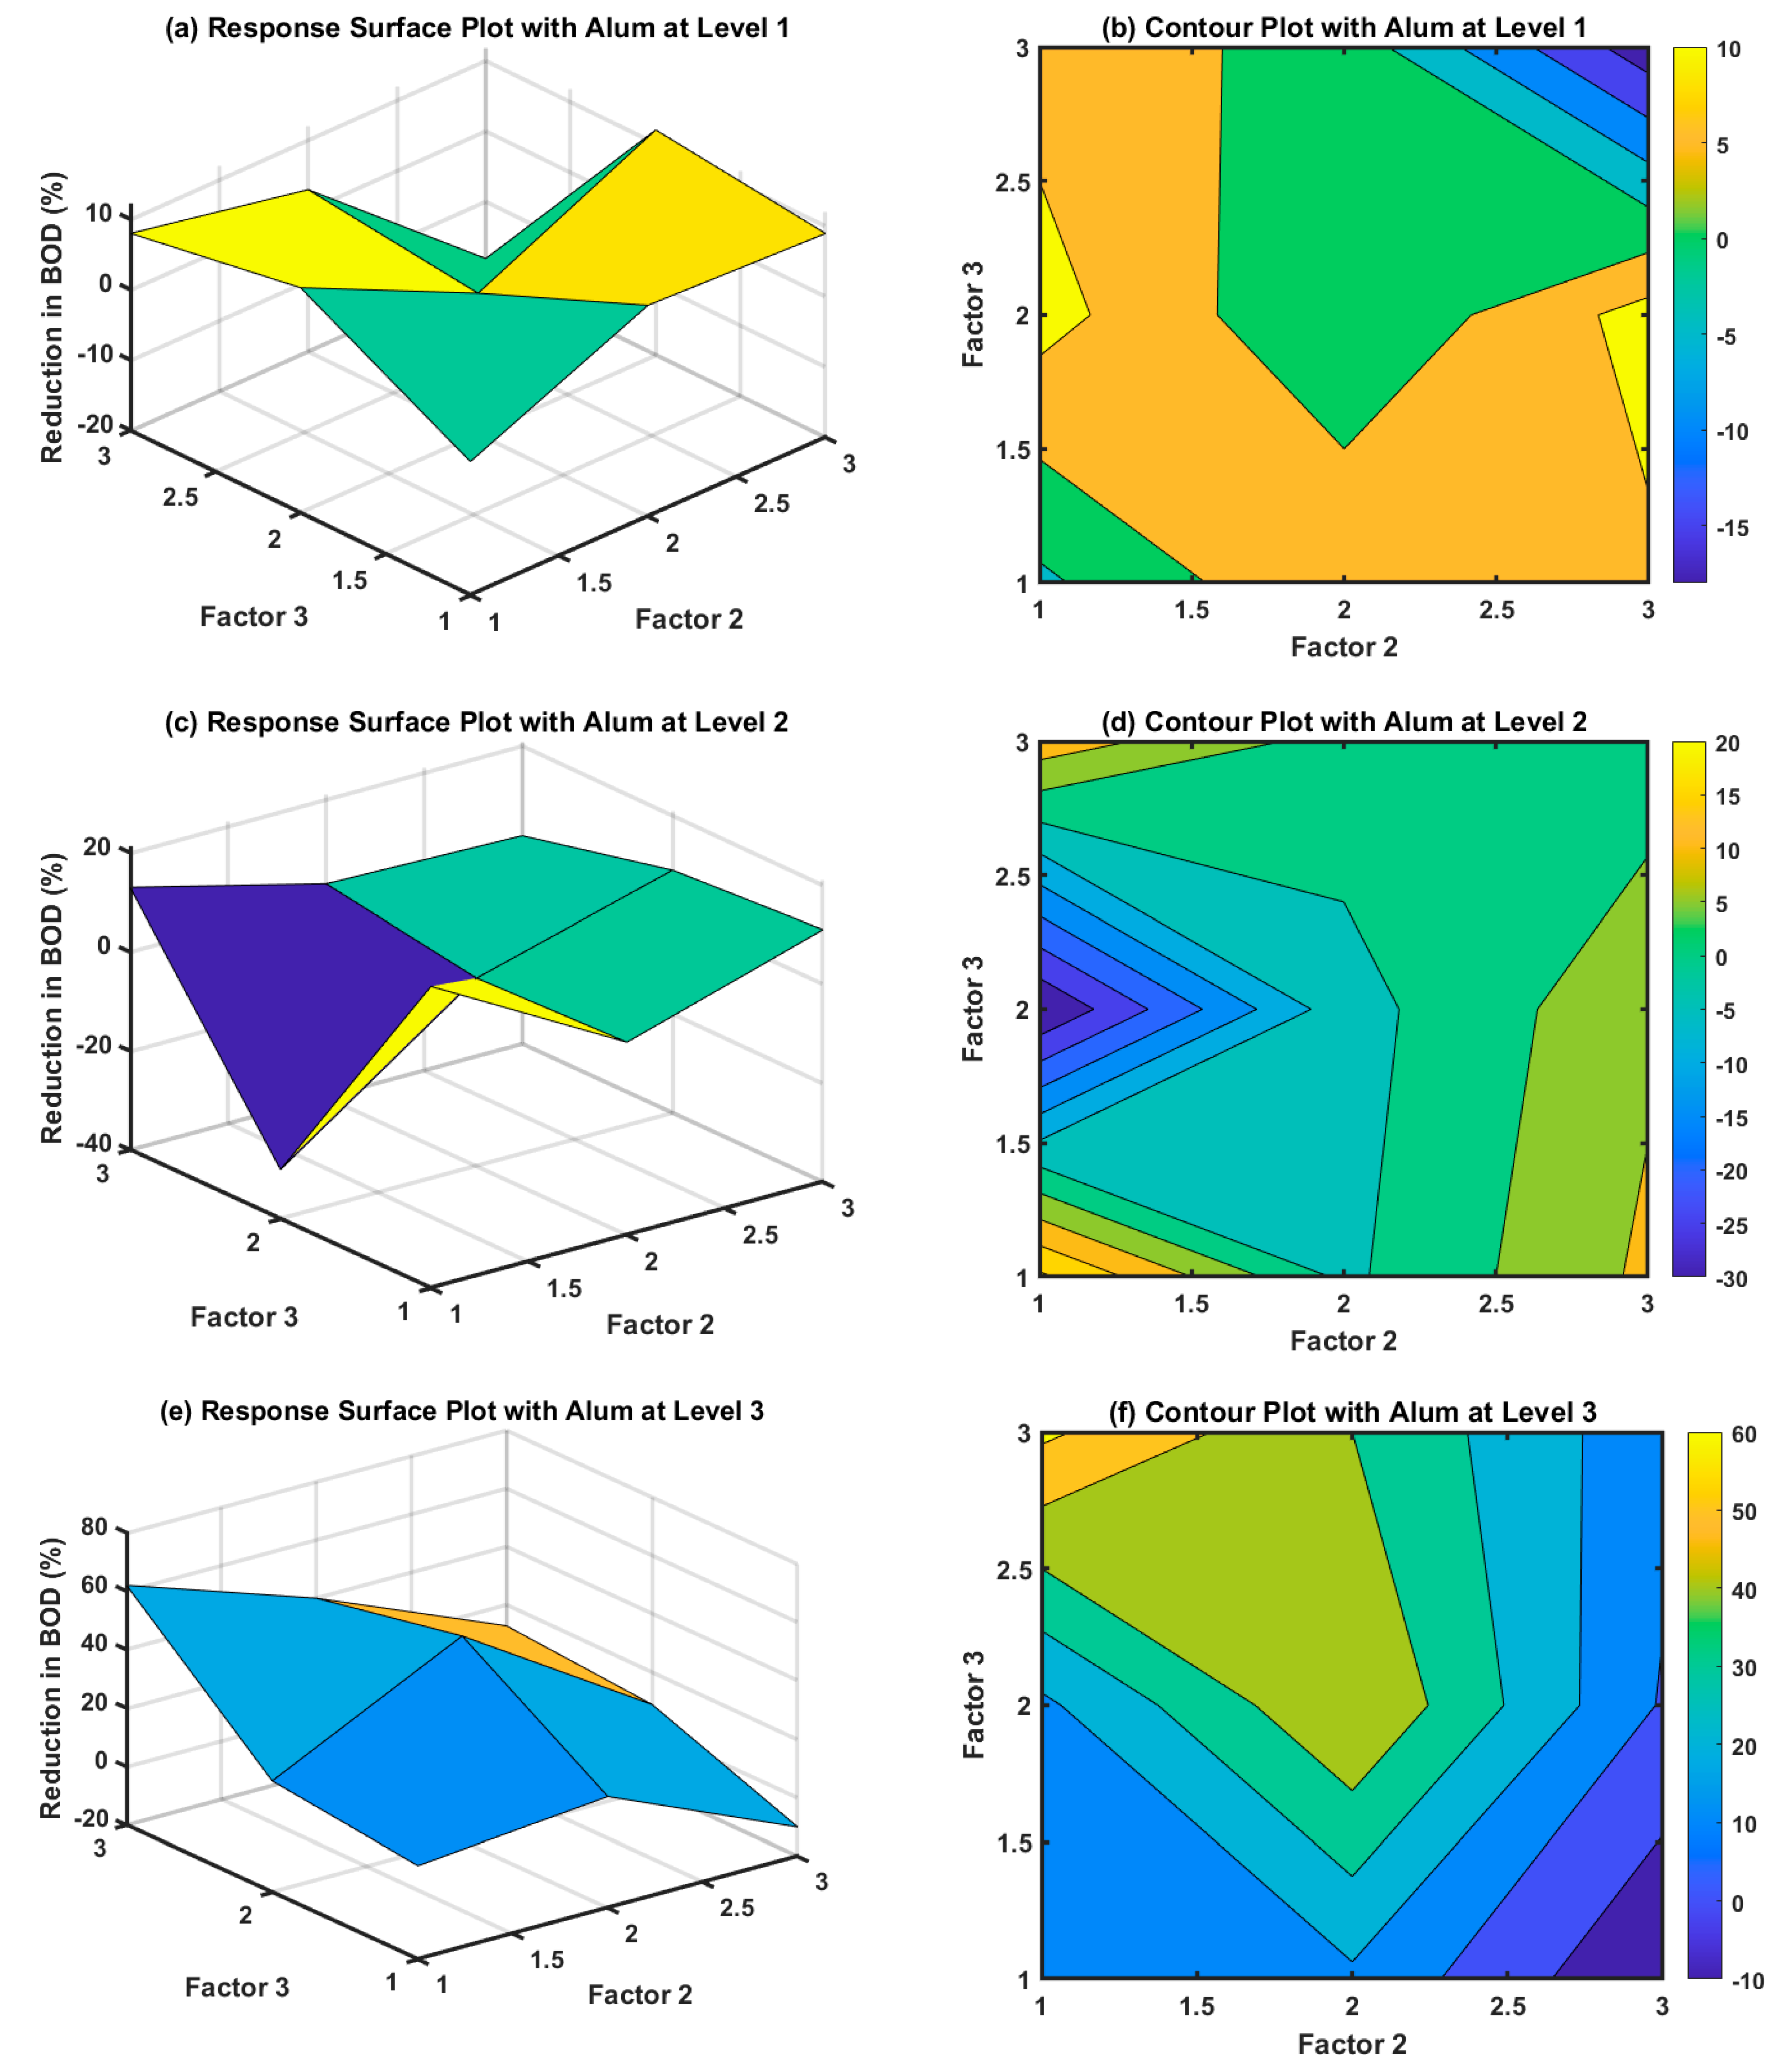
3.4. Effect on BOD and COD
3.5. Economic Feasibility of a Pilot-Scale Plant
4. Conclusions
Supplementary Materials
Author Contributions
Funding
Institutional Review Board Statement
Informed Consent Statement
Data Availability Statement
Acknowledgments
Conflicts of Interest
References
- Ensuring Sustainable Water Management for All by 2030|World Economic Forum. Available online: https://www.weforum.org/impact/sustainable-water-management/ (accessed on 9 January 2023).
- Maddocks, A.; Young, R.S.; Reig, P. Ranking the World’s Most Water-Stressed Countries in 2040. 2015. Available online: https://www.wri.org/insights/ranking-worlds-most-water-stressed-countries-2040 (accessed on 24 November 2022).
- Landels, A.; Cagney, N.; Bauer, L.; Beacham, T.A.; Balabani, S.; Allen, M.J. Development of Vortex Bioreactor Technology for Decentralised Water Treatment. In Vortex Structures in Fluid Dynamic Problems; InTech: Vienna, Austria, 2017. [Google Scholar] [CrossRef]
- Estévez, S.; González-García, S.; Feijoo, G.; Moreira, M.T. How decentralized treatment can contribute to the symbiosis between environmental protection and resource recovery. Sci. Total Environ. 2022, 812, 151485. [Google Scholar] [CrossRef] [PubMed]
- Velasco-Muñoz, J.F.; Aznar-Sánchez, J.A.; Belmonte-Ureña, L.J.; Román-Sánchez, I.M. Sustainable Water Use in Agriculture: A Review of Worldwide Research. Sustainability 2018, 10, 1084. [Google Scholar] [CrossRef]
- Singh, S.; Pradhan, N.; Ojha, N.; Roy, B.; Bose, S. Grey Water Treatment and Its Application in Cultivation of Plants. 2016. Available online: https://www.researchgate.net/publication/314116189 (accessed on 29 August 2023).
- United Nations. The Sustainable Development Goals Report. Available online: https://unstats.un.org/sdgs/report/2022/ (accessed on 3 January 2023).
- Poustie, A.; Yang, Y.; Verburg, P.; Pagilla, K.; Hanigan, D. Reclaimed wastewater as a viable water source for agricultural irrigation: A review of food crop growth inhibition and promotion in the context of environmental change. Sci. Total Environ. 2020, 739, 139756. [Google Scholar] [CrossRef] [PubMed]
- Al-Hamaiedeh, H.; Bino, M. Effect of treated grey water reuse in irrigation on soil and plants. Desalination 2010, 256, 115–119. [Google Scholar] [CrossRef]
- U.S. Green Building Council. Glossary. Available online: https://www.usgbc.org/glossary (accessed on 11 January 2023).
- Difference between Blackwater and Greywater|Difference between. Available online: http://www.differencebetween.net/miscellaneous/difference-between-blackwater-and-greywater/ (accessed on 11 January 2023).
- Athirah, A.; Al-Gheethi, A.A.S.; Noman, E.A.; Mohamed, R.M.S.R.; Kassim, A.H.M. Centralised and Decentralised Transport Systems for Greywater and the Application of Nanotechnology for Treatment Processes. In Management of Greywater in Developing Countries: Alternative Practices, Treatment and Potential for Reuse and Recycling; Springer: Berlin/Heidelberg, Germany, 2019; pp. 227–244. [Google Scholar] [CrossRef]
- Zhang, D.Q.; Tan, S.K. Decentralized wastewater management and its application in an urban area of Beijing, China. In Proceedings of the 2010 4th International Conference on Bioinformatics and Biomedical Engineering, iCBBE 2010, Chengdu, China, 18–20 June 2010. [Google Scholar] [CrossRef]
- Chirisa, I.; Bandauko, E.; Matamanda, A.; Mandisvika, G. Decentralized domestic wastewater systems in developing countries: The case study of Harare (Zimbabwe). Appl. Water Sci. 2017, 7, 1069–1078. [Google Scholar] [CrossRef]
- Massoud, M.A.; Tarhini, A.; Nasr, J.A. Decentralized approaches to wastewater treatment and management: Applicability in developing countries. J. Environ. Manag. 2009, 90, 652–659. [Google Scholar] [CrossRef]
- Mladenov, N.; Dodder, N.G.; Steinberg, L.; Richardot, W.; Johnson, J.; Martincigh, B.S.; Buckley, C.; Lawrence, T.; Hoh, E. Persistence and removal of trace organic compounds in centralized and decentralized wastewater treatment systems. Chemosphere 2022, 286, 131621. [Google Scholar] [CrossRef]
- Al-Gheethi, A.A.; Mohamed, R.M.; Jais, N.M.; Efaq, A.N.; Halid, A.A.; Wurochekke, A.A.; Amir-Hashim, M.K. Influence of pathogenic bacterial activity on growth of Scenedesmus sp. and removal of nutrients from public market wastewater. J. Water Health 2017, 15, 741–756. [Google Scholar] [CrossRef]
- Ferreira, M.M.; Fiore, F.A.; Saron, A.; da Silva, G.H.R. Systematic review of the last 20 years of research on decentralized domestic wastewater treatment in Brazil: State of the art and potentials. Water Sci. Technol. 2021, 84, 3469–3488. [Google Scholar] [CrossRef]
- Ahmed, M.; Arora, M. Suitability of Grey Water Recycling as decentralized alternative water supply option for Integrated Urban Water Management. IOSR J. Eng. 2012, 2, 31–35. [Google Scholar] [CrossRef]
- Capodaglio, A.G.; Callegari, A.; Cecconet, D.; Molognoni, D. Sustainability of decentralized wastewater treatment technologies. Water Pract. Technol. 2017, 12, 463–477. [Google Scholar] [CrossRef]
- Muzioreva, H.; Gumbo, T.; Kavishe, N.; Moyo, T.; Musonda, I. Decentralized wastewater system practices in developing countries: A systematic review. Util Policy 2022, 79, 101442. [Google Scholar] [CrossRef]
- Liang, X.; Van Dijk, M.P. Financial and economic feasibility of decentralized wastewater reuse systems in Beijing. Water Sci. Technol. 2010, 61, 1965–1973. [Google Scholar] [CrossRef] [PubMed]
- Jaramillo, M.F.; Restrepo, I. Wastewater Reuse in Agriculture: A Review about Its Limitations and Benefits. Sustainability 2017, 9, 1734. [Google Scholar] [CrossRef]
- Helmecke, M.; Fries, E.; Schulte, C. Regulating water reuse for agricultural irrigation: Risks related to organic micro-contaminants. Environ. Sci. Eur. 2020, 32, 4. [Google Scholar] [CrossRef]
- Qureshi, A.S. Challenges and Prospects of Using Treated Wastewater to Manage Water Scarcity Crises in the Gulf Cooperation Council (GCC) Countries. Water 2020, 12, 1971. [Google Scholar] [CrossRef]
- Cirelli, G.L.; Consoli, S.; Di Grande, V. Long-term storage of reclaimed water: The case studies in Sicily (Italy). Desalination 2008, 218, 62–73. [Google Scholar] [CrossRef]
- Capodaglio, A.G. Integrated, Decentralized Wastewater Management for Resource Recovery in Rural and Peri-Urban Areas. Resources 2017, 6, 22. [Google Scholar] [CrossRef]
- Malila, R.; Lehtoranta, S.; Viskari, E.L. The role of source separation in nutrient recovery—Comparison of alternative wastewater treatment systems. J. Clean. Prod. 2019, 219, 350–358. [Google Scholar] [CrossRef]
- Lu, W.; Leung, A.Y.T. A preliminary study on potential of developing shower/laundry wastewater reclamation and reuse system. Chemosphere 2003, 52, 1451–1459. [Google Scholar] [CrossRef]
- DHWA (Department of Health Western Australia). Draft Guidelines for the Reuse of Greywater in Western Australia. Available online: https://www.yumpu.com/en/document/view/28027174/draft-guidelines-for-the-reuse-of-greywater-in-western-australia (accessed on 31 January 2023).
- Thammasane, S.; Kaosol, T. Impact of Chemical Coagulants for Oscillatoria sp. Removal from Raw Water on Chemical Coagulation Process. Am. J. Environ. Sci. 2019, 14, 257–265. [Google Scholar] [CrossRef]
- Wei, N.; Zhang, Z.; Liu, D.; Wu, Y.; Wang, J.; Wang, Q. Coagulation behavior of polyaluminum chloride: Effects of pH and coagulant dosage. Chin. J. Chem. Eng. 2015, 23, 1041–1046. [Google Scholar] [CrossRef]
- Khajvand, M.; Mostafazadeh, A.K.; Drogui, P.; Tyagi, R.D.; Brien, E. Greywater characteristics, impacts, treatment, and reclamation using adsorption processes towards the circular economy. Environ. Sci. Pollut. Res. 2022, 29, 10966–11003. [Google Scholar] [CrossRef] [PubMed]
- Fatta-Kassinos, D.; Kalavrouziotis, I.K.; Koukoulakis, P.H.; Vasquez, M.I. The risks associated with wastewater reuse and xenobiotics in the agroecological environment. Sci. Total Environ. 2011, 409, 3555–3563. [Google Scholar] [CrossRef] [PubMed]
- Khanam, K.; Patidar, S.K. Greywater characteristics in developed and developing countries. Mater. Today Proc. 2022, 57, 1494–1499. [Google Scholar] [CrossRef]
- de Assis, G.C.; Skovroinski, E.; Leite, V.D.; Rodrigues, M.O.; Galembeck, A.; Alves, M.C.; Eastoe, J.; de Oliveira, R.J. Conversion of “Waste Plastic” into Photocatalytic Nanofoams for Environmental Remediation. ACS Appl. Mater. Interfaces 2018, 10, 8077–8085. [Google Scholar] [CrossRef]
- Arrosyid, B.H.; Zulfi, A.; Nur’aini, S.; Hartati, S.; Rafryanto, A.F.; Noviyanto, A.; Hapidin, D.A.; Feriyanto, D.; Khairurrijal, K. High-Efficiency Water Filtration by Electrospun Expanded Polystyrene Waste Nanofibers. ACS Omega 2023, 8, 23664–23672. [Google Scholar] [CrossRef]
- Kik, K.; Bukowska, B.; Sicińska, P. Polystyrene nanoparticles: Sources, occurrence in the environment, distribution in tissues, accumulation and toxicity to various organisms. Environ. Pollut. 2020, 262, 114297. [Google Scholar] [CrossRef]
- Garrett, D.E. Profitability Analysis; Discounted Cash Flow (DCF). In Chemical Engineering Economics; Springer: Berlin/Heidelberg, Germany, 1989; pp. 81–106. [Google Scholar] [CrossRef]
- González-Arias, J.; Sánchez, M.E.; Cara-Jiménez, J. Profitability analysis of thermochemical processes for biomass-waste valorization: A comparison of dry vs wet treatments. Sci. Total Environ. 2022, 811, 152240. [Google Scholar] [CrossRef]


| Factors | Variable | Unit | Levels | ||
|---|---|---|---|---|---|
| Low | Medium | High | |||
| X1 | Alum | mg/L | 20 | 25 | 30 |
| X2 | Polyacrylamide | mg/L | 0.6 | 0.8 | 1.0 |
| X3 | Chlorine | ml/L | 0.04 | 0.08 | 0.12 |
| Y1 | pH | - | Dependent variable | ||
| Y2 | TDS reduction | % | Dependent variable | ||
| Y3 | TSS reduction | % | Dependent variable | ||
| Y4 | BOD reduction | % | Dependent variable | ||
| Y5 | COD | mg/L | Dependent variable | ||
| Experiment Number | X1 | X2 | X3 | Y1 | Y2 | Y3 | Y4 | Y5 |
|---|---|---|---|---|---|---|---|---|
| 1 | 1 | 1 | 1 | 8.4 | −47 | 43 | −1 | 1132 |
| 2 | 1 | 1 | 2 | 8.4 | −70 | 57 | 12 | 984 |
| 3 | 1 | 1 | 3 | 8.4 | −14 | 43 | 8 | 1032 |
| 4 | 1 | 2 | 1 | 8.5 | −27 | 43 | 10 | 1012 |
| 5 | 1 | 2 | 2 | 8.3 | −58 | 71 | 0 | 1120 |
| 6 | 1 | 2 | 3 | 8.7 | −79 | 0 | 3 | 1092 |
| 7 | 1 | 3 | 1 | 8.4 | −25 | 57 | 9 | 1018 |
| 8 | 1 | 3 | 2 | 8.2 | −48 | 71 | 12 | 986 |
| 9 | 1 | 3 | 3 | 8.4 | −45 | 43 | −18 | 1321 |
| 10 | 2 | 1 | 1 | 8.3 | −63 | 43 | 21 | 890 |
| 11 | 2 | 1 | 2 | 8.3 | −16 | 0 | −30 | 1462 |
| 12 | 2 | 1 | 3 | 8.5 | −68 | 71 | 13 | 983 |
| 13 | 2 | 2 | 1 | 8.6 | −49 | 43 | −1 | 1132 |
| 14 | 2 | 2 | 2 | 8.3 | −73 | 71 | −2 | 1145 |
| 15 | 2 | 2 | 3 | 8.5 | −21 | 71 | 3 | 1092 |
| 16 | 2 | 3 | 1 | 8.4 | −53 | 43 | 11 | 997 |
| 17 | 2 | 3 | 2 | 8.5 | −47 | 71 | 9 | 1023 |
| 18 | 2 | 3 | 3 | 8.5 | −41 | 57 | 2 | 1098 |
| 19 | 3 | 1 | 1 | 8 | 5 | 43 | 12 | 985 |
| 20 | 3 | 1 | 2 | 8.2 | 1 | 43 | 18 | 923 |
| 21 | 3 | 1 | 3 | 8.2 | 4 | −14 | 62 | 429 |
| 22 | 3 | 2 | 1 | 8.3 | 3 | 57 | 18 | 920 |
| 23 | 3 | 2 | 2 | 8.3 | 3 | −14 | 50 | 564 |
| 24 | 3 | 2 | 3 | 8.4 | 4 | 57 | 40 | 673 |
| 25 | 3 | 3 | 1 | 8.2 | 2 | 14 | −10 | 1234 |
| 26 | 3 | 3 | 2 | 8.3 | 4 | 14 | 9 | 1021 |
| 27 | 3 | 3 | 3 | 8.2 | 4 | 14 | 13 | 980 |
| Coefficient | Value | Lower Limit | Upper Limit |
|---|---|---|---|
| 180.11 | −82.88 | 443.10 | |
| −91.83 | −283.70 | 100.03 | |
| −118.33 | −310.20 | 73.53 | |
| −88.16 | −280.03 | 103.70 | |
| 74.66 | −10.58 | 159.91 | |
| 50.66 | −34.58 | 135.91 | |
| −28 | −113.25 | 57.25 | |
| 16.83 | −27.30 | 60.97 | |
| 13 | −31.13 | 57.13 | |
| 27.16 | −16.97 | 71.30 | |
| −11 | −25.99 | 3.99 | |
| 8 | −6.99 | 22.99 | |
| −9 | −23.99 | 5.99 | |
| 1.5 | −13.49 | 16.49 | |
| −14 | −28.99 | 0.99 |
| Sum Square Error | Degrees of Freedom | Mean Square Error | F Value | p Value | |
|---|---|---|---|---|---|
| Total | 8922.7 | 26 | 343.18 | ||
| Model | 6881 | 15 | 458.73 | 2.47 | 0.0676 |
| Linear | 2259 | 3 | 753 | 4.06 | 0.0362 |
| Nonlinear | 4622 | 12 | 385.17 | 2.07 | 0.1184 |
| Residual | 2041.7 | 11 | 185.61 |
| Parameter | Sum Square Error | Degrees of Freedom | Mean Square Error | F Value | p Value |
|---|---|---|---|---|---|
| x1 | 1740.5 | 1 | 1740.5 | 9.3774 | 0.010808 |
| x2 | 338 | 1 | 338 | 1.8211 | 0.20431 |
| x3 | 180.5 | 1 | 180.5 | 0.97249 | 0.34525 |
| x1:x2 | 341.33 | 1 | 341.33 | 1.839 | 0.20225 |
| x2:x3 | 341.33 | 1 | 341.33 | 1.839 | 0.20225 |
| x1:x3 | 1200 | 1 | 1200 | 6.4653 | 0.027348 |
| x1^2 | 704.17 | 1 | 704.17 | 3.7939 | 0.077409 |
| x2^2 | 150 | 1 | 150 | 0.80816 | 0.38792 |
| x3^2 | 28.167 | 1 | 28.167 | 0.15176 | 0.7043 |
| (x1^2):x2 | 484 | 1 | 484 | 2.6077 | 0.13464 |
| (x1^2):x3 | 256 | 1 | 256 | 1.3793 | 0.26502 |
| x1:(x2^2) | 324 | 1 | 324 | 1.7456 | 0.21325 |
| x1:(x3^2) | 9 | 1 | 9 | 0.04849 | 0.82975 |
| x2:(x3^2) | 784 | 1 | 784 | 4.224 | 0.064392 |
| Error | 2041.7 | 11 | 185.61 |
| Property | Untreated Greywater | Treated Greywater | Deviation |
|---|---|---|---|
| pH | 8 | 8.2 | −0.2 |
| TDS (mg/L) | 894 | 861 | 33 |
| BOD (mg/L) | 337 | 128 | 209 |
| COD (mg/L) | 1124 | 429 | 695 |
Disclaimer/Publisher’s Note: The statements, opinions and data contained in all publications are solely those of the individual author(s) and contributor(s) and not of MDPI and/or the editor(s). MDPI and/or the editor(s) disclaim responsibility for any injury to people or property resulting from any ideas, methods, instructions or products referred to in the content. |
© 2023 by the authors. Licensee MDPI, Basel, Switzerland. This article is an open access article distributed under the terms and conditions of the Creative Commons Attribution (CC BY) license (https://creativecommons.org/licenses/by/4.0/).
Share and Cite
Madhuranthakam, C.M.R.; AbuZaid, M.; Chaalal, O.; Ghannam, T. Sustainable Water Management with Design and Economic Evaluation of Recycling Greywater at Abu Dhabi University—A Case Study on Decentralization. Sustainability 2023, 15, 16208. https://doi.org/10.3390/su152316208
Madhuranthakam CMR, AbuZaid M, Chaalal O, Ghannam T. Sustainable Water Management with Design and Economic Evaluation of Recycling Greywater at Abu Dhabi University—A Case Study on Decentralization. Sustainability. 2023; 15(23):16208. https://doi.org/10.3390/su152316208
Chicago/Turabian StyleMadhuranthakam, Chandra Mouli R., Malak AbuZaid, Omar Chaalal, and Tala Ghannam. 2023. "Sustainable Water Management with Design and Economic Evaluation of Recycling Greywater at Abu Dhabi University—A Case Study on Decentralization" Sustainability 15, no. 23: 16208. https://doi.org/10.3390/su152316208
APA StyleMadhuranthakam, C. M. R., AbuZaid, M., Chaalal, O., & Ghannam, T. (2023). Sustainable Water Management with Design and Economic Evaluation of Recycling Greywater at Abu Dhabi University—A Case Study on Decentralization. Sustainability, 15(23), 16208. https://doi.org/10.3390/su152316208