Abstract
This study proposes a scientific method to assess the rationality of planning and design of self-sufficient wind power systems (SS-WPSs) at ports. The evaluation method proposed is based on the concept of integrated development of water transportation and a clean energy system, taking into account the demand of the former and the availability of the latter. First, the factors representing the property of the system from the perspectives of economy, environment, energy efficiency, self-sufficiency, and reliability are calculated. The evaluation method is developed by using a combined Analytical Hierarchy Process and Entropy Weight Method (AHP-EWM) to calculate the subjective and objective weights of these factors. Subsequently, a combined weighting method based on game theory is employed with the aim of minimizing deviations between the subjective and objective weights and the combination weights, thereby determining the optimal combination of weights of the evaluation factors. These weights will be used to calculate evaluation results under different planning schemes. To validate the effectiveness of the method, a case study is developed based on a wind power energy demonstration project at a dock of a container port. Study results reveal that Option C, considered in this study, outperforms other options with the highest evaluation score of 0.737. Sensitivity analysis further underscores the reliability of Option C, showing a robust 96.15% probability of achieving the maximum final score within a 20% variation range. This indicates that the case study demonstrates that intuitive and realistic evaluation results can be obtained from the proposed method. These results affirm the practicality of our approach, providing invaluable insights for planners, policymakers, and stakeholders involved in sustainable energy initiatives.
1. Introduction
The continuous expansion of water transportation and shipping capacity has led to a substantial increase in the energy consumption of the water transport industry and of ports in particular. However, in order to address concerns regarding the consumption of fossil energy resources and prioritize environmental sustainability, port enterprises are now actively investigating alternative energy options. These alternatives include utilizing renewable energy sources such as wind, solar, and hydropower. The primary objective is to achieve self-sufficiency in satisfying their electric power demand and seamlessly integrating various energy solutions into port operations [1]. By doing so, ports can significantly reduce their carbon footprint and contribute to a greener and more eco-friendly maritime industry.
This is of great practical significance for the low-carbon, green development of the port transportation system. Considering factors such as feasibility, economy, and safety, wind power projects are one such choice for most ports, in order to create an integrated development of transportation and energy. However, the rationality of the planning and design scheme for self-sufficient wind power energy systems (SS-WPSs) at ports, considering various factors, needs to be evaluated comprehensively before they are built. When selecting evaluation factors, it is necessary to consider (i) the balance between long-term goals and short-term benefits in different planning stages [2], (ii) the economy and reliability of the planning and design scheme [3], (iii) the quality of the integrating energy system and supply [4], and (iv) the efficiency of the clean energy system from the perspective of harmonized operation of the corresponding power infrastructure, including “Source-Network-Load-Storage” [5]. In addition, it is important to consider the interaction between and influences within the system and society (i.e., environment) [6].
Existing research on the evaluation of energy systems focuses on distributed energy systems directly serving corresponding users. However, researchers in different countries like China are striving to encompass a broader spectrum, and this is clearly outlined within the context of the “Dual Carbon” strategy advocated by the Chinese government. These endeavors are not only limited to their reliability, economy, efficiency, and safety aspects but also the nuanced interactions between systems and how they affect the environment. This systematic approach entails the integration of environmental factors such as carbon emissions, pollutant emissions, and the advancement of clean energy. Based on these factors, Bai and Gan [7] developed a comprehensive evaluation system for natural gas energy distribution systems, including energy efficiency/economic and environmental impacts, which improved the comprehensive, scientific, and practical nature of the corresponding evaluation system. Similarly, Chen et al. [8] invented another set of energy system evaluation indices from the perspectives of energy, device, and distribution networks. Hu et al. [9] established a method for coordinating the operation of the “Source-Network-Load-Storage” of the clean power system by considering features such as dependability, economic efficiency, energy efficiency, cleanness, and low-carbon attributes. Meng and Luo [10] proposed 14 evaluation indicators including energy utilization rate, share of clean energy power, and carbon dioxide emissions. In general, these indicators are examined from the perspectives of energy, environment, and economy. Based on the five key dimensions e.g., technical benefits, environmental benefits, energy benefits, economic benefits, and social benefits, Shen et al. [11] established an evaluation framework for energy systems. However, prevailing research on integrated energy systems in various nations has predominantly emphasized grid interactivity, energy efficiency, and economic considerations. Notable prior studies by Tamoor et al. [12], Celo and Bualoti [13], and Andrade et al. [14], among others, have also been devoted to the establishment of reliability indicators for energy systems based on equipment failure rate and maintenance difficulty.
Numerous methods have been developed to evaluate energy systems, including subjective qualitative and objective empowerment approaches. These methods include hierarchical analysis [15], linear programming [16], fuzzy evaluation [17,18], the anti-entropy weighting method [19], data envelopment analysis [20], object element topology [21], etc. Due to the complexity of the energy system and the diversity of evaluation indicators, previous studies have attempted to integrate these evaluation methods. For instance, Han et al. developed a comprehensive evaluation framework for energy system distribution, utilizing the information entropy weighting method and grey relational analysis to explore the energy, economic, and environmental benefits of various energy system distribution strategies within a business park [22]. Teixeira proposed a performance indicators matrix that allows the evaluation and monitoring of energy consumption, energy costs, and CO2 emissions, leading to the identification of opportunities for performance improvement for continuous and sustainable development in municipalities [23]. Similarly, Yang et al. formulated an extensive set of benefit evaluation indices tailored to the fundamental characteristics of Integrated Energy Systems projects, and they subsequently developed a comprehensive benefit evaluation model based on the AHP-fuzzy theory [24]. Berjawi et al. presented a novel holistic evaluation framework based on the System-of-Systems approach for systems analysis coupled with an indicator-based approach for evaluation. This framework comprehensively addresses future changes in the energy system architecture while emphasizing the intricate interdependencies between various energy systems [25]. Wen et al. adopted a multi-faceted approach encompassing a fuzzy analytic hierarchy process, the Shannon entropy, and the single-objective optimization-Jaynes maximum entropy principle synthesis method, which enabled the establishment of subjective weights, objective weights, and all-encompassing weights for criteria assessment [26].
Currently, the development of quantitative evaluation models, which are capable of accommodating various evaluation indicators, for clean energy systems is limited. To bridge this gap, developing a comprehensive evaluation method for planning and designing the self-sufficient wind power energy system (SS-WPS) has become important, as this will provide guidelines for healthy development of this particular industry. This study proposes a comprehensive and scientific set of advanced evaluation methods encompassing five key domains, economy, environment, energy efficiency, self-sufficiency, and reliability, to dynamically/effectively tackle the pressing concerns posed by GHG emissions and ensure the integrity of a self-sufficient energy system. Additionally, a quantitative model is developed by calculating each indicator and incorporating it into the proposed AHP-EWM evaluation method. The primary objective of this paper is to advance the planning and design practice of SS-WPSs by providing a well-rounded and rigorous assessment framework that accounts for diverse considerations and enhances the decision-making process in implementing these systems. It is believed that the proposed method should provide a tool to scientifically scrutinize the rationality underpinning the planning and design of SS-WPSs at ports.
2. Study Method
To address the limitations of AHP in reflecting actual distribution and the vulnerability of EWM to extreme values, this paper proposes a new method that combines subjective and objective factors to determine the optimal combination of weights for evaluating SS-WPSs. Figure 1 presents a specific illustration of the study procedure.
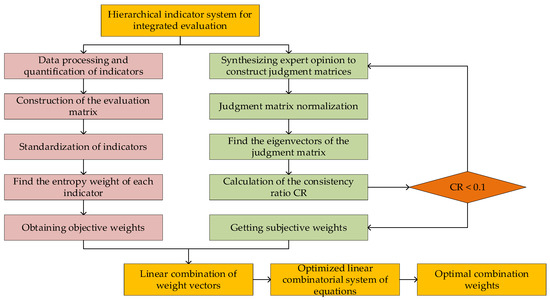
Figure 1.
Workflow for determining optimal combination weight based on a combined AHP-EWM.
2.1. Proposed Evaluation Indicators
Under the current policy support, SS-WPSs prioritize operational safety and stability by adopting a “self-sufficient with grid connection” mode. This approach involves utilizing surplus electricity generated on site and feeding it back to the State Grid, treating the grid as an infinitely large energy storage device. From an economic perspective, constructing an energy storage system within the planning period would significantly exceed the cost difference between purchasing electricity from the grid and selling surplus electricity back to the grid. Consequently, energy storage systems are typically not integrated into the configuration due to these economic considerations.
Based on the literature and considering the features of SS-WPSs, this study develops a set of evaluation indicator metrics for the storageless SS-WPSs that follow the systems engineering approach in a theoretically sound and practically convenient manner. The detailed indicators used in the proposed technique are shown in Table 1.

Table 1.
Proposed evaluation indicators for SS-WPSs.
Given the numerous equations, Table 2 provides definitions and units for the terms used in this study.
Table 2.
Nomenclature.
Table 2.
Nomenclature.
| Parameter | Description | Units |
|---|---|---|
| Initial investment | ten thousand yuan | |
| The equipment of clean energy power generation equipment | ten thousand yuan | |
| N | Total amount of equipment | - |
| Investment cost of equipment | ten thousand yuan | |
| Supporting infrastructure cost of equipment | ten thousand yuan | |
| Cost per unit of electricity generated from wind turbines | yuan/kWh | |
| The maintenance cost of equipment in the yth year | ten thousand yuan | |
| Y | The total planning period of use of the SS-WPS | year |
| The yth year of electricity generated from the port’s wind turbines | kWh | |
| The total return on investment in the planning period | % | |
| The benefits in the yth year after the construction of the SS-WPS | ten thousand yuan | |
| The costs in the yth year after the construction of the SS-WPS | ten thousand yuan | |
| , | The average daily self-generated and self-consumed electricity from the SS-WPS and the surplus electricity sold to the State Grid for the yth year | kWh |
| , | The financial subsidy and the selling price of the electricity for the yth year | yuan/kWh |
| The CO2 emission reduction | tons (t) | |
| The different fossil energy types used by the system | - | |
| H | The total number of fossil energy types | - |
| The fossil energy usage of the system in the yth year | kg | |
| Discounted factor for standard coal | (see Table 3) | |
| δ | The carbon emission factor of standard coal, referring to the value recommended by the Energy Research Institute of the National Development and Reform Commission as 0.67 | - |
| electricity emission factor, which can be referred to as the baseline emission factor of China’s regional power grid for the 2019 emission reduction program | - | |
| , | The pollutant emissions of the system before and after planning, and m = 4 means co2; | tons (t) |
| The environmental benefit for the reduction of the emissions of the mth pollutant, in which nox is taken as 8.00, SO2 is taken as 6.00, CO is taken as 1.00, and CO2 is taken as 0.023 [27,28,29] | yuan/kg | |
| Wind turbine power abandonment rate | % | |
| The average annual power abandoned from the wind turbines | kWh | |
| The average annual self-generated and self-utilized power generated from the wind turbines | kWh | |
| The average annual on-grid power of wind turbine | kWh | |
| The system electric load share | % | |
| The total system electric load | kWh | |
| The heat of combustion of fossil energy per unit of class | (see Table 3) | |
| The average clean energy output coefficient of the system at peak load | % | |
| The total amount of clean energy output of the system at peak hour | kJ | |
| The total amount of energy supply by the system at peak hour | kJ | |
| The total amount of clean energy generated by the system | kWh | |
| A | Availability rate of wind power generation equipment; the value ranges from 0 to 1 | - |
| The average number of overhauling times of wind power generation equipment in port in the yth year, including faulty overhauling and planned inspection | hour (h) | |
| The average single overhauling time in hours | hour (h) | |
| The number of equivalent full-load hours of the system in the yth year | hour (h) | |
| M | The average maintenance time of the SS-WPS | hour (h) |
| The average maintenance time of a single failure of equipment | hour (h) | |
| The average power margin of the system equipment | % | |
| The power value at the critical operation point | MW | |
| The average power value during the operation period | MW |
Table 3.
Calorific value and conversion coefficient of commonly used fossil energy.
Table 3.
Calorific value and conversion coefficient of commonly used fossil energy.
| Name of Energy Source | Average Low Level Heat Generation | Discount Factor for Standard Coal |
|---|---|---|
| Raw coal | 20,908 kJ/kg | 0.7143 kgce/kg |
| Refined coal | 26,344 kJ/kg | 0.9000 kgce/kg |
| Coke | 28,435 kJ/kg | 0.9714 kgce/kg |
| Crude oil | 41,816 kJ/kg | 1.4286 kgce/kg |
| Fuel oil | 41,816 kJ/kg | 1.4286 kgce/kg |
| Diesel | 43,070 kJ/kg | 1.4714 kgce/kg |
| Gasoline | 43,070 kJ/kg | 1.4714 kgce/kg |
| Diesel fuel | 42,652 kJ/kg | 1.4571 kgce/kg |
| Liquefied petroleum gas | 50,179 kJ/kg | 1.7143 kgce/kg |
| Refinery dry gas | 45,998 kJ/kg | 1.5714 kgce/kg |
| Liquefied natural gas | 51,433 kJ/m3 | 1.7572 kgce/m3 |
| Electricity (equivalent) | 3600 kJ/(kWh) | 0.1229 kgce/(kWh) |
Data from “Port Energy Consumption Statistics and Analysis Methods GB/T 21339-2020 [30]”.
2.1.1. Economic Indicators
- Initial investment
Initial investment plays a crucial role in determining the scale and complexity of the system to be built, the scope of its applicability, and the potential economic benefits it can yield. In the case of SS-WPSs, the initial investment includes the infrastructure costs and taxes of all wind turbines and their supporting facilities, as well as those for site preparation and on-site construction. The initial investment can be mathematically expressed, as shown in Equation (1).
where denotes the equipment of clean energy power generation equipment; N represents the total amount of equipment; denote the investment cost and infrastructure cost of equipment , respectively; and the unit is ten thousand yuan.
- 2.
- Cost per unit of electricity
The cost per unit of electricity is used to measure the cost of electricity production using a SS-WPS at a port and to compare it with the electricity price from the State Grid. The expression for the cost unit of electricity is presented in Equation (2).
where is the cost per unit of electricity generated from wind turbines, in yuan/kWh; denotes the maintenance cost of equipment in the yth year, in ten thousand yuan; Y denotes the total planning period of use of the SS-WPS in years; and denotes the yth year of electricity generated from the port’s wind turbines, in kWh.
- 3.
- Return on investment (ROI)
The return on investment (ROI) refers to the ratio between the earnings obtained within the planned duration and the total investment in the SS-WPS, calculated using Equations (3) and (4).
where denotes the total return on investment in the planning period; and denote the benefits and costs in the yth year after the construction of the SS-WPS, in units of ten thousand yuan; and denote the average daily self-generated and self-consumed electricity from the SS-WPS and the surplus electricity sold to the State Grid for the yth year in units of kWh, respectively; and denote the financial subsidy and the selling price of the electricity for the yth year, in units of yuan/kWh, respectively.
2.1.2. Environmental Indicators
In the context of a SS-WPS, clean energy does not generate pollutants. However, vehicles, ships, transporting equipment, offices, and warehouses that traditionally use fossil fuels, such as coal and natural gas, will produce pollutants. Additionally, it is significant to consider the pollutants, primarily NOx, SO2, and CO, produced when generating the electricity purchased from the State Grid. Although some studies contend that CO2 is not an environmental pollutant, its impact as a greenhouse gas cannot be ignored [31]. The environmental indicators considered in this article are based on the average annual values during the entire planning period.
- Reduction in carbon dioxide emissions
Reduction in carbon dioxide emissions is an important indicator with which to measure the effectiveness of the self-sufficient wind power system, as shown in Equation (5).
where denotes the CO2 emission reduction in tons (t); is the different fossil energy types used by the system, and H is the total number of fossil energy types; denotes the fossil energy usage of the system in year y, and the unit is kg; represents a discounted factor for standard coal (see Table 3); δ is the carbon emission factor of the standard coal, referring to the value recommended by the Energy Research Institute of the National Development and Reform Commission as 0.67; and is the electricity emission factor, which can be referred to as the baseline emission factor of China’s regional power grid for the 2019 emission reduction program.
- 2.
- Economic value of pollutant emission reductions
By replacing fossil fuels with renewable energy sources, we can determine the economic value of reducing emissions of different pollutants using Equation (6).
where is the pollutant emissions of the system before planning, and m = 4 means CO2 and are the pollutant emissions of the system after planning, respectively, in tons (t); is the environmental benefit for the reduction of emissions of the mth pollutant, in which NOx is taken as 8.00 yuan/kg, SO2 is taken as 6.00 yuan/kg, CO is taken as 1.00 yuan/kg, and CO2 is taken as 0.023 yuan/kg.
2.1.3. Energy Efficiency Indicators
- Combined wind power discount factor
The generation of wind power involves several stages, including production and transmission, which experience different types of losses. These losses ultimately lead to a decrease in theoretical power generation. The reduction factor can be calculated using Equation (7).
where denotes the wind power generation discount factor; denotes the tail flow discount factor; denotes the availability coefficient; denotes the wind energy conversion coefficient; denotes the line loss and field power discount factor; denotes the climate and environmental impact discount factor; and denotes the discount factor of other constraints, including noise limitation, the influence of the surrounding buildings (obstacles), grid peaking, the long term limitation of the power, and so on.
- 2.
- Power abandonment rate
When wind power-generating equipment is undergoing maintenance or when there is an excess of electricity that cannot be absorbed by the State Grid, the loss of electrical energy resources can be quantified via the abandonment rate of the system using Equation (8).
where denotes the wind turbine power abandonment rate (%); denotes the average annual power abandoned from the wind turbines in kWh; denotes the average annual self-generated and self-utilized power generated from the wind turbines in kWh; and represents the average annual on-grid power of the wind turbines in kWh.
2.1.4. Self-Sufficiency Indicators
- Loading ratio
Wind power generation equipment produces the energy from wind and converts it into electrical energy. Generally, the load ratio of the wind power system has a direct impact on overall energy efficiency, including fossil fuel consumption. This ratio is an important metric for evaluating the effectiveness of a self-sufficient wind power system. It is calculated using Equation (9).
where is the system electric load share; represents the total system electric load in kWh; is described in Equation (5); and is the heat of combustion of fossil energy per unit of class, whose values can be retrieved from Table 2.
- 2.
- Loading ratio of clean energy during peak hour
The ratio of the total amount of clean energy output to the total amount of energy consumed by the system during peak hours is expressed in Equation (10).
where denotes the average clean energy output coefficient of the system at peak load, denotes the total amount of clean energy output of the system at peak hour in kilojoules (kJ), and represents the total amount of energy supplied by the system at peak hour in kilojoules (kJ).
- 3.
- Self-sufficiency rate
The self-sufficiency rate of a SS-WPS is the ratio of the total amount of clean energy generated by the system to the total amount of electrical energy consumed by the system, expressed in Equation (11).
where denotes the total amount of clean energy generated by the system in kWh, and denotes the total amount of electric energy consumed by the system in kWh.
2.1.5. Reliability Indicators
- Availability rate
The availability rate of a SS-WPS refers to its capacity to maintain the expected functionality for users at a given moment. It is calculated as a ratio of the system’s standard production time to the total operation time in a year. The availability of the equipment can be represented using Equation (12).
where A represents the availability rate of wind power generation equipment, and the value ranges from 0 to 1; denotes the average number of overhauling times of wind power generation equipment in a port in year y, including faulty overhauling and planned inspection; is the average single overhauling time in hours; and represents the number of equivalent full-load hours of the system in year y, and the unit is hour (h).
- 2.
- Maintainability rate
Maintainability is the ability of the equipment of the port’s wind energy system to return to its original state of operation when it fails and has been repaired. Generally, it can be expressed in terms of the average repair time of the equipment using Equation (13).
where M denotes the average maintenance time of the SS-WPS in hours (h), and represents the average maintenance time of the single failure of the equipment of the SS-WPS equipment type i in hours (h).
- 3.
- Power margin
The SS-WPS, as a fundamental part of the port power system, needs to meet the relevant security requirements of the power system [32]. The power margin refers to the ratio between the maximum power of a wind turbine and its rated power using Equation (14).
where denotes the average power margin of the system equipment, denotes the power value at the critical operation point in megawatts (MWs), and represents the average power value during the operation period in megawatts (MWs).
2.2. Analytic Hierarchy Process (AHP)
In order to determine the subjective weights of indicators, this study uses the Analytic Hierarchy Process (AHP). The following steps are adopted: experts in this field are invited to evaluate the different components of a SS-WPS based on relevant indicators and assign values to them, in order to create a judgment matrix as shown in Table 4.
Table 4.
Scaling method.
- Normalize each column of the judgment matrix:
- 2.
- Subsequently add up rows:
By standardizing the acquired outcomes, the intended weight vector is derived using the following equation.
- 3.
- Consistency test:
The Consistency Ratio (CR) value is found by calculating the largest eigen root of the judgment matrix and thus the CR value.
If the CR value is below 0.1, it meets the consistency requirements. This means the pairwise matrix is consistent, and the assigned values for the criteria and weight coefficients are reliable.
2.3. Entropy Weighting Method (EWM)
To determine the objective weights of indicators, the entropy weighting method (EWM) is employed, and the following steps are adopted:
- Normalize indicators:
Assuming that there are m different system planning solutions being assessed, each with a set of n evaluation indicators, the evaluation matrix can be represented using Equation (20).
In the context of the EWM, the range method is used to normalize each column within the indicator or evaluation matrix. Nevertheless, the option remains to explore alternative normalization techniques tailored to the dataset’s characteristics (Equation (21)). This flexibility enhances our ability to adapt the methodology effectively.
Following normalization, the evaluation indicators exhibit a value range of 0 ≤ ≤ 1. Subsequently, the normalization matrix is obtained by calculating the proportion, denoted as , of the jth indicator value within each scheme relative to the sum of all indicator values.
- 2.
- Indicator information entropy:
Information entropy value for the jth metric:
- 3.
- Determination of entropy weights for each indicator:
The entropy weight of the jth indicator can be calculated according to Equation (24).
2.4. Combined Weighting Method
The combined weighting method, grounded in game theory, aims to optimize the weighting coefficients of various techniques, thereby minimizing the difference between the total weight and individual weights of each approach. The objective is to determine the most appropriate weight for the indicators. In evaluating the planning and design scheme for the SS-WPS, we utilize both the subjective weights obtained through AHP and the objective weights obtained through EWM. The combination of these two weight vectors constitutes the set of vectors denoted as “”. The linear combination of these two weight vectors is represented in Equation (25).
Based on the principles of game theory and coalition formation models, this study develops an objective function to optimize the weight coefficients and . In doing so, the primary objective is to minimize any differences or discrepancies.
By utilizing the principles of matrix differentiation, we can execute similar alterations. The system of linear equations that represents the conditions for the first-order derivative in optimization is expressed in Equation (27).
By solving the given equation, the optimal values for the weighting coefficients and can be determined. Once normalized, these coefficients will give the final combined weight W.
where .
The final score, denoted as S, for the evaluation of the port’s wind power self-sufficient energy system planning program is presented in Equation (29).
where is the result of Equation (21).
2.5. Sensitivity Analysis
The evaluation of the planning and designing program for a SS-WPS at ports requires a comprehensive analysis and a decision-making approach. The analysis must consider the evolving macro perspective, shaped by various influential factors. Acknowledging the intricacies and complexities involved is vital.
During the analysis of a SS-WPS investment project, it is crucial to account for potential errors in estimating various factors. Economic analyses of these variables are not constant but can fluctuate within specific ranges. Therefore, conducting sensitivity analysis is imperative to avoid drawing absolute conclusions based on limited knowledge [33]. This approach enables us to anticipate and be prepared for potential changes in advance.
In essence, sensitivity analysis serves the purpose of assessing how changes in different factors impact the economic evaluation indicators of a project. Its goal is to identify the most influential factors affecting these indicators, compare multiple programs to select the most efficient and sensitive option, and predict potential outcomes post-project implementation to ensure desired goals are achieved.
In this study, the proposed methodology underwent sensitivity analysis for uncertainty indicators. The primary analytical approach involved adjusting one indicator at a time for each of the four planning schemes, using one-factor analysis to make ±10% and ±20% adjustments [34,35]. Subsequently, all indicators were sequentially analyzed to identify the most sensitive one. The sensitivity of the indicator is calculated using Equation (30).
where is the rate of change in value of final score, and is the rate of change in raw value of the indicator..
3. Case Study
This paper examines the planning and design of a wind power energy project at Dock A (a container terminal in China). Dock A spans about 750,000 square meters of land and 300,000 square meters of sea area. The primary infrastructure consists of the port terminal, storage yards, and internal roads, covering an area of around 824,000 square meters. The total built-up area for production and auxiliary buildings is approximately 19,265 square meters.
3.1. Load Analysis
The primary components contributing to the power load of Dock A include terminal lifting equipment, ship shore power, auxiliary power equipment, office and electricity for housekeeping (including air conditioning and electric heating), and public lighting. The annual electricity consumption varies between 50–60 million kWh and is significantly affected by port throughput. Figure 2 illustrates the variation of power load in 2022, with a granularity of 2 h.
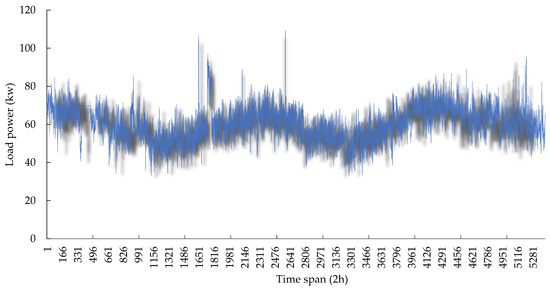
Figure 2.
Variation of electric load in the port area under study in 2022 (granularity 2 h).
3.2. Wind Energy Resource
According to the ERA-5 statistical data, the region under study experiences higher wind speeds during winter and spring, while wind speeds are relatively lower during summer and autumn. This significant variation in wind speed throughout the seasons indicates a distinct seasonal pattern in the region’s wind characteristics. On average, the wind speed for the years considered (from 1992 to 2020) is approximately 6.0 m/s (Figure 3). This corresponds to wind power densities of 266.6 W/m2 and 286 W/m2. Based on this information, the wind farm is classified as Level 1, indicating that it has favorable wind resources. In addition, the average monthly wind speeds over the above periods also show a significant variation, ranging from 4.727 m/s in August to 7.434 m/s in April (Table 5).
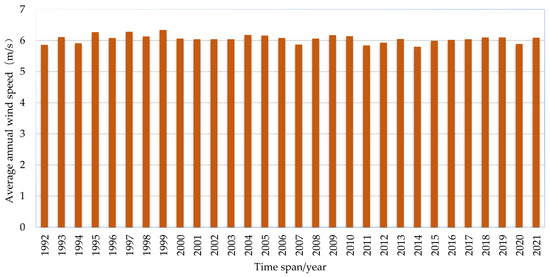
Figure 3.
ERA-5 historical average wind speed.
Table 5.
ERA-5 average monthly wind speed in m/s.
Based on the wind data collected from the wind tower near the field area, specifically from 18 October 2016 to 25 August 2020, covering a duration of over three years, this study intends to employ this dataset for the analysis and computation of power generation for Dock A.
The annual average wind speeds measured at different heights of the wind tower are as follows: 120 m (estimated)–6.32 m/s, 110 m–6.20 m/s, 100 m–6.08 m/s, 80 m–5.89 m/s, 70 m–5.79 m/s, 50 m–5.55 m/s, 30 m–5.11 m/s, and 10 m–4.43 m/s (Table 6). Correspondingly, the annual average wind power densities at these heights are: 286 W/m2, 271 W/m2, 255 W/m2, 234 W/m2, 220 W/m2, 196 W/m2, 164 W/m2, and 108 W/m2 (Table 7). It is note-worthy that wind speed and wind power density exhibit a trend of being higher from March to May and lower between July and August.
Table 6.
Measured monthly wind speed (m/s) by height.
Table 7.
Wind power density (W/m2) in the measured years by height.
The primary wind directions observed are SSE (South–South-East), SW (South–West), and NW (North–West), with NNW (North–North-West) being the main direction of wind energy. By analyzing the wind direction and wind energy at various heights using rose diagrams, it is evident that the frequency and distribution of wind are relatively concentrated throughout the year (Figure 4a,b). The dominant direction of wind energy is particularly prominent, which is advantageous for the arrangement of wind turbines and the effective utilization of wind energy resources in the wind farm.
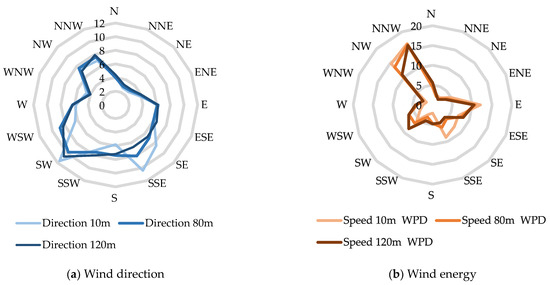
Figure 4.
Rose diagrams at different heights at the case study site.
3.3. Operational Modes
Dock A intends to implement the construction plan of a SS-WPS with a “self-sufficient with grid connection” approach. Consequently, the microgrid will be interconnected with both the State Grid and the wind power system (Figure 5). This will ensure port’s electricity requirements are fulfilled by utilizing the dynamic combination of wind power and the power from the State Grid.
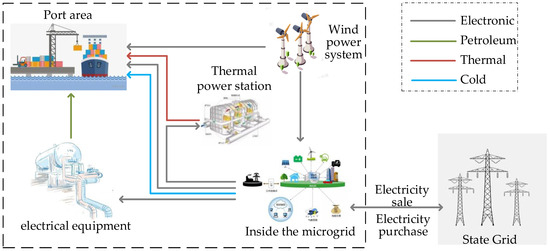
Figure 5.
The microgrid structure of the self-consistent wind power energy system.
In the context of the above approach, the microgrid of the port area operates in three modes:
- Under the first mode, if the wind power generation system does not produce enough electricity to meet the load, additional electricity is obtained from the State Grid to fulfill the demand.
- Under the second mode, when there is sufficient wind power generated, the system meets the load requirements and may produce extra electricity. The surplus electricity from the microgrid is then sold/sent back to the State Grid.
- Under the third mode, when the output of the wind power generation system is enough to satisfy the load requirements, there is excess electricity. However, under this state, the surplus electricity generated by the microgrid, with that from the State Grid, surpasses the State Grid’s capacity. As a result, the production of wind and solar power needs to be reduced or curtailed.
3.4. Planning Scheme
Based on the evaluation of the potential for producing wind energy in the Dock A area, taking into account the energy requirements of the corresponding transportation demand and the layout of existing infrastructure, facilities, and machinery, it is found that the wind turbines of IEC III C class and their height are suitable for the wind farm at Dock A. Four different planning options are suggested as alternatives, as shown in Table 8.
Table 8.
Options for potential wind energy systems.
4. Results
4.1. Quantification of Evaluation Indicators
According to the data related to the above four alternative planning schemes of Dock A and the data on wind power, the value of each indicator under different scenarios is sequentially quantified using the quantitative method proposed in this paper, and the results are presented in Table 9.
Table 9.
Quantified results of indicators.
4.2. Combined Weighting of Indicators
To ensure a scientific and objective scoring process, we invited four experts to participate and contribute to determine the weights used in the Analytic Hierarchy Process (AHP). As an illustration, here is the relative importance matrix completed by the first expert, which includes scoring for the first-level indicators of the SS-WPS. Table 10 shows the relative importance matrix of first-level evaluation indicators of the AHP. The consistency ratio (CR) values for the relative importance matrices provided by all four experts are 0.0541, 0.0743, 0.0521, and 0.0046. These values, all below 0.1, successfully meet the consistency test criteria.
Table 10.
Relative importance matrix of first-level evaluation indicators of the AHP.
According to Equations (21)–(23), we calculated the weight vector for each indicator in sequence. The average values of the weight vectors provided by the experts are then used as the subjective weight values for the indicators used in the AHP (Table 11).
Table 11.
Subjective weights used in the Analytic Hierarchy Process (AHP).
According to Equations (21)–(23), we standardized and normalized the quantitative value of each indicator, and the results are presented in Table 12.
Table 12.
Normalized indicators.
The standardized indicators were utilized to compute the entropy weight values for each indicator to determine the objective weight using EWM (Table 13).
Table 13.
The objective weights used in the entropy weighting method (EWM).
According to the combined weighting method, a comprehensive evaluation model was developed using a combination of the objective EWM and the subjective AHP method. This methodology allowed subjective and objective weights of different indicators to be determined. According to game theory, Figure 6 and Table 14 show the optimal combination weight.
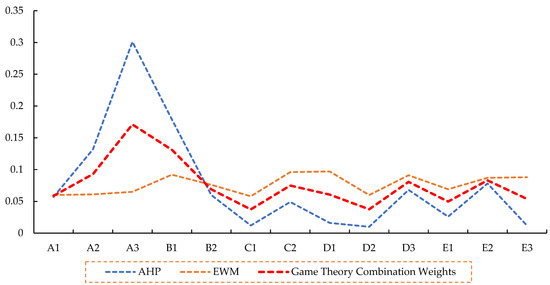
Figure 6.
Comparison of the weights between subjective and objective, and the optimal weight.
Table 14.
Results of the calculations of the optimal combination weights.
According to the data presented in Table 14 and Figure 6, it can be observed that when using the AHP method to determine the weights of the indicators, the weight of indicator , which represents the return on investment, is significantly higher than the other indicators, reaching 0.301. However, it is significant to note that the limited number of alternative scenarios in the planning and design of SS-WPSs has resulted in unrealistically higher weight for some of the indicators based on the planning scenarios and corresponding results. This estimation may lead to lower reliability when using the EWM for comprehensive evaluation. On the other hand, the combined weighting method based on game theory incorporates the subjective opinions of experts and the objective attributes of the data, which is more scientific and rational in assigning weight to each indicator.
4.3. Comprehensive Evaluation Results
According to the indicators obtained, the quantified results of evaluation indicators are first standardized. The optimal combined weight vector is then used to multiply the two datasets, following the principle of developing a hierarchical indicator system. This process results in the final evaluation outcome (Table 15).
Table 15.
Comprehensive evaluation results for different planning scheme.
Based on the comprehensive assessment results for the four alternative approaches, it is evident that Option A has the lowest evaluation score of 0.271, while Option C has the highest evaluation score of 0.737. Given these evaluation results, it is advisable to select Option C.
The stability and reliability [36] of assessment outcomes are commonly used to evaluate the effectiveness of an evaluation technique. In our performance evaluation of planning schemes, we utilized sensitivity analysis to ensure the stability of the method’s outcomes. Accuracy was assessed by comparing the rankings of planning schemes obtained through different methods.
During sensitivity analysis of the metrics specific to the case study data, we believe that a sensitivity value of indicator between 0.5 and 1 signifies that the indicator is moderately sensitive, while a value exceeding 1 shows significant sensitivity for that metric. Our assessment involves evaluating the sensitivity of each metric across various planning schemes and calculating their average values, as illustrated in Figure 7. The sensitivity analysis results show that the indicators Initial investment, Cost per unit of electricity, Return on investment (ROI), Combined wind power discount factor, Self-sufficiency rate and Availability rate, with sensitivity values falling within the range of 0.5 to 1. On the other hands, the decrease in carbon dioxide emissions, exhibits a sensitivity value of 1.17. This value suggests that is the most sensitive indicator in the analysis.
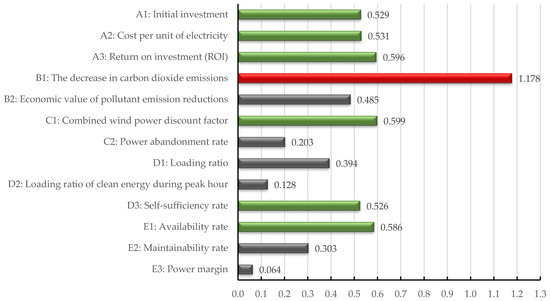
Figure 7.
Average of sensitivities for indicators corresponding to planning schemes.
Limiting the sensitivity analysis variation range to within 20% ensures reliable results. The evaluation demonstrates a stable and fault-tolerant method, with Option C potentially reaching a maximum final score of 96.15%. This highlights the robustness of the approach outlined in this paper. However, caution is needed, particularly when collecting quantitative data for indicators like the decrease in carbon dioxide emissions. Uncertainties related to these indicators can significantly impact planning scheme scores. It is advisable to conduct multiple verifications to enhance result credibility.
To comprehensively validate the rationality of the SS-WPS benefit evaluation model, this paper employed three commonly used evaluation methods in the field of MCDM, namely EWM, TOPSIS [37], and rank sum ratio (RSR) [38]. The paper presents the final scores and ranks of various planning schemes evaluated by these three methods in Table 16. Remarkably, the ranking outcomes from these three methods align with the approach utilized in this study, affirming the consistency and reliability of the proposed evaluation method.
Table 16.
Combined evaluation results of TOPSIS and RSR method.
Compared to the conventional EWM method, the combined AHP-EWM integrates the subjective preferences of industry experts, giving importance to the strengths of Option C that closely align with the anticipated planning results. It also addresses the limitations of relying solely on subjective preferences for index weighting. This approach enhances the effectiveness of the evaluation results, ensuring they align with the anticipated expectations and outcomes.
5. Conclusions and Recommendations
This study comprehensively reviewed the methods used to evaluate planning and design schemes of self-sufficient wind power energy systems (SS-WPSs) reported in previous research. This paper specifically focuses on evaluation methods for SS-WPSs. In order to do so, this study identifies 13 secondary indicators derived from the following five aspects: economy, environment, energy efficiency, self-sufficiency, and reliability. By employing these indicators, this study establishes a multi-dimensional evaluation method to thoroughly assess SS-WPSs and provide a holistic understanding of their impact and effectiveness.
The values of these indicators are quantified using the relevant data from the planning and design scheme of the SS-WPS at Dock A of the case study port. Additionally, this study incorporates game theory and a logical decision-making process to determine the optimal combination of subjective and objective weights through hierarchical analysis and entropy weighting. To validate the effectiveness of the method, a case study is developed based on a wind power energy demonstration project at a dock of a container port. Study results reveal that Option C, considered in this study, outperforms other options with the highest evaluation score of 0.737. Sensitivity analysis further underscores the reliability of Option C, showing a robust 96.15% probability of achieving the maximum final score within a 20% variation range. This indicates that the case study demonstrates that intuitive and realistic evaluation results can be obtained from the proposed method. This allows for a comprehensive and scientific evaluation of the planning and design scheme, leading to the following conclusions:
- (1)
- This study aims to critically analyze the characteristics of planning and design schemes for SS-WPSs at ports to overcome the current limitations within the methods for evaluating these schemes. Furthermore, a multi-criteria evaluation model has been developed for assessing these planning and design schemes.
- (2)
- When evaluating the planning and design of SS-WPSs from various perspectives, it is crucial to give priority to economic and environmental indicators. Additionally, it is essential to take into account the interconnectedness of these indicators to prevent any potential issues with the evaluation outcomes.
- (3)
- In situations where there is not enough data available during the planning process, a combined weighting method is proposed and utilized to integrate subjective and objective weights. This helps to prevent the problem of having “unrealistic” weights for different indicators. Consequently, this study presents a novel weighting approach for assessing and evaluating the planning and designing of SS-WPSs at ports. The case study validates that the approach proposed in this paper can be applied to all storageless SS-WPSs.
- (4)
- It is important to carefully monitor metrics such as initial investment, cost per unit of electricity, return on investment (ROI), combined wind power discount factor, self-sufficiency rate, availability rate, and the decrease in carbon dioxide emissions. It is advisable to verify these metrics multiple times as uncertainty in their data significantly impacts the assessment outcomes.
The success of SS-WPSs is determined by the critical selection of equipment and capacity during the planning phase. This study proposes a method for evaluating the planning and design scheme of the system based on a set of limited factors, while future research should consider additional design factors, such as equipment layout and safety clearance, to create a more comprehensive evaluation model. The results obtained from this study can provide practicality and invaluable insights for planners, policymakers, and stakeholders involved in sustainable energy initiatives.
Author Contributions
Conceptualization, H.Z. and M.Z.; methodology, H.Z. and M.Z.; software, Z.Z.; validation, H.Z., M.S. and M.Z.; formal analysis, H.Z., L.L. and M.Z.; resources, H.Z. and Z.Z.; data curation, H.Z. and L.L.; writing—original draft preparation, H.Z.; writing—review and editing, H.Z., M.S. and M.Z.; visualization, H.Z.; supervision, M.S. and M.Z.; project administration, M.Z.; funding acquisition, M.Z. All authors have read and agreed to the published version of the manuscript.
Funding
This research is financially supported by the National Key R&D Plan Foundation of China (Grant No. 2021YFB2601300).
Institutional Review Board Statement
Not applicable.
Informed Consent Statement
Informed consent was obtained from all subjects involved in the study.
Data Availability Statement
The data that support the findings of this study are available from the corresponding author upon reasonable request.
Conflicts of Interest
The authors declare no conflict of interest.
References
- Yuan, Y.; Yuan, C.; Xu, H.; Yan, X.; He, L. Pathway for integrated development of waterway transportation and energy in China. Strateg. Study CAE 2022, 24, 184–194. [Google Scholar] [CrossRef]
- Zhang, D. Integrated Energy System Planning Considering Uncertainty. Master’s Thesis, Harbin Institute of Technology, Harbin, China, 2021. [Google Scholar]
- Sanjeev, P.; Padhy, N.P.; Agarwal, P. Peak energy management using renewable integrated dc microgrid. IEEE Trans. Smart Grid 2018, 9, 4906–4917. [Google Scholar] [CrossRef]
- Pourbehzadi, M.; Niknam, T.; Aghaej, J.; Mokryani, G.; Shafie-khah, M.; Catalao, J.P.S. Optimal operation of hybrid AC/DC microgrids under uncertainty of renewable energy resources: A comprehensive review. Int. J. Electr. Power Energy Syst. 2019, 109, 139–159. [Google Scholar] [CrossRef]
- Jia, L.; Shi, R.; Ji, L.; Wu, P. Road Transportation and Energy Integration Strategy in China. Strateg. Study CAE 2022, 24, 163–172. [Google Scholar] [CrossRef]
- Zheng, Y.; Wang, D.; Wan, C.; Yang, Z.; Chen, J.; Li, J.; Wu, L. Key technology and application of energy internet oriented to new-type towns. Autom. Electr. Power 2019, 43, 2–15. [Google Scholar]
- Bai, S.; Gan, Z. Comprehensive evaluation method and evaluation index system of natural gas distributed energy system. Gas Heat 2016, 36, 39–44. [Google Scholar]
- Chen, B.; Liao, Q.; Liu, D.; Wang, W.; Wang, Z.; Chen, S. Comprehensive Evaluation Indices and Methods for Regional Integrated Energy System. Autom. Electr. Power Syst. 2018, 42, 174–182. [Google Scholar]
- Hu, W.; Lu, X.; Liang, S.; Xu, X.; Jiang, X. Evaluation index system of source-network-load-storage coordination for integrated energy system. In Proceedings of the 11th International Conference on Measuring Technology and Mechatronics Automation, Qiqihar, China, 28–29 April 2019. [Google Scholar]
- Meng, M.; Luo, Y. Multi-index evaluation of integrated energy system based on AHP entropy weight method. Electr. Power Sci. Eng. 2021, 37, 46–54. [Google Scholar]
- Shen, M.; Zhang, G.; Zhang, G. Comprehensive evaluation method and application study of campus-level regional integrated energy system. J. Beijing Inst. Technol. 2022, 24, 52–65. [Google Scholar]
- Tamoor, M.; Tahir, M.A.; Zaka, M.A.; Iqtidar, E. Photovoltaic distributed generation integrated electrical distribution system for development of sustainable energy using reliability assessment indices and levelized cost of electricity. Environ. Prog. Sustain. Energy 2022, 41, e13815. [Google Scholar] [CrossRef]
- Celo, M.B.; Bualoti, R. Integrated indices that reflects reliability assessment for generation and transmission network. In Proceedings of the 13th IEEE Mediterranean Electrotechnical Conference, Benalmadena, Spain, 16–19 May 2006. [Google Scholar]
- Andrade, W.S.; Borges, C.L.T.; Falcao, D.M. Integrated Reliability Evaluation of Distribution and Sub-Transmission Systems Incorporating Distributed Generation; IEEE/PES Power Systems Conference and Exposition: Seattle, WA, USA, 2009. [Google Scholar]
- Enrique, H.A.; Juan, P.E.M. Modelo de gestión de la demanda energética integral. Rev. Fac. De Cienc. Económicas Investig. Y Reflexión 2015, 23, 137–147. [Google Scholar]
- Felipe, D.S.; Leonardo, W.; Edimar, J. Comprehensive approach for distribution system planning with uncertainties. Iet Gener. Transm. Distrib. 2019, 13, 5467–5477. [Google Scholar]
- Wang, J.; Jing, Y.; Zhang, C.; Shi, G.; Zhang, X. A fuzzy multi-criteria decision-making model for trigeneration system. Energy Policy 2008, 36, 3823–3832. [Google Scholar] [CrossRef]
- He, P.; Guo, Y.; Wang, X.; Zhang, S.; Zhong, Z. A multi-level fuzzy evaluation method for the reliability of integrated energy systems. Appl. Sci. 2023, 13, 274. [Google Scholar] [CrossRef]
- Wang, W.; Li, H.; Hou, X.; Zhang, Q.; Tian, S. Multi-criteria evaluation of distributed energy system based on order relation-anti-entropy weight method. Energies 2021, 14, 246. [Google Scholar] [CrossRef]
- Li, J.; Liu, H.; Wang, R.; Yan, S.; Cui, L. Comprehensive efficiency evaluation of integrated energy system based on cross-super-efficiency CCR model. Autom. Electr. Power Syst. 2020, 44, 78–86. [Google Scholar]
- Liu, H.; Shen, W.; He, X.; Zeng, B.; Liu, Y.; Zeng, M.; Zhao, C. Multi-scenario comprehensive benefit evaluation model of a multi-energy micro-grid based on the matter-element extension model. Energy Sci. Eng. 2021, 9, 402–416. [Google Scholar] [CrossRef]
- Han, Z.; Qi, C.; Xiang, P. Benefit analysis and comprehensive evaluation for distributed energy system. Therm. Power Gener. 2018, 47, 31–36. [Google Scholar]
- Teixeira, M.R.; Mendes, P.; Murta, E.; Nunes, L.M. Performance indicators matrix as a methodology for energy management in municipal water services. J. Clean. Prod. 2016, 125, 108–120. [Google Scholar] [CrossRef]
- Yang, Y.; Xue, W.; Kang, S.; Zhao, X. Comprehensive benefit analysis for integrated energy systems projects based on ahp-fuzzy. In Proceedings of the 2nd IEEE Conference on Energy Internet and Energy System Integration (EI2), Beijing, China, 20–22 October 2018. [Google Scholar]
- Berjawi, A.E.H.; Walker, S.L.; Patsios, C.; Hosseini, S.H.R. An evaluation framework for future integrated energy systems: A whole energy systems approach. Renew. Sustain. Energy Rev. 2021, 145, 111163. [Google Scholar] [CrossRef]
- Wen, Q.; Liu, G.; Wu, W.; Liao, S. Multicriteria comprehensive evaluation framework for industrial park-level distributed energy system considering weights uncertainties. J. Clean. Prod. 2021, 282, 124530. [Google Scholar] [CrossRef]
- Gu, C.; Zhao, Y. Research progress of air pollutant emissions of Chinese coal-fired power plants. J. China Coal Soc. 2022, 47, 4352–4361. [Google Scholar]
- Wei, X.; Zhou, H. Evaluating the environmental value schedule of pollutants mitigated in china thermal power industry. Res. Environ. Sci. 2003, 16, 53–56. [Google Scholar]
- Balli, O.; Hepbasli, A. Exergoeconomic, sustainability and environmental damage cost analyses of T56 turboprop engine. Energy 2015, 64, 582–600. [Google Scholar] [CrossRef]
- China National Standardization Administration Committee. The Statistical and Analytical Methods for Energy Consumption in Harbor Industry: GB/T 21339-2020. 2020. Available online: http://c.gb688.cn/bzgk/gb/showGb?type=online&hcno=AF551AA1CE7E8712C4833E19441FF432 (accessed on 19 November 2020).
- Beinat, E.; Nijkamp, P.; Rietveld, P. Value functions for environmental pollutants: A technique for enhancing the assessment of expert judgements. Environ. Monit. Assess. 1994, 30, 9–23. [Google Scholar] [CrossRef]
- Gur, T.M. Review of electrical energy storage technologies, materials and systems: Challenges and prospects for large-scale grid storage. Energy Environ. Sci. 2018, 11, 2696–2767. [Google Scholar] [CrossRef]
- Jin, C.H.; Zhang, H.; Han, M.; Zhao, X.J. Research on Risk Evaluation of Investment Decision Stage Base on Sensitivity Analysis for Building Engineering Projects. In Proceedings of the 4th International Conference on Automation, Communication, Architectonics and Materials (ACAM), Wuhan, China, 27–28 September 2014. [Google Scholar]
- Limwattananon, S. Handling uncertainty of the economic evaluation result: Sensitivity analysis. J. Med. Assoc. Thail. 2008, 91, 59–65. [Google Scholar]
- Li, M. Sensitivity Analysis on Agricultural Engineering Economic Appraisal. J. Agric. Mech. Res. 2006, 8, 66–67+70. [Google Scholar]
- Li, X.; Gao, X. A New Method for Discriminability Measurement of Comprehensive Evaluation Results. Stat. Decis. 2022, 38, 16–21. [Google Scholar]
- Wang, J.; Hu, G.; Cao, W.; Hu, C.; Chen, X. Optimal Allocation of Dispatchable Resources in an Integrated Energy System Based on Flexibility. In Proceedings of the 3rd International Symposium on New Energy and Electrical Technology, Anyang, China, 25–25 August 2022. [Google Scholar]
- Fu, X.; Chen, H.; Cai, R.; Yang, P. Optimal allocation and adaptive VAR control of PV-DG in distribution networks. Appl. Energy 2015, 137, 173–182. [Google Scholar] [CrossRef]
Disclaimer/Publisher’s Note: The statements, opinions and data contained in all publications are solely those of the individual author(s) and contributor(s) and not of MDPI and/or the editor(s). MDPI and/or the editor(s) disclaim responsibility for any injury to people or property resulting from any ideas, methods, instructions or products referred to in the content. |
© 2023 by the authors. Licensee MDPI, Basel, Switzerland. This article is an open access article distributed under the terms and conditions of the Creative Commons Attribution (CC BY) license (https://creativecommons.org/licenses/by/4.0/).