1. Introduction
Currently, an increasing number of major courier companies rely on modern technologies, which are designed to minimize the release of harmful substances into the environment. The simultaneous advancement of renewable energy sources encourages many companies to systematically enhance their commitment to caring for the natural environment. The most popular and accessible method is replacing conventionally powered vehicles with electric cars, the availability of which continues to expand each year. Until recently, these vehicles were met with widespread skepticism and only a handful of companies were willing to adopt them. Nowadays, with the significant development of renewable energy sources and the increased availability and variety of electric cars, many companies are embracing these solutions. It is known that the use of electric cars and planning routes for them requires a distinct approach compared to conventionally powered vehicles. For many courier companies, the integration of electric cars into their operations is part of their strategy, and some even run programs focused on reducing their carbon footprint. These companies promote themselves as environmentally conscious and aspire to set an example for others. Presently, there is a widespread effort to replace conventionally powered cars with electric cars, and this shift extends beyond the courier sector to encompass the entire automotive market in Poland and worldwide.
Therefore, this article aimed to analyze and verify whether electric vehicles can be used for the courier industry while maintaining the currently operating routes and maintaining the current customer service standards in the examined enterprise. The main research problem is the following question: what are the necessary modifications required to facilitate the effective utilization of electric vehicles within the courier industry for the audited company so that the same areas are still serviced while maintaining current customer service standards? The article uses several research methods, including literature and legal analysis, computer simulation, AHP analysis, and inferential analysis.
This article focuses on describing the current transportation landscape in Poland and discusses the various types of renewable energy sources. Then, it delves into a theoretical exploration of implementing electromobility within the courier market. Finally, it provides a practical case study, conducts simulations, and draws conclusions regarding the feasibility of replacing conventional vehicles with electric cars under the tested conditions. Transportation holds a pivotal role in Poland, impacting not only individual mobility but, more importantly, the movement of goods. The COVID-19 pandemic has further heightened the significance of the transport sector, contributing to the growth of online shopping and, subsequently, a substantial expansion in road transport. In recent years, the transport services market has been intensively developed. In 2019, the revenues from all road units surged by 17.3% compared to the previous year. The generated proceeds are contingent on the total weight of the vehicle. For every 100 km traveled, a truck with a GVW ranging from 3.5 to 7.5 tons contributes PLN 147 to the state budget, while vehicles with a GVM exceeding 40 tons contribute PLN 278. Poland’s geographical location is important, particularly in the transport and logistics sector, and Polish carriers play a crucial role in providing their services across the European Union. According to a report from the General Directorate for National Roads and Motorways (GDDKiA), the public road network spans nearly 420 thousand kilometers, with 19.4 thousand kilometers designated as national routes. The GDDKiA manages a network with a total length of 17.8 thousand kilometers, including 4.2 thousand kilometers of expressways, 1.3 thousand kilometers of motorways, and 2.9 thousand kilometers of expressways. The remaining road sections are under the management of concessionaires, cities with municipal poviat rights within their administrative boundaries, as well as border crossing authorities. The National Road Construction Program for 2014–2023 (with a perspective until 2025), as well as the program for the construction of 100 bypasses for 2020–2030, includes the construction of many kilometers of roads, highways, and bypasses, which will ultimately have a positive impact on the advancement of the transport sector in Poland. These programs are designed to bring about substantial improvements in vehicle mobility on Polish roads. However, it is important to note that a significant portion of the road network still requires significant improvements. In Poland, various modes of transportation are used for moving people and goods, but road transport claims the largest share, as illustrated by the data in
Table 1 [
1,
2]. It can be noticed that road transport transports approximately six times more tons of goods than rail transport compared to other modes of transport.
Road transport encompasses a variety of transport services, including private (passenger cars), urban transit, trucks, motorcycles, and couriers. The courier services sector has experienced substantial growth due to the increasing prevalence of online shopping. A significant contributing factor to this trend was the COVID-19 pandemic, during which a majority of purchases were made through both physical stores and online platforms. In the context of courier services, it entails the process of collecting a parcel from the sender and delivering it to the recipient at the specified address within the agreed-upon timeframe. The KEP (from Polish: Courier–Express–Parcel) industry encompasses courier, express, and postal shipments.
Due to the growing demand for courier services in recent years, several significant challenges have appeared. Among these are traffic congestion during rush hours, a recurring issue in metropolitan areas, leading to delivery delays. Other notable concerns are the deterioration of air quality due to excessive exhaust emissions and the transportation sector’s heavy reliance on crude oil. To address the current situation effectively, we must turn to transport policy as a means of regulating transport systems. This policy’s primary objective is to strive for changes and improvements in the broader transport context. This process relies on decisions made by the authorities of individual countries or bodies within the European Union. The principal document regulating transport policy is the Treaty on the Functioning of the European Union (Articles 90–100), which is primarily aimed at resolving existing transportation challenges. One of the planned solutions to the problems at hand involves the creation of specific documents that outline actions required to promote environmentally friendly transport practices. At the European level, efforts have been underway for years to mitigate the negative effects of transportation by promoting the use of alternative fuels. At the national level, subsidies are being introduced for users of vehicles with unconventional propulsion systems [
4]. The key EU documents in this context include the Transport White Paper, which was formulated in 2011, with one of its aims being the adoption of alternative fuels in the transportation sector [
5]. Another important document that places substantial emphasis on the use of alternative fuels is Directive 2014/94/EU of the European Parliament and of the Council. This directive proposes the replacement of conventional fuels with a range of alternatives, including electricity, biogas, hydrogen, LPG, LNG, and CNG. In Poland, a response to the European Parliament Directive and Council 2014/94/EU is the Act of 2018 on Electromobility and Alternative Fuels. Its main goal is to facilitate and accelerate technological development in Poland [
6]. Since the Act came into force, there have been numerous revisions and updates to its content, with the latest one occurring on 2 December 2021. Poland does not fare poorly compared to other countries in terms of introducing electromobility. South Korea, as part of its “Future Transport” plan, is considering expanding tax incentives for buyers of electric and hydrogen-powered vehicles and reducing the price of hydrogen by half by 2030. It is estimated that by 2030, hydrogen and electric vehicles will make up 33% of local sales. The South Korean government plans to encourage bus and truck operators to transition to “new energy vehicles”, which is expected to expand the charging network from 5400 to 15,000 points by 2030. There are currently over 30 hydrogen refueling stations, with plans to have 660 by 2030. For all EU member states, several documents have been developed that apply to all member countries. One of them is AFIR (Alternative Fuel Infrastructure Regulation), which supports the development of the zero-emission vehicle market. The main goal of AFIR is the broad expansion of charging infrastructure to encourage the transition from conventional combustion engine vehicles to electric vehicles, including in the freight transport sector (courier market). Despite the rapid growth in the popularity of electric vehicles, road transport is still far from achieving carbon neutrality by 2050 [
7,
8]. In Germany, as of 21 August 2023, a total of nearly 200,000 vehicles in the M1 (passenger) and N1 (vans) categories have been registered [
9]. There is limited scientific literature available regarding the application of electromobility in the courier market. Therefore, from the author’s perspective, this topic is innovative and relevant. The research conducted aims to demonstrate that the use of electrically powered vehicles is justified (in terms of environmental and economic considerations) and that there should be a shift from conventional to unconventional propulsion vehicles. Electric cars are a technology of the future and an attempt to address major transportation challenges, reduce noise, smog, and greenhouse gas emissions. Currently, the greatest challenges include limited range on a single charge, longer vehicle charging times compared to refueling, an insufficient number of charging stations, and the need for investments in renewable energy sources to reduce charging costs.
2. Literature Analysis on the Use of Renewable Energy Sources in Poland
In accordance with the definition provided in Article 2 of the Act of 20 February 2015, renewable energy sources encompass non-fossil energy sources such as wind energy, solar radiation energy, aerothermal energy, geothermal energy, hydrothermal energy, hydroenergy, wave energy, energy derived from sea currents and tides, as well as energy obtained from biomass, biogas, agricultural biogas, and bioliquids [
7]. In general terms, renewable sources are those that do not deplete or harm the environment when harnessed. Conventional energy sources produce by-products such as radioactive waste (in the case of nuclear energy), as well as CO
2, NO
2, SO
2 (thermal coal, crude oil), and dust (thermal coal) [
10]. One great advantage of renewable energy sources (RES) is their continual renewal by natural processes, which addresses the issue of resource availability. Renewable energy sources can be categorized based on their origin (
Figure 1).
The main hydropower resources are based on energy from rivers (resulting from the flow and differences in water levels) and oceans (involving tides, waves, and currents). In hydroelectric power plants, water’s energy is converted into electricity. The types of hydropower include the following [
11]:
Hydroelectric power plants have their drawbacks, which encompass the disruption of the hydrological structure and the potential for reservoirs to silt up. However, it is essential to acknowledge their significant advantages, such as the production of clean and ecological energy, flood prevention measures, and cost-effective operation [
12].
Wind energy is much less diverse than hydropower but is equally effective. Currently, wind turbines, often referred to as “windmills”, are the primary means of harnessing this energy. Wind power plants are categorized by the following:
Power (micro, small, medium, large, and very large);
Location (sea and land);
Rotor rotation setting (vertical and horizontal).
A characteristic feature of this type of energy is the selection of sites, preferably in areas with a high frequency of windy days (e.g., coastal regions). This sector is experiencing rapid and dynamic development due to the increasing adoption of innovative technologies. However, a notable drawback of wind turbines is the noise they generate, which restricts their installation near inhabited areas.
Another type of energy is derived from biomass. As defined in the Directive of the European Parliament and of the Council of 23 April 2009, biomass is described as the biodegradable component of products, waste, or residues of biological origin from agriculture (encompassing plant and animal materials), forestry, and related industries, which includes fishing and aquaculture, as well as the biodegradable part of industrial and urban waste [
13]. It can be noted that the broad definition of biomass allows for various processing methods. The most frequently used methods include combustion, which involves burning materials such as wood waste or straw. Biomass can also be used to produce liquid fuels through the fermentation of grains, sugar beets, rapeseed, and many other sources. In this fermentation process, fuels such as E85 gasoline, biodiesel, and oxydiesel can be obtained. Another method for obtaining energy is the aerobic and anaerobic fermentation of biomass, which produces methanol, ethanol, and biogas—fuels used in combustion engines or boiler rooms [
12].
According to the Polish Geological Institute, geothermal energy is defined as the energy stored in the form of heat beneath the Earth’s surface [
2]. This concept is very broad and includes the energy contained within geothermal waters. The use of this energy is very diverse, and the most significant advantage is the vast and consistently replenished deposits, fueled by the heat coming from the Earth’s interior. For everyday use, it can be utilized in central heating systems or for heating buildings, providing hot water for swimming pools, snow removal, or even fish farming, as exemplified in Iceland [
14].
The final energy under consideration is solar energy, regarded as the most important renewable energy source. Solar energy is obtained from solar radiation, and a crucial factor in determining the energy potential of a given area is its geographical location. In Poland, it is estimated that 80% of the total solar radiation is received during a 6-month period from April to September [
9]. After capturing solar energy, it is processed using collectors (used for heating water for central heating and domestic hot water) and photovoltaic cells (commonly installed by households to power devices with electricity or as part of photovoltaic farms) [
15,
16].
Renewable energy sources are increasingly gaining importance, not only in small processes but also at the level of entire systems. Many critics view renewable energy as a passing trend without a future in broader use. It is difficult to form a definitive opinion on the future of renewable energy sources due to the rapid pace of change in today’s world. However, it is evident that they are currently gaining importance and seeing wider adoption. Poland is aligning with the global trend by expanding the use of renewable energy within its energy sector.
Table 2 presents data showing the change in the installed capacity of specific renewable energy carriers in Poland over a 15-year period.
Upon analyzing the data in
Table 2, a significant increase in renewable energy sources is noted in Poland. This shows that they are not only gaining in popularity but, more importantly, the market demand for this type of energy is growing. In 2020, compared to 2005, there is an eight-fold increase in the total power of registered installations utilizing wind, biomass, and solar energy. The advancement of renewable energy sources should go hand in hand with a rising share of “green” energy in Poland (
Figure 2).
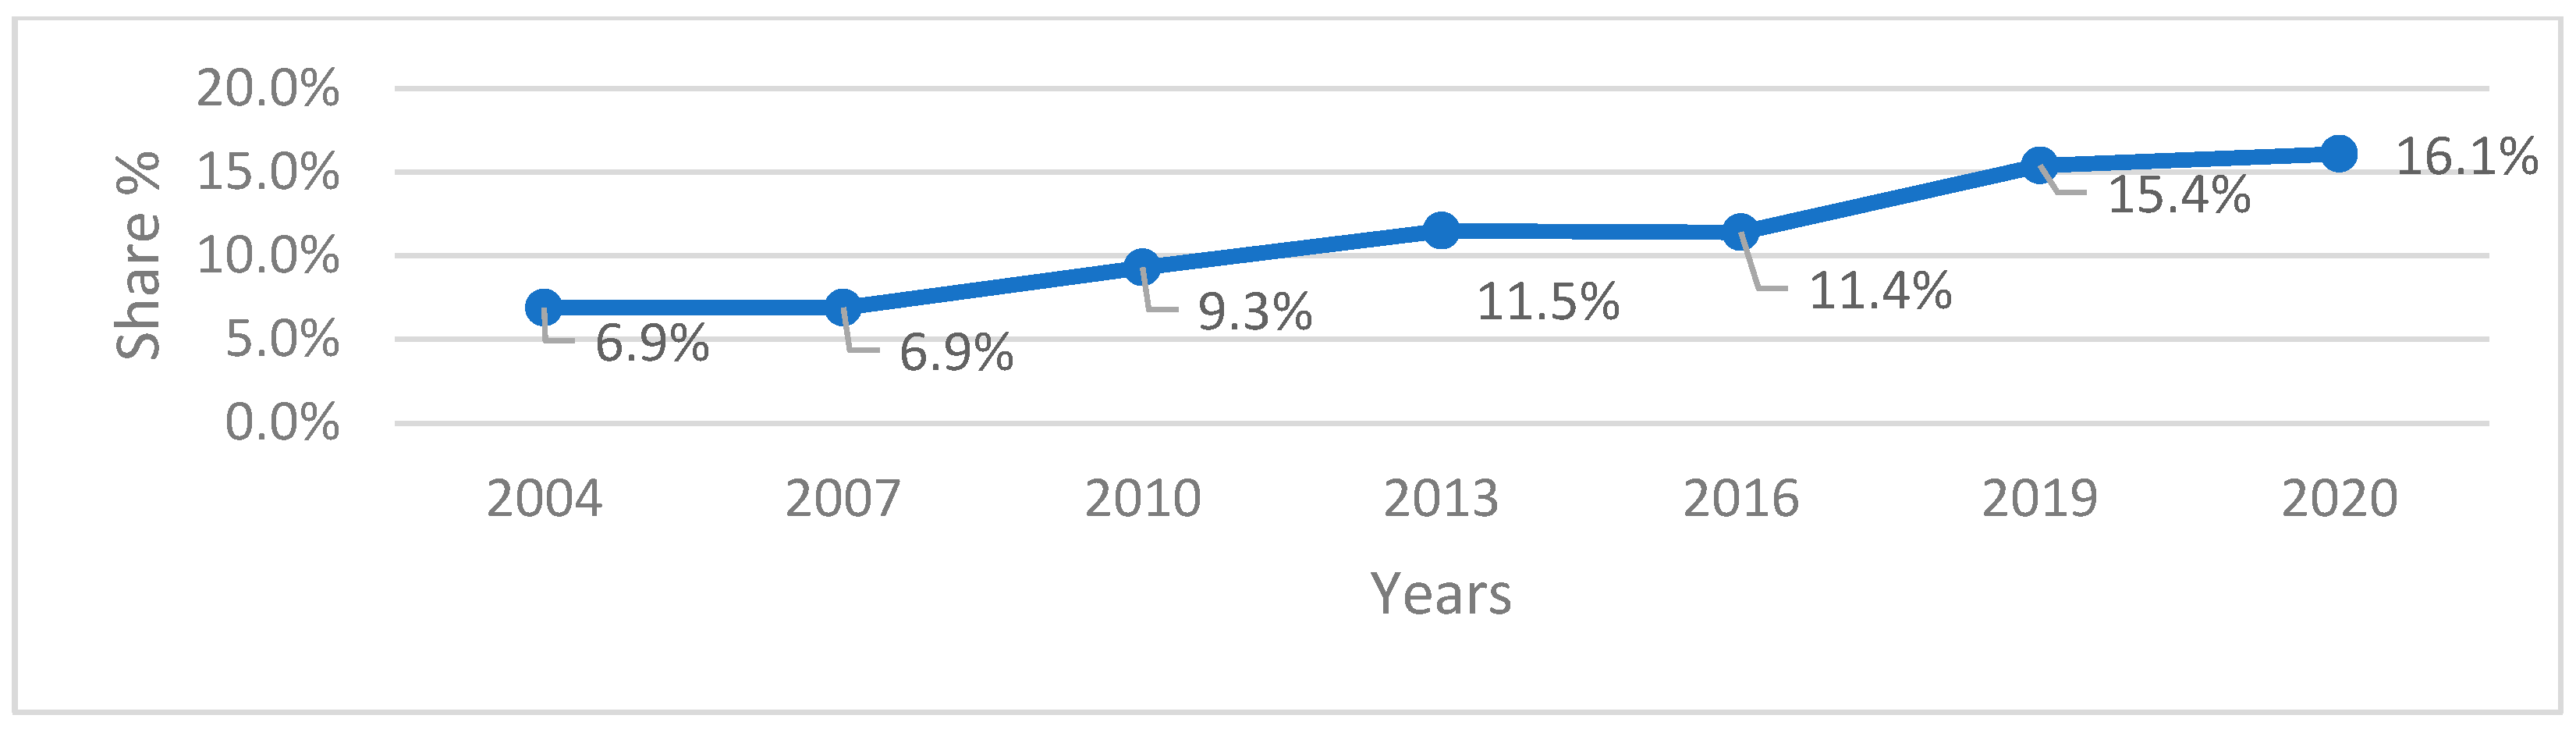
Upon analyzing the data in
Figure 2, it is evident that over the last 16 years, the share of renewable energy in Poland has been consistently increasing, and this trend continues to grow. From 6.9% in 2004 to over 16% in 2020. This means an increase of almost 10%.
Logistics also follows the development of renewable energy sources, incorporating innovative solutions into its operations. Transportation deserves special consideration. Data published by the Central Statistical Office reveals that from 2009 to 2020, there has been a growing interest in the utilization of energy from renewable sources in the transport sector, with minor fluctuations over the years (
Figure 3). In 2009, it was 5.41%, and in 2020, it was 6.58%. A slight decline was recorded in 2015–2018, with the worst result in 2016 (3.97%) and then a rapid increase to 4.23% in 2017.
The main advantage of using renewable energy for transport is reducing the demand for crude oil. Biofuels effectively substitute diesel and gasoline, contributing to the increase in the number of vehicles powered by alternative fuels. To further encourage the replacement of conventionally powered vehicles with unconventional ones, the European Union has offered subsidies for the purchase of vehicles utilizing renewable energy sources. At present, electric cars, powered by solar energy through the use of micro photovoltaic installations at home, have gained considerable popularity. In addition to vehicles for private use, many logistics companies are also recognizing the importance of transitioning to vehicles powered by renewable energy. It in the field of logistics, courier companies have one of the largest shares in the transportation sector. An example is the GLS company, which has been actively involved in a wide array of pro-environmental activities by implementing the Think Green initiative since 2008. The e-commerce industry is a leader in the adoption of renewable energy, notably exemplified by InPost. It created the “Green City” program, under which it is expanding the parcel locker network with machines powered exclusively by solar energy.
Courier services involve the collection of parcels from a sender (point A) and their delivery to a recipient (point B). The elements that create such a service are price (the cost charged by the courier company for delivering the parcel), deadline (the specified timeline for the service, which includes the date of collection from the sender and the delivery to the recipient), and quality (delivery of an undamaged parcel, and in the event of damage during transport, the courier company is responsible for covering the cost of damages). The courier sector is abbreviated as KEP (Courier–Express–Parcel). The services provided encompass courier, express, and postal shipments, mainly for parcels weighing up to 31.5 kg. Courier and postal services share similarities in their application. In the first case, the difference lies in the choice of additional options, such as tracking the shipment’s route or selecting the preferred delivery date (including the day and time) for courier shipments. Additionally, many courier companies offer the flexibility for recipients to make further changes, such as redirecting the parcel to an alternate address or choosing a different delivery date or time, up to 24 h before the scheduled delivery, notifying the recipient via e-mail. The range of additional services provided by courier companies (KEP) continues to grow, as they strive to maintain a competitive edge in the domestic parcel delivery market. This is extremely important because the dynamic development of the Internet and the COVID-19 pandemic contributed to the expansion of e-commerce. At the same time, this has driven the growth of the courier industry, as illustrated in
Figure 4.
Upon analyzing the data presented in
Figure 4, it is evident that the value of the KEP market has been on the rise from 2014 to 2023, from PLN 272.7 million in 2014 to PLN 847.8 million in 2023. This suggests that the number of delivered parcels is increasing every year. Consequently, KEP enterprises must keep pace with technological advancements and continually introduce new technical solutions designed to enhance their services. The creation of modern terminals and sorting facilities has shortened the shipment supply chain process. This, in turn, has allowed for the provision of services with shorter lead times, which is very important for the end recipient. There has also been progress in the methods of collecting parcels, cashless payments are becoming increasingly popular, and the network of parcel lockers and collection points is expanding dynamically. The factors that are driving the development of KEP services include the pressure to reduce outstanding inventories, the rapid growth of online shopping, and the evolving concept of retail sales [
20,
21]. Furthermore, courier companies are incorporating Intelligent Transport Systems (ITS) and low-emission vehicles into their transportation and organization processes. ITS systems allow for efficient route planning and service area optimization, helping couriers deliver parcels with maximum efficiency while minimizing the distance traveled. Car manufacturers believe that the number of electric cars intended for courier companies will increase due to the rising demand for courier services. They are preparing to comply not only with the regulations stipulated in the Electromobility Act (mandating that, from 1 January 2022, companies fulfilling social, municipal, or government contracts must have a 10% share of electric cars in their fleets) but also to address the growing demand for e-services from customers for whom deliveries via electric vehicles align with their environmental views. A good example illustrating the growth of electromobility within the courier market is the Voltia company in London. They found that for each kilometer traveled around the British capital, Voltia’s cost was 1.8 pence, whereas diesel vehicles cost 2.8 pence per kilometer. Therefore, the operational expenses for Volitia’s electric fleet were roughly 20% lower compared to their diesel counterparts. Furthermore, the e-vans delivered an average of 34% more parcels over the course of a week compared to smaller vehicles powered by conventional fuels. The company calculated that 112,000 electric cars could replace 218,000 diesel vehicles. Another case showcasing the development of electromobility is Elocity, a leading EMP (electromobility provider) in Poland, which continues to expand its services related to electromobility for the logistics and KEP sectors. Their first and largest client in this area was DPD (courier services), very well known in the Polish market. In mid-December 2021, Elocity managed DPD’s infrastructure, which included over 100 electric vehicle charging stations. They optimized the charging process and provided necessary reports to increase the efficiency of courier operations. Elocity’s client portfolio also includes GLS, another prominent company in the Polish courier services market. In 2021, Elocity developed a comprehensive electromobility system for GLS, which included the construction and enhancement of their own charging station infrastructure, the management of these stations, overseeing the car charging process, cost optimization, and efforts to increase the efficiency of their electrified fleet. Additionally, GLS can proudly announce the expansion of its fleet with 100 new electric vehicles by the end of 2022. In October 2022, the initial delivery included a series of 21 Ford E-Transit 350 vehicles. These cars can be charged in approximately 30 min and have a range of 260 km. The management board of GLS plans to have at least 50% of their fleet vehicles with low- or zero-emission drives by the year 2030, and starting in 2035, every newly added transport vehicle will be required to meet these conditions. In addition to adhering to exhaust emission standards, these vehicles are also equipped with many safety and driving systems. These include parking sensors, cameras, collision avoidance systems with automatic braking, and a lane departure warning system. These are just a few of the systems that are currently installed in such cars. DHL Express is also pursuing the decarbonization of its fleet in Poland. By 2025, 60% of their courier vehicles will be electric. As of the end of 2021, electric vehicles were already operating in Szczecin, Gdańsk, Olsztyn, Poznań, Warsaw, Wrocław, Lublin, and Rzeszów. By 2025, DHL Express aims to have over 200 of them across Poland. Initially, the company opted for the Volkswagen e-Crafter, featuring a 120 km range and a payload capacity of 837 kg. In 2021, InPost’s electric fleet exceeded 300 cars, including more than 250 Nissan e-NV200s and 10 eSprinters from Mercedes Benz. InPost’s parcel lockers are already considered the most environmentally friendly delivery methods, reducing CO
2 emissions by up to 75%. Transitioning the courier fleet to electric cars further minimizes the negative environmental impact of e-commerce logistics [
22,
23,
24,
25,
26].
3. The Application of Electromobility in the Courier Industry through a Specific Case Study Utilizing AHP Analysis and Computer Simulation
In the research section of the article, the focus was on conducting studies following the steps below:
Step 1—Identifying the studied object;
Step 2—Identifying the research problem;
Step 3—Collecting input data for the study;
Step 4—Selecting a method for analysis;
Step 5—Applying the chosen method and verifying the result;
Step 6—Analyzing the possibility of adapting the obtained solution to the company’s operation;
Step 7—Modification of existing routes;
Step 8—Drawing conclusions.
Step 1—Company description;
Step 2—The need to purchase electric vehicles for a courier company.
The examined company is a mid-sized courier service provider operating within Poland. Until recently, their entire fleet comprised conventionally powered vehicles. However, over time, technological progress and the widely promoted environmental trend focused on reducing pollutant emissions, the company opted to make changes and purchase non-conventional vehicles. The potential for electric vehicles is constantly growing, not only in the realm of passenger cars but also in the domain of delivery vans. The market is developing rapidly and dynamically, offering a wide range of opportunities. While this phenomenon is positive, it necessitates thorough analysis before making a vehicle purchase. Several factors will play an important role, including the range on a single charge. The analyzed company reviewed the market in terms of available electric vehicles and identified four types in which they held potential interest. They then established the basic parameters to guide their final selection, as outlined in
Table 3, where the features for the electric vehicle models participating in the study are included (these features are standard features provided on the manufacturer’s website or in catalogues). For the purposes of this article, the names or brands of specific cars are not disclosed and are instead denoted as A, B, C, and D. However, all their data have been taken from the manufacturers’ websites and are consistent with reality. All models were considered with identical, standard equipment. Four vehicles that were readily available for purchase at the time of the research were selected for the study. There are waiting times of approximately one year, sometimes longer, for other models. Given the company’s wish to acquire an electric fleet fairly quickly, emphasis was placed on models that would be available in the near future.
Step 3—Collecting data on potential electric vehicle models available on the market in terms of their availability (available as soon as possible), verifying the routes carried out by the courier company in terms of mileage covered, and working hours.
Step 4—Selecting the AHP method due to the diversity of adopted electric vehicle features.
To select the most suitable delivery vehicle for the examined company, an AHP (analytic hierarchy process) analysis was performed. This method allows you to select the best solution for criteria that are difficult to compare (e.g., different units of measurement) of a given object or research objects. The indicated test criteria are included in
Table 3. It can be noticed that their parameters are different, so the use of the AHP method will allow them to be compared, to carry out the method, and to select the best solution, despite the different features. Given the company’s specific nature, it considered not only the price of the vehicle but also the cargo space. The vehicle needed to be as versatile as possible since the company cannot predict what the customer may order or wish to send. Before procuring an electric car, it is essential to determine its purpose. If it is for short-distance driving, the range may not be critical. However, for longer distances, range becomes crucial. Therefore, it is essential to begin by determining what distances the vehicle will be covering. Price is another significant factor to consider. Unfortunately, electric cars are still expensive. Charging time is another important criterion. If a company has its own charging infrastructure, the vehicle can be charged on-site after a full day of work. Cargo space, in terms of payload capacity and size, is vital for the courier market. Each company will prioritize these features according to its specific needs. In situations where the criteria are diverse, the application of the AHP method is necessary. In the first step of this analysis, a hierarchical structure is created by formulating the problem (vehicle selection). The next hierarchy stage involves elaborating (determining the number of criteria, vehicles, etc. (see
Table 3)) and assigning criteria designations (
Table 4). The next step is assigning the criteria’s order of importance (
Table 5) according to the previously established scale. Then normalize the criteria (
Table 6). Subsequently, in the final phase, mutual preferences regarding the criteria are determined (
Table 7). In the last step, criteria are normalized (
Table 8). The final result can be derived from the obtained data (
Figure 4). The critical parameters that must be taken into account are summarized in
Table 4 and described using specific criteria (C1–C7). This table is intended to present the echoes for the vehicles participating in the test in the form of criteria.
Step 5—Conducting the AHP method step by step and finding the winner in the results.
Seven car parameters were adopted as criteria, which were subsequently arranged in a hierarchical structure and compared in the criteria priority matrix according to the procedure used in the AHP method using specific priorities described in
Table 5.
The matrix table was normalized the results were given numerical values (
Table 6).
The next step was to determine mutual preferences regarding individual criteria and carry out standardization (
Table 7).
The next step was to normalize the preference matrix according to the C1–C7 criterion (
Table 8), which means assigning numbers (from the data obtained from
Table 7) to all criteria.
As a result of the AHP analysis conducted in this manner, a winning vehicle for the examined company emerged (
Figure 5). This outcome was determined by calculating what percentage of the total (100%) represents the sum of the averages obtained for all criteria of a given vehicle. The winner is the one that achieves the highest score. Consequently, vehicle A obtained 26%, vehicle B scored 27%, vehicle C scored 22%, and vehicle D achieved a score of 25%. According to the previously adopted labels, the vehicles are classified as A, B, C, and D.
The obtained classification shows that vehicle B is the best choice. It stands out for its battery capacity, offering a considerably lower price compared to vehicle C. With a range of 220 km on a single charge, it is versatile for both urban and suburban use. Additionally, it also has the highest payload capacity among all the proposed cars, which gives greater opportunities to optimize courier routes. The examined company operates in Warsaw and its vicinity. Several regions were selected for the research to assess whether electric cars will be suitable for their operation, even if it required reorganizing courier routes, which is an indispensable element of this industry. The surveyed company provides services in a total of 35 regions, each with an average of five routes. For the purposes of this article, five regions (and their respective routes) were selected, encompassing those where, under the current planning, electric vehicles may not be suitable, necessitating route reconfiguration. Out of all 35 regions, only 4 require route reconfiguration, while the remaining 31 can be served by both conventional and electric vehicles without any modifications. These regions are marked with numbers from 1 to 35, with the routes labeled according to their respective region numbers. Six examples of regions considered for the study are presented in
Table 9. The data include the regions served by the company, and for each region, the average number of kilometers and the maximum number of kilometers. The table indicates those regions whose number of kilometers significantly exceeds the possibilities of using an electric vehicle.
Step 6—Analyzing the use of the selected electric vehicle for the currently operated courier routes in terms of the distance covered. If all routes could be completed by electric vehicles without modification, the study would be considered complete, and we could proceed to the summary. If the routes require modification, the next step is to use the computer program employed by the company and adjust the routes accordingly.
4. Results
Step 7—From the set of all regions, two were identified as requiring modification. A computer simulation was carried out to adjust the existing routes within these regions to accommodate electric vehicles.
Upon analyzing the data presented in
Table 9, it is evident that two of the presented regions (regions 13 and 24) are not suitable for electric vehicle service and require modernization. Apart from the routes covered by couriers, it is crucial that the vehicles have adequate payload capacity. According to the data collected by the company, as the distance to be traveled increases, the number of parcels that need to be transported increases too. Therefore, it is imperative to focus on the average weight of parcels being transported. However, this is a subject for further research. This article primarily focuses on ensuring safe route travel in terms of the number of kilometers covered. A simulation was performed to determine the necessary quantity of electric cars, ensuring that drivers’ work does not require continuous driving throughout the day, and that the allocation of parcels is both equitable and efficient. The optimization factors considered the maximum working time of drivers and a 30-min break. The simulation was executed using IT software (Trucker 1.0) utilized by the examined company. Computer simulations in the program were performed to modify the routes currently covered by conventionally powered vehicles, adapting them to electric vehicles and their capabilities, i.e., the range they have. Since it was necessary to make changes to the currently existing routes (shortening them and adding new ones) so that electric vehicles could easily cover the designated routes, the current routes were optimized and new needed routes were created, and some of the current ones were modified by shortening them. Such actions were necessary to prove that electric vehicles can replace conventionally powered vehicles for the courier market, without lowering the standards of company operation and customer service and maintaining service to current regions. Computer simulations were conducted for research purposes. The routes listed in
Table 9 were uploaded into the program, which allowed for the calculation of the time a driver needs to complete each route and the distance for each individual route. The next step involved identifying routes that might not be feasible for the selected electric vehicle based on the AHP analysis. The program has the ability to restrict working hours and distances for each route. Consequently, in the following phase, it was stipulated that the vehicle could cover a maximum of 200 km within the manufacturer’s declared range of 220 km. An additional allowance was included to account for energy consumption in activities other than transportation, such as vehicle heating, cooling, radio use, lighting, and more. As a result of these imposed constraints, the system adjusted the routes to remain within the 200 km limit and generated new necessary routes in specific regions, ensuring that the courier could reach all scheduled points. The computer system has an optimization function to select the shortest routes in terms of time and distance while fulfilling all orders simultaneously. The results are presented in
Table 10. They contain information about regions, namely, courier’s start time, courier’s end time, courier’s working time, and kilometers traveled by the courier. It is worth noting that the data for the simulation must be highly detailed, encompassing not only information about the driver’s working time but also the road speeds at which the vehicle will travel, adhering to road traffic regulations. As a result of these simulations, the routes were optimized to ensure they did not exceed the car’s permissible mileage.
Figure 6 and
Figure 7 present, in the form of a chart, the differences between the regions where it was necessary to change the routes. These changes resulted from the distances to be covered being too long, and it would not be possible to complete them with electric cars. The regions that changed were 13 and 24.
Figure 6 illustrates how the times in regions 13 and 24 changed before and after optimization, and
Figure 7 for the same regions illustrates how the distances covered by couriers changed.
Step 8—Drawing conclusions.
Upon analyzing the data presented in
Table 10 and
Figure 6 and
Figure 7, it is evident that it is possible to plan routes in a manner that makes them suitable for travel by electric cars. The company should consider whether the adoption of such vehicles will prove to be profitable for them. Among the surveyed regions, it is observed that one of them has a scheduled route commencement at 10:00, which is clear from pronounced morning traffic congestion in the city center. Consequently, the start of work for this region was adjusted to an hour later than the standard 8:00. Additionally, each region, as a result of optimization, has achieved a substantially reduced number of kilometers covered, with no route exceeding the 220 km range limit of an electric vehicle. All drivers stay within their designated working hours, and after optimization, the timeframes have been reduced. For region 13, the time shared by all drivers has increased from 35 h and 16 min to 34 h and 21 min, signifying a reduction of 55 min. This translates to an average reduction of approximately 8 min per route. For region 24, the working hours have been reduced from 36 h and 17 min to 34 h and 56 min, resulting in a decrease of 1 h and 21 min, or, on average, 12 min per route. While the observed reductions in times are not very large, the number of routes for each region has increased. Based on the simulation performed, as indicated in
Table 10, two new routes have been added for regions 13 and 24, which requires the inclusion of not only two extra vehicles but also two additional drivers. It is important to keep in mind that the utilization of a larger fleet of electric vehicles has a positive impact not only on the environment but also on the efficient distribution of routes. Further research endeavors should focus on optimizing cargo space usage and exploring opportunities for company growth by expanding the number of vehicles. This will enable the use the electromobility in a courier company to deliver an increasing volume of parcels, optimizing drivers’ working hours and cargo capacity.
5. Discussion
Replacing conventionally powered vehicles with electric cars in large enterprises involves certain risks. Despite the rapid development of electromobility, potential investors still harbor reservations about whether the costs of procuring electric cars will bring tangible profits over the long term. Furthermore, the actual ranges on a single charge in many industries and service sectors often fall short of meeting the demands of companies. Due to the sustainable development policy introduced in its units, the examined company is also testing several models of delivery vehicles, covering routes that span from a relatively short distance to the maximum range declared by the car manufacturer on a single charge. In preparation for the widespread adoption of electric cars, it is necessary to assess the risks and potential adverse impacts, which the company carried out prior to the deployment of the selected electric vehicle. At present, the company has partially incorporated electric vehicles into its operations, but conventionally powered vehicles have not been entirely phased out. The gradual integration of electric vehicles within the examined enterprise suggests that the cars available in the market can indeed be used in the KEP industry. However, proper route optimization is imperative, adapted to any limitations that may arise during operation. Car charging takes place on the company’s premises, and there are future plans to establish a photovoltaic farm. The current installation is relatively small but meets the needs of electric vehicles. Out of the 35 supported regions, only 10 are operated by electric vehicles. However, it is expected that the electric fleet will expand in the future. In the current regions where electric cars are currently deployed, there have been improvements in the analyzed parameters, including the number of kilometers traveled and courier working hours, despite the need to increase the number of routes in specific regions. The progress in electromobility is evident year by year, which means that in the coming years, vehicles may offer much longer ranges and operating times on a single charge, greatly facilitating the operations of the KEP industry. Nevertheless, it is crucial to bear in mind that larger batteries can lead to longer charging times, highlighting the importance of a thorough analysis of specific needs before acquiring an electric vehicle. Not all regions will necessitate extended coverage. Many courier companies have ambitious goals that translate into concrete actions, but it is undeniably the case that conventional-drive vehicles will continue to dominate our streets for a considerable time before low- or zero-emission alternatives become more widespread. The examined company aims to electrify its fleet. Currently, it has 20 electric vehicles in its inventory. Before route optimization, the number was smaller than required to serve all the studied regions (25 routes before optimization, 29 routes after optimization). The company has adopted a policy of systematic changes in its fleet. When examining the expenses involved (the cost of procuring vehicles and the hiring of new personnel), they must be balanced against the profits. While selecting a vehicle using the AHP analysis, it can be noticed that despite significant differences in price, range, and charging time, the obtained results are not highly divergent. Therefore, it is essential to consider whether to conduct further in-depth research and analysis to refine the selection of transportation means, aiming to obtain a clear and substantial solution. In the Polish market, numerous courier companies are electrifying their fleets at a much faster pace, including InPost, which currently owns 1000 electric vehicles. The operator calculated that in 2022, nearly 30 million parcels were delivered to recipients using electric cars. In 2021, the DPD company purchased 50 electric cars, and this number is continually growing. This clearly demonstrates how the courier market is striving to replace conventional fuel-powered vehicles with unconventional ones.
However, it is worth noting that the research in this article had certain limitations, including the selection of the means of transportation. Only four specific models were considered, rather than all the vehicles offered by manufacturers. This narrowing of criteria was conducted to prioritize vehicles that are readily available in the market. The simulation studies carried out in the computer program, which is part of the company’s equipment, have demonstrated the potential of using electric vehicles on specific routes. The next step should involve testing and comparing the simulation data with real-world data. Nevertheless, the data obtained are extremely important and form the basis for concluding that electric vehicles are well-suited for fulfilling tasks in courier companies [
33,
34].


