Review

The Online Assessment Tools of the MenPas 1.0 Platform, a Reliable and Sustainable Alternative for Psychosocial Research: A Literature Review

by
Nuria Pérez-Romero
1,
Verónica Morales-Sánchez
2,
José L. Pastrana-Brincones
3,4,
Carolina Sánchez-García
2,
Antonio Hernández-Mendo
2,
Coral Falcó
5 and
Rafael Enrique Reigal
2,*
1
Exercise and Rehabilitation Sciences Institute, Postgraduate, Faculty of Rehabilitation Sciences, Universidad Andres Bello, Santiago de Chile 7591538, Chile
2
Department of Social Psychology, Social Anthropology, Social Work and Social Services, Universidad de Málaga, 29071 Málaga, Spain
3
Computer and Information Sciences, University of St. Thomas, St. Paul, MN 55105, USA
4
Departamento Lenguajes y Ciencias de la Computación, Universidad de Málaga, 29071 Málaga, Spain
5
Department Western Norway, University of Applied Sciences, 5063 Bergen, Norway
*
Author to whom correspondence should be addressed.
Sustainability 2023, 15(22), 15908; https://doi.org/10.3390/su152215908
Submission received: 31 August 2023 / Revised: 28 October 2023 / Accepted: 1 November 2023 / Published: 14 November 2023

Abstract

:
New technologies have improved the efficiency and sustainability of psychosocial research. However, online assessment tools may differ from traditional paper-based ones in different domains. This study aims to provide an updated perspective of the online assessment advantages of a psychosocial platform called MenPas 1.0. A literature review was conducted, choosing validated questionnaire studies located in the MenPas 1.0 platform, specifically, motivation and hypnosis questionnaires. A total of five studies showing the psychometric properties of psychosocial evaluation tools were analysed and compared with their previous paper-based studies. In addition, internet impact over the last 20 years was analysed according to gender, age, nationality, and employment status. Finally, a conclusion was drawn on the impact of these tools on sustainability. The results showed that online studies have a higher number of participants (5866 users in 5 studies versus 5623 participants in 11 studies) and higher reliability rates than those of previous paper-based ones. A decrease in the social gap over the years was also found and the contribution of online tools to sustainability was discussed. This study could show the importance of the analysis of psychometric properties in online tools, the need for further research, and encourage their use in psychosocial assessment.

1. Introduction

Information and communication technologies (ICTs) are pervasive in all aspects of life [1]. In education, there has been a noticeable shift towards the “digital era” or “information era”, as noted by Loveless and Williamson [2]. In the field of psychosocial research, this idea could be assumed to approach a more proximate context that represents today’s world. In fact, the use of new technologies for research is growing exponentially [3,4,5]. Additionally, factors like the COVID-19 pandemic have led to an increased reliance on ICTs in scientific endeavours [6,7,8,9], though this is not the sole driving factor. The use of ICTs, in general, presents advantages that favour the recommendation of their use. These include access to a greater amount of data [10,11] and greater educational and social development if there are optimal conditions for access [12]. Also, audiovisual communication can be produced in real time from different parts of the world [13], as well as virtual interactivity through social networks [14]. In the field of research, more and more research investigations are using digitally formatted tools as their main resources for intervention and data collection due to their benefits [15,16,17,18].
Among these advantages is the ease of collecting data from large samples without significant time investment [19]. This can be conducted from various geographical locations due to globalization and the prevalence of the current information society [20]. Also, thanks to these tools, it is possible to perform an immediate recording of the responses and, in particular, corrections and feedback [21]. New technologies also allow for online collaboration between researchers from different parts of the world. This can improve the quality of research by allowing researchers to work together on projects that otherwise could not be carried out [22].
Another aspect is the difference in psychometric properties that may arise. González-Ruiz et al. [19] demonstrated that the use of psychosocial assessment tools leads to a reduction in socially desirable responses, primarily owing to the increased anonymity inherent to their utilization. In addition, they point out that these procedures make it possible to generate dynamic scales on the collected data, which could increase adaptation to the constant changes that populations undergo throughout generations. Generally, digitized tools, and specifically online questionnaires, have variable reliability [23]. Despite the potential for broader sample access [24], users may require training in the use of computerized tools [25]. However, digital tools may contribute to more efficient data collection, as they can be configured to identify random, insincere, or erroneous responses [24]. In any case, care should be taken with some issues that could impair the data collection process, such as the possible abandonment or ignorance of some variables that could influence the responses given during the performance of the task [20].
To validate studies conducted with computerized tools, two approaches can be employed [26]. Firstly, one can compare two identical studies, each employing a different data collection methodology (e.g., online vs. traditional) using the convergent validity method. Secondly, one can theoretically assess whether results align with specific trend predictions, employing a construct validity method [26]. Moreover, as the data are digitized, different researchers can perform the same analyses, contrasting commonalities and differences. While it is true that some digitized questionnaires are being utilized in research, a validated scale has not yet been established for such digitized instruments, which could introduce bias into the data [27]. Although they have multiple benefits, online tools are not free of disadvantages. For example, they may lead to an increased risk of inequality and social exclusion [28] or result in the acquisition of low-quality or even erroneous information [29]. Furthermore, there is a heightened tendency to procrastinate responsibilities by delegating the resolution of tasks to more automated processes [12]. Hence, biases may arise during data collection through new technologies and should be considered [30]. For example, data samples collected through a social network may be biased toward certain demographic groups. In this regard, previous studies have highlighted the digital social divide that the use of online tools may entail [19,31,32]. However, the contemporary social context offers the possibility to transcend temporal and spatial barriers, since nowadays, most people have access to the internet [33].
On the other hand, an important advantage of such tools is their positive impact on research sustainability. According to a report by The Climate Group on behalf of the Global eSustainability Initiative (GeSI) [34], ICTs could contribute approximately 7.80 gigatons of carbon dioxide emission savings (15% of total emissions) by 2020. In Spain, according to the Report of the General Directorate for Environmental Quality and Evaluation of the Ministry for Ecological Transition and the Demographic Challenge [35], there have been respective reductions of 5.30% and 37.90% since 1990 and 2005 in greenhouse gas emissions. These emission reductions can be attributed to decreases in transportation emissions, a decreased energy demand, and the utilization of renewable energies [34]. Likewise, tree felling and timber extraction represent another environmental problem, contributing to a significant risk of deforestation in tropical and subtropical regions [36]. The use of online tools could potentially mitigate this issue, subsequently impacting Goal 15 of the Sustainable Development Goals outlined in the 2030 Agenda [37]. This goal aims to advance scientific research, enhance the technological capacity of industrial sectors across all nations, and foster technological innovation.
Specifically, within the field of applied sport psychology, the use of online assessments has spread, thanks to the development of different platforms such as MenPas 1.0, which has experienced an increase in its use since the COVID-19 pandemic [20]. This platform acknowledges the methodological differences between paper-based and online tools and, consequently, strives to validate the tools it hosts. Areas that have already been validated include assessments of hypnosis, motivation, and attention. These areas have been shown to hold significance in the context of sports and physical activity [38,39,40,41,42,43]. Regarding the reliability of online tools compared to their paper-based counterparts, the studies by Franquelo et al. [38,39], which validated the online version of the Valencia Scale of Attitudes and Beliefs toward Hypnosis (therapist version and client version), found that online measures were equivalent in terms of reliability to paper-based versions. These findings suggest that online tools may serve as a viable alternative to paper-based tools in terms of the reliability of their psychological measures.
It is worth mentioning the additional advantages of online tools; Hernández Mendo and Ramos [44,45] proposed the usefulness of new technologies for the development of objective and standardized tools for the evaluation and training athletes’ attention. Furthermore, there is an interest in enhancing the quality of the evaluation and training tools available in sport psychology. The authors emphasize the need to develop more precise and effective methods for evaluating the attentional skills of athletes and the influence of these skills on their sport performance. In this sense, these tools could be susceptible to receiving more enhancements than those on paper, allowing for the analysis and implementation of more diverse areas [46]. A clear example is the conceptual revolution caused by the Grid 1.0 attention tool, which, in its beginnings on paper [47], had to be consistently delivered in the same manner, but its transition to a digitalized version facilitated the tool’s adaptation, offering capabilities such as number randomization, the selection of various row and column sizes, and the choice of background colours or distractors [19].
Among all the questionnaires and instruments contained in the platform, five of its questionnaires have been validated in recent years. These questionnaires include two areas of sport psychology motivation (Task and Ego Orientation in Sport Questionnaire (TEOSQ), Psychological Needs Satisfaction in Exercise Scale (PNSE) and Perceived Motivational Climate in Sport Questionnaire-2 (PMCSQ-2)), and hypnosis (Valencia Scale of Attitudes and Beliefs Towards Hypnosis (client version) (VSABTH-C) and Valencia Scale of Attitudes and Beliefs Towards Hypnosis (therapist version) (VSABTH-T)) [38,39,41,42,43] These questionnaires were validated from previous paper-and-pencil versions, and all showed good properties. The TEOSQ is composed of 13 items and 2 dimensions that assess Task and Ego orientation in sport; the PNSE includes 18 items in 3 dimensions that evaluate competence, autonomy, and relatedness; the PMCSQ-2 has 24 items in 2 dimensions of ego and task involvement; and the VSABTH has two versions (client and therapist) with 37 items and 8 dimensions (Help, Control, Magical Solution, Interest, Collaboration, Fear, Memory/Trance, and Marginal).
While ICTs continue to expand, many studies have focused on educational strategies and the evaluation of academic activities [48,49]. In the field of psychosocial assessment, there have been some studies comparing positive and negative aspects, but many are over a decade old [50,51,52] or discussed the benefits of online tools without evaluating their paper-and-pencil versions [20]. Additionally, some cases refer to evaluations made with ad hoc instruments, but do not mention validated online questionnaires [53,54]. Another study compared online and paper versions of personality instruments [51]. But, so far, few psychosocial assessment platforms have shown the psychometric properties of their questionnaires if these have already been validated in their paper version. In view of this, it is necessary to update the possible advantages offered by online questionnaires in the psychosocial field. In addition, it is important to revise the need to perform psychometric analyses on them, even if their structure has already been validated in their paper-based ones.
Therefore, given the significance of online research and the imperative to further advance it, this study aims to offer a descriptive view of some of the advantages of this type of tool (efficiency in sample collection, improved reliability, and sustainability) and of one of its drawbacks (computer social gap) that has been improved year by year. In this way, we intend to offer preliminary evidence to promote the use of these tools and the analysis of their psychometric properties in comparison to traditional paper and pencil tools through the results of some studies that have validated online tools within sport psychology. This study aims to motivate researchers to validate questionnaires and online instruments even if they consist of a limited number of items, or even if they are created using platforms like Google Forms.

2. Materials and Methods

2.1. Procedure

A literature review was conducted using the SALSA method (search, appraisal, synthesis, and analysis). Then, the search included non-comprehensive searching, using only articles of the MenPas 1.0 platform; the appraisal did not include a quality assessment; the synthesis was conducted in a descriptive and narrative way; and the analysis was performed conceptually [55]. The eligibility criteria included validated questionnaire studies found on the MenPas 1.0 platform and their corresponding paper-based versions. The procedure was based on accessing the MenPas 1.0 platform and extracting all the validation elements of the questionnaires from the web platform. After this, each of them were reviewed and the previous validation articles on which these studies were based were extracted. Data on sample efficiency and reliability were collected through the information provided by the different articles. In order to analyse the social information gap, data collected from the National Institute of Statistics (INE) were taken into account.

2.2. Data Analysis

A descriptive analysis of the different variables involved in the reliability and sustainability of the online assessment was carried out. For this purpose, firstly, data related to the sample size and number of papers used in each study were collected. Secondly, the reliability coefficients of the different questionnaire validation studies, both online and paper-and-pencil, were described. On the other hand, results related to internet use were reflected by the means of the mean, standard deviation, percentages, and frequencies of the different variables of the study (gender, age, nationality, and employment status) and their possible relationship with the computer social divide. Finally, the previous results were considered to assess the possible impact on the carbon footprint in the discussion. Microsoft Excel 2016 and IBM SPSS Statistics version 23 (IBM, Armonk, NY, USA) were used for the data analysis.

3. Results

The results will be presented under three headings that could highlight four advantages and one disadvantage of using online tools. These four areas are: the efficiency of sample collection, the improvement of reliability, the informatics social divide, and the reduction in the carbon footprint. The latter is shown from the results of the previous three and will be detailed in the discussion.
In order to show the differences between online and paper-and-pencil tools, five questionnaires from MenPas 1.0 in which both type of tools exist were considered, and their validations were considered. As mentioned in the introduction, these questionnaires included two areas of sport psychology motivation (TEOSQ, PNSE, and PMCSQ-2) and hypnosis (VSABTH-C and VSABTH-T).

3.1. Efficiency of Sample Collection

A comparison was made between online studies and their paper and pencil versions. Firstly, a breakdown of the sample size for each study can be found, compared to previous versions of the same questionnaire carried out in its paper version (Table 1). As can be seen, the total for the online version reached a sample size of 5866 for all five studies, while for the paper-and-pencil version, a total of 5628 was reached using eleven studies.
Taking into account the five online version studies, a total of 5866 participants were collected: 2320 for the first article [41], 1050 for the second [42], 1637 for the third [43], 705 for the fourth [38], and 154 for the last [39]. This amount was considered in the application of the equation offered by González Ruiz [31], which allows for calculating the percentage of paper savings. This equation calculates the number of questionnaire items per sheet by the number of items per page, multiplied by the weight of a page. In order to collect the socio-demographic data and questionnaires used in these studies, an estimated 11.732 sheets of paper would be needed (Table 2). That is, two sheets of paper per person, giving a total of 938.56 kg according to the standard dimensions and weight of a DIN A4 sheet of paper (210 × 297 mm, 80 g each sheet).
Except for paper expenditure, no exact results are shown due to the difficulty of not having been quantified, not being the main objective of these studies. However, the report by The Climate Group on behalf of the Global eSustainability Initiative (GeSI) [34] estimated that overall ICT use could achieve a greater energy efficiency (savings of approximately EUR 600 billion in indirect costs).

3.2. Improved Reliability

By comparing the reliability coefficients, the motivation questionnaires found that all three studies in their online version found higher indices than the previous studies performed on paper and pencil, with the exception of ego in [48] and autonomy and relatedness with others in Wilson et al. [58], which present higher indices, and for task in Newton et al. [61], which shows the same result (Table 3).
On the other hand, for the questionnaire dedicated to hypnosis (client version), the online version showed higher indices for all subscales, except for magic, in which a slightly higher index was obtained in the study conducted by Carvalho et al. [62]. For the therapist version, higher indexes were found for memory, interest, magic, and marginal in the paper version [63], as well as the same index for help in both versions. On the other hand, Table 3 also shows the type of analyses performed, finding a preference for Cronbach’s Alpha in the paper and pencil studies over the use of Compound Reliability in the case of the online studies. It should be noted that higher indices were found in studies that used compound reliability compared to those that used Cronbach’s Alpha.

3.3. Computer Social Divide

Table 4 shows the data provided by the Survey on Equipment and Use of Information and Communication Technologies in Households conducted by the National Statistics Institute (https://www.ine.es/dyngs/INEbase/es/, accessed on 21 February 2023) [65] during the last 20 years, from 2002 to 2022.
The data collected show the percentage of households with internet access and the percentage of internet use by the general population, people aged 65–75, and people over 75 years in the last three months since the conduction of each survey.
These results show the increasing percentage of households using the internet in Spain (Figure 1). In this way, in the last 20 years, the percentage of internet access increased by 78.70%, from 17.40% in 2002 to 96.10% in 2022, while, in the last 10 years, households with internet increased by 28.20%, from 67.90% in 2012 to 96.10% in 2022. As of 2009, more than half of Spanish households owned the internet and, since 2019, more than 90%, reaching almost all Spanish households in 2022.
On the other hand, there is a much lower percentage of older people using the internet compared to the internet use of the general population. Although internet use by this sector of the population has increased over the years, it has ranged from 5.10% to 76.40% since 2006. Thus, it is always differentiated from the general population, creating its greatest approach from the year 2019 (Figure 2). In addition, the data of people over 75 years old are offered from 2019, obtaining rates between 23.40% and 35.90%. In Table 3, we can observe that the difference between internet use by the general population and the use of the population aged 65–75 began to be 48.30% in 2006 and has decreased to 18.10% in 2022.
Finally, in terms of socioeconomic characteristics, the INE presents data related to the completed studies of Spanish inhabitants from 2006 to 2022 (Table 5). These data show a higher percentage of internet use by people who finished their higher education and second-stage secondary studies, compared to those who finished primary school or did not finish their formal studies. In this sense, the illiterate population has, in eight years, shown a percentage lower than 5% (2006–2013), while those who completed secondary education or higher studies did not fall below 85% in the same period.
These data can be seen graphically in Figure 3, which shows that the increase in the use of the internet has developed in a generalized way, reducing the difference between educational levels. However, the illiterate population or those with primary education still have a lower percentage.

4. Discussion

The main objective of this study was to offer a descriptive view of some of the advantages of this type of tool (efficiency in sample collection, improved reliability, and sustainability) and of one of its disadvantages (computer social divide). To this end, some of the results of three studies validating online tools were compared, as well as data provided by the INE. The results showed that online questionnaires are useful tools for sample recruitment. Furthermore, the reliabilities of these versions are optimal. Moreover, in recent years, it can be appreciated that online tools are being widely used, not only improving the access of the whole population, but also reducing environmental impact by being a more environmentally friendly and less wasteful choice of use.

4.1. Efficiency of Sample Collection

Firstly, the results demonstrated that studies conducted online reached a larger sample (5866 participants) with fewer studies (five studies). This contrasted with their paper-and-pencil predecessors, which had 5628 participants across eleven studies. Secondly, when considering the number of participants, conducting these studies in person would have required 938.56 kg of paper and various office supplies, including pens, pencils, and erasers. In contrast, online studies virtually eliminate these expenses through website maintenance. In addition, in person, it would also require the travel of both the evaluator and the person being evaluated.
All of this entails high material, personal, time and financial costs that can have an impact on the carrying out of research or on the awarding of projects by public authorities. As already mentioned, the GeSI report [34] estimated savings of approximately EUR 600.000 million in indirect costs. In this way, the efficiency gains from online studies can be evidenced. However, despite the possible improvement in efficiency, some authors have pointed out that it is more difficult to get participants to complete surveys online than in person [66], so it may not always be useful to use this type of approach.

4.2. Improved Reliability

Regarding reliability, online studies have consistently achieved high indices, exceeding 0.70 [66]. In addition, on all scales except autonomy and relatedness to others for PNSE and ego for TEOSQ, higher ratings were obtained than those of the previous paper-and-pencil versions. This may be an indication of a possible increase in reliability by reducing social desirability, as proposed by González-Ruiz et al. [32]. This was also mentioned by Buchanan in his study, in which he compared online and paper personality questionnaires, with the honesty of those conducted online increasing [51]. However, investigation is required, because the studies did not focus on this aspect. Possible extraneous variables were not controlled for, and the influence of increased reliability could be attributed to differences in the statistical analysis, sample type, or sample size. However, this could also point again to an improved efficiency using online tools. In addition, it is important to highlight that there are other tools in the MenPas platform itself that have demonstrated reliability in their online versions, such as: Rejilla 1.0, a program dedicated to attention training [40]; Modrian 1.0, a desktop program that contributes to the evaluation and training of span attention [67]; Hoisan 2.0, a software tool for Observational Methodology in Natural Environments [68]; and SAGT, a program for the analysis of the quality of data used in observation [69,70].
On the other hand, one of the important aspects of the reliability of these tools is the type of analysis used. While the three online studies predominantly used composite reliability, the paper-and-pencil studies used Cronbach’s Alpha. As [71] pointed out, using Cronbach’s Alpha may influence reliability, as the index is related to the number of items without considering their individual indicators. This could lead to bias in the analysis, whereas Composite Reliability estimates its values based on their loadings. Therefore, the use of Composite Reliability is established as a more appropriate method [72]. These results should be analysed with caution and should be understood as an indication for further research. It would be necessary to conduct controlled studies that directly compare both tools using more homogeneous samples to examine these variables.
Furthermore, utilizing platforms that facilitate this type of assessment can facilitate the development of dynamic scales. This is made possible through features like the generation of z-scores provided by platforms like MenPas 1.0 [20,31]. Thus, following González-Ruiz et al. [32], this type of tool could contribute to the study of measurement stability, using dynamic indicators as opposed to the previously used static ones. For further clarification, the term “dynamic scale” could be defined according to the composition of both terms. On the one hand, scale would be understood as the set of data that allows for interpreting the results of a certain test or tool; in this case, a psychosocial assessment. On the other hand, the term dynamic refers to something that is constantly changing. Therefore, the term “dynamic scale” could refer to the updating of the interpretation of the results according to the characteristics of the sample. In this sense, the use of online tools could allow for the improvement, updating, and streamlining of the ranking process.

4.3. Computer Social Divide

Some authors have pointed out differences in certain sectors of the population in terms of the use of new technologies, indicating this as a disadvantage of the use of online tools [19,20,73]. For example, González Ruiz’s doctoral thesis [32] pointed out the increase in internet usage. However, it also highlighted that a significant percentage of the population still lacked access to it. In the results of the present study, it was possible to observe how internet use has increased in recent decades, as well as the differences presented above all in older people or those with low socio-economic levels.
The results not only show an increase in internet access, as already noted by some authors [62,63], but also an increase in its usage. Additionally, there has been a reduction in the disparity between general usage and that of individuals aged 62–64 and between people from different socio-cultural backgrounds. This could indicate a good reception of the use of digital tools by the Spanish population. Moreover, these data are in line with those shown by Reigal et al. [9], who found an incidence in the use of the MenPas 1.0 virtual platform during the years of confinement (2020–2021). These results are also supported by Sánchez-García et al. [20] in the use of this same platform. There is still a difference between the population sectors mentioned above, and this should be considered when choosing the design and sample collection system of the study. However, it could be concluded that what was presented as a disadvantage of using online tools may no longer be a disadvantage. Nevertheless, it would be interesting to continue promoting the development of tools adapted to this type of population to offer a wider reach for society, although it is important to keep in mind that barriers still exist, as shown in the research of Łaszewska et al. [74], which found a higher representation of adults compared to older adults.

4.4. Reducing Carbon Footprint/Environmental Impact

As mentioned in the introduction, the use of the internet entails energy costs, which may not be directly visible, but may seem non-existent. The energy generated by its interconnections and infrastructures has an impact on the environment [75]. However, the reduction in other types of materials can be a benefit for reducing emissions [76,77,78]. All the data provided above also support the above. Thus, using online tools, carbon emissions from travel and materials such as paper and stationery can be reduced, reducing the amount of tree felling and emissions from paper mills. In this way, psychology and research could move towards more efficient, environmentally friendly, and renewable technological models. However, it is also necessary to continue developing the energy management of infrastructures, the use of the internet, and the storage of information to reduce carbon footprint [77,78].
Regarding the limitations of the study, some issues should be considered. On the one hand, the study seeks to offer a general perspective, so the results offered do not include all the questionnaires created online, but only a small sample of some of them. On the other hand, it should be borne in mind that the results do not show a completely heterogeneous comparison and that there are variables that may affect the results, so it shows a limited applicability of the results. Thus, the samples of the studies compared do not share the same geographic and demographic characteristics, as they were not originally conducted for the purpose of comparison. However, these limitations allow us to establish lines of research focused on improving them and on controlling variables not involved in the studies. In this sense, it would be of interest to continue to develop this line of research, in which future research staff could compare, in homogeneous samples and under greater control of variables, the completion of a paper questionnaire and the same in its online version.

5. Conclusions

In conclusion, this study shows the capabilities of online assessment tools in four key areas. First, it results in an enhanced sample collection efficiency, enabling a broader reach and reducing implementation time. Secondly, it suggests a potential improvement in reliability due to the reduction in social desirability, although further investigation is warranted using diverse methodologies. Thirdly, a paradigm shift is evident due to the current surge in internet and online tool usage, mitigating one of the drawbacks related to the digital divide. Lastly, the reduction in factors such as extensive paper use or travel highlights the significance of employing these tools in the context of sustainability. This study may set the stage for future research directions aimed at enhancing efficiency, effectiveness, and sustainability in psychosocial research.

Author Contributions

Conceptualization, N.P.-R. and C.S.-G.; methodology, V.M.-S.; investigation, A.H.-M. and R.E.R.; data curation, N.P.-R. and C.S.-G.; writing—original draft preparation, N.P.-R. and C.S.-G.; writing—review and editing, A.H.-M., R.E.R. and J.L.P.-B.; visualization, V.M.-S., C.F. and J.L.P.-B.; supervision, A.H.-M., R.E.R. and C.F. All authors have read and agreed to the published version of the manuscript.

Funding

This research received no external funding.

Institutional Review Board Statement

Not applicable.

Informed Consent Statement

Not applicable.

Data Availability Statement

No new data were created or analyzed in this study. Data sharing is not applicable to this article.

Conflicts of Interest

The authors declare no conflict of interest.

References

  1. Aya Cardozo, A.T. El Papel Que Ejercen las Nuevas Tecnologías de la Información y la Comunicación en las Relaciones Interpersonales; Universidad Nacional Abierta y A Distancia: Yopal, Colombia, 2014. [Google Scholar]
  2. Loveless, A.; Williamson, B. Nuevas Indentidades de Aprendizaje en la Era Digital. Creatividad. Educación. Tecnología. Sociedad; Ministerio de Educación: Madrid, Spain, 2017. [Google Scholar]
  3. Botella, C.; Rivera, R.M.B.; Palacios, A.G.; Quero, S.; Guillén, V.; Marco, H.J. La utilización de las nuevas tecnologías de la información y la comunicación en psicología clínica. UOC Pap. 2007, 32–41. [Google Scholar]
  4. De Oca Rojas, Y.M.; Cabeza, S.N.C.; Bastidas, C.I.B. Metodología de investigación en emprendimiento: Una estrategia para la producción científica de docentes universitarios. Rev. Cienc. Soc. Ve 2022, 18, 381–390. [Google Scholar]
  5. Moral Sánchez, S.N. TECGAFLIP: Investigación en Didáctica de la Geometría con Nuevas Tecnologías, Gamificación y Flipped Learning en Educación Secundaria. Ph.D. Dissertation, Universidad de Almería, Almería, Spain, 2023. [Google Scholar]
  6. Andrade, I.P. Revisión sobre el uso de las TIC’ S en la Ciencia. Rev. Latinoam. Educ. Cienc. Crit. Emancip. 2022, 1, 1–18. [Google Scholar]
  7. Fernández-Echeverría, C.; González-Silva, J.; Mesquita, I.; Conejero, M.; Moreno, M.P. Elaboración de una herramienta tecnológica para la optimización del proceso de entrenamiento en voleibol de alto nivel. In Aplicaciones de Intervención en Actividad Física Adaptada; Dykinson: Madrid, Spain, 2019; pp. 207–216. [Google Scholar]
  8. Guirval, F.G. Validación de un Protocolo de Entrenamiento de la Atención en el Deporte. Ph.D. Thesis, Universidad de Málaga, Málaga, Spain, 2021. [Google Scholar]
  9. Reigal, R.E.; Pastrana-Brincones, J.L.; González-Ruiz, S.L.; Hernández-Mendo, A.; Morillo-Baro, J.P.; Morales-Sánchez, V. Use of data mining to determine usage patterns of an online evaluation platform during the COVID-19 pandemic. Front. Psychol. 2020, 11, 2579. [Google Scholar] [CrossRef] [PubMed]
  10. Vela Santos, C.A. Mejora de los Procesos de Comercio Electrónico y el Uso de las Nuevas Tecnologías; Editoriales Independientes del Perú: Lima, Perú, 2021. [Google Scholar]
  11. Vinck, D. Humanidades Digitales: La Cultura Frente a las Nuevas Tecnologías; Editorial Gedisa: Barcelona, Spain, 2018; Volume 138. [Google Scholar]
  12. De León, H.G. Investigacion y análisis psicosocial de las tecnologías de la información y las comunicaciones. Redepsic 2023, 2, 10–39. [Google Scholar]
  13. López-Golán, M.; Costa-Sánchez, C.; Puentes-Rivera, I. Educación superior en comunicación audiovisual: Desafíos de la virtualidad en tiempos de COVID-19. Int. J. Commun. Res. 2022, 27, e197. [Google Scholar] [CrossRef]
  14. Cruz, N.E. Redes Sociales Educativas Como Herramienta Interactiva y Eficaz Del Aprendizaje. Bachelor’s Thesis, Universidad Siglo 21, Cordoba, Argentina, 2022. [Google Scholar]
  15. Chacón, E. El uso del ATLAS/TI Como Herramienta Para el Análisis de Datos Cualitativos en Investigaciones Educativas; Primeras Jornadas Universitarias: Madrid, Spain, 2004. [Google Scholar]
  16. Gonzales Yep, M.C. Eficacia del uso de Herramientas Informáticas Básicas en el Aprendizaje Significativo de Estudiantes del Programa de Estudios Básicos de la Universidad Ricardo Palma en el año 2014. Master’s Thesis, Universidad de San Martín de Porres, Santa Anita, Peru, 2015. [Google Scholar]
  17. Novoa Pazmiño, L.G. Uso de Tablet Como Herramienta Informática en el Aprendizaje de Matemáticas y Razonamiento Lógico, Para Mejorar la Comprensión del Programa de Excel, Utilizando el Aula Invertida, Para la Educación Superior, 2014. Master’s Thesis, Instituto Tecnológico y de Estudios Superiores de Monterrey, Monterrey, Mexico, 2014. [Google Scholar]
  18. Pazmiño, A.M.L.; Vinueza, A.P.A. Incidencia del trabajo colaborativo mediante la herramienta informática Google Drive, en el desarrollo de la expresión escrita del idioma inglés. Recimundo 2018, 2, 114–138. [Google Scholar]
  19. González-Ruiz, S.L.; Dominguez-Alfonso, R.; Chica-Merino, E.; Pastrana-Brincones, J.L.; Hernández-Mendo, A. Una plataforma virtual para la evaluación e investigación on-line: Menpas. Cuad. Psicol. Deporte 2018, 18, 26–48. [Google Scholar]
  20. Sánchez-García, C.; Pérez-Romero, N.; Quiñones-Rodríguez, Y.; Gónzalez-Ruiz, S.L.; Pastrana-Brincones, J.L.; Enríquez-Molina, R.; Rabaneda, J.A.G.; Sànchez-Izquierdo, M.; Reigal, R.E.; Morales-Sánchez, V. MenPas 1.0: Plataforma online de evaluación psicosocial. Apunt. Psicol. 2023, 41, 5–10. [Google Scholar] [CrossRef]
  21. Reis, H.T.; Gosling, S.D. Social psychological methods outside the laboratory. In Handbook of Social Psychology, 5th ed.; John Wiley & Sons, Inc.: Hoboken, NJ, USA, 2010; Volume 1, pp. 82–114. [Google Scholar] [CrossRef]
  22. Albornoz, M.; Barrere, R. Integración de la ciencia y la tecnología en el MERCOSUR. Integr. Conoc. Rev. Núcleo Estud. Investig. Educ. Super. 2022, 11, 7–23. [Google Scholar]
  23. Santamaría, P.; Sánchez-Sánchez, F. Cuestiones abiertas en el uso de las nuevas tecnologías en la evaluación psicológica. Papeles Psicol. 2022, 43, 48–54. [Google Scholar] [CrossRef]
  24. Cisneros-Caicedo, A.J.; Guevara-García, A.F.; Urdánigo-Cedeño, J.J.; Garcés-Bravo, J.E. Técnicas e Instrumentos para la Recolección de Datos que apoyan a la Investigación Científica en tiempo de Pandemia. Domino Cienc. 2022, 8, 1165–1185. [Google Scholar] [CrossRef]
  25. López, M.S.; López, M.V. Sistema de información para el programa de actualización y formación docente. Concienc. Tecnol. 2008, 36, 72–77. [Google Scholar]
  26. Krantz, J.H.; Dalal, R. Validity of Web-based psychological research. In Psychological Experiments on the Internet; Elsevier: Amsterdam, The Netherlands, 2000; pp. 35–60. [Google Scholar] [CrossRef]
  27. Louzán Mariño, R. Mejorar la calidad de las evaluaciones de riesgos psicosociales mediante el control de sesgos. Arch. Prev. Riesgos Labor. 2020, 23, 68–81. [Google Scholar] [CrossRef] [PubMed]
  28. Burgess, G. El impacto de la pandemia sobre la fractura digital. Anu. Int. CIDOB 2022, 1, 222–224. [Google Scholar]
  29. Cedeño García, G.C.; Pazmiño Remache, C.G. Las Nuevas Tecnologías y las Redes Sociales: El Peligro de la Inmediatez y la Creación de Páginas Fake News; Universidad de Guayaquil, Facultad de Comunicación Social: Guayaquil, Ecuador, 2021. [Google Scholar]
  30. Baltar, F.; Gorjup, M.T. Muestreo mixto online: Una aplicación en poblaciones ocultas. Intang. Cap. 2012, 8, 123–149. [Google Scholar] [CrossRef]
  31. González Ruiz, S.L. Evaluación y Baremación de Variables Psicosociales a Través de Una Plataforma On-Line. Ph.D. Thesis, RIUMA—Repositorio Institucional de la Universidad de Málaga, Málaga, Spain, 2015. [Google Scholar]
  32. González-Ruiz, S.L.; Gómez-Gallego, I.; Pastrana-Brincones, J.L.; Hernández-Mendo, A. Algoritmos de clasificación y redes neuronales en la observación automatizada de registros. Cuad. Psicol. Deporte 2015, 15, 31–40. [Google Scholar] [CrossRef]
  33. Henríquez, G. El uso de herramientas de internet en la investigación social. Cinta Moebio 2002, 74–85. [Google Scholar]
  34. The Climate Group on behalf of the Global eSustainability Initiative (GeSI). SMART 2020: Enabling the Low Carbon Economy in the Information Age. 2008. Available online: https://gesi.org/research/smart-2020-enabling-the-low-carbon-economy-in-the-information-age (accessed on 23 February 2023).
  35. Dirección General de Calidad y Evaluación Ambiental, Ministerio para la Transición Ecológica y el Reto Demográfico. Inventario Nacional de Emisiones a la Atmósfera, Emisiones de Gases de Efecto Invernadero, Serie 1990–2020. 2022. Available online: https://www.miteco.gob.es/es/calidad-y-evaluacion-ambiental/temas/sistema-espanol-de-inventario-sei-/resumen_inventario_gei-ed_2022_tcm30-534394.pdf (accessed on 23 February 2023).
  36. Rautner, M.; Leggett, M.; Davis, F. El Pequeño Libro de las Grandes Causas de la Deforestación; Programa Global Canopy: Oxford, UK, 2013. [Google Scholar]
  37. ONU. Proyecto de Resolución Presentado por la Presidencia de la Asamblea General. Declaración Política Del Foro Político de Alto Nivel Sobre el Desarrollo Sostenible Celebrado Bajo los Auspicios de la Asamblea General. 2019. Available online: https://undocs.org/es/A/HLPF/2019/l.1 (accessed on 23 February 2023).
  38. Franquelo, M.A.; Monteiro, D.; Tomás-Marco, I.; Capafons, A.; Hernández-Mendo, A. Psychometric properties of the Valencia Scale of Attitudes and Beliefs towards Hypnosis (client version) (VSABTH-C) online version. Curr. Psychol. 2020, 55, 3205–3215. [Google Scholar] [CrossRef]
  39. Franquelo, M.A.; Tomás, I.; Capafons, A.; Hernández-Mendo, A. Psychometric Properties of the Valencia Scale of Attitudes and Beliefs towards Hypnosis (Therapist Version) (VSABTH-T) Online Version. Qual. Quant. 2021, 55, 203–219. [Google Scholar] [CrossRef]
  40. González-Guirval, F.; Reigal, R.E.; Morillo-Baro, J.P.; Juárez-Ruiz de Mier, R.; Hernández-Mendo, A.; Morales-Sánchez, V. Análisis de la validez convergente de un instrumento informatizado para evaluar la atención en deportistas: Rejilla 1.0. Cuad. Psicol. Deporte 2020, 20, 83–94. [Google Scholar] [CrossRef]
  41. Morales-Sánchez, V.; Pérez-Romero, N.; Franquelo, M.A.; Balaguer, I.; Hernández-Mendo, A.; Reigal, R.E. Task and Ego Orientation in Sport Questionnaire (TEOSQ): Psychometric Properties in Its Digital Version. Int. J. Environ. Res. Public Health 2022, 19, 3251. [Google Scholar] [CrossRef] [PubMed]
  42. Pérez-Romero, N.; Reigal, R.E.; Franquelo, M.A.; Monteiro, D.; Castillo, I.; Hernández-Mendo, A.; Morales-Sánchez, V. Testing Psychometric Properties and Measurement Invariance of Basic Psychological Needs in the Digital Version of the Sport Scale. Sustainability 2022, 14, 12126. [Google Scholar] [CrossRef]
  43. Pérez-Romero, N.; Reigal, R.E.; Franquelo, M.A.; Balaguer, I.; Falcó, C.; Hernández-Mendo, A.; Morales-Sánchez, V. Testing psychometric properties and measurement invariance of Perceived Motivational Climate in Sport Questionnaire (PMCSQ-2): Online assessment. Sustainability 2022, 14, 14891. [Google Scholar] [CrossRef]
  44. Hernández Mendo, A.; Ramos, R. Aplicación informática para evaluación y entrenamiento de la atención en psicología del deporte. Psicothema 1995, 7, 527–529. [Google Scholar]
  45. Hernández Mendo, A.; Ramos, R. Informatización de la evaluación y entrenamiento de la atención. An. Psicol. 1995, 11, 183–191. [Google Scholar]
  46. Guillén, V.; Alberola, E.G.; Cortell, M. Debate: Reflexiones acerca de la utilización de las Tecnologías de la Información y la Comunicación (TICs) en Psicología Clínica: Eficacia, ventajas, peligros y líneas futuras de investigación. Inf. Psicol. 2018, 116, 121–132. [Google Scholar]
  47. Harris, D.V.; Harris, B.L. Psicología del Deporte: Integración Mente Cuerpo; Hispano Europea: Barcelona, Spain, 1987. [Google Scholar]
  48. Slack, H.; Priestley, M. Online learning and assessment during the COVID-19 pandemic: Exploring the impact on undergraduate student well-being. Assess. Eval. High. Educ. 2023, 48, 333–349. [Google Scholar] [CrossRef]
  49. Ho, H.C.; Poon, K.T.; Chan, K.K.S.; Cheung, S.K.; Datu, J.A.D.; Tse, C.Y.A. Promoting preservice teachers’ psychological and pedagogical competencies for online learning and teaching: The TEACH program. Comp. Educ. 2023, 195, 104725. [Google Scholar] [CrossRef]
  50. Riva, G.; Teruzzi, T.; Anolli, L. The Use of the Internet in Psychological Research: Comparison of Online and Offline Questionnaires. CyberPsychol. Behav. 2003, 6, 73–80. [Google Scholar] [CrossRef]
  51. Buchanan, T. Online assessment: Desirable or dangerous? Prof. Psychol. Res. Pr. 2002, 33, 148–154. [Google Scholar] [CrossRef]
  52. Skinner, H.A.; Pakula, A. Challenge of computers in psychological assessment. Prof. Psychol. Res. Pr. 1986, 17, 44–50. [Google Scholar] [CrossRef]
  53. Kakul, F.; Javed, S. Internet gaming disorder: An interplay of cognitive psychopathology. Asian J. Soc. Health Behav. 2023, 6, 36. [Google Scholar]
  54. Kuruveettissery, S.; Gupta, S.; Rajan, S.K. Development and psychometric validation of the three dimensional grit scale. Curr. Psychol. 2023, 42, 5280–5289. [Google Scholar] [CrossRef]
  55. Grant, M.J.; Booth, A. A typology of reviews: An analysis of 14 review types and associated methodologies. Health Inf. Libr. J. 2009, 26, 91–108. [Google Scholar] [CrossRef] [PubMed]
  56. Duda, J.L. Task and Ego Orientation in Sport Questionnaire. Contemp. Educ. Psychol. 1989, 10, 21–22. [Google Scholar] [CrossRef]
  57. Balaguer, I.; Castillo, I.; Tomás, I. Análisis de las propiedades psicométricas del Cuestionario de Orientación al Ego y a la Tarea en el Deporte (TEOSQ) en su traducción al castellano. Psicológica 1996, 17, 71–81. [Google Scholar]
  58. Wilson, P.M.; Rogers, W.T.; Rodgers, W.M.; Wild, T.C. The Psychological Need Satisfaction in Exercise Scale. J. Sport Exerc. Psychol. 2006, 28, 231–251. [Google Scholar] [CrossRef]
  59. Moreno-Murcia, J.A.; Marzo, J.C.; Martínez-Galindo, C.; Conte, L. Validación de la Escala de “Satisfacción de las Necesidades Psicológicas Básicas” y del Cuestionario de la “Regulación Conductual en el Deporte” al contexto español. Rev. Int. Cienc. Deporte 2011, 7, 355–369. [Google Scholar] [CrossRef]
  60. Balaguer, I.; Guivernau, M.; Duda, J.L.; Crespo, M. Análisis de la Validez de Constructo y de la Validez Predictiva el Cuestionario de Clima Motivacional Percibido en el Deporte (PMCSQ-2) con Tenistas Españoles de Competición. Rev. Psicol. Deporte 1997, 6, 41–58. [Google Scholar]
  61. Newton, M.; Duda, J.L.; Yin, Z. Examination of the psychometric properties of the Perceived Motivational Climate in Sport Questionnaire-2 in a sample of female athletes. J. Sports Sci. 2000, 18, 275–290. [Google Scholar] [CrossRef] [PubMed]
  62. Carvalho, C.; Capafons, A.; Kirsch, I.; Espejo, B.; Mazzoni, G.; Leal, I. Factorial analysis and psychometric properties of the revised Valencia Scale of attitudes and beliefs towards hypnosis—Client version. Contemp. Hypn. 2007, 24, 76–85. [Google Scholar] [CrossRef]
  63. Capafons, A.; Espejo, B.; Mendoza, M.E. Confirmatory factor analysis of the Valencia scale on attitudes and beliefs toward hypnosis, therapist version. Int. J. Clin. Exp. Hypn. 2008, 56, 281–294. [Google Scholar] [CrossRef] [PubMed]
  64. Capafons, A.; Suárez-Rodríguez, J.M.; Selma, M.L. Análisis factorial confirmatorio de la escala valencia de actitudes y creencias hacia la hipnosis (versión cliente revisada) en una muestra española. An. Psicol. Ann. Psychol. 2015, 31, 84–95. [Google Scholar] [CrossRef]
  65. Instituto Nacional de Estadística. Encuesta Sobre Equipamiento y uso de Tecnologías de Información y Comunicación en los Hogares; Instituto Nacional de Estadística: Madrid, Spain, 2022; Available online: https://www.ine.es/dyngs/INEbase/es/operacion.htm?c=estadistica_C&cid=1254736176741&menu=ultiDatos&idp=1254735976608 (accessed on 23 February 2023).
  66. Wu, M.J.; Zhao, K.; Fils-Aime, F. Response rates of online surveys in published research: A meta-analysis. Comp. Hum. Behav. Rep. 2022, 7, 100206. [Google Scholar] [CrossRef]
  67. Reigal, R.E.; González-Guirval, F.; Pastrana-Brincones, J.L.; González-Ruiz, S.; Hernández-Mendo, A.; Morales-Sánchez, V. Analysis of reliability and generalizability of one instrument for assessing visual attention span: MenPas mondrian color. Sustainability 2020, 12, 7655. [Google Scholar] [CrossRef]
  68. Hernández Mendo, A.; López López, J.A.; Castellano Paulis, J.; Morales Sánchez, V.; Pastrana Brincones, J.L. Hoisan 1.2: Programa informático para uso en metodología observacional. Cuad. Psicol. Deporte 2012, 12, 55–78. [Google Scholar]
  69. Hernández Mendo, A.; Castellano, J.; Oleguer Camerino, O.; Jonsson, G.; Blanco Villaseñor, Á.; Lopes, A.; Anguera Argilaga, M.T. Programas informáticos de registro, control de calidad del dato, y análisis de datos. Rev. Psicol. Deporte 2014, 23, 0111–0121. [Google Scholar]
  70. Hernández-Mendo, A.; Blanco-Villaseñor, Á.; Pastrana, J.L.; Morales-Sánchez, V.; Ramos-Pérez, F.J. SAGT: Aplicación informática para análisis de generalizabilidad. Rev. Iberoam. Psicol. Ejerc. Deporte 2016, 11, 77–89. [Google Scholar]
  71. Hair, J.F.; Black, W.C.; Babin, B.J.; Anderson, R.E. Multivariate Data Analysis, 8th ed.; Cengage, Learning EMEA: Farmington Hills, MI, USA, 2019. [Google Scholar]
  72. Jöreskog, K.G. Simultaneous Factor Analysis in Several Populations. Psychometrika 1971, 36, 409–426. [Google Scholar] [CrossRef]
  73. Chan, C.A.; Gygax, A.F.; Leckie, C.; Wong, E.; Nirmalathas, A.; Hinton, K. Telecommunications energy and greenhouse gas emissions management for future network growth. Appl. Energy 2016, 166, 174–185. [Google Scholar] [CrossRef]
  74. Łaszewska, A.; Helter, T.; Simon, J. Perceptions of COVID-19 lockdowns and related public health measures in Austria: A longitudinal online survey. BMC Public Health 2021, 21, 1502. [Google Scholar] [CrossRef] [PubMed]
  75. Masanet, E.; Shehabi, A.; Koomey, J. Characteristics of low-carbon data centres. Nat. Clim. Chang. 2013, 3, 627–630. [Google Scholar] [CrossRef]
  76. Erdmann, L.; Hilty, L. Scenario analysis: Exploring the macroeconomic impacts of information and communication technologies on greenhouse gas emissions. J. Ind. Ecol. 2010, 14, 826–843. [Google Scholar] [CrossRef]
  77. Haldar, A.; Sethi, N. Environmental effects of Information and Communication Technology—Exploring the roles of renewable energy, innovation, trade and financial development. Renew. Sustain. Energy Rev. 2022, 153, 111754. [Google Scholar] [CrossRef]
  78. Castañeda Olvera, D.R. La nube contaminante. Un análisis socioambiental de la huella de carbono digital. PAAKAT 2022, 22. [Google Scholar] [CrossRef]
Figure 1. Increase in the percentage of households with internet access. Based on Table 3, whose information was collected through the National Institute of Statistics.
Sustainability 15 15908 g001
Figure 2. Comparison of the percentage of internet access in housing, use by the general population and the population aged 65–74 years. Based on Table 3, whose information was collected through the National Institute of Statistics.
Sustainability 15 15908 g002
Figure 3. Comparison of the percentage of people using the internet by level of education. Based on Table 4, whose information was collected through the National Institute of Statistics. Yellow: Higher Education; grey: Second Stage Secondary Education; orange: Primary Education; blue: Illiterate and Primary Education.
Sustainability 15 15908 g003
Table 1. Characteristics of studies and comparison of sample size in online and previous paper-and-pencil questionnaires.
StudyVersionNSample ConditionGender (W/M)Age
Morales-Sánchez et al. [41]Online2320Team and individual1355/965M = 25.27, SD = 7.39
Duda [56]Paper and pencil321High school athletes1214/1259M = 15.4, SD = 1.41
Balaguer et al. [57]Paper and pencil283Not reported137/14611–17 years old
Pérez-Romero et al. [42]Online1050Team and individual694/356M = 23.82, SD = 5.75
Wilson et al. [58] 1st StudyPaper and pencil426Physical activity170/122M = 20.59, SD = 3.02; M = 21.38, SD = 2.89
Wilson et al. [58] 2nd StudyPaper and pencil581Physical activity358/223M = 21.55, SD = 3.87; M = 22.03, SD = 4.16
Moreno-Murcia et al. [59]Paper and pencil298Team and individual79/219M = 14, SD = 1.79
Pérez-Romero et al. [43]Online1637Team and individual619/1018M = 24.39, SD = 6.51
Balaguer et al. [60]Paper and pencil219Tennis76/138M = 15.55, SD = 1.89
Newton et al. [61] 1st StudyPaper and pencil201Volleyball and basketball201/0M = 16.4, SD = 2.2
Newton et al. [61] 2nd StudyPaper and pencil385Volleyball385/0M = 15.2, SD = 1.7
Franquelo et al. [38]Online705Fourth-grade students in psychology degree463/242M = 22.73, SD = 5.78
Carvalho et al. [62]Paper and pencil1678Students1304/672M = 25.25, SD = 9.23
Capafons et al. [63]Paper and pencil444Students341/96M = 21.38, SD = 4.96
Franquelo et al. [39]Online154Fourth-grade students in psychology degree111/43M = 22.41, SD = 4.81
Capafons et al. [63]Paper and pencil787Licensed psychologists622/165M = 35.69, SD = 9.23
Table 2. Comparison of the possible economic costs of face-to-face versus online version.
MaterialPaper and PencilOnline
N (number of studies)5623 users (11 studies)5866 users (5 studies)
Papers11732 (sociodemographic data and questionnaires)Not required
Web maintenanceNot requiredMonthly maintenance even before the beginning of the investigation
Office suppliesPens, pencils, erasers...Electronic device
MovementsNecessary and dependent on the place of evaluation and datesNot required
Table 3. Comparison of reliability in online questionnaires and pre paper and pencil questionnaires.
StudyVersionData AnalysisReliability
TEOSQ
Morales-Sánchez et al. [41]OnlineComposite reliabilityTask 0.86 */Ego 0.86
Duda [56]Paper and pencilCronbach’s AlphaTask 0.82/Ego 0.89 *
Balaguer et al. [57]Paper and pencilCronbach’s AlphaTask 0.78/Ego 0.80
PNSE
Pérez-Romero et al. [42]OnlineComposite reliabilityCompetence 0.94 */Autonomy 0.89/Relatedness 0.81
Wilson et al. [58] 1st studyPaper and pencilCronbach’s AlphaCompetence a 0.91/Autonomy 0.91 */Relatedness 0.90 *
Wilson et al. [58] 2nd studyPaper and pencilCronbach’s AlphaCompetence 0.91/Autonomy 0.91 */Relatedness 0.82
Moreno-Murcia et al. [59]Paper and pencilCronbach’s AlphaCompetence 0.80/Autonomy 0.69/Relatedness 0.73
PMCSQ-2
Pérez-Romero et al. [43]OnlineComposite reliabilityTask 0.88 */Ego 0.95 *
Balaguer et al. [60]Paper and pencilCronbach’s AlphaTask 0.80/Ego 0.80
Newton et al. [61] 1st studyPaper and pencilCronbach’s AlphaTask 0.87/Ego 0.89
Newton et al. [61] 2nd studyPaper and pencilCronbach’s AlphaTask 0.88 */Ego 0.87
VSABTH-C
Franquelo et al. [38]OnlineComposite reliabilityFear 0.88 */Memory 0.76 */Help 0.91 */Control 0.81 */Collaboration 0.77 */Interest 0.90 */Magic 0.69/Marginal 0.71 *
Capafons et al. [64]Paper and pencilCronbach’s AlphaFear 0.79/Memory 0.67/Help 0.82/Control 0.76/Collaboration 0.63/Interest 0.88/Magic 0.58/Marginal 0.50
Carvalho et al. [62]Paper and pencilCronbach’s AlphaFear 0.81/Memory 0.71/Help 0.88/Control 0.80/Collaboration 0.57/Interest 0.85/Magic 0.71 */Marginal 0.63
VSABTH-T
Franquelo et al. [39]OnlineComposite reliabilityFear 0.85 */Memory 0.72/ Help 0.92 */ Control 0.89 */Collaboration 0.88 */Interest 0.88/Magic 0.76/Marginal 0.62
Capafons et al. [63]Paper and pencilComposite reliabilityFear 0.82/Memory 0.85 */Help 0.92 */Control 0.84/Collaboration 0.86/Interest 0.95 */Magic 0.86 */Marginal 0.86 *
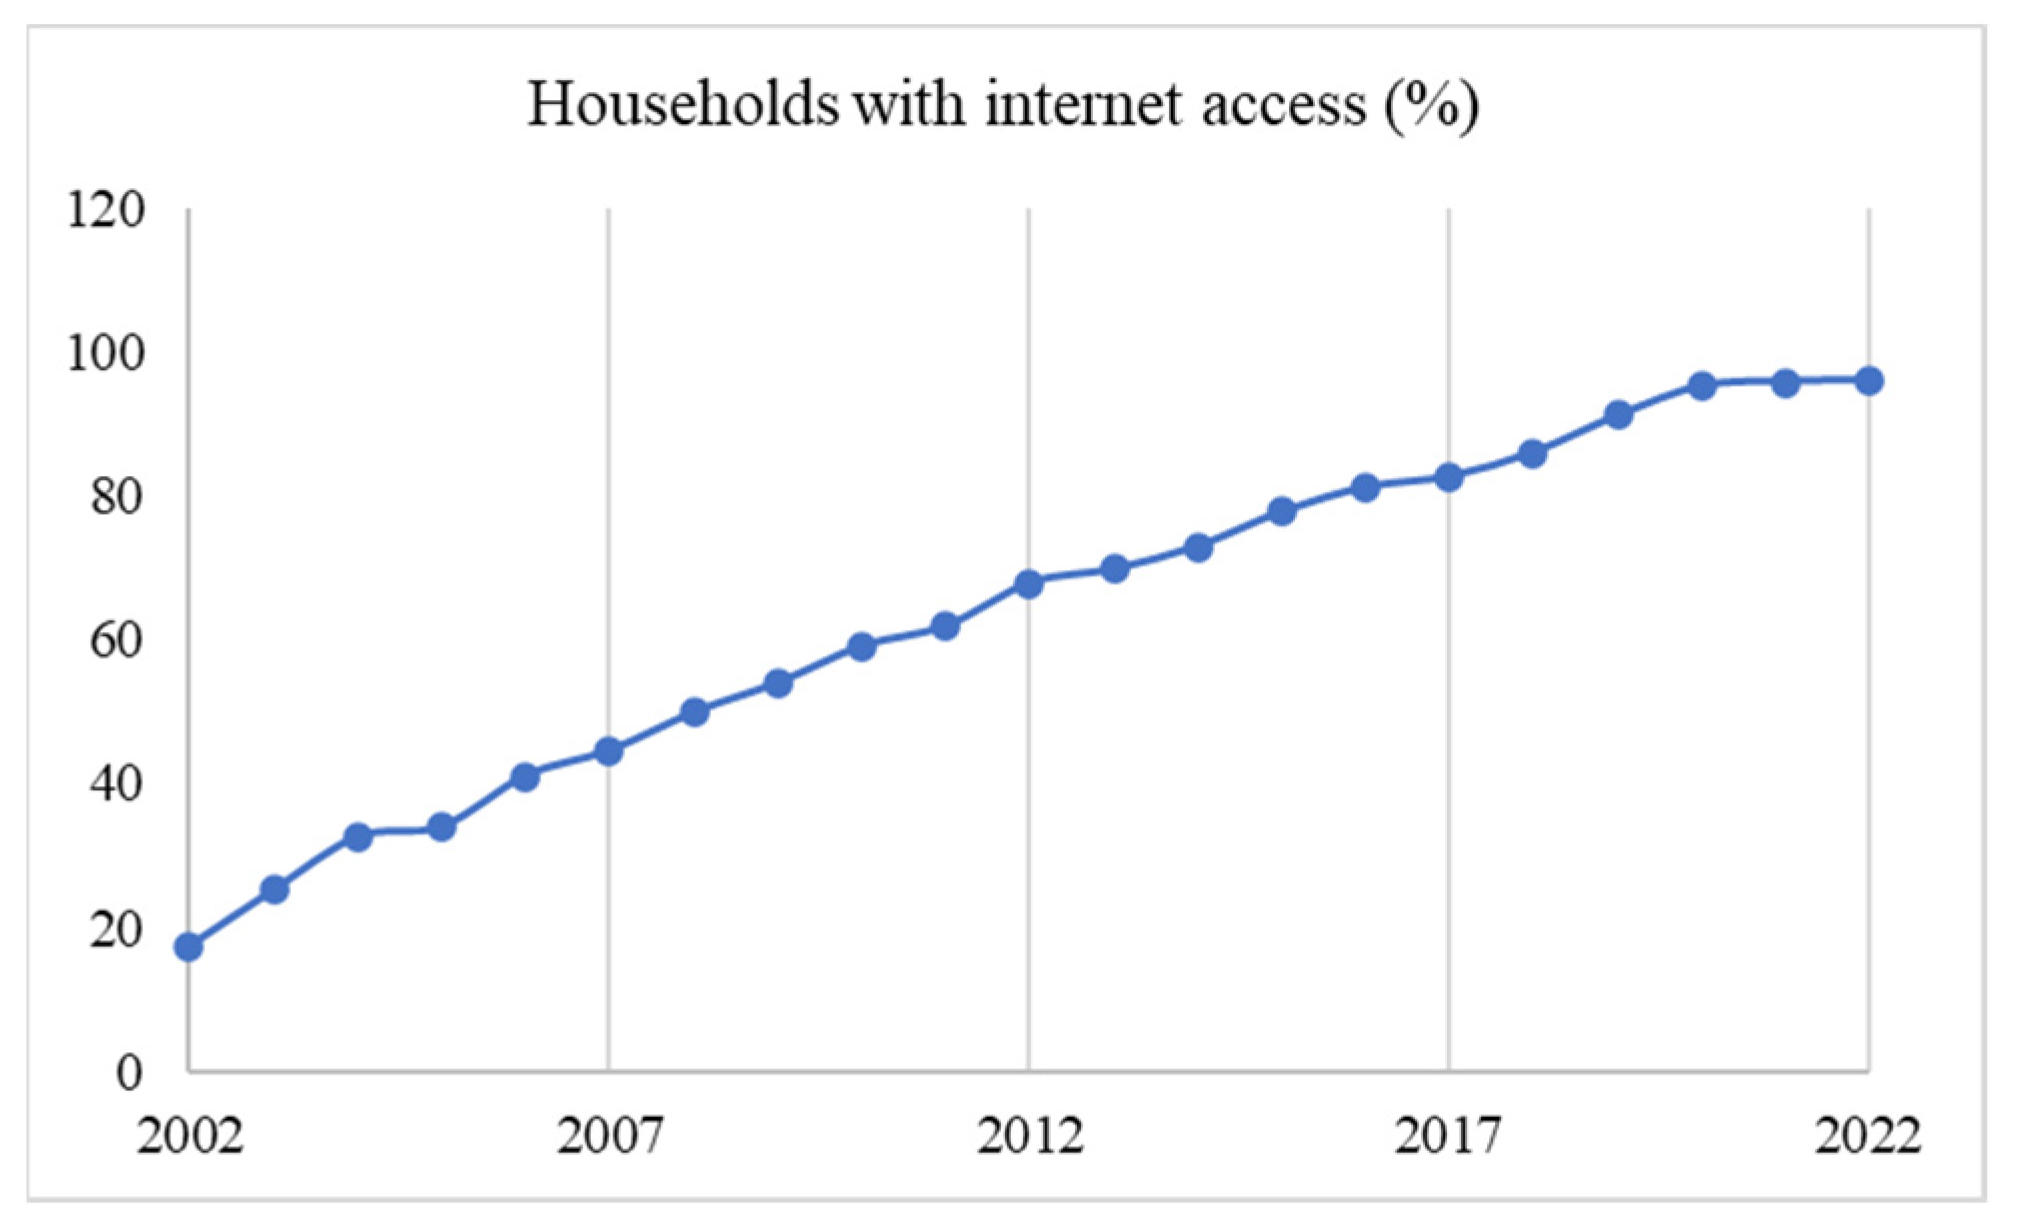
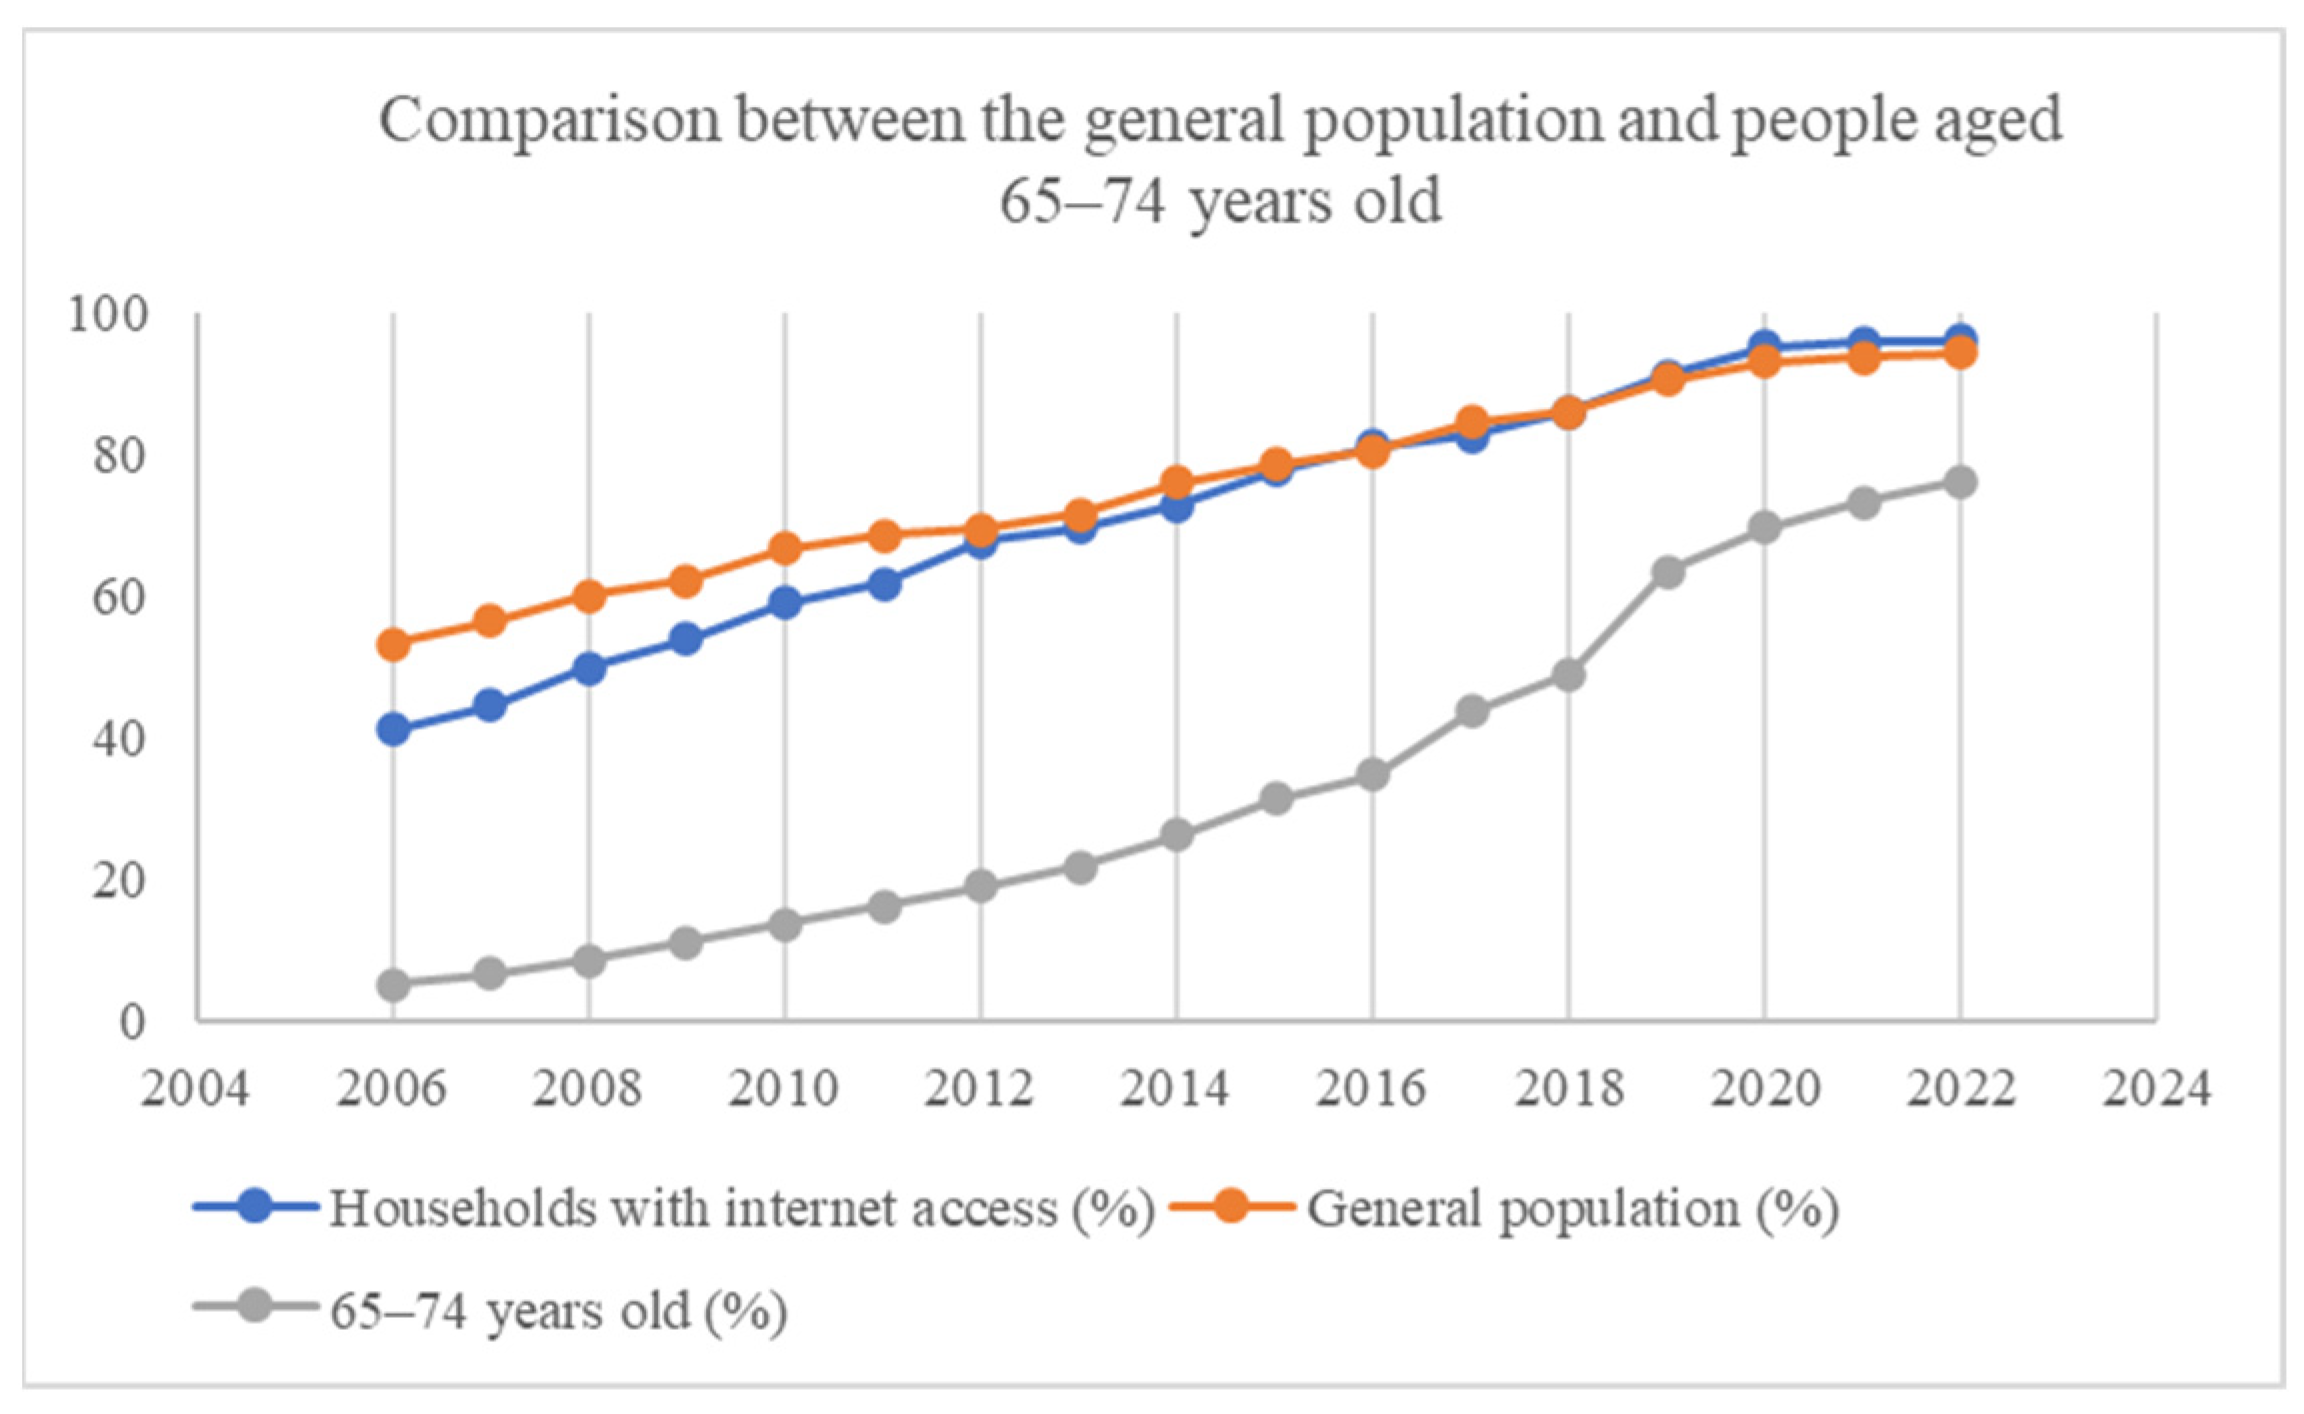
* Higher score indices.
Table 4. Percentage of internet access and use by year and age.
YearHouseholds with Internet AccessGeneral Population (%)Persons Aged 65–74 (%)General Difference and Persons 65–75 Years (%)Persons over 74 Years (%)
202296.1094.5076.4018.1035.90
202195.9093.9073.3020.6031.80
202095.3093.2069.7023.5027.90
201991.2090.7063.6027.1023.40
201886.1086.1049.1037.00-
201782.7084.6043.7040.90-
201681.2080.6034.7045.90-
201577.8078.7031.3047.40-
201473.0076.2026.2050.00-
201369.8071.6021.9049.70-
201267.9069.5019.0050.50-
201161.9068.7016.2052.50-
201059.1066.8013.8053.00-
200954.0062.3011.2051.10-
200849.9060.208.6051.60-
200744.6056.506.6049.90-
200641.1053.405.1048.30-
200534.00----
200432.60----
200325.20----
200217.40----
The information collected through the National Statistics Institute; - = value not reported.
Table 5. Percentage of internet access and use by level of education completed.
YearIlliterate and Primary Education (%)Primary Education (%)Second Stage Secondary Education (%)Higher Education (%)
202261.5077.4098.3099.40
202155.6076.6097.9099.40
202051.4076.0097.7099.40
201947.1067.6096.1098.70
201828.8053.1095.5098.70
201725.9052.0094.7098.70
201615.6040.8092.2097.80
201511.8038.1092.3098.10
201411.0037.7090.9097.70
20130.0025.3086.2096.40
20122.4024.7084.8094.30
20113.3028.4082.2094.40
20101.5022.1078.8094.00
20090.5017.6077.0091.40
20080.3014.2074.4090.90
20070.4011.5070.265.50
20060.0011.9088.5087.10
The information collected through the National Statistics Institute.
Disclaimer/Publisher’s Note: The statements, opinions and data contained in all publications are solely those of the individual author(s) and contributor(s) and not of MDPI and/or the editor(s). MDPI and/or the editor(s) disclaim responsibility for any injury to people or property resulting from any ideas, methods, instructions or products referred to in the content.

